nutrition and food security assessment in sri lanka -...
TRANSCRIPT

i
Nutrition and Food Security Assessment in Sri Lanka - 2009
JAFFNA DISTRICT
Dr. Renuka Jayatissa Dr. S.M. Moazzem Hossain
Medical Research Institute Sri Lanka
In collaboration with UNICEF and World Food Programme
September 2010

ii
LIST OF ABBREVIATIONS
ARI Acute Respiratory Infection BMI Body Mass Index DHS Demographic and Health Survey dl Deciliter ECCD Early Childhood Care and Development ECD Early Childhood Development FGD Focus Group Discussion GN Grama SevaNiladari GRS Growth Reference Standard HAZ Height-for-age Z score Hb Hemoglobin concentration IYCF Infant and Young Child Feeding LBW Low Birth Weight LRI Lower Respiratory Tract Infection MDG Millennium Development Goal MOH Medical Officer of Health MoHN Ministry of HealthCare and Nutrition MRI Medical Research Institute MUAC Mid Upper Arm Circumference NGO Non Government Organization ORS Oral Rehydration Solution PHI Public Health Inspector PHM Public Health Midwife RDHS Regional Director of Health Services SD Standard Deviation SL Sri Lanka UNICEF United Nations Children’s Fund URI Upper Respiratory Tract Infection WAZ Weight-for-age Z score WFP World Food Program WHO World Health Organization WHZ Weight-for-height Z score

iii
PREFACE
This nutrition and food security survey was carried out by the Department of Nutrition of the Medical Research Institute in collaboration with the UNICEF and the World Food Programme. This survey was focused on the maternal and child under-nutrition which remains a major public health problem in Sri Lanka, despite improvements in many health indicators. This kind of research study is more than timely to assess years of efforts taken by the government and other organizations to prevent and control undernutrition in vulnerable age groups and populations. For a population to be vibrant and work towards its progress, its constituent members have to be of sound health. Nutrition and food security plays a vital role in achieving this end. There is much room for improvements and a tremendous effort has to be made to uplift the prevailing nutritional status in the country. The nutritional status of the majority is below the satisfactory level specially among the poverty stricken people. It is a pity to see that most of them are not aware of how much nutrition contributes to the sound growth of an individual. Relationship of undernutrition to socio-economic and other factors may be used to prioritize communities to which resources should be allocated to improve the situation, and I fervently hope that the findings of this survey will be beneficial to the future policy makers in their effort to oust under nutrition and create a hale and hearty society. I appreciate the efforts taken by the staff of the medical research institute who has successfully conducted this study. I take this opportunity to thank every member of the households in which this assessment was conducted, who gave their unstinted cooperation. I am grateful to UNICEF for being interested in our welfare and investing on a very important venture of this nature. This survey will be very helpful to mitigate this problem and create a Sri Lanka free from undernutrition. Dr. Ravindra Ruberu Secretary Ministry of Health
iv
MESSAGE FROM UNICEF & WFP REPRESENTATIVES
The Food Security and Nutrition Survey is the first such survey in Sri Lanka to assess the nutrition situation across the country, the underlying causes of malnutrition and the related impact of the increase in global food prices. This detailed analysis of the relationship between food security and nutrition will be used to strengthen and monitor the impact of targeted interventions to mitigate malnutrition in Sri Lanka. The UN World Food Programme (WFP) and the United Nations Children’s Fund (UNICEF) are proud to be partners in this initiative. Effective joint nutrition interventions are required at all levels to achieve the first Millennium Development Goal (MDG) of halving the proportion of people who suffer from hunger and under-nutrition by 2015, and to contribute at the same time to achieving the MDGs related to child mortality, maternal health, primary education, gender equality, and HIV/AIDS. While Sri Lanka is largely on track to attaining most of the MDGs, significant challenges relating to poverty and child malnutrition remain including socio-economic and regional disparities, and the quality of public health care. While overall, with increasing wealth there has been a significant decline in the prevalence of stunting, wasting, underweight and anemia, this study reveals that there are still significant regional disparities affecting the nutritional status of the people of Sri Lanka. For example the prevalence of stunting and underweight was higher in rural areas such as the estate sector and Hambantota, while wasting was found to be higher in urban areas including Colombo. WFP and UNICEF have a 40 year long history in Sri Lanka in supporting programmes to reduce maternal and child malnutrition and micronutrient deficiencies. WFP and UNICEF will continue to work jointly to support the Government of Sri Lanka and all other relevant stakeholders to take the recommendations of this important study forward. Reza Hossaini Adnan Khan UNICEF Representative WFP Representative
v
ACKNOWLEDGEMENTS
Many people have contributed to the realisation of the study and it is our desire to express our deep gratitude to all, while it is, unfortunately, impossibly to name them all. We gratefully acknowledge the continued valuable and constructive advise provided by Dr. Athula Kahadaliyanage, Former Secretary, Ministry of Healthcare and Nutrition. We also deeply acknowledge the fruitful and motivating discussions and support from the members of the National Nutrition Steering Committee and many experts, especially during the final stage of the data analysis. Special thanks go to Mr.K.Dharmawardana, Accountant, National Health Fund and his staff for their patient assistance throughout the study. Many thanks go to Dr. Lulu Raschid, Director MRI for the support. Dr. Ayesha Lokubalasuriya, Dr. Neli Rajaratna from Family Health Bureau and Dr. Senaka Thalagala, RDHS Ampara for the support extended to conduct the pilot study. Director General Census and statistics for providing census data for sample selection and providing equipment. Deep gratitude goes to the UNICEF, particularly Mr. Phillipe Duamelle, Country Representative, UNICEF, Mrs. Desiree Jongsman (Deputy country Representatives), Dr. Indra Tudawe (Monitoring and Evaluation Specialist), Mr. Adnan Khan, Country Director, WFP, Mrs. Abbes Aziz (Deputy country representative,WFP), Giancarlor (Programme coordinator,WFP) for the motivation to start and complete the study, the support to conduct the field survey. Special thanks deserve the staff of the RDHS offices, staff of the MOH officers, the District Secretaries’ Offices and Gramaseva Niradari officers. They all worked tremendously hard to complete data collection to ensure accuracy. Even when circumstances were extremely difficult, they were never tired to carry on and their passionate contribution, personal and technical, was crucial to the completion of this survey. We deeply acknowledge the villagers’, the families’, the mothers’ and the children’s willingness and openness to cooperate with us. They, patiently, answered all questions and provided valuable insights. They showed great hospitality, staying with them was always a pleasure as well as a learning experience, and we are full of respect for the way they manage their daily life.
vi
RESEARCH TEAM
Principal investigator
Dr. Renuka Jayatissa - Consultant Medical Nutritionist, MRI Co-investigators Dr. C.L. Piyasena - Nutritionist Dr. S.M. Moazzem Hossaine - Chief Health and Nutrition, UNICEF
Collaborative Partners Dr. Dula De Silva - Programme officer, WFP Mr. Laksiri Nanayakkara - Programme Assistant, WFP Miss Analeena - Junior Programme officer, WFP International Advisors
Prof. Abbas Bhuiya - Senior Scientist & Head, IC DDR, Bangladesh Prof. Peter Kalestron - Child Health & Nutrition Unit, Belgium
Local Advisors and Report writing Prof. Dulitha Fernando - Prof. of Community Medicine Dr. Upul Senarath - Senior Lecturer, Faculty of Medicine
Survey Manager Mr. J.M. Ranbanda - Nutrition Assistant
Field Coordinators Dr. A.T.D. Dabare - Medical Officer Mr. T. Mahadeva - Food and Drug Inspector Survey Team Leaders
Mr. A.P. Senevirathne - Public Health Inspector Mr. P.V.N. Ravindra - Public Health Inspector Mr. E.G.S. Kulasinghe - Public Health Inspector Mr. W.A.P.I. Pieris - Public Health Inspector Mr. E.C. Paranagama - Public Health Inspector Mr. P.A.K.Y. Wijesundara - Public Health Inspector Mr. H.N.P. Caldera - Public Health Inspector
Field support Mr. S.P. Priyantha - Labourer Administrative support
Mrs. K.H.R. Shyamalee - Development Assistant Mrs. W.R.T.S. Perera - Development Assistant Miss H.I.K.N. Hevawitharana - Development Assistant Mrs. K.M.H.N. Kulathunga - Medical Laboratory Technologist Dr. Chaturangi Liyanarachchi - Pre-intern Medical Officer Dr. Nuwan Jayawardana - Pre-intern Medical Officer Dr. Supun de Silva - Pre-intern Medical Officer Mr. Piyadasa Gamage - Laboratory Ordely Mrs. P.P. Wimalamathie - Laboratory Ordely

vii
Data Analysis Mr. Sarath Gamage (Family Health Bureau), Mr. Abdullah-Al-Harun (Save the children, Bangladesh), Mr. Mokalus Rahuman (Bangledesh), Mr. Mohammed Sadeq (Bangladesh), Mr. Mohammed Rashid (Bangladesh) Mr. Indika Siriwardana Dr. Danushka Keerthiratne - Pre-intern Medical Officer
Enumerators K. Ainkaran, S. Anojithan, T. Theiventhiran, L.S. Pakirathan, R. Jeevananth, A. Kaneshamoorthy, P. Kiritharan, J. Kanakasundramswamy, P. Paramanathan, M. Nirothayan, N. Sivapuththiran, S. Kandasaamy, K. Kunaseelan, K. Velan, T. Thurairajah, S. Thusyanthan, M.L. Keethaponkalan, K. Theiventhiran, M. Suthagar, P. Parameswaran, S. Nathan, I. Purusoththaman, T. Sivapalan, T. Sunthareswaran
Data Entry Adeesha Hewawasam, Surangi Pitigala, Samanthi kumara, Harshani Randika, Dinesh Wijayarathna, D.K. Hemali Iresha
District support staff (Gramaniladari, Samurdi Officer, Public Health Inspector, Public Health Midwife) Thevarajah Mary Jarina, Priskilda Anthonipillai, Sinnarajha Rajitha, Anthonipillai Priyatharshini, Anton Konsiliya, Kanthasamy Prishanthy, Varnakulasingam Kajenthini, Thampimutthu Sarbana

viii
KEY FINDINGS OF THE SURVEY
Nutrition status of children: Among all children in the age group 0–59 months, 15.2 percent were stunted, 9.5 percent
wasted and 14.3 percent were underweight. 34.0 percent of children in the age group 6–59 months were anaemic. The prevalence of LBW of 16.6 percent.
Nutrition status of women: Among non-pregnant women aged between 15 to 49 years, 20.5 percent were
underweight, 15.5 percent were overweight and 6.4 percent were obese. Prevalence of anaemia among pregnant women was 14.8 percent. Among lactating
women, the prevalence was 35.1 and 35.3 percent among non-pregnant women. Childhood illness:
Among the total group, 22.2 percent reported to have had symptoms related to respiratory illness and 5.2 percent had diarrhoea during the specified period in the total sample.
Dietary intake: The percentage of children yet to achieve the target of dietary diversity was 66.4 which
decreased with increasing income categories and wealth quintiles. Caring:
42.7 percent of children under 24 months had been bottle fed. Of the children aged 36-59 months, 61.0 percent had attended an early childhood
educational programme. Health services and sanitation:
All children aged 36 months and over, only 70.8 percent had been given 3 mega doses of Vitamin A.
50.9 percent of the children who had diarrhoea or respiratory symptoms had obtained services from the government sector, 47.4 percent from the private sector and 1.8 percent from other sources.
Of all pregnant mothers, 89.5 percent received iron tablets of whom 72.2 percent took them daily while 69.6 percent received Thriposaha and 66.7 percent women had received “poshana malla”.
Only 73.6 percent of households used both improved water source and sanitary means of excreta disposal.
Food security The percentage of households yet to achieve the target of dietary diversity was 77.2
which do not show any consistent pattern with increasing income and wealth quintiles. 14.4 percent of the households in the poorest wealth quintile have not received any food
aids. 49.1 percent of households had taken loans within the preceding month and 53.3 percent
out of that used to purchase food. 23.3 percent of households were ‘food insecure’.
ix
TABLE OF CONTENTS
LIST OF ABBREVIATIONS ................................................................................................................ II
PREFACE ........................................................................................................................................... III
MESSAGE FROM UNICEF & WFP REPRESENTATIVES ........................................................... IV
ACKNOWLEDGEMENTS................................................................................................................... V
RESEARCH TEAM ............................................................................................................................ VI
KEY FINDINGS OF THE SURVEY ............................................................................................... VIII
TABLE OF CONTENTS .................................................................................................................... IX
LIST OF TABLES .............................................................................................................................. XI
LIST OF FIGURES.......................................................................................................................... XIII
1. METHODS ......................................................................................................................................... 3
1.1 SELECTION OF HOUSEHOLDS ............................................................................................................................. 3 1.2 COMPOSITION OF THE SURVEY TEAMS ................................................................................................................ 3 1.3 THE HOUSEHOLD SURVEY ................................................................................................................................. 3 1.4 SUPERVISION AND QUALITY ASSURANCE ............................................................................................................. 4 1.5 DATA PROCESSING AND ANALYSIS ..................................................................................................................... 4
2. RESULTS ........................................................................................................................................... 5
2.1 NUTRITIONAL STATUS ...................................................................................................................................... 5 2.1.1 Nutritional status of children................................................................................................... 5 2.1.2 Anaemia in children ................................................................................................................ 7 2.1.3 Birth weight ............................................................................................................................ 8
2.2 NUTRITIONAL STATUS OF WOMEN OF 15-49 YEARS .............................................................................................. 9 2.2.1 Non pregnant women (using Body Mass Index) ....................................................................... 9 2.2.2 Nutritional status of pregnant women (using Mid Upper Arm Circumference - MUAC) .......... 10 2.2.3 Anaemia in women ................................................................................................................ 10
2.3 CHILDHOOD ILLNESSES .................................................................................................................................. 12 2.3.1 Respiratory illness ................................................................................................................ 12 2.3.2 Diarrhoea ............................................................................................................................. 12
2.4 DIETARY INTAKE AND FEEDING PRACTICES ........................................................................................................ 12 2.4.1 Breastfeeding practices ......................................................................................................... 12 2.4.2 Complementary feeding and bottle-feeding practices ............................................................. 12 2.4.3 Food Consumption among children in the age group 6 – 59 months ...................................... 13 2.4.4 Dietary diversity ................................................................................................................... 13 2.4.5 Individual dietary diversity score for children aged 6-59 months ........................................... 13
2.5 CARE PRACTICES .......................................................................................................................................... 13 2.5.1 Promoting early learning at household level ......................................................................... 14 2.5.2 Childhood education ............................................................................................................. 14
2.6 USE OF HEALTH SERVICES .............................................................................................................................. 14 2.6.1 Attendance at Child Welfare Clinic ....................................................................................... 14 2.6.2 Vitamin A supplementation for children ................................................................................ 14 2.6.3 Source of medical care for common childhood illnesses ......................................................... 14 2.6.4 Use of services at antenatal clinics ........................................................................................ 15 2.6.5 Food and nutrient supplementation for women ...................................................................... 15 2.6.6 Samurdhi beneficiaries ......................................................................................................... 15
2.7 WATER AND SANITATION ................................................................................................................................ 15 2.7.1 Use of improved water sources.............................................................................................. 15 2.7.2 Use of sanitary means of excreta disposal ............................................................................. 16 2.7.3 Use of improved water sources and sanitary means of excreta disposal ................................. 16
x
2.8 FOOD SECURITY AND COPING STRATEGIES ....................................................................................................... 16 2.8.1 Household food consumption ................................................................................................ 16 2.8.2 Household dietary diversity................................................................................................... 17 2.8.3 Expenditure on food and other goods and services ................................................................ 17 2.8.4 Coping Strategies ................................................................................................................. 17 2.8.5 Food insecurity ..................................................................................................................... 18 2.8.5.1 Household food consumption adequacy score (HFCAS)...................................................... 18 2.8.5.2 Food insecurity categories ................................................................................................. 18
ANNEX I .............................................................................................................................................. 19
ANNEX II ............................................................................................................................................. 52

xi
LIST OF TABLES
Table 1: Prevalence of malnutrition: stunting, wasting, overweight and underweight by background characteristics ..................................................................................... 6
Table 2: Prevalence of anaemia among children 6-59 months of age by background characteristics ........................................................................................................ 7
Table 3: Prevalence of low birth weight, and mean birth weight among children born in the 5 years preceding the survey, by background characteristics ............................. 8
Table 4: Distribution of non-pregnant women 15-49 years by BMI levels, by background characteristics .......................................................................................................10
Table 5: Prevalence of Anaemia*, among i) pregnant women, ii) lactating women and iii) All non-pregnant women by background characteristics ..................................11
Table A 1: Percentage of under-5 children who reported symptoms of respiratory illness
and diarrhoea by background characteristics .........................................................19 Table A 2: Infant and young child feeding practices by background characteristics.................20 Table A 3: Percentage of children aged 6-59 months, who were given different food items
on the day preceding the interview, by background characteristics ........................21 Table A 4: Individual dietary diversity score in children (IDDS) according to background
characteristics fro children 6 – 59 months .............................................................22 Table A 5: Minimum meal frequency, dietary diversity, and minimum acceptable diet in
children 6-23 months, by background characteristics ............................................23 Table A 6: Participation of adult members in activities of children aged 2 to 5 years, and
percentage of under 5 children cared for by a child <10 years, by background characteristics .......................................................................................................24
Table A 7: Percentage of children aged 36-59 months who were attending an early childhood education programme, by background characteristics ...........................25
Table A 8: Percentage of children 5-10 years of age attending Primary School, by background characteristics ....................................................................................26
Table A 9: Use of different types of play items by children under 5 years of age, according to background characteristics ................................................................27
Table A 10: Percentage of children aged 5-14 years who are involved in child labour activities, and mean hours per week, by background characteristics ......................28
Table A 11: Percentage of children less than 5 years of age who received care at child welfare clinic, by background characteristics ........................................................29
Table A 12: Percentage distribution of children who received Vitamin A mega dose supplement at 9, 18 and 36 months, by background characteristics ........................30
Table A 13: Source of care provider for children who had diarrhoea or respiratory illness during 2 weeks preceding survey, by background characteristics ..........................31
Table A 14: Percent of pregnant mothers who attended antenatal clinics, and who received “poshana malla”, “thriposha” and Iron tablets, by background characteristics .......32
Table A 15: Percentage of lactating mothers who received “thriposha” and Vitamin A by background characteristics ....................................................................................33
xii
Table A 16: “Samurdhi” beneficiaries” among women 15-49 years by background characteristics .......................................................................................................34
Table A 17: Distribution of households according to main source of drinking water, and households with improved source of water, by background characteristics ............35
Table A 18: Distribution of households according to drinking water treatment methods used, by background characteristics* ....................................................................36
Table A 19: Distribution of households according to type of toilet , by background characteristics .......................................................................................................37
Table A 20: Distribution of households using both improved drinking water sources and sanitary means of excreta disposal, by background characteristics .........................37
Table A 21: Distribution of households according to duration to and from the source of drinking water, by background characteristics.......................................................38
Table A 22: Distribution of households according to the person collecting water used in the household, by background characteristics .............................................................38
Table A 23: Proportion of households by type of foods consumed at least once in the day or night preceding the interview, by to background characteristics ............................39
Table A 24: Proportion of households by type of foods consumed in 5 days and more preceding the interview, by background characteristics .........................................40
Table A 25: Household dietary diversity score according to background characteristics............41 Table A 26: Percentage of household members (in broad age groups) who consume three or
more main meals a day, by background characteristics..........................................42 Table A 27: Expenditure on food and other goods and services ................................................43 Table A 28: Percent of households with coping strategy adopted in the previous 30 days,
with its frequency .................................................................................................44 Table A 29: Food-related coping strategies adopted during the 30 days preceding the
survey, by background characteristics ...................................................................45 Table A 30: Households taken loans and reasons for borrowing money, by background
characteristics .......................................................................................................46 Table A 31: Food groups by the main and secondary sources ...................................................47 Table A 32: Percent of households reported food had run out at some time during the
previous 12 months, and months of adequate household food provisioning (MAHFP) by background characteristics ..............................................................47
Table A 33: Current food stock duration and size compared to last year, by background characteristics .......................................................................................................48
Table A 34: Average number of times a household received food aid in the last 6 months, by background characteristics ...............................................................................49
Table A 35: Household Food Consumption Adequacy Score (HFCAS) and prevalence of household food insecurity status, by background characteristics ............................50
Table A 36: Distribution (No and Percent) of households by food security Levels ....................51 Table A 37: Distribution (No and Percent) of households by food security Levels ....................51
xiii
LIST OF FIGURES
Figure 1: A map showing Jaffna district.............................................................................. 01 Figure 2: Assessment of food insecurity levels.................................................................... 52
1
DISTRICT PROFILE – JAFFNA
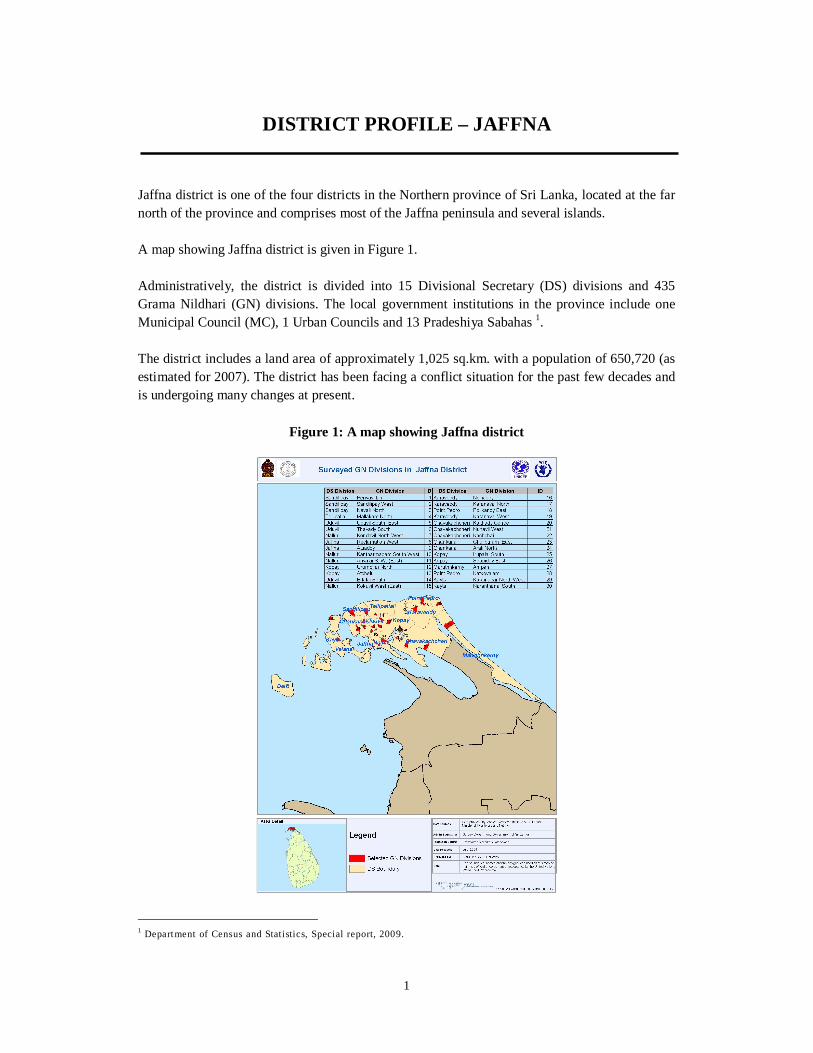
Jaffna district is one of the four districts in the Northern province of Sri Lanka, located at the far north of the province and comprises most of the Jaffna peninsula and several islands. A map showing Jaffna district is given in Figure 1. Administratively, the district is divided into 15 Divisional Secretary (DS) divisions and 435 Grama Nildhari (GN) divisions. The local government institutions in the province include one Municipal Council (MC), 1 Urban Councils and 13 Pradeshiya Sabahas 1. The district includes a land area of approximately 1,025 sq.km. with a population of 650,720 (as estimated for 2007). The district has been facing a conflict situation for the past few decades and is undergoing many changes at present.
Figure 1: A map showing Jaffna district
1 Department of Census and Statistics, Special report, 2009.

2
Health services are mainly provided by the state sector and western type of health services include 1 Teaching Hospital, 1 Base Hospital, 6 District Hospitals, 6 Peripheral Units, 3 Rural Hospitals, 3 other Hospitals and 8 Central Dispensaries / Maternity Homes. Preventive and promotive health services are provided through 11 Health Unit areas with Medical Officers of Health and field staff2.
2 Mini stry of Health Care and Nutrition, Annual Health Bulletin, 2007.
3
1. METHODS
1.1 Selection of households A sample of 613 households from the district of Jaffna was included in the study. The sampling frame used for selection of clusters was the most recently available population estimate – the 2001 census from the Sri Lanka Department of Census and Statistics. Clusters were defined at the level of a Grama Niladhari (GN) division. GN divisions were identified using the probability proportional to size technique. Within each cluster, 30 households were identified using a systematic sampling procedure. Map indicating the selected GN divisions is given in Figure 1. A household was defined as persons routinely sharing food from the same cooking pot and living in the same compound or physical location. Members of a household need not necessarily be relatives by blood or marriage. All selected households were included in the survey, irrespective of whether there was a child under five.
1.2 Composition of the survey teams Each survey team included three interviewers and one team leader. Co-ordinator was recruited to take the overall responsibility for the conduct of the survey. All team leaders and team coordinators were trained by staff from Medical Research Institute (MRI) with experience from past surveys. The three interviewers from the survey team conducted all interviews, averaging seven interviews each, per day. The team leader was responsible for selection of households.
1.3 The Household survey It included several components. Administration of the questionnaire: A pre tested questionnaire was administered to the head of the household. Where possible, mothers were interviewed to obtain information on child care practices and maternal nutrition. The minimum age of respondents was 15 years. Anthropometric assessments: All children aged 0 to 59 months, along with their mothers and any pregnant women in the household, were selected for measurement. All measurements were conducted by team leaders, and standardized procedures for measuring the height/length, weight were used (WHO, 1995). Anthropometric measurements were made using UNISCALES and UNICEF measuring boards.
4
In pregnant women, Mid Upper Arm Circumference (MUAC) was measured in addition to height and weight. Measurement of haemoglobin levels was carried out for all individuals selected for measuresments except in children less than six months of age using hemocue method, using capillary blood.
1.4 Supervision and quality assurance Constant supervision and monitoring of all field activities was attempted. Team leaders would monitor interviewers, while team coordinators monitored team leaders as well as the interviewers. Routine field-editing of all questionnaires was conducted by the team leaders.
1.5 Data processing and analysis EPI Info 6.0 software package was used for data management and entry. Data cleaning was carried out in MS Access by sorting records to filter out extreme values and SQL queries to check logical errors. Consistency checks were run to detect and correct data entry errors. Data analysis was conducted in Anthro and SPSS. Anthro was used to calculate nutrition z-scores for women and children based on the anthropometric measurements, using WHO standards as the reference value.

5
2. RESULTS A total of 613 households from the Jaffna district was included in the survey. OF them, 85.3 percent were in the rural sector, 14.7 percent in the urban sector. Of the total 2776 individuals who were usually resident in the selected households, 763 (27.5 percent) were women aged between 15.0 and 49.9 years. Eight percent (n=221) of the total population were children aged between 5.0 and 14.9 years and 10.3 percent were children aged less than 5 years. Of the population, 6.4 percent were children aged between 2.0-4.9 years.
2.1 Nutritional Status
2.1.1 Nutritional status of children The three indices of physical growth that describe the nutritional status of children according to WHO growth standards (WHO, 2006) are: Height-for-age, Weight-for-height and Weight-for-age. Each of the four nutritional status indicators expressed in terms of standard deviations from the median (Z-scores) of the reference population was used to assess the prevalence of stunting (height for age < -2SD), wasting (weight for height <-2SD), underweight (weight for age <-2SD) and overweight (weight for height more than +2SD). A total of 282 children under five years were included in the survey. As shown in Table 1, among all children in the age group 0–59 months, 15.2 percent were stunted, 9.5 percent wasted and 14.3 percent were underweight. Severe stunting was seen among 1.9 percent of the total group, with the comparable figures for severe wasting and severe underweight being 0.7 percent and 1.5 percent respectively. There were only 0.7 percent of children with weight for height values more than +2 SD. Comparisons made between sub groups are based on relatively low numbers within each such group, hence have to be interpreted with caution. The prevalence of stunting (height for age <-2 SD) was highest during the 12 - 23 months of age. Prevalence of underweight was highest in the fifth year of life. The percentage of children with stunting and wasting were higher among males compared to females. Prevalence of severe stunting was highest in the fourth year of life (4.3 percent) and among males (2.4 percent).

6
Table 1: Prevalence of malnutrition: stunting, wasting, overweight and underweight by background characteristics
Background characteristic
Height-for- age (%) Weight-for-height (%) Weight-for-age
(%) Total No of Children
<-2SD <-3SD <-2SD <-3SD >+2SD <-2SD <-3SD
Age of child (months)
<6 0.0 0.0 18.2 0.0 0.0 9.1 0.0 11
6-11 6.9 0.0 0.0 0.0 0.0 3.4 0.0 30
12-23 22.7 0.0 9.1 1.5 0.0 10.6 3.0 67
24-35 15.4 3.1 10.8 0.0 1.5 16.9 1.5 66
36-47 18.2 1.8 9.1 0.0 0.0 16.4 0.0 60
48-59 8.7 4.3 13.0 2.2 2.2 21.7 2.2 48
Sex of child
Male 17.9 2.4 12.2 1.6 0.0 16.3 2.4 127
Female 12.9 1.4 7.3 0.0 1.3 12.8 0.7 155
Sector
Urban 10.7 3.6 17.9 0.0 0.0 21.4 0.0 28
Rural 15.7 1.7 8.6 0.8 0.8 13.5 1.6 254
Mother’s education
No schooling 0.0 0.0 100.0 0.0 0.0 0.0 0.0 1
Primary 26.3 0.0 10.5 0.0 0.0 26.3 0.0 19
Secondary 14.5 2.9 9.9 0.0 1.4 15.5 1.4 75
Passed O’ Level 11.8 0.9 10.9 0.9 0.9 15.5 0.9 113
Higher 17.3 1.9 3.8 0.0 0.0 5.8 1.9 52
Monthly household income
< 9,000 15.9 3.0 11.5 1.2 0.6 17.6 1.8 173
9,000 – 13,999 18.8 0.0 12.2 0.0 2.0 12.2 2.0 50
14,000 – 19,999 4.5 0.0 4.5 0.0 0.0 4.5 0.0 22
20,000 – 31,999 10.0 0.0 0.0 0.0 0.0 10.0 0.0 21
≥ 32,000 22.2 0.0 0.0 0.0 0.0 0.0 0.0 9
Wealth index quintile
Poorest 23.9 3.5 10.5 0.9 0.9 21.1 2.6 120
Second 12.7 1.4 8.3 0.0 1.4 12.7 1.4 73
Middle 6.5 0.0 6.5 0.0 0.0 8.7 0.0 47
Fourth 3.7 0.0 17.9 3.6 0.0 7.1 0.0 29
Richest 7.7 0.0 0.0 0.0 0.0 0.0 0.0 13
Overall 15.2 1.9 9.5 0.7 0.7 14.3 1.5 282
7
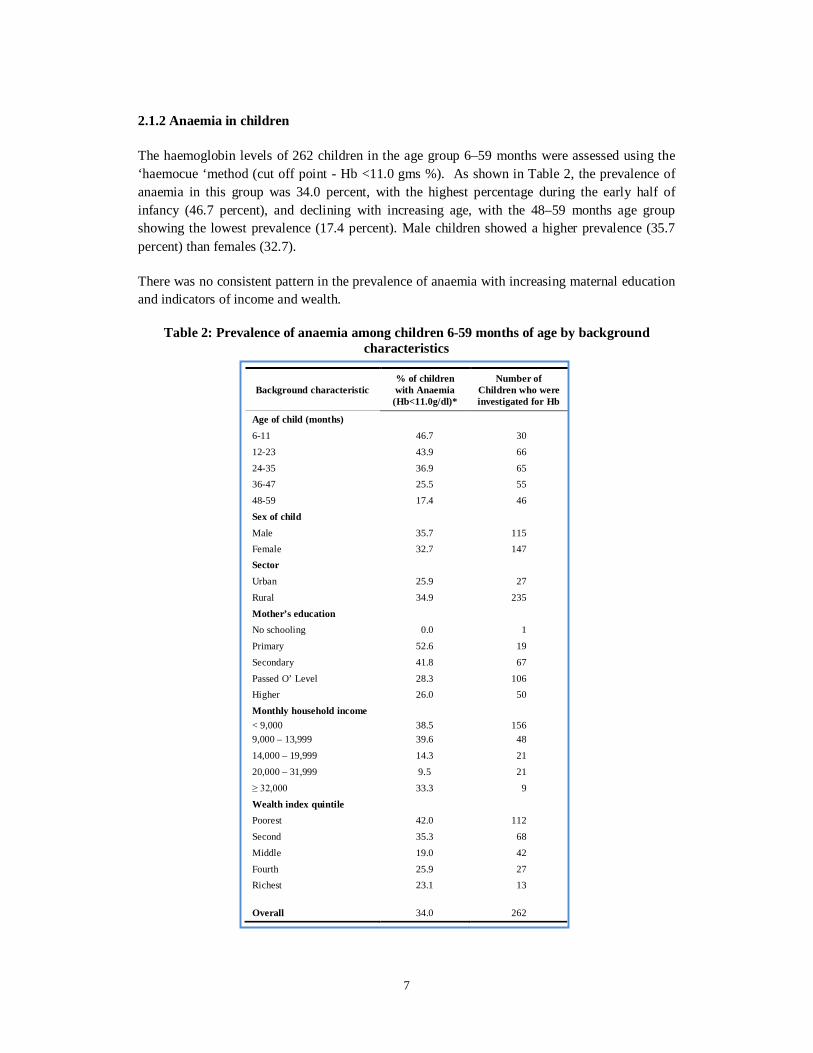
2.1.2 Anaemia in children The haemoglobin levels of 262 children in the age group 6–59 months were assessed using the ‘haemocue ‘method (cut off point - Hb <11.0 gms %). As shown in Table 2, the prevalence of anaemia in this group was 34.0 percent, with the highest percentage during the early half of infancy (46.7 percent), and declining with increasing age, with the 48–59 months age group showing the lowest prevalence (17.4 percent). Male children showed a higher prevalence (35.7 percent) than females (32.7). There was no consistent pattern in the prevalence of anaemia with increasing maternal education and indicators of income and wealth.
Table 2: Prevalence of anaemia among children 6-59 months of age by background characteristics
Background characteristic % of children with Anaemia
(Hb<11.0g/dl)*
Number of Children who were investigated for Hb
Age of child (months)
6-11 46.7 30
12-23 43.9 66
24-35 36.9 65 36-47 25.5 55
48-59 17.4 46
Sex of child
Male 35.7 115 Female 32.7 147 Sector
Urban 25.9 27
Rural 34.9 235
Mother’s education No schooling 0.0 1
Primary 52.6 19
Secondary 41.8 67
Passed O’ Level 28.3 106 Higher 26.0 50
Monthly household income < 9,000 38.5 156 9,000 – 13,999 39.6 48
14,000 – 19,999 14.3 21
20,000 – 31,999 9.5 21
≥ 32,000 33.3 9
Wealth index quintile Poorest 42.0 112
Second 35.3 68
Middle 19.0 42
Fourth 25.9 27 Richest 23.1 13 Overall 34.0 262
8
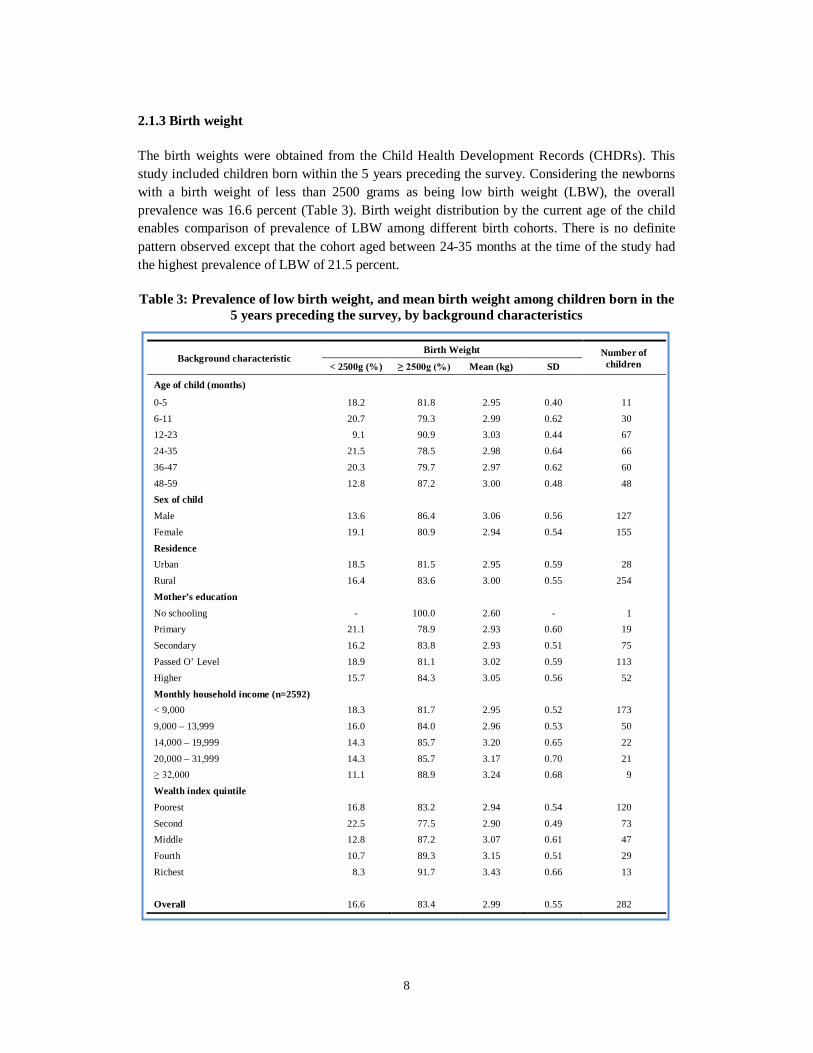
2.1.3 Birth weight The birth weights were obtained from the Child Health Development Records (CHDRs). This study included children born within the 5 years preceding the survey. Considering the newborns with a birth weight of less than 2500 grams as being low birth weight (LBW), the overall prevalence was 16.6 percent (Table 3). Birth weight distribution by the current age of the child enables comparison of prevalence of LBW among different birth cohorts. There is no definite pattern observed except that the cohort aged between 24-35 months at the time of the study had the highest prevalence of LBW of 21.5 percent. Table 3: Prevalence of low birth weight, and mean birth weight among children born in the
5 years preceding the survey, by background characteristics
Background characteristic Birth Weight Number of
children < 2500g (%) ≥ 2500g (%) Mean (kg) SD
Age of child (months) 0-5 18.2 81.8 2.95 0.40 11
6-11 20.7 79.3 2.99 0.62 30 12-23 9.1 90.9 3.03 0.44 67
24-35 21.5 78.5 2.98 0.64 66
36-47 20.3 79.7 2.97 0.62 60
48-59 12.8 87.2 3.00 0.48 48 Sex of child
Male 13.6 86.4 3.06 0.56 127
Female 19.1 80.9 2.94 0.54 155
Residence Urban 18.5 81.5 2.95 0.59 28
Rural 16.4 83.6 3.00 0.55 254
Mother’s education
No schooling - 100.0 2.60 - 1 Primary 21.1 78.9 2.93 0.60 19
Secondary 16.2 83.8 2.93 0.51 75
Passed O’ Level 18.9 81.1 3.02 0.59 113
Higher 15.7 84.3 3.05 0.56 52
Monthly household income (n=2592) < 9,000 18.3 81.7 2.95 0.52 173
9,000 – 13,999 16.0 84.0 2.96 0.53 50
14,000 – 19,999 14.3 85.7 3.20 0.65 22
20,000 – 31,999 14.3 85.7 3.17 0.70 21 ≥ 32,000 11.1 88.9 3.24 0.68 9
Wealth index quintile
Poorest 16.8 83.2 2.94 0.54 120
Second 22.5 77.5 2.90 0.49 73 Middle 12.8 87.2 3.07 0.61 47
Fourth 10.7 89.3 3.15 0.51 29
Richest 8.3 91.7 3.43 0.66 13
Overall 16.6 83.4 2.99 0.55 282
9
The prevalence was higher among female newborns than males. There is a decline in the prevalence with increasing levels of mother’s education and with increasing income levels and wealth quintiles. Mean birth weight for the total group was 2.95 ± 0.52 kg with no clear pattern observed between age groups, districts, and maternal educational levels. However, an upward trend was observed in relation to increasing income levels and higher levels of wealth quintiles.
2.2 Nutritional status of women of 15-49 years
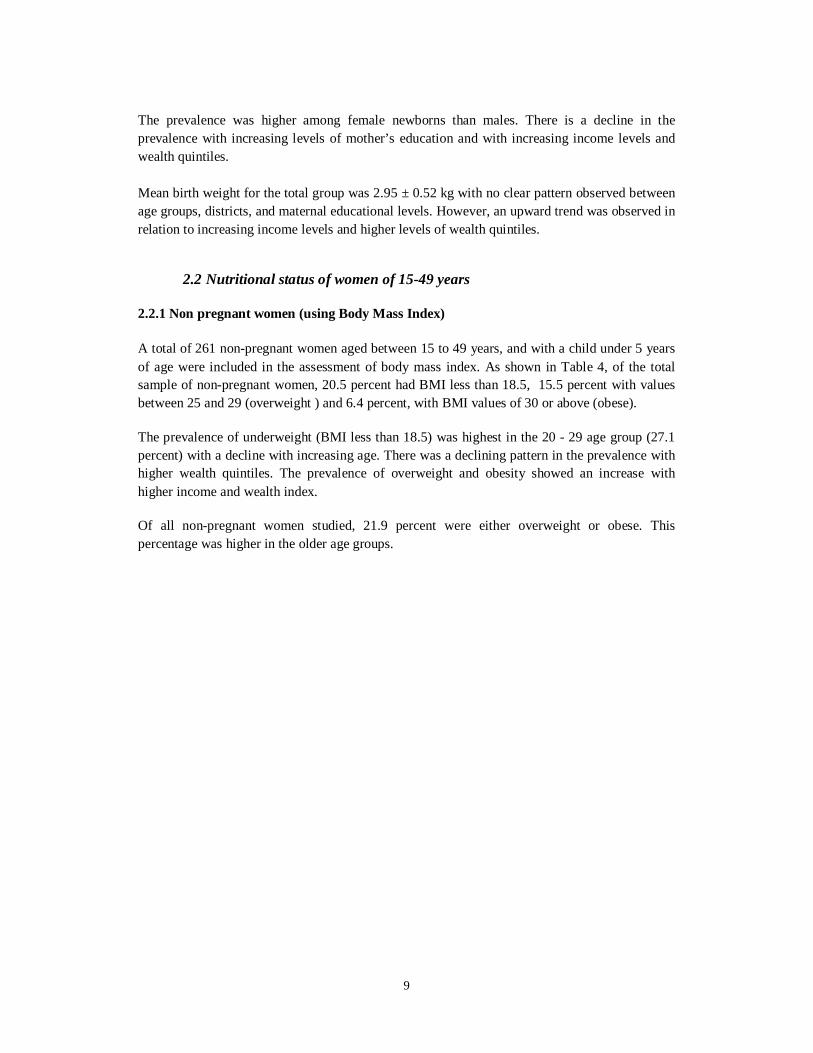
2.2.1 Non pregnant women (using Body Mass Index) A total of 261 non-pregnant women aged between 15 to 49 years, and with a child under 5 years of age were included in the assessment of body mass index. As shown in Table 4, of the total sample of non-pregnant women, 20.5 percent had BMI less than 18.5, 15.5 percent with values between 25 and 29 (overweight ) and 6.4 percent, with BMI values of 30 or above (obese). The prevalence of underweight (BMI less than 18.5) was highest in the 20 - 29 age group (27.1 percent) with a decline with increasing age. There was a declining pattern in the prevalence with higher wealth quintiles. The prevalence of overweight and obesity showed an increase with higher income and wealth index. Of all non-pregnant women studied, 21.9 percent were either overweight or obese. This percentage was higher in the older age groups.

10
Table 4: Distribution of non-pregnant women 15-49 years by BMI levels, by background characteristics
Background Characteristics
BMI category (%) Total
women Underweight (BMI<18.5)
Normal (BMI=18.5-24.9)
Overweight BMI=25.0-29.0)
Obese (BMI>30.0)
Age group (years)
15-19 22.2 66.7 11.1 0.0 15
20-29 27.1 56.5 10.6 5.9 95
30-39 16.5 58.8 19.6 5.2 106
40-49 13.8 55.2 17.2 13.8 45
Sector
Urban 9.1 50.0 18.2 22.7 25
Rural 21.7 58.6 15.2 4.5 236
Women’s education level
No schooling 50.0 50.0 0.0 0.0 2
Primary 19.0 76.2 0.0 4.8 30
Secondary 32.8 48.3 15.5 3.4 71
Passed GCE (O/L) 18.5 56.5 17.4 7.6 103
Higher 8.7 63.0 19.6 8.7 54
Monthly household income
< 9,000 22.6 58.9 12.9 5.6 145
9,000 – 13,999 21.1 50.0 21.1 7.9 40
14,000 – 19,999 0.0 64.7 29.4 5.9 20
20,000 – 31,999 7.7 84.6 0.0 7.7 18
≥ 32,000 14.3 42.9 28.6 14.3 7
Wealth index quintiles
Poorest 30.1 57.0 11.8 1.1 113
Second 18.6 57.6 18.6 5.1 66
Middle 11.1 61.1 13.9 13.9 45
Fourth 8.7 56.5 21.7 13.0 28
Richest 0.0 55.6 22.2 22.2 9
Overall 20.5 57.7 15.5 6.4 261
2.2.2 Nutritional status of pregnant women (using Mid Upper Arm Circumference - MUAC) Nutritional status of 27 pregnant women was assessed using MUAC. This assessment indicated that 14.8 percent of this group were undernourished.
2.2.3 Anaemia in women Three groups of women were included in this component of the study: (i) pregnant women (27), (ii) lactating women (57), (iii) all non pregnant women including lactating women (218).
11
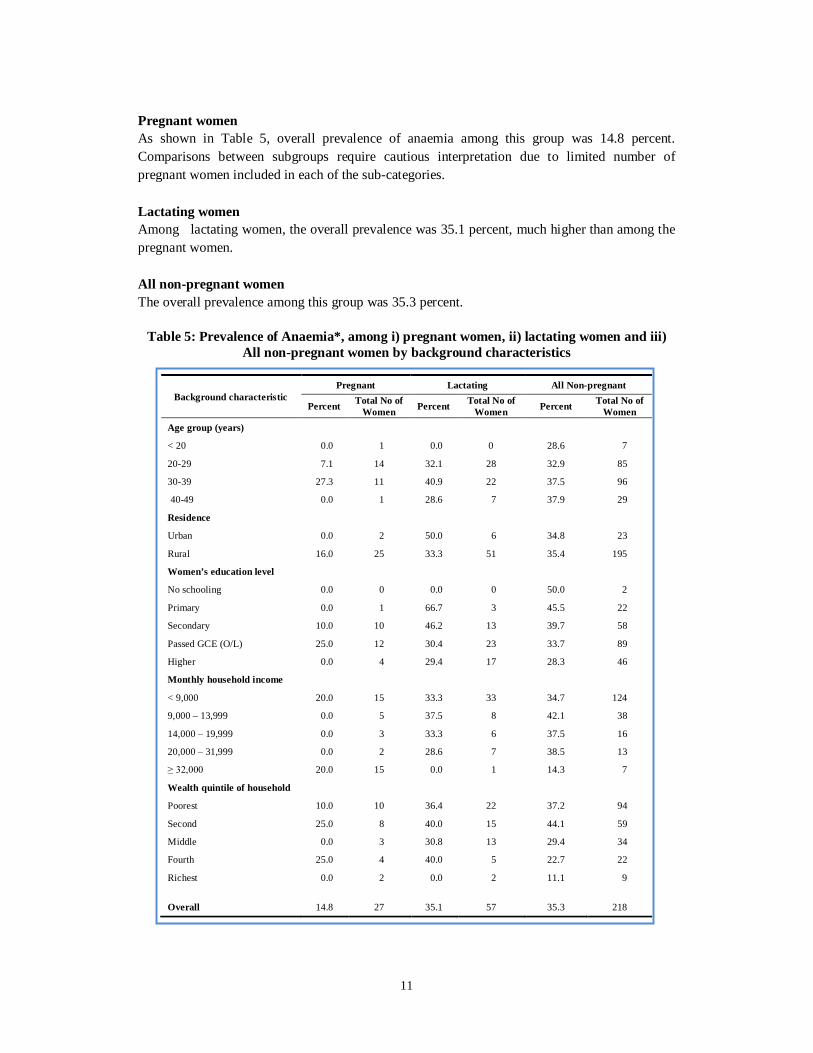
Pregnant women As shown in Table 5, overall prevalence of anaemia among this group was 14.8 percent. Comparisons between subgroups require cautious interpretation due to limited number of pregnant women included in each of the sub-categories. Lactating women Among lactating women, the overall prevalence was 35.1 percent, much higher than among the pregnant women. All non-pregnant women The overall prevalence among this group was 35.3 percent.
Table 5: Prevalence of Anaemia*, among i) pregnant women, ii) lactating women and iii) All non-pregnant women by background characteristics
Background characteristic Pregnant Lactating All Non-pregnant
Percent Total No of Women Percent Total No of
Women Percent Total No of Women
Age group (years)
< 20 0.0 1 0.0 0 28.6 7
20-29 7.1 14 32.1 28 32.9 85
30-39 27.3 11 40.9 22 37.5 96
40-49 0.0 1 28.6 7 37.9 29
Residence
Urban 0.0 2 50.0 6 34.8 23
Rural 16.0 25 33.3 51 35.4 195
Women’s education level
No schooling 0.0 0 0.0 0 50.0 2
Primary 0.0 1 66.7 3 45.5 22
Secondary 10.0 10 46.2 13 39.7 58
Passed GCE (O/L) 25.0 12 30.4 23 33.7 89
Higher 0.0 4 29.4 17 28.3 46
Monthly household income
< 9,000 20.0 15 33.3 33 34.7 124
9,000 – 13,999 0.0 5 37.5 8 42.1 38
14,000 – 19,999 0.0 3 33.3 6 37.5 16
20,000 – 31,999 0.0 2 28.6 7 38.5 13
≥ 32,000 20.0 15 0.0 1 14.3 7
Wealth quintile of household
Poorest 10.0 10 36.4 22 37.2 94
Second 25.0 8 40.0 15 44.1 59
Middle 0.0 3 30.8 13 29.4 34
Fourth 25.0 4 40.0 5 22.7 22
Richest 0.0 2 0.0 2 11.1 9 Overall 14.8 27 35.1 57 35.3 218
12
2.3 Childhood Illnesses
Diarrhoea and respiratory infections are the two common illnesses that lead to increased morbidity and mortality among children under 5 years. The present study sought information from respondents related to the occurrence of these two illnesses during the two weeks preceding the interview.
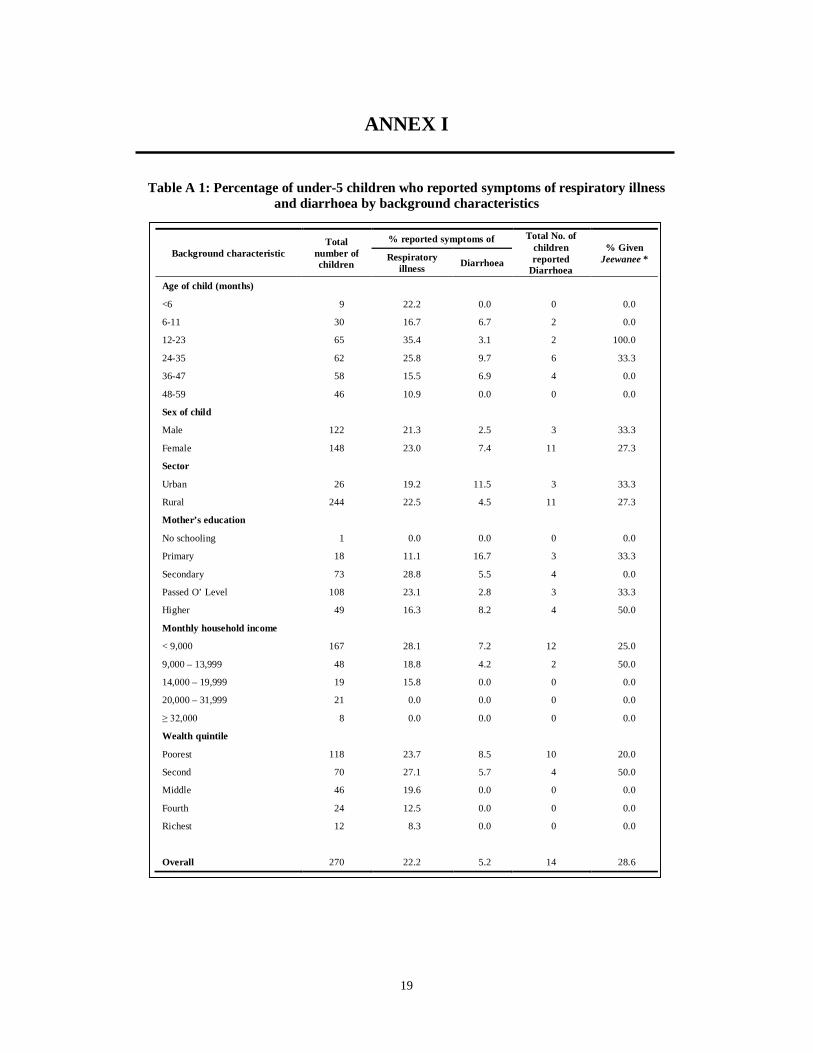
2.3.1 Respiratory illness Respondents were asked whether their children less than five years of age had one or more symptoms related to respiratory illness (cough, rapid or difficult breathing) during the period of 2 weeks preceding the survey. A child who was having cough with rapid or difficult breathing, was identified as having had symptoms of respiratory illness. Among the total group, 22.2 percent reported to have had symptoms related to respiratory illness during the specified period (Table A 1).
2.3.2 Diarrhoea The respondents were asked whether their children under five years had experienced an episode of diarrhea during the two weeks preceding the survey. (Diarrhoea was defined as three or more loose or watery stools per day or blood in stool). If the child had diarrhea, information on giving oral rehydration fluid using the packet ‘Jeewani’ during the episode of diarrhoea, was inquired into. Of the total group, 5.2 percent of children reported to have had diarrhea during the specified period. Of them, 28.6 percent were given “Jeewani”.
2.4 Dietary intake and feeding practices
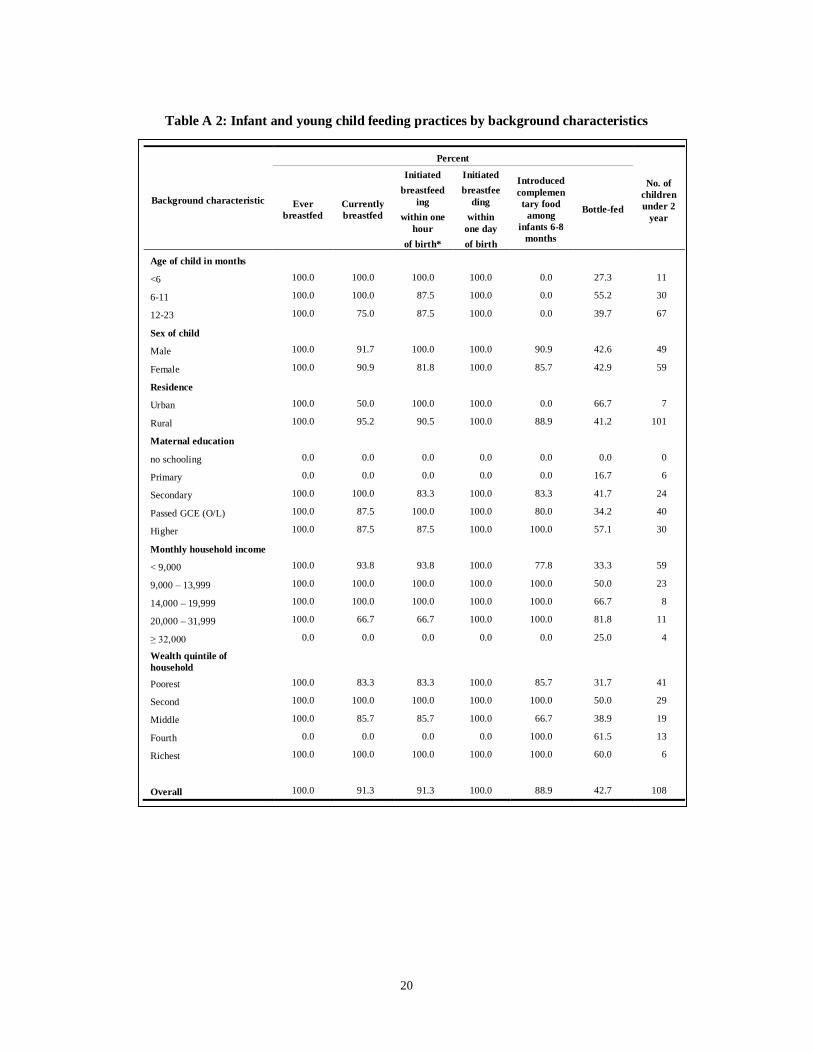
2.4.1 Breastfeeding practices Percentage of children less than 24 months years of age who were ever breastfed, currently breastfed and started breastfeeding within one hour / one day of birth are given in Table A 2. All children were ‘ever breastfed’. Of them, 91.3 percent were breast fed within the first hour of birth and the same percentage were currently breast fed, that is, given breast milk in the previous 24 hours.
2.4.2 Complementary feeding and bottle-feeding practices As shown in Table A 2, 88.9 percent of all children between 6-8 months were given breast milk and solid / semi solid foods and 42.7 percent of children under 24 months had been bottle fed.
13
2.4.3 Food Consumption among children in the age group 6 – 59 months Food consumption pattern was based on the information about the food items given to children aged 6 – 59 months on the day preceding the interview. Ten different food items were included in this analysis. For the total sample, 84.9 percent of the children were given grains/roots/tubers, while 50 – 60 percent were given fruits and vegetables, and meat fish/ poultry/ organ meats. Proportions of children who received eggs was comparatively high (57.6 percent) and the consumption of dairy products was low (26.2 percent). Foods cooked with oil or fat were given to 52.0 percent of children and 46.5 percent were given fortified food (commercially available cereals), and 80.1 percent or were given sugary food (chocolates, sweets, candies, cakes, biscuits etc.).
2.4.4 Dietary diversity Dietary diversity is based on the premise that more diverse diets are more likely to provide adequate levels of a range of nutrients.
2.4.5 Individual dietary diversity score for children aged 6-59 months In this study, individual dietary diversity score for children aged 6 – 59 months was assessed. (according to FANTA3) . As shown in Table A 4, for all children in this age group, the IDDS was 4.7 (SD =1.9). The dietary diversity score of children aged 6-59 months in the households belonging to the highest wealth quintile was used as a “target to be achieved” based on the assumption that poorer households will diversify their food consumption practices as incomes rise, and thereby attempting to follow the consumption pattern of wealthier households. Table A 4 shows the IDDS among children in the highest wealth quintile was 5.5. Based on this value, the percentage of children yet to achieve the target was assessed. This percentage was 66.4 for the total sample. The percentage decreased with increasing income categories and wealth quintiles. Information on Minimum meal frequency, minimum dietary diversity and minimum acceptable diet for children aged 6-23 months is given in Table A 5.
2.5 Care Practices Care practices were studied in relation to activities on early childhood development including promoting early learning at household level, practices related to play activities, early childhood education, school enrolment. The age group to be included in the different components in the study of care practices varied, depending on the relevance.
3 Anne Swindale & Paula Bilinsky Household Dietary Diversity Score (HDDS) for Measurement of Household Food
Access: Indicator Guide VERSION 2 September 2006

14
2.5.1 Promoting early learning at household level As shown in Table A 6, the average number of’ education related activities’ undertaken by the children was 4.9. For 75.0 percent of children, an adult was engaged in more than three activities that promoted early learning, during the 3 days preceding the survey. Considering the children under 5 years of age, 26.3 percent were looked after by a child under the age of 10 years, during the week preceding the interview.
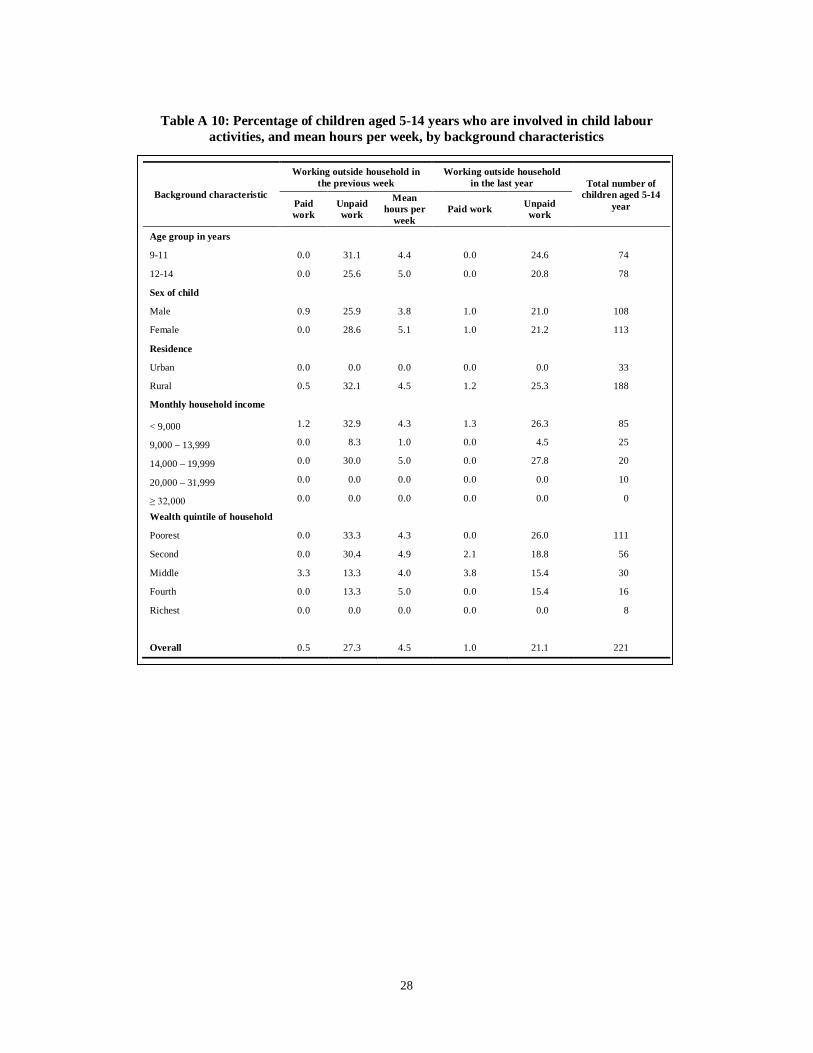
2.5.2 Childhood education As shown in Table A 7, of the children aged 36-59 months, 61.0 percent had attended an early childhood educational programme and 99.7 percent of the children who have completed 5 years by 31st January 2009 were enrolled in grade 1and the same percentage of children between 5-10 years of age were attending Primary School (Table A 8). Information related to play items used by the children and ‘child labour is given in Table A 9 and A 10 respectively.
2.6 Use of health services
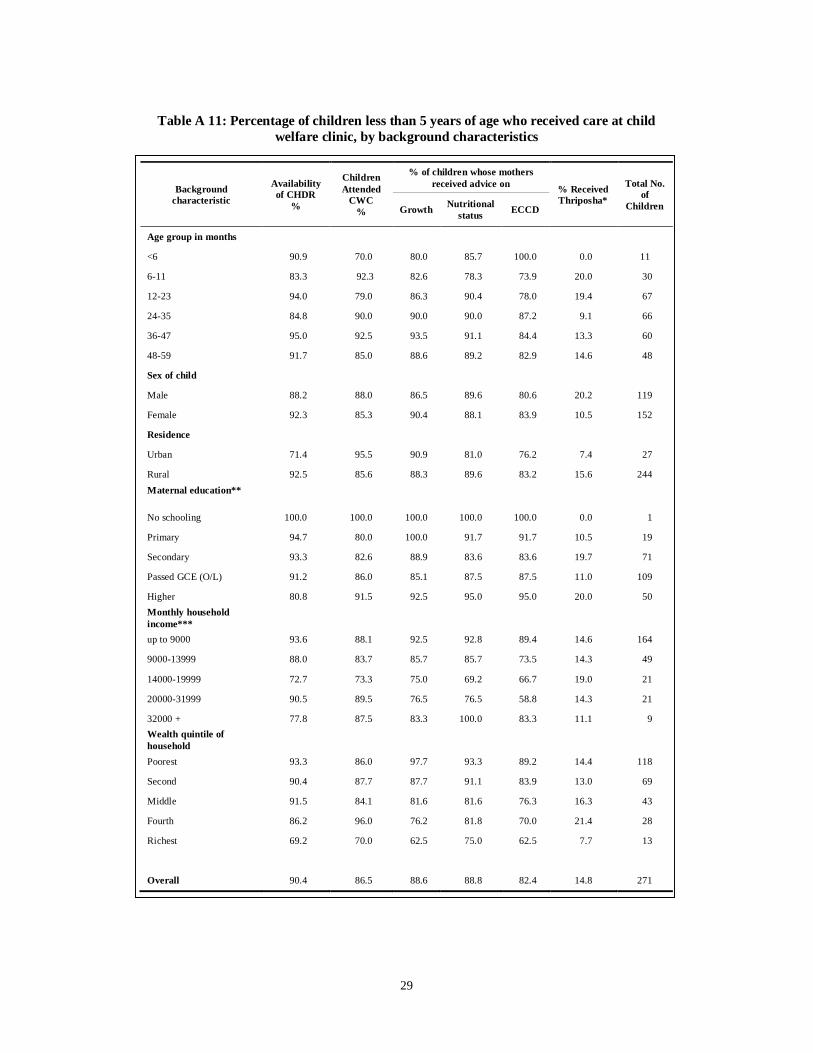
2.6.1 Attendance at Child Welfare Clinic As shown in Table A 11, 86.5 percent of the children under 5 years had received care at a Child Welfare Clinic (CWC) and 90.4 percent of the children had their Child Health Development Records (CHDRs) with them at the time of interview. Of the mothers who attended the child welfare clinics, 88.6, 88.8 and 82.4 percent received advice on growth, nutrition and early childhood development respectively. Of this group, 14.8 percent of children aged 6-59 months had received at least one packet of thriposha in the previous month.
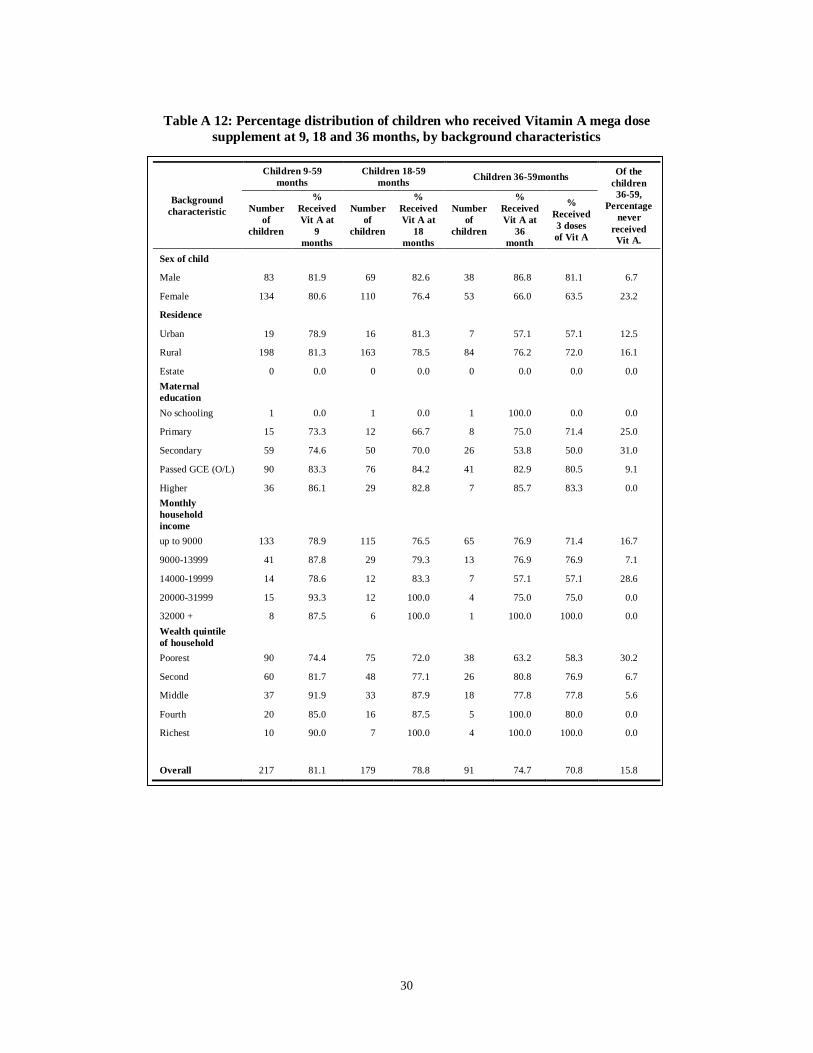
2.6.2 Vitamin A supplementation for children Of the group, 81.1 percent of children who had completed 9 months of age had received a mega dose of vitamin A with the percentage of children who received a vitamin A mega dose at 18 months and 36 months being 78.8 and 74.7 percent respectively. Considering all children aged 36 months and over 70.8 percent had been given 3 mega doses of Vitamin A (Table A 12).
2.6.3 Source of medical care for common childhood illnesses Source of medical care for those children who reported diarrhoea / respiratory symptoms within the 2 weeks preceding the interview was considered under services provided by the government sector, private sector and other sectors. As shown in Table A 13, 50.9 percent of the total group used services from the government sector, 47.4 percent from the private sector and 1.8 percent from other sectors.
15
2.6.4 Use of services at antenatal clinics A total of 87.0 percent of the pregnant mothers had attended antenatal clinics regularly as shown in Table A 14. Among the 89.5 percent of pregnant mothers who received iron supplement, 72.2 percent took the supplement regularly.
2.6.5 Food and nutrient supplementation for women The two main nutrition supplementation programmes aimed at pregnant women are the provision of a food basket (“poshana malla”) through the Samurdhi programme implemented by the: Ministry of Samurdhi and Poverty Alleviation and the Thriposha programme implemented by the Ministry of Health care and Nutrition. Of all pregnant mothers, 71.4 percent received Thriposaha and 95.2 percent had received “poshana malla” (Table A 14). Of the lactating mothers with a child under 6 months of age, 71.4 percent had received “thriposha” (Table A 15) and vitamin A mega dose has been given to 95.2 percent, after childbirth.
2.6.6 Samurdhi beneficiaries In the households included in the study, there were a total of 201 non pregnant, non lactating women in the age group 15 – 49 years. Of this group, 42.3 percent received Samurdhi benefits, being members of households that were beneficiaries under the Samurdhi programme. (Table A 16). Percentages of the beneficiaries among the pregnant women and lactating women were 29.6 percent and 40.0 percent respectively.
2.7 Water and Sanitation
2.7.1 Use of improved water sources As shown in Table A 17, 87.3 percent of the households had improved sources of water. There was no consistent pattern showing an association with income or wealth quintile. Of all households, 59.1 percent used one of the appropriate water treatment methods to treat their drinking water with boiling being the most frequently used method, practiced by 34.4 percent of the households included in the study (Table A 18). The percentage of households that used boiling as a method of making water safe, increased marginally from the lowest wealth quintile to the highest. In some households, more than one method was used.

16
2.7.2 Use of sanitary means of excreta disposal Use of flush toilets connected to sewage systems, or septic tanks was considered as sanitary means of excreta disposal. As shown in Table A 19, the percentage of households using sanitary means of excreta disposal was 85.0 percent.
2.7.3 Use of improved water sources and sanitary means of excreta disposal Table A 20 shows the distribution of households that use both improved sources of drinking water and sanitary means of excreta disposal. For the district sample, 73.6 percent of households reported using both improved water source and sanitary means of excreta disposal. The percentage of households that had both facilities increased with increasing levels of wealth quintiles.
Information on the time consumed to collect water and the person collecting water are given in Tables A 21 and A 22 respectively.
2.8 Food Security and Coping Strategies
2.8.1 Household food consumption The food items consumed by households were grouped into 11 categories based on the FAO classification of food groups with some modifications to include coconut and sugar separately. These food groups were used in assessing the food consumption pattern as shown in Tables A 23 and A 24. Table A 23 provides information on food items consumed within 24 hours preceding the survey. Consumption of rice and rice products, coconuts and sugar ranged from 95 – 100 percent and consistent across all sub groups studied. Bread and wheat products were consumed by 66.8 percent with only 51.9 percent of households having consumed fruits. The percentage of households that consumed milk and milk products was 55.8. Consumption of oils and fats were 89.6 percent. Information on the consumption of different foods for at least 5 days during the week preceding the survey is shown in Table A 24. This information indicated the consistency of consumption of the foods and shows important differences from the Table A 23, which is focused on the consumption pattern during the 24 hours preceding the survey. Similar to the 24-hour consumption pattern, rice, coconut and sugar were consumed by more than 95 percent of the households. However, the consumption of food groups such as bread and wheat products, nuts and pulses, fruits, meat/poultry/fish and dry fish, eggs, and milk/dairy products were markedly lower during the 7-day period.

17
Table A 26 provides information on the household members who consume three or more main meals a day.
2.8.2 Household dietary diversity Household dietary diversity score (HDDS) is a proxy measure of households consuming a variety of food indicating a nutritionally ‘satisfactory’ diet and the method used to make this assessment is given in Table A 25. This table indicates that the mean HDDS for the total group was 7.2 (SD 1.9). The values ranged from 7.0 in the lowest wealth quintile to 8.3 in the highest. The HDDS obtained by the households in the highest wealth quintile category (8.3) was taken as the ‘target ‘to be achieved and the percentage of households yet to achieve the target was calculated. For the total sample, the percentage of households yet to achieve the target was 77.2. The percentage showed a consistent decline with increasing income and wealth quintiles.
2.8.3 Expenditure on food and other goods and services Study of broad categories under which household expenditure for a one-month period showed that considering all households included in the study, 73.3 percent of the total household monthly income was spent on food, and 8.4 percent on productive assets (Table A 27). Food groups by source are given in Table A 31. Food availability at household, food stocks and food aid are given in tables A 32,33 and 34 respectively.
2.8.4 Coping Strategies During the periods when there were limitations in food availability, different coping strategies were adopted by households (Table A 28). Use of such strategies during the month preceding the survey was studied paying attention to the frequency of practice. Of the total number of households, 48.1 percent had adopted one or more coping strategies. Of them, more of the households adopted food related coping strategies compared to non-food coping strategies. The common strategies adopted were: to rely on less preferred food (33.9 percent) and purchased food on credit (32.8 percent). Approximately, 30-35 percent, had borrowed food or reduced meal size. The main non-food strategies adopted were: borrowing money from relatives/neighbours (34.3 percent) and pawning jewellery (32.8 percent). The distribution of the households that adopted a specific food-related coping strategy by background characteristics is shown in Table A 29. The number of households in the sub categories are small, hence the limitations in drawing conclusions. Taking loans is a commonly adopted strategy to cope with difficult situations, whether it be food related or not. As shown in Table A 30, 49.1 percent of households had taken loans within the preceding month which were used for: purchasing of food (53.3 percent), and for medical costs (23.7 percent).
18
2.8.5 Food insecurity A state of food insecurity exists when nutritionally adequate and safe foods are not readily available or there is inability to acquire acceptable foods. In this study, food insecurity levels were determined according to the method described by the World Food Programme (WFP), given in annex 2.
2.8.5.1 Household food consumption adequacy score (HFCAS) As shown in Table A 35, the mean HFCAS for all households was 65.6 (SD=16.9). The scores differed between sectors, higher in the urban sector, 70.5 compared to the rural sector, 64.7. Study of HFCAS categories indicate that 0.3 percent of the households had poor food consumption, 2.3 percent were borderline and 97.4 percent, had adequate food consumption.
2.8.5.2 Food insecurity categories Food insecurity levels obtained by cross-tabulating food access categories (as indicated by percentage expenditure on food) and food consumption categories for households with a child aged less than 5 years (n= 282) are presented in Table 36. Of these households, 0.8 percent was found to be ‘severely food insecure’ with comparable percentages for ‘moderately insecure’ and ‘secure’ being 22.5 and 76.7 percent respectively. In interpreting food insecurity, the two categories, moderately and severely food insecure categories were considered together. The percentage of food insecure households in the urban sector (16.0 percent) was lower compared to the rural sector (24.1 percent) (Table A 37). Considering the key socio-economic indicators included in this study, the marked influences such indicators have on food insecurity is clearly shown. There seems to be an upward trend in the percentage of food secure households, with increasing level of education of the head of the household and increasing income levels and wealth quintiles. However, these observations have to be interpreted with caution as numbers in some of these groups are limited.
19
ANNEX I
Table A 1: Percentage of under-5 children who reported symptoms of respiratory illness and diarrhoea by background characteristics
Background characteristic Total
number of children
% reported symptoms of Total No. of children reported
Diarrhoea
% Given Jeewanee * Respiratory
illness Diarrhoea
Age of child (months)
<6 9 22.2 0.0 0 0.0
6-11 30 16.7 6.7 2 0.0
12-23 65 35.4 3.1 2 100.0
24-35 62 25.8 9.7 6 33.3
36-47 58 15.5 6.9 4 0.0
48-59 46 10.9 0.0 0 0.0
Sex of child
Male 122 21.3 2.5 3 33.3
Female 148 23.0 7.4 11 27.3
Sector
Urban 26 19.2 11.5 3 33.3
Rural 244 22.5 4.5 11 27.3
Mother’s education
No schooling 1 0.0 0.0 0 0.0
Primary 18 11.1 16.7 3 33.3
Secondary 73 28.8 5.5 4 0.0
Passed O’ Level 108 23.1 2.8 3 33.3
Higher 49 16.3 8.2 4 50.0
Monthly household income
< 9,000 167 28.1 7.2 12 25.0
9,000 – 13,999 48 18.8 4.2 2 50.0
14,000 – 19,999 19 15.8 0.0 0 0.0
20,000 – 31,999 21 0.0 0.0 0 0.0
≥ 32,000 8 0.0 0.0 0 0.0
Wealth quintile
Poorest 118 23.7 8.5 10 20.0
Second 70 27.1 5.7 4 50.0
Middle 46 19.6 0.0 0 0.0
Fourth 24 12.5 0.0 0 0.0
Richest 12 8.3 0.0 0 0.0
Overall 270 22.2 5.2 14 28.6
20
Table A 2: Infant and young child feeding practices by background characteristics
Background characteristic
Percent
No. of children under 2
year Ever
breastfed Currently breastfed
Initiated breastfeed
ing within one
hour of birth*
Initiated breastfee
ding within
one day of birth
Introduced complementary food
among infants 6-8
months
Bottle-fed
Age of child in months
<6 100.0 100.0 100.0 100.0 0.0 27.3 11
6-11 100.0 100.0 87.5 100.0 0.0 55.2 30
12-23 100.0 75.0 87.5 100.0 0.0 39.7 67
Sex of child
Male 100.0 91.7 100.0 100.0 90.9 42.6 49
Female 100.0 90.9 81.8 100.0 85.7 42.9 59
Residence
Urban 100.0 50.0 100.0 100.0 0.0 66.7 7
Rural 100.0 95.2 90.5 100.0 88.9 41.2 101
Maternal education
no schooling 0.0 0.0 0.0 0.0 0.0 0.0 0
Primary 0.0 0.0 0.0 0.0 0.0 16.7 6
Secondary 100.0 100.0 83.3 100.0 83.3 41.7 24
Passed GCE (O/L) 100.0 87.5 100.0 100.0 80.0 34.2 40
Higher 100.0 87.5 87.5 100.0 100.0 57.1 30
Monthly household income
< 9,000 100.0 93.8 93.8 100.0 77.8 33.3 59
9,000 – 13,999 100.0 100.0 100.0 100.0 100.0 50.0 23
14,000 – 19,999 100.0 100.0 100.0 100.0 100.0 66.7 8
20,000 – 31,999 100.0 66.7 66.7 100.0 100.0 81.8 11
≥ 32,000 0.0 0.0 0.0 0.0 0.0 25.0 4
Wealth quintile of household
Poorest 100.0 83.3 83.3 100.0 85.7 31.7 41
Second 100.0 100.0 100.0 100.0 100.0 50.0 29
Middle 100.0 85.7 85.7 100.0 66.7 38.9 19
Fourth 0.0 0.0 0.0 0.0 100.0 61.5 13
Richest 100.0 100.0 100.0 100.0 100.0 60.0 6
Overall 100.0 91.3 91.3 100.0 88.9 42.7 108
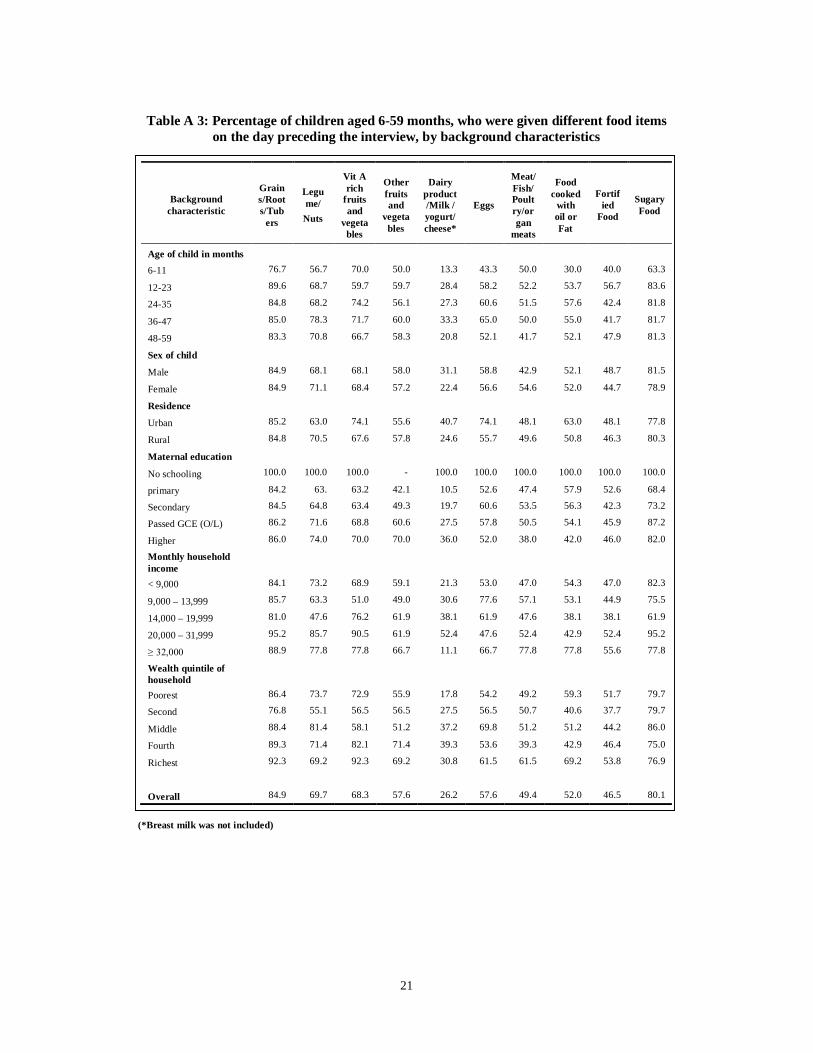
21
Table A 3: Percentage of children aged 6-59 months, who were given different food items on the day preceding the interview, by background characteristics
Background characteristic
Grains/Roots/Tub
ers
Legume/
Nuts
Vit A rich
fruits and
vegetables
Other fruits and
vegetables
Dairy product/Milk / yogurt/ cheese*
Eggs
Meat/Fish/Poultry/organ
meats
Food cooked
with oil or Fat
Fortified
Food
Sugary Food
Age of child in months
6-11 76.7 56.7 70.0 50.0 13.3 43.3 50.0 30.0 40.0 63.3
12-23 89.6 68.7 59.7 59.7 28.4 58.2 52.2 53.7 56.7 83.6
24-35 84.8 68.2 74.2 56.1 27.3 60.6 51.5 57.6 42.4 81.8
36-47 85.0 78.3 71.7 60.0 33.3 65.0 50.0 55.0 41.7 81.7
48-59 83.3 70.8 66.7 58.3 20.8 52.1 41.7 52.1 47.9 81.3
Sex of child
Male 84.9 68.1 68.1 58.0 31.1 58.8 42.9 52.1 48.7 81.5
Female 84.9 71.1 68.4 57.2 22.4 56.6 54.6 52.0 44.7 78.9
Residence
Urban 85.2 63.0 74.1 55.6 40.7 74.1 48.1 63.0 48.1 77.8
Rural 84.8 70.5 67.6 57.8 24.6 55.7 49.6 50.8 46.3 80.3
Maternal education
No schooling 100.0 100.0 100.0 - 100.0 100.0 100.0 100.0 100.0 100.0
primary 84.2 63. 63.2 42.1 10.5 52.6 47.4 57.9 52.6 68.4
Secondary 84.5 64.8 63.4 49.3 19.7 60.6 53.5 56.3 42.3 73.2
Passed GCE (O/L) 86.2 71.6 68.8 60.6 27.5 57.8 50.5 54.1 45.9 87.2
Higher 86.0 74.0 70.0 70.0 36.0 52.0 38.0 42.0 46.0 82.0
Monthly household income
< 9,000 84.1 73.2 68.9 59.1 21.3 53.0 47.0 54.3 47.0 82.3
9,000 – 13,999 85.7 63.3 51.0 49.0 30.6 77.6 57.1 53.1 44.9 75.5
14,000 – 19,999 81.0 47.6 76.2 61.9 38.1 61.9 47.6 38.1 38.1 61.9
20,000 – 31,999 95.2 85.7 90.5 61.9 52.4 47.6 52.4 42.9 52.4 95.2
≥ 32,000 88.9 77.8 77.8 66.7 11.1 66.7 77.8 77.8 55.6 77.8
Wealth quintile of household
Poorest 86.4 73.7 72.9 55.9 17.8 54.2 49.2 59.3 51.7 79.7
Second 76.8 55.1 56.5 56.5 27.5 56.5 50.7 40.6 37.7 79.7
Middle 88.4 81.4 58.1 51.2 37.2 69.8 51.2 51.2 44.2 86.0
Fourth 89.3 71.4 82.1 71.4 39.3 53.6 39.3 42.9 46.4 75.0
Richest 92.3 69.2 92.3 69.2 30.8 61.5 61.5 69.2 53.8 76.9
Overall 84.9 69.7 68.3 57.6 26.2 57.6 49.4 52.0 46.5 80.1
(*Breast milk was not included)

22
Table A 4: Individual dietary diversity score in children (IDDS) according to background characteristics for children 6 – 59 months
Background characteristic IDDS (range 0-8) % of individuals yet to
achieve the target Total number of children
Mean SD
Age of child in months
6-11 3.9 1.6 90.0 27
12-23 4.7 2.0 64.2 43
24-35 4.8 2.1 60.6 40
36-47 5.0 2.0 60.0 36
48-59 4.5 1.8 70.8 34
Sex of child
Male 4.6 1.9 66.4 79
Female 4.7 2.0 66.4 101
Residence
Urban 5.0 2.4 51.9 14
Rural 4.6 1.9 68.0 166
Maternal education
No schooling 7.0 - - 1
Primary 4.2 2.4 63.2 12
Secondary 4.5 1.7 71.8 51
Passed GCE (O/L) 4.8 1.8 68.8 75
Higher 4.7 2.0 60.0 30
Monthly household income
< 9,000 4.6 2.0 66.5 109
9,000 – 13,999 4.7 1.6 71.4 35
14,000 – 19,999 4.5 2.0 71.4 15
20,000 – 31,999 5.3 1.5 52.4 11
≥ 32,000 5.4 2.2 33.3 3
Wealth quintile of household
Poorest 4.7 1.8 66.1 78
Second 4.2 2.1 72.5 50
Middle 4.9 1.7 69.8 30
Fourth 4.9 2.0 60.7 17
Richest 5.5 2.4 38.5 5
Overall 4.7 1.9 66.4 180

23
Table A 5: Minimum meal frequency, dietary diversity, and minimum acceptable diet in children 6-23 months, by background characteristics
Background characteristic
Minimum meal frequency
Minimum Dietary
diversity score, Mean (range 0-7)
% with minimal dietary
diversity (≥4 groups)
Percentage of
minimum acceptable
diet
Total no. of children
Breastfed Non- Breastfed
Age group in months
6-8 25.0 0.0 3.3 61.1 5.6 18
9-11 0.0 12.5 4.0 66.7 0.0 12
12-14 0.0 33.3 3.7 66.7 16.7 12
15-17 0.0 26.7 4.3 68.8 12.5 16
18-20 0.0 30.8 4.3 75.0 25.0 16
21-23 0.0 23.8 4.3 82.6 21.7 23
Sex of child
Male 20.0 27.8 3.8 63.4 19.5 41
Female 0.0 17.0 4.2 76.8 10.7 56
Residence
Urban 0.0 20.0 3.5 66.7 16.7 6
Rural 7.7 21.8 4.0 71.4 14.3 91
Maternal education
No schooling 0.0 0.0 0.0 0.0 0.0 0
Primary 0.0 16.7 3.8 66.7 0.0 6
Secondary 0.0 20.0 3.7 65.0 5.0 20
Passed GCE (O/L) 0.0 34.4 3.9 66.7 25.0 36
Higher 20.0 8.7 4.4 82.1 10.7 28
Monthly household income
< 9,000 0.0 17.1 z 64.0 10.0 50
9,000 – 13,999 0.0 45.0 4.0 72.7 27.3 22
14,000 – 19,999 0.0 0.0 3.9 71.4 0.0 7
20,000 – 31,999 50.0 11.1 4.6 90.9 18.2 11
≥ 32,000 0.0 0.0 5.5 100.0 25.0 4
Wealth quintile of household
Poorest 0.0 17.1 3.9 71.8 10.3 39
Second 0.0 15.8 3.7 60.0 8.0 25
Middle 33.3 33.3 3.8 66.7 26.7 15
Fourth 0.0 25.0 4.8 91.7 16.7 12
Richest 0.0 40.0 4.7 83.3 33.3 6
Overall 7.1 21.7 4.0 71.1 14.4 97
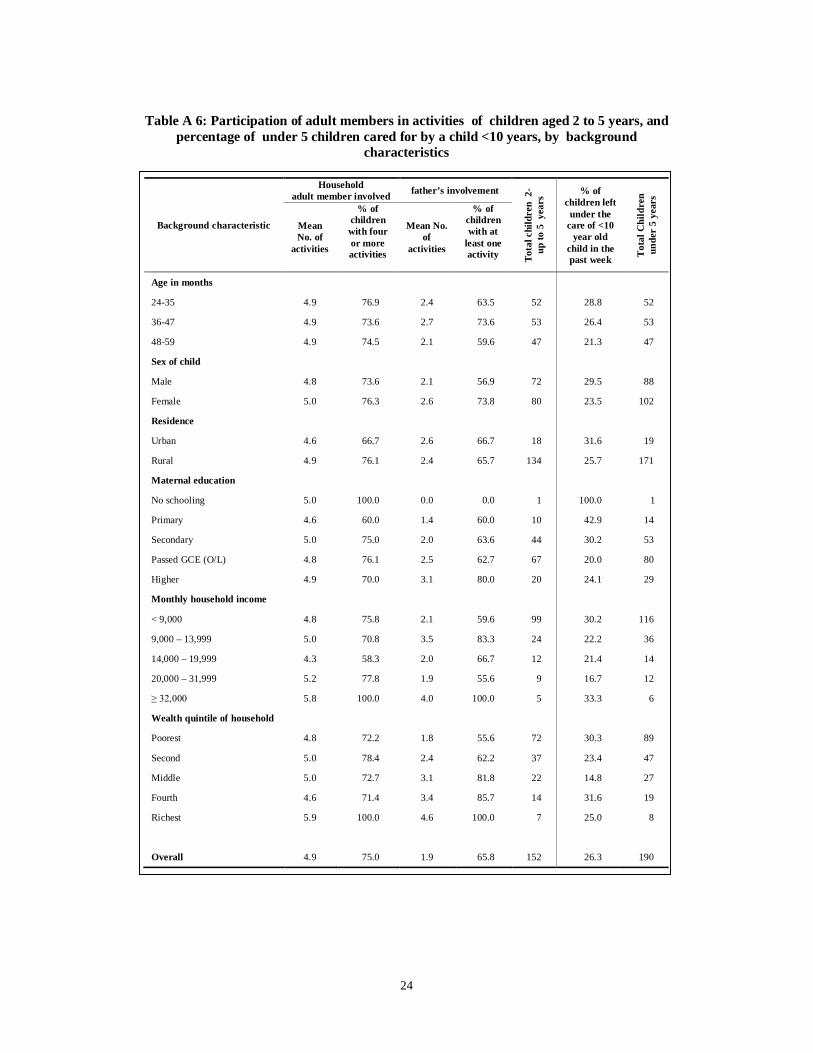
24
Table A 6: Participation of adult members in activities of children aged 2 to 5 years, and percentage of under 5 children cared for by a child <10 years, by background
characteristics
Background characteristic
Household adult member involved father’s involvement
Tota
l chi
ldre
n 2
- up
to 5
yea
rs % of
children left under the
care of <10 year old
child in the past week T
otal
Chi
ldre
n un
der
5 ye
ars
Mean No. of
activities
% of children with four or more activities
Mean No. of
activities
% of children with at
least one activity
Age in months
24-35 4.9 76.9 2.4 63.5 52 28.8 52
36-47 4.9 73.6 2.7 73.6 53 26.4 53
48-59 4.9 74.5 2.1 59.6 47 21.3 47
Sex of child
Male 4.8 73.6 2.1 56.9 72 29.5 88
Female 5.0 76.3 2.6 73.8 80 23.5 102
Residence
Urban 4.6 66.7 2.6 66.7 18 31.6 19
Rural 4.9 76.1 2.4 65.7 134 25.7 171
Maternal education
No schooling 5.0 100.0 0.0 0.0 1 100.0 1
Primary 4.6 60.0 1.4 60.0 10 42.9 14
Secondary 5.0 75.0 2.0 63.6 44 30.2 53
Passed GCE (O/L) 4.8 76.1 2.5 62.7 67 20.0 80
Higher 4.9 70.0 3.1 80.0 20 24.1 29
Monthly household income
< 9,000 4.8 75.8 2.1 59.6 99 30.2 116
9,000 – 13,999 5.0 70.8 3.5 83.3 24 22.2 36
14,000 – 19,999 4.3 58.3 2.0 66.7 12 21.4 14
20,000 – 31,999 5.2 77.8 1.9 55.6 9 16.7 12
≥ 32,000 5.8 100.0 4.0 100.0 5 33.3 6
Wealth quintile of household
Poorest 4.8 72.2 1.8 55.6 72 30.3 89
Second 5.0 78.4 2.4 62.2 37 23.4 47
Middle 5.0 72.7 3.1 81.8 22 14.8 27
Fourth 4.6 71.4 3.4 85.7 14 31.6 19
Richest 5.9 100.0 4.6 100.0 7 25.0 8
Overall 4.9 75.0 1.9 65.8 152 26.3 190
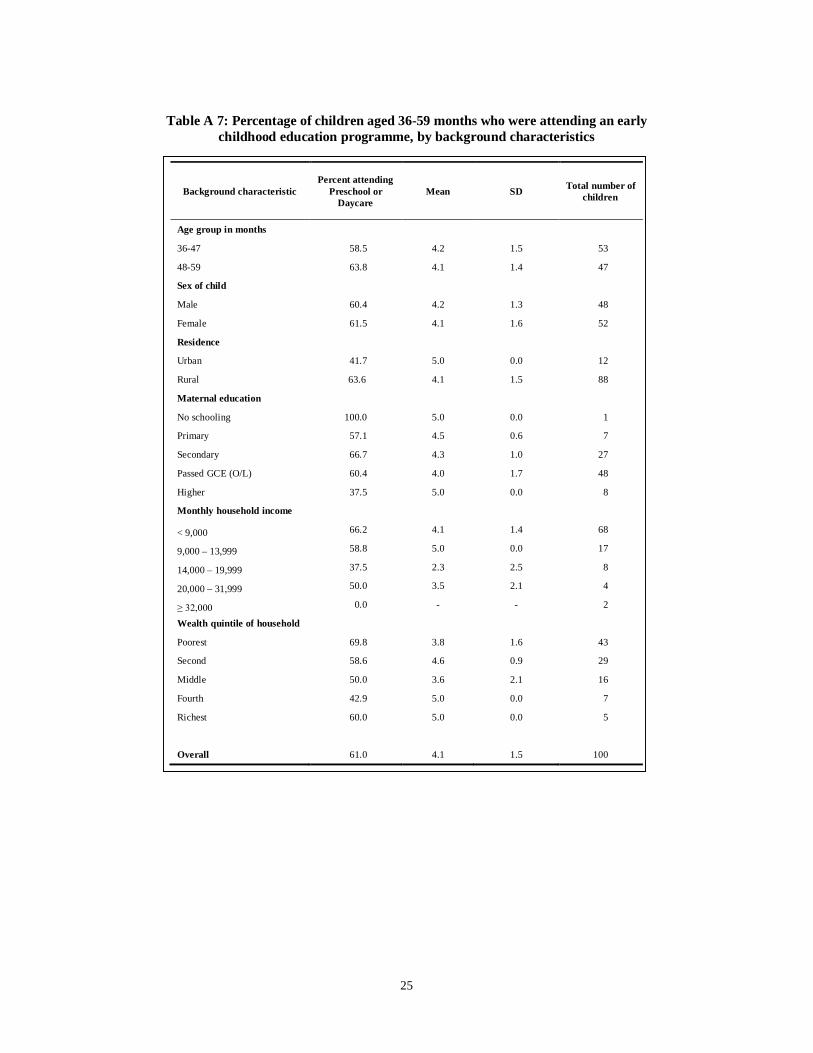
25
Table A 7: Percentage of children aged 36-59 months who were attending an early childhood education programme, by background characteristics
Background characteristic Percent attending
Preschool or Daycare
Mean SD Total number of children
Age group in months
36-47 58.5 4.2 1.5 53
48-59 63.8 4.1 1.4 47
Sex of child
Male 60.4 4.2 1.3 48
Female 61.5 4.1 1.6 52
Residence
Urban 41.7 5.0 0.0 12
Rural 63.6 4.1 1.5 88
Maternal education
No schooling 100.0 5.0 0.0 1
Primary 57.1 4.5 0.6 7
Secondary 66.7 4.3 1.0 27
Passed GCE (O/L) 60.4 4.0 1.7 48
Higher 37.5 5.0 0.0 8
Monthly household income
< 9,000 66.2 4.1 1.4 68
9,000 – 13,999 58.8 5.0 0.0 17
14,000 – 19,999 37.5 2.3 2.5 8
20,000 – 31,999 50.0 3.5 2.1 4
≥ 32,000 0.0 - - 2
Wealth quintile of household
Poorest 69.8 3.8 1.6 43
Second 58.6 4.6 0.9 29
Middle 50.0 3.6 2.1 16
Fourth 42.9 5.0 0.0 7
Richest 60.0 5.0 0.0 5
Overall 61.0 4.1 1.5 100
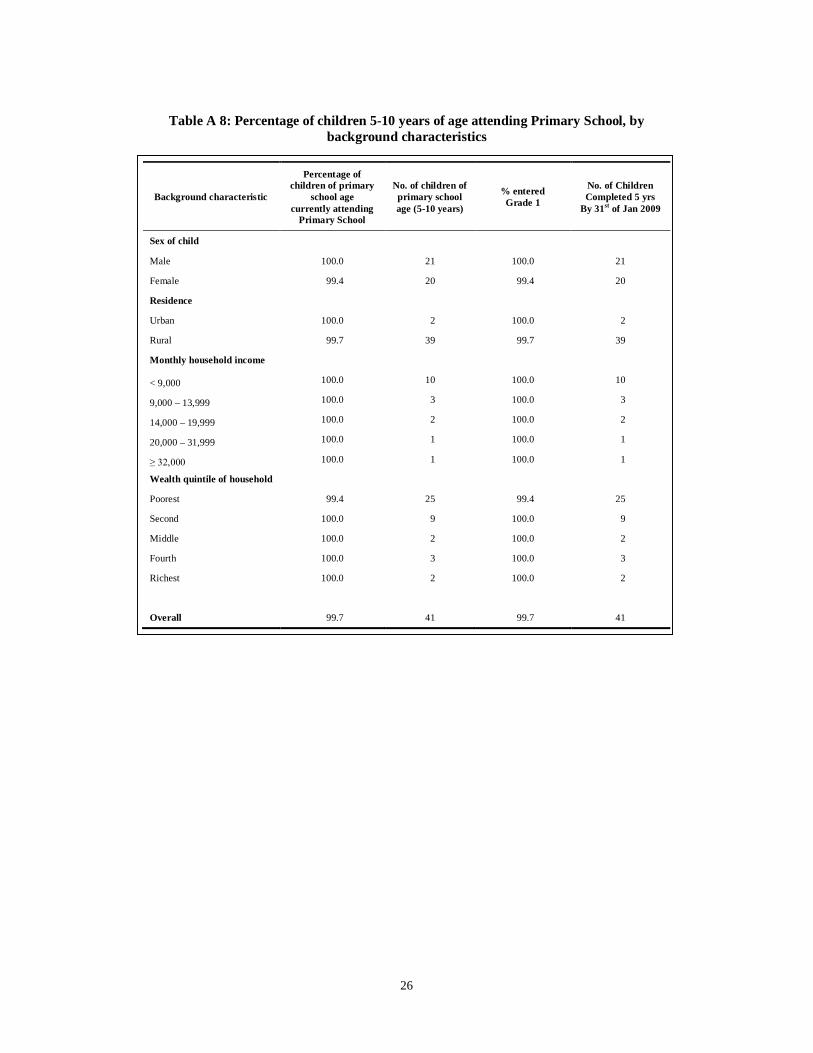
26
Table A 8: Percentage of children 5-10 years of age attending Primary School, by background characteristics
Background characteristic
Percentage of children of primary
school age currently attending
Primary School
No. of children of primary school age (5-10 years)
% entered Grade 1
No. of Children Completed 5 yrs
By 31st of Jan 2009
Sex of child Male 100.0 21 100.0 21
Female 99.4 20 99.4 20
Residence
Urban 100.0 2 100.0 2
Rural 99.7 39 99.7 39
Monthly household income
< 9,000 100.0 10 100.0 10
9,000 – 13,999 100.0 3 100.0 3
14,000 – 19,999 100.0 2 100.0 2
20,000 – 31,999 100.0 1 100.0 1
≥ 32,000 100.0 1 100.0 1
Wealth quintile of household
Poorest 99.4 25 99.4 25
Second 100.0 9 100.0 9
Middle 100.0 2 100.0 2
Fourth 100.0 3 100.0 3
Richest 100.0 2 100.0 2
Overall 99.7 41 99.7 41

27
Table A 9: Use of different types of play items by children under 5 years of age, according to background characteristics
Background characteristic
Percentage of children who play with: Total number of children <5
year Household
objects Outdoor material
Homemade toys
Ready-made toys
3 or more types of
play items Age group in months
24-35 82.7 84.3 84.6 46.2 65.4 52
36-47 86.5 86.5 84.9 50.0 66.0 53
48-59 85.1 82.6 80.9 44.7 68.1 47
Sex of child
Male 80.3 84.1 80.6 42.3 61.1 72
Female 88.8 85.0 86.3 51.3 71.3 80
Residence
Urban 94.4 88.9 66.7 55.6 66.7 18
Rural 83.5 84.0 85.8 45.9 66.4 134
Maternal education
No schooling 100.0 100.0 - - - 1
Primary 100.0 80.0 60.0 40.0 60.0 10
Secondary 75.0 83.3 88.6 40.9 61.4 44
Passed GCE (O/L) 85.1 83.6 85.1 44.8 68.7 67
Higher 90.0 85.0 85.0 70.0 75.0 20
Monthly household income
< 9,000 82.7 87.5 81.8 44.9 64.6 99
9,000 – 13,999 95.8 79.2 87.5 37.5 75.0 24
14,000 – 19,999 91.7 83.3 83.3 58.3 58.3 12
20,000 – 31,999 77.8 66.7 88.9 66.7 66.7 9
≥ 32,000 80.0 80.0 80.0 80.0 80.0 5
Wealth quintile of household
Poorest 87.5 87.1 81.9 44.4 72.2 72
Second 78.4 89.2 78.4 40.5 56.8 37
Middle 86.4 77.3 90.9 50.0 68.2 22
Fourth 84.6 69.2 92.9 53.8 50.0 14
Richest 85.7 85.7 85.7 85.7 85.7 7
Overall 84.8 84.6 83.6 47.0 66.4 152
28
Table A 10: Percentage of children aged 5-14 years who are involved in child labour activities, and mean hours per week, by background characteristics
Background characteristic
Working outside household in the previous week
Working outside household in the last year Total number of
children aged 5-14 year Paid
work Unpaid work
Mean hours per
week Paid work Unpaid
work
Age group in years
9-11 0.0 31.1 4.4 0.0 24.6 74
12-14 0.0 25.6 5.0 0.0 20.8 78
Sex of child
Male 0.9 25.9 3.8 1.0 21.0 108
Female 0.0 28.6 5.1 1.0 21.2 113
Residence
Urban 0.0 0.0 0.0 0.0 0.0 33
Rural 0.5 32.1 4.5 1.2 25.3 188
Monthly household income
< 9,000 1.2 32.9 4.3 1.3 26.3 85
9,000 – 13,999 0.0 8.3 1.0 0.0 4.5 25
14,000 – 19,999 0.0 30.0 5.0 0.0 27.8 20
20,000 – 31,999 0.0 0.0 0.0 0.0 0.0 10
≥ 32,000 0.0 0.0 0.0 0.0 0.0 0
Wealth quintile of household
Poorest 0.0 33.3 4.3 0.0 26.0 111
Second 0.0 30.4 4.9 2.1 18.8 56
Middle 3.3 13.3 4.0 3.8 15.4 30
Fourth 0.0 13.3 5.0 0.0 15.4 16
Richest 0.0 0.0 0.0 0.0 0.0 8
Overall 0.5 27.3 4.5 1.0 21.1 221
29
Table A 11: Percentage of children less than 5 years of age who received care at child welfare clinic, by background characteristics
Background characteristic
Availability of CHDR
%
Children Attended
CWC %
% of children whose mothers received advice on % Received
Thriposha*
Total No. of
Children Growth Nutritional status ECCD
Age group in months
<6 90.9 70.0 80.0 85.7 100.0 0.0 11
6-11 83.3 92.3 82.6 78.3 73.9 20.0 30
12-23 94.0 79.0 86.3 90.4 78.0 19.4 67
24-35 84.8 90.0 90.0 90.0 87.2 9.1 66
36-47 95.0 92.5 93.5 91.1 84.4 13.3 60
48-59 91.7 85.0 88.6 89.2 82.9 14.6 48
Sex of child
Male 88.2 88.0 86.5 89.6 80.6 20.2 119
Female 92.3 85.3 90.4 88.1 83.9 10.5 152
Residence
Urban 71.4 95.5 90.9 81.0 76.2 7.4 27
Rural 92.5 85.6 88.3 89.6 83.2 15.6 244 Maternal education**
No schooling 100.0 100.0 100.0 100.0 100.0 0.0 1
Primary 94.7 80.0 100.0 91.7 91.7 10.5 19
Secondary 93.3 82.6 88.9 83.6 83.6 19.7 71
Passed GCE (O/L) 91.2 86.0 85.1 87.5 87.5 11.0 109
Higher 80.8 91.5 92.5 95.0 95.0 20.0 50 Monthly household income***
up to 9000 93.6 88.1 92.5 92.8 89.4 14.6 164
9000-13999 88.0 83.7 85.7 85.7 73.5 14.3 49
14000-19999 72.7 73.3 75.0 69.2 66.7 19.0 21
20000-31999 90.5 89.5 76.5 76.5 58.8 14.3 21
32000 + 77.8 87.5 83.3 100.0 83.3 11.1 9 Wealth quintile of household
Poorest 93.3 86.0 97.7 93.3 89.2 14.4 118
Second 90.4 87.7 87.7 91.1 83.9 13.0 69
Middle 91.5 84.1 81.6 81.6 76.3 16.3 43
Fourth 86.2 96.0 76.2 81.8 70.0 21.4 28
Richest 69.2 70.0 62.5 75.0 62.5 7.7 13
Overall 90.4 86.5 88.6 88.8 82.4 14.8 271
30
Table A 12: Percentage distribution of children who received Vitamin A mega dose supplement at 9, 18 and 36 months, by background characteristics
Background characteristic
Children 9-59 months
Children 18-59 months Children 36-59months Of the
children 36-59,
Percentage never
received Vit A.
Number of
children
% Received Vit A at
9 months
Number of
children
% Received Vit A at
18 months
Number of
children
% Received Vit A at
36 month
% Received 3 doses of Vit A
Sex of child Male 83 81.9 69 82.6 38 86.8 81.1 6.7
Female 134 80.6 110 76.4 53 66.0 63.5 23.2
Residence
Urban 19 78.9 16 81.3 7 57.1 57.1 12.5
Rural 198 81.3 163 78.5 84 76.2 72.0 16.1
Estate 0 0.0 0 0.0 0 0.0 0.0 0.0 Maternal education
No schooling 1 0.0 1 0.0 1 100.0 0.0 0.0
Primary 15 73.3 12 66.7 8 75.0 71.4 25.0
Secondary 59 74.6 50 70.0 26 53.8 50.0 31.0
Passed GCE (O/L) 90 83.3 76 84.2 41 82.9 80.5 9.1
Higher 36 86.1 29 82.8 7 85.7 83.3 0.0 Monthly household income
up to 9000 133 78.9 115 76.5 65 76.9 71.4 16.7
9000-13999 41 87.8 29 79.3 13 76.9 76.9 7.1
14000-19999 14 78.6 12 83.3 7 57.1 57.1 28.6
20000-31999 15 93.3 12 100.0 4 75.0 75.0 0.0
32000 + 8 87.5 6 100.0 1 100.0 100.0 0.0 Wealth quintile of household
Poorest 90 74.4 75 72.0 38 63.2 58.3 30.2
Second 60 81.7 48 77.1 26 80.8 76.9 6.7
Middle 37 91.9 33 87.9 18 77.8 77.8 5.6
Fourth 20 85.0 16 87.5 5 100.0 80.0 0.0
Richest 10 90.0 7 100.0 4 100.0 100.0 0.0
Overall 217 81.1 179 78.8 91 74.7 70.8 15.8
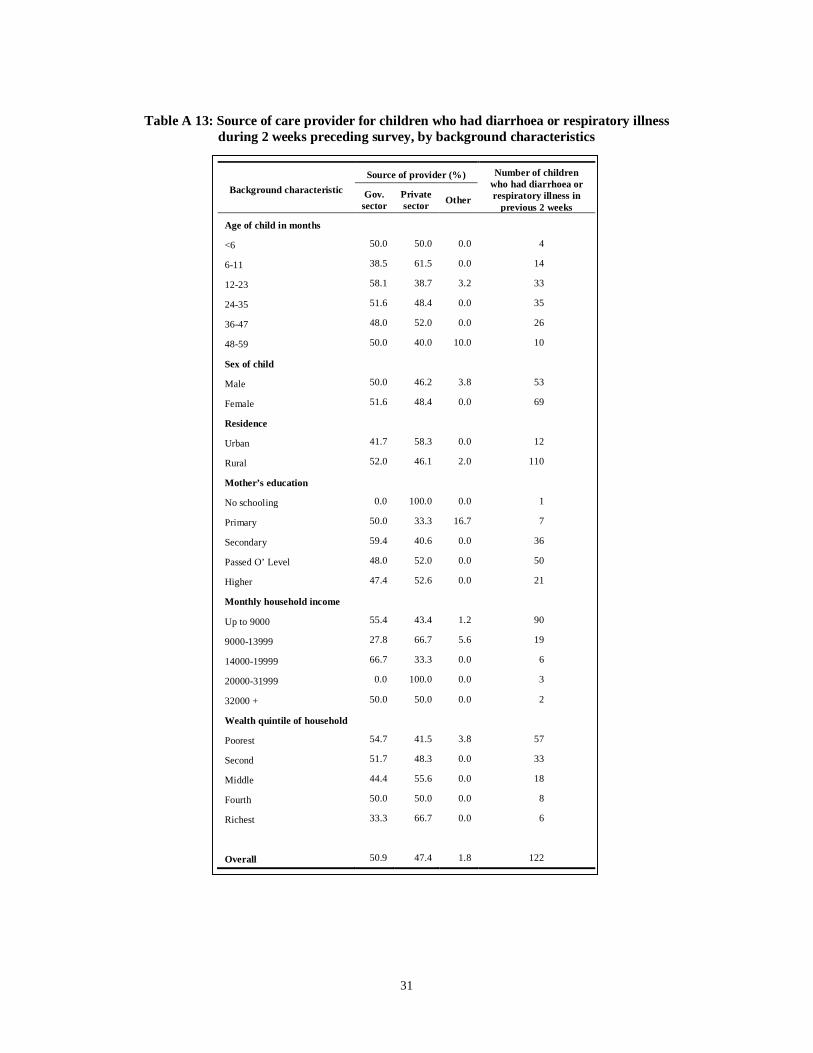
31
Table A 13: Source of care provider for children who had diarrhoea or respiratory illness during 2 weeks preceding survey, by background characteristics
Background characteristic Source of provider (%) Number of children
who had diarrhoea or respiratory illness in
previous 2 weeks Gov.
sector Private sector Other
Age of child in months
<6 50.0 50.0 0.0 4
6-11 38.5 61.5 0.0 14
12-23 58.1 38.7 3.2 33
24-35 51.6 48.4 0.0 35
36-47 48.0 52.0 0.0 26
48-59 50.0 40.0 10.0 10
Sex of child
Male 50.0 46.2 3.8 53
Female 51.6 48.4 0.0 69
Residence
Urban 41.7 58.3 0.0 12
Rural 52.0 46.1 2.0 110
Mother’s education
No schooling 0.0 100.0 0.0 1
Primary 50.0 33.3 16.7 7
Secondary 59.4 40.6 0.0 36
Passed O’ Level 48.0 52.0 0.0 50
Higher 47.4 52.6 0.0 21
Monthly household income
Up to 9000 55.4 43.4 1.2 90
9000-13999 27.8 66.7 5.6 19
14000-19999 66.7 33.3 0.0 6
20000-31999 0.0 100.0 0.0 3
32000 + 50.0 50.0 0.0 2
Wealth quintile of household
Poorest 54.7 41.5 3.8 57
Second 51.7 48.3 0.0 33
Middle 44.4 55.6 0.0 18
Fourth 50.0 50.0 0.0 8
Richest 33.3 66.7 0.0 6
Overall 50.9 47.4 1.8 122
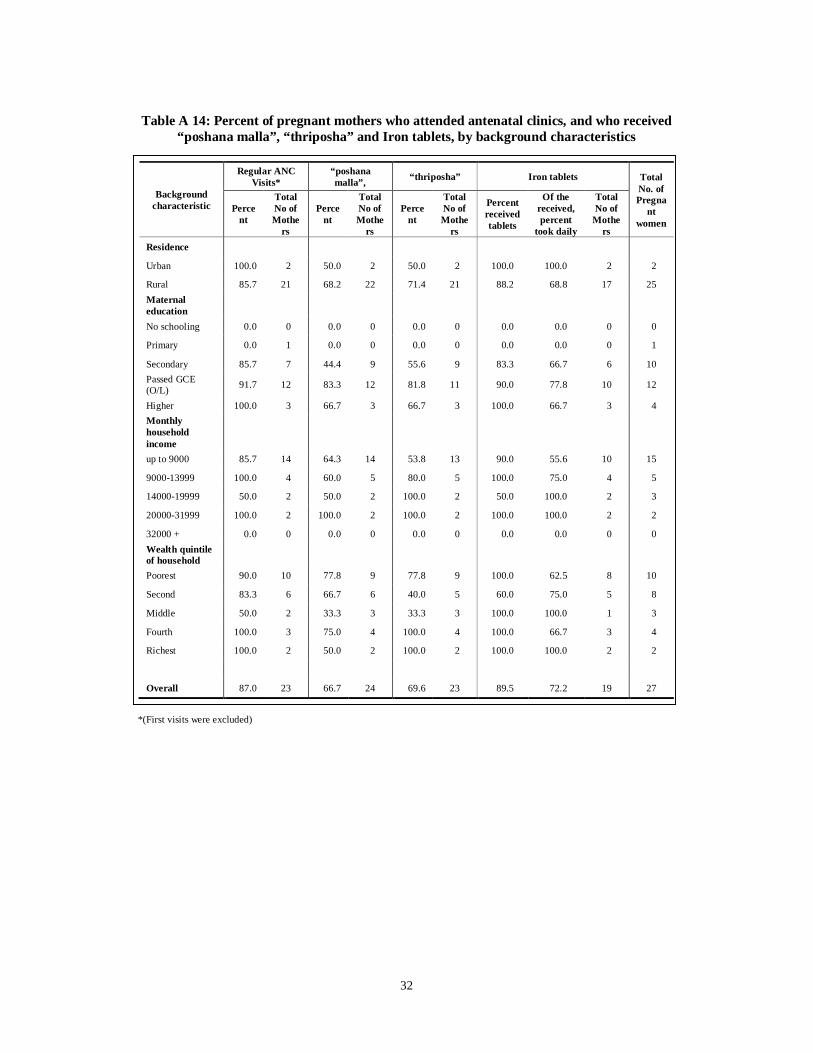
32
Table A 14: Percent of pregnant mothers who attended antenatal clinics, and who received “poshana malla”, “thriposha” and Iron tablets, by background characteristics
Background characteristic
Regular ANC Visits*
“poshana malla”, “thriposha” Iron tablets Total
No. of Pregna
nt women
Percent
Total No of Mothe
rs
Percent
Total No of Mothe
rs
Percent
Total No of Mothe
rs
Percent received tablets
Of the received, percent
took daily
Total No of
Mothers
Residence Urban 100.0 2 50.0 2 50.0 2 100.0 100.0 2 2
Rural 85.7 21 68.2 22 71.4 21 88.2 68.8 17 25 Maternal education
No schooling 0.0 0 0.0 0 0.0 0 0.0 0.0 0 0
Primary 0.0 1 0.0 0 0.0 0 0.0 0.0 0 1
Secondary 85.7 7 44.4 9 55.6 9 83.3 66.7 6 10 Passed GCE (O/L) 91.7 12 83.3 12 81.8 11 90.0 77.8 10 12
Higher 100.0 3 66.7 3 66.7 3 100.0 66.7 3 4 Monthly household income
up to 9000 85.7 14 64.3 14 53.8 13 90.0 55.6 10 15
9000-13999 100.0 4 60.0 5 80.0 5 100.0 75.0 4 5
14000-19999 50.0 2 50.0 2 100.0 2 50.0 100.0 2 3
20000-31999 100.0 2 100.0 2 100.0 2 100.0 100.0 2 2
32000 + 0.0 0 0.0 0 0.0 0 0.0 0.0 0 0 Wealth quintile of household
Poorest 90.0 10 77.8 9 77.8 9 100.0 62.5 8 10
Second 83.3 6 66.7 6 40.0 5 60.0 75.0 5 8
Middle 50.0 2 33.3 3 33.3 3 100.0 100.0 1 3
Fourth 100.0 3 75.0 4 100.0 4 100.0 66.7 3 4
Richest 100.0 2 50.0 2 100.0 2 100.0 100.0 2 2
Overall 87.0 23 66.7 24 69.6 23 89.5 72.2 19 27
*(First visits were excluded)

33
Table A 15: Percentage of lactating mothers who received “thriposha” and Vitamin A by background characteristics
Background characteristic
“thriposha” (child <6 months)
Vitamin A mega dose (child <24 months)
Percent Total No of Women
Percent
Total No of Women
Sector Urban 100.0 1 100.0 4
Rural 66.7 6 94.7 38
Maternal education
No schooling 0.0 0 0.0 0
Primary 0.0 0 0.0 0
Secondary 50.0 2 100.0 9
Passed GCE (O/L) 75.0 4 89.5 19
Higher 100.0 1 100.0 13
Monthly household income
up to 9000 66.7 6 91.7 24
9000-13999 0.0 0 100.0 6
14000-19999 100.0 1 100.0 5
20000-31999 0.0 0 100.0 5
32000 + 0.0 0 0.0 0 Wealth quintile of household
Poorest 50.0 2 86.7 15
Second 66.7 3 100.0 12
Middle 100.0 2 100.0 9
Fourth 0.0 0 100.0 5
Richest 0.0 0 100.0 1
Overall 71.4 7 95.2 42

34
Table A 16: “Samurdhi” beneficiaries” among women 15-49 years by background characteristics
Background characteristic
Pregnant Lactating Non-pregnant & non- lactating
Percent Total No
of Women
Percent Total No
of Women
Percent Total No
of Women
Residence Urban 50.0 2 28.6 7 16.7 18
Rural 28.0 25 41.5 53 44.8 183
Maternal education
No schooling 0.0 0 0.0 0 50.0 2
Primary 0.0 1 66.7 3 59.3 27
Secondary 50.0 10 61.5 13 55.2 58
Passed GCE (O/L) 25.0 12 38.5 26 35.1 77
Higher 0.0 4 23.5 17 24.3 37
Monthly household income
Up to 9000 33.3 15 54.3 35 47.3 110
9000-13999 60.0 5 37.5 8 37.5 32
14000-19999 0.0 3 16.7 6 42.9 14
20000-31999 0.0 2 0.0 8 20.0 10
32000 + 0.0 0 0.0 0 0.0 0
Wealth quintile of household
Poorest 50.0 10 52.2 23 60.0 90
Second 12.5 8 60.0 15 21.6 51
Middle 66.7 3 15.4 13 43.8 32
Fourth 0.0 4 14.3 7 19.0 21
Richest 0.0 2 0.0 2 28.6 7
Overall 29.6 27 40.0 60 42.3 201
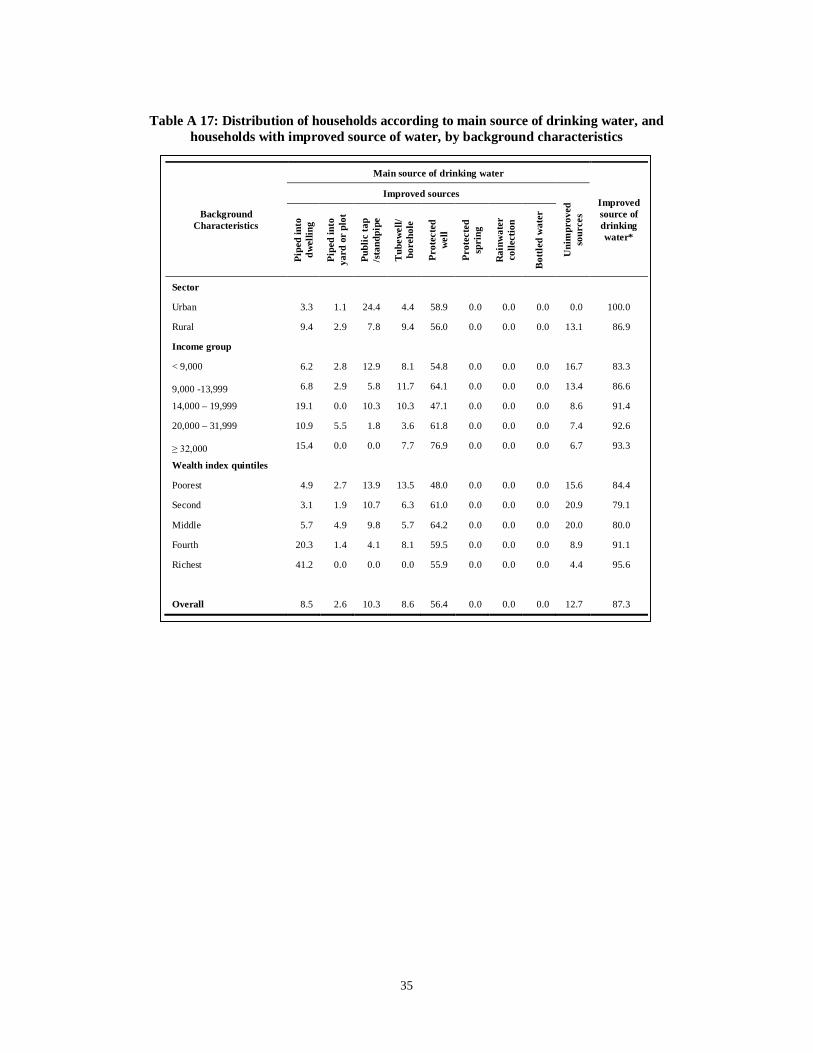
35
Table A 17: Distribution of households according to main source of drinking water, and households with improved source of water, by background characteristics
Background Characteristics
Main source of drinking water
Improved source of drinking water*
Improved sources
Uni
mpr
oved
so
urce
s
Pipe
d in
to
dwel
ling
Pipe
d in
to
yard
or
plot
Publ
ic ta
p /s
tand
pipe
Tub
ewel
l/ bo
reho
le
Prot
ecte
d w
ell
Prot
ecte
d sp
ring
Rai
nwat
er
colle
ctio
n
Bot
tled
wat
er
Sector Urban 3.3 1.1 24.4 4.4 58.9 0.0 0.0 0.0 0.0 100.0
Rural 9.4 2.9 7.8 9.4 56.0 0.0 0.0 0.0 13.1 86.9
Income group
< 9,000 6.2 2.8 12.9 8.1 54.8 0.0 0.0 0.0 16.7 83.3
9,000 -13,999 6.8 2.9 5.8 11.7 64.1 0.0 0.0 0.0 13.4 86.6
14,000 – 19,999 19.1 0.0 10.3 10.3 47.1 0.0 0.0 0.0 8.6 91.4
20,000 – 31,999 10.9 5.5 1.8 3.6 61.8 0.0 0.0 0.0 7.4 92.6
≥ 32,000 15.4 0.0 0.0 7.7 76.9 0.0 0.0 0.0 6.7 93.3
Wealth index quintiles
Poorest 4.9 2.7 13.9 13.5 48.0 0.0 0.0 0.0 15.6 84.4
Second 3.1 1.9 10.7 6.3 61.0 0.0 0.0 0.0 20.9 79.1
Middle 5.7 4.9 9.8 5.7 64.2 0.0 0.0 0.0 20.0 80.0
Fourth 20.3 1.4 4.1 8.1 59.5 0.0 0.0 0.0 8.9 91.1
Richest 41.2 0.0 0.0 0.0 55.9 0.0 0.0 0.0 4.4 95.6
Overall 8.5 2.6 10.3 8.6 56.4 0.0 0.0 0.0 12.7 87.3

36
Table A 18: Distribution of households according to drinking water treatment methods used, by background characteristics*
Background Characteristics
Water treatment method used in the household
Appropriate water
treatment method *
Total No of
household Non
e
Boil
Add
bl
each
/chl
orin
e
Stra
in th
roug
h a
clot
h
Use
wat
er fi
lter
Sola
r di
sinfe
ctio
n
Let i
t sta
nd a
nd
sett
le
Oth
er
Sector
Urban 59.6 20.0 33.3 1.1 0.0 1.1 4.4 0.0 53.3 90
Rural 67.2 36.9 27.7 2.3 0.6 1.7 8.0 0.4 60.0 523
Wealth index quintiles
Poorest 64.1 35.0 26.9 2.2 0.0 1.8 5.4 0.0 58.7 223
Second 66.0 29.6 28.3 1.9 1.9 1.9 10.1 0.0 56.6 159
Middle 59.8 26.8 29.3 3.3 0.0 2.4 7.3 0.8 52.8 123
Fourth 75.3 43.2 32.4 1.4 0.0 0.0 12.2 0.0 64.9 74
Richest 82.4 61.8 29.4 0.0 0.0 0.0 0.0 2.9 82.4 34
Income group
< 9,000 66.3 33.4 28.7 3.1 0.6 2.5 8.4 0.3 58.1 356
9,000 – 13,999 60.2 31.1 32.0 1.0 1.0 0.0 6.8 0.0 55.3 103
14,000 – 19,999 73.1 42.6 29.4 1.5 0.0 0.0 4.4 0.0 67.6 68
20,000 – 31,999 74.1 38.2 23.6 0.0 0.0 1.8 10.9 0.0 63.6 55
≥ 32,000 84.6 61.5 23.1 0.0 0.0 0.0 0.0 7.7 84.6 13
Overall 66.1 34.4 28.5 2.1 0.5 1.6 7.5 0.3 59.1 613

37
Table A 19: Distribution of households according to type of toilet , by background characteristics
Background Characteristics
Type of toilet facility used by household Percentage of population using sanitary means of
excreta disposal *
Number of households
Flush Pit Temporary
No toilet Missing
Sector
Urban 93.3 3.3 1.1 2.2 0.0 93.3 90 Rural 83.6 4.8 1.9 9.8 0.0 83.6 523
Wealth index quintiles
Poorest 82.3 5.1 2.5 10.1 0.0 82.3 356
Second 91.3 3.9 0.0 4.9 0.0 91.3 103 Middle 94.1 0.0 0.0 5.9 0.0 94.1 68
Fourth 90.9 7.3 1.8 0.0 0.0 90.9 55
Richest 84.6 7.7 0.0 7.7 0.0 84.6 13
Income group
< 9,000 68.6 4.0 4.5 22.9 0.0 68.6 223
9,000 – 13,999 93.7 4.4 0.6 1.3 0.0 93.7 159
14,000 – 19,999 92.7 7.3 0.0 0.0 0.0 92.7 123
20,000 – 31,999 95.9 4.1 0.0 0.0 0.0 95.9 74
≥ 32,000 100.0 0.0 0.0 0.0 0.0 100.0 34
Overall 85.0 4.6 1.8 8.6 0.0 85.0 613
Table A 20: Distribution of households using both improved drinking water sources and
sanitary means of excreta disposal, by background characteristics
Background Characteristics
Percentage of household population
using improved sources of drinking water *
Percentage of household population using sanitary means of excreta disposal **
Percentage of household population using improved sources of drinking water and using sanitary means of
excreta disposal
Number of
household
Sector Urban 92.2 93.3 85.6 90 Rural 85.5 83.6 71.5 523 Wealth index quintiles
Poorest 84.8 82.3 69.9 356 Second 91.3 91.3 83.5 103 Middle 86.8 94.1 82.4 68 Fourth 83.6 90.9 74.5 55 Richest 100.0 84.6 84.6 13
Income group
< 9,000 83.0 68.6 57.4 223
9,000 – 13,999 83.0 93.7 76.7 159
14,000 – 19,999 90.2 92.7 82.9 123
20,000 – 31,999 93.2 95.9 89.2 74
≥ 32,000 97.1 100.0 97.1 34
Overall 86.5 85.0 73.6 613
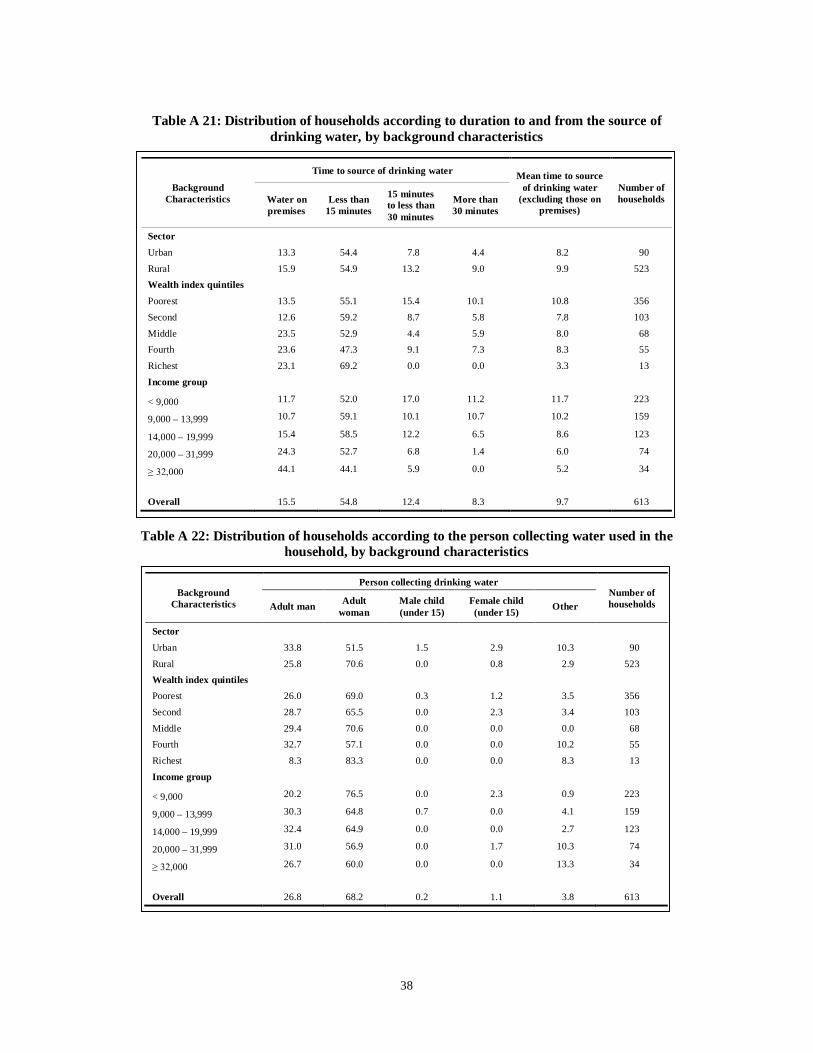
38
Table A 21: Distribution of households according to duration to and from the source of drinking water, by background characteristics
Background Characteristics
Time to source of drinking water Mean time to source of drinking water
(excluding those on premises)
Number of households Water on
premises Less than
15 minutes
15 minutes to less than 30 minutes
More than 30 minutes
Sector Urban 13.3 54.4 7.8 4.4 8.2 90
Rural 15.9 54.9 13.2 9.0 9.9 523 Wealth index quintiles
Poorest 13.5 55.1 15.4 10.1 10.8 356
Second 12.6 59.2 8.7 5.8 7.8 103
Middle 23.5 52.9 4.4 5.9 8.0 68 Fourth 23.6 47.3 9.1 7.3 8.3 55
Richest 23.1 69.2 0.0 0.0 3.3 13
Income group
< 9,000 11.7 52.0 17.0 11.2 11.7 223
9,000 – 13,999 10.7 59.1 10.1 10.7 10.2 159
14,000 – 19,999 15.4 58.5 12.2 6.5 8.6 123
20,000 – 31,999 24.3 52.7 6.8 1.4 6.0 74
≥ 32,000 44.1 44.1 5.9 0.0 5.2 34
Overall 15.5 54.8 12.4 8.3 9.7 613
Table A 22: Distribution of households according to the person collecting water used in the
household, by background characteristics
Background Characteristics
Person collecting drinking water Number of households Adult man Adult
woman Male child (under 15)
Female child (under 15) Other
Sector
Urban 33.8 51.5 1.5 2.9 10.3 90
Rural 25.8 70.6 0.0 0.8 2.9 523 Wealth index quintiles Poorest 26.0 69.0 0.3 1.2 3.5 356
Second 28.7 65.5 0.0 2.3 3.4 103
Middle 29.4 70.6 0.0 0.0 0.0 68 Fourth 32.7 57.1 0.0 0.0 10.2 55
Richest 8.3 83.3 0.0 0.0 8.3 13
Income group
< 9,000 20.2 76.5 0.0 2.3 0.9 223
9,000 – 13,999 30.3 64.8 0.7 0.0 4.1 159
14,000 – 19,999 32.4 64.9 0.0 0.0 2.7 123
20,000 – 31,999 31.0 56.9 0.0 1.7 10.3 74
≥ 32,000 26.7 60.0 0.0 0.0 13.3 34
Overall 26.8 68.2 0.2 1.1 3.8 613
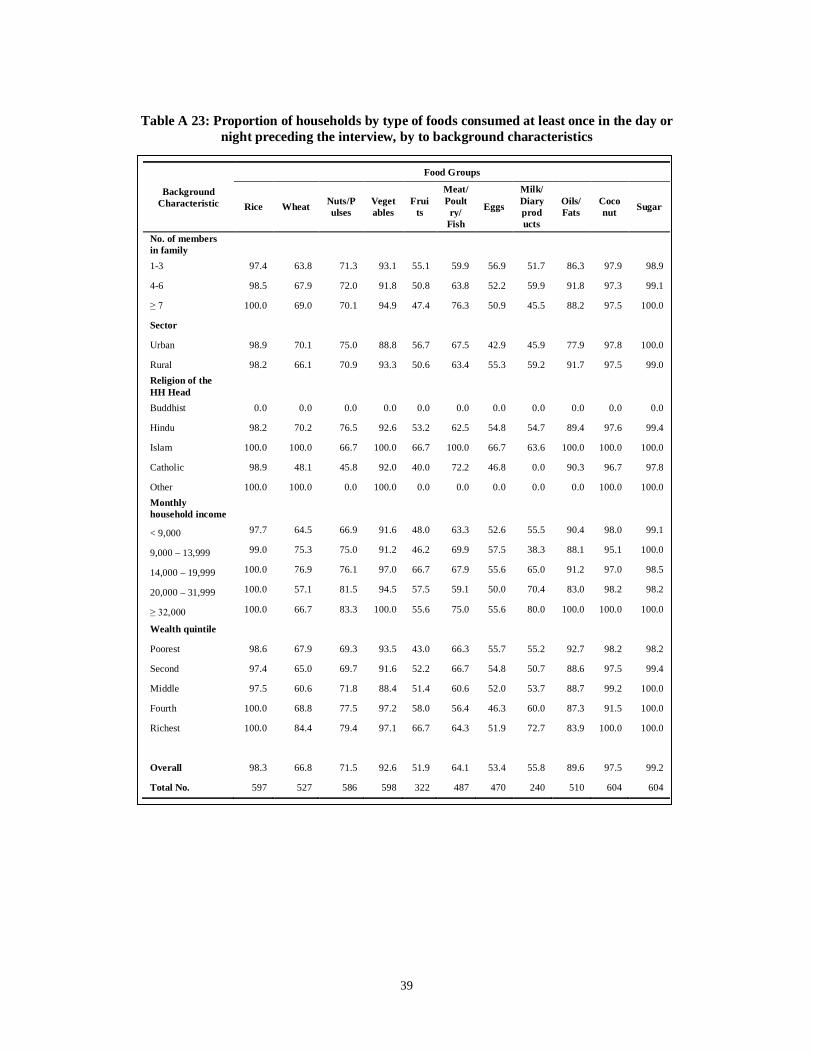
39
Table A 23: Proportion of households by type of foods consumed at least once in the day or night preceding the interview, by to background characteristics
Background Characteristic
Food Groups
Rice Wheat Nuts/Pulses
Vegetables
Fruits
Meat/Poult
ry/ Fish
Eggs
Milk/ Diary products
Oils/Fats
Coconut Sugar
No. of members in family
1-3 97.4 63.8 71.3 93.1 55.1 59.9 56.9 51.7 86.3 97.9 98.9
4-6 98.5 67.9 72.0 91.8 50.8 63.8 52.2 59.9 91.8 97.3 99.1
≥ 7 100.0 69.0 70.1 94.9 47.4 76.3 50.9 45.5 88.2 97.5 100.0
Sector
Urban 98.9 70.1 75.0 88.8 56.7 67.5 42.9 45.9 77.9 97.8 100.0
Rural 98.2 66.1 70.9 93.3 50.6 63.4 55.3 59.2 91.7 97.5 99.0 Religion of the HH Head
Buddhist 0.0 0.0 0.0 0.0 0.0 0.0 0.0 0.0 0.0 0.0 0.0
Hindu 98.2 70.2 76.5 92.6 53.2 62.5 54.8 54.7 89.4 97.6 99.4
Islam 100.0 100.0 66.7 100.0 66.7 100.0 66.7 63.6 100.0 100.0 100.0
Catholic 98.9 48.1 45.8 92.0 40.0 72.2 46.8 0.0 90.3 96.7 97.8
Other 100.0 100.0 0.0 100.0 0.0 0.0 0.0 0.0 0.0 100.0 100.0 Monthly household income
< 9,000 97.7 64.5 66.9 91.6 48.0 63.3 52.6 55.5 90.4 98.0 99.1
9,000 – 13,999 99.0 75.3 75.0 91.2 46.2 69.9 57.5 38.3 88.1 95.1 100.0
14,000 – 19,999 100.0 76.9 76.1 97.0 66.7 67.9 55.6 65.0 91.2 97.0 98.5
20,000 – 31,999 100.0 57.1 81.5 94.5 57.5 59.1 50.0 70.4 83.0 98.2 98.2
≥ 32,000 100.0 66.7 83.3 100.0 55.6 75.0 55.6 80.0 100.0 100.0 100.0
Wealth quintile
Poorest 98.6 67.9 69.3 93.5 43.0 66.3 55.7 55.2 92.7 98.2 98.2
Second 97.4 65.0 69.7 91.6 52.2 66.7 54.8 50.7 88.6 97.5 99.4
Middle 97.5 60.6 71.8 88.4 51.4 60.6 52.0 53.7 88.7 99.2 100.0
Fourth 100.0 68.8 77.5 97.2 58.0 56.4 46.3 60.0 87.3 91.5 100.0
Richest 100.0 84.4 79.4 97.1 66.7 64.3 51.9 72.7 83.9 100.0 100.0
Overall 98.3 66.8 71.5 92.6 51.9 64.1 53.4 55.8 89.6 97.5 99.2
Total No. 597 527 586 598 322 487 470 240 510 604 604

40
Table A 24: Proportion of households by type of foods consumed in 5 days and more preceding the interview, by background characteristics
Background Characteristic
Food Groups
Rice Wheat Nuts/Pulses
Vegetables
Fruits
Meat/Poult
ry/ Fish
Eggs
Milk/Diary products
Oils/Fats
Coconut Sugar
No. of members in family
1-3 97.4 21.4 25.5 64.1 13.5 24.5 13.0 7.8 60.9 96.9 94.8
4-6 96.7 25.1 27.5 66.2 5.7 21.3 13.2 15.6 59.6 99.4 97.3
≥ 7 93.8 18.8 36.3 70.0 2.5 23.8 8.8 12.5 58.8 97.5 97.5
Sector
Urban 98.9 33.7 32.6 57.3 13.5 22.5 4.5 11.2 46.1 97.8 89.9
Rural 96.1 21.3 27.3 67.5 6.8 22.6 13.9 13.0 62.3 98.5 97.7 Religion of the HH Head
Buddhist 0.0 0.0 0.0 0.0 0.0 0.0 0.0 0.0 0.0 0.0 0.0
Hindu 96.4 23.9 30.7 65.5 8.4 18.7 13.1 12.9 59.8 98.2 96.0
Islam 100.0 100.0 66.7 100.0 0.0 0.0 0.0 0.0 100.0 100.0 100.0
Catholic 96.7 16.7 14.4 67.8 5.6 46.7 10.0 8.9 57.8 98.9 98.9
Other 100.0 0.0 0.0 0.0 0.0 0.0 0.0 0.0 0.0 100.0 100.0 Monthly household income
< 9,000 95.4 19.1 26.5 67.5 4.0 27.1 13.7 10.8 60.4 98.9 98.3
9,000 – 13,999 96.1 29.1 27.2 57.3 11.7 14.6 8.7 8.7 50.5 97.1 91.3
14,000 – 19,999 100.0 35.8 25.4 56.7 9.0 17.9 9.0 20.9 62.7 98.5 92.5
20,000 – 31,999 100.0 25.5 41.8 78.2 21.8 20.0 16.4 23.6 74.5 100.0 98.2
≥ 32,000 91.7 16.7 25.0 91.7 16.7 0.0 8.3 16.7 58.3 100.0 100.0
Wealth quintile
Poorest 94.6 19.0 24.9 61.5 2.7 23.5 12.7 8.6 59.3 98.2 97.7
Second 96.2 17.7 24.7 65.2 5.1 25.3 12.0 11.4 53.2 98.7 94.9
Middle 97.5 27.0 30.3 65.6 9.8 21.3 13.1 13.1 65.6 97.5 95.1
Fourth 100.0 33.8 38.0 73.2 18.3 15.5 12.7 16.9 70.4 98.6 97.2
Richest 100.0 38.2 35.3 85.3 23.5 23.5 11.8 35.3 52.9 100.0 100.0
Overall 96.5 23.1 28.1 66.0 7.8 22.6 12.5 12.7 59.9 98.3 96.5
Total No. 606 606 606 606 606 606 606 606 606 606 606

41
Table A 25: Household dietary diversity score according to background characteristics
Background Characteristic
Household diversity score % of households yet to
achieve the target No of households
Mean SD No. of members in Household
1-3 7.0 1.9 80.0 195
4-6 7.3 1.8 74.8 337
≥ 7 7.2 1.9 80.2 81
Sector
Urban 7.5 2.1 66.7 90
Rural 7.2 1.8 79.0 523
Religion of the HH Head
Budddhist
Hindu 7.3 1.8 75.3 507
Islam 9.0 1.7 33.3 3
Catholic 6.4 2.0 85.9 92
Other 5.0 - 100.0 1 Monthly household income
< 9,000 7.0 1.9 81.5 356
9,000 – 13,999 7.4 1.7 76.7 103
14,000 – 19,999 8.1 2.0 58.8 68
20,000 – 31,999 7.6 1.6 72.7 55
≥ 32,000 7.4 3.0 61.5 13
Wealth quintile
Poorest 7.0 1.8 78.0 223
Second 7.3 1.9 76.1 159
Middle 7.2 1.8 82.1 123
Fourth 7.2 2.1 77.0 74
Richest 8.3 1.6 58.8 34
Overall 7.2 1.9 77.2 613
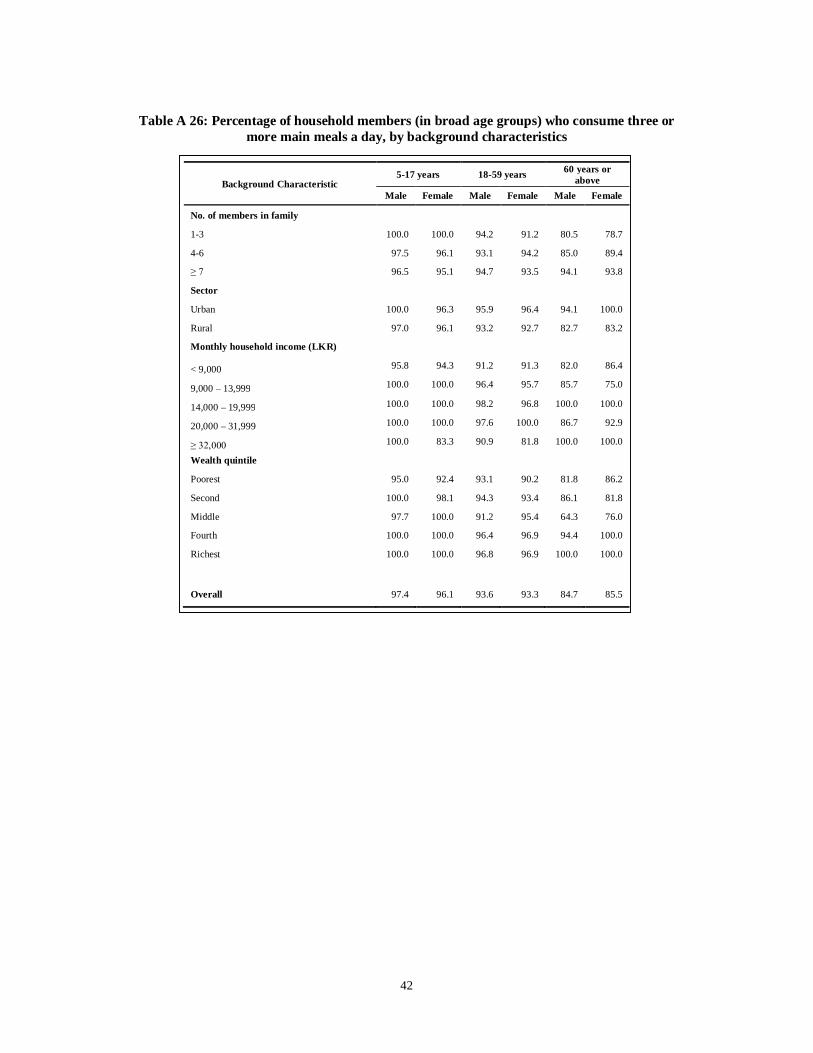
42
Table A 26: Percentage of household members (in broad age groups) who consume three or more main meals a day, by background characteristics
Background Characteristic 5-17 years 18-59 years 60 years or
above Male Female Male Female Male Female
No. of members in family
1-3 100.0 100.0 94.2 91.2 80.5 78.7
4-6 97.5 96.1 93.1 94.2 85.0 89.4
≥ 7 96.5 95.1 94.7 93.5 94.1 93.8
Sector
Urban 100.0 96.3 95.9 96.4 94.1 100.0
Rural 97.0 96.1 93.2 92.7 82.7 83.2
Monthly household income (LKR)
< 9,000 95.8 94.3 91.2 91.3 82.0 86.4
9,000 – 13,999 100.0 100.0 96.4 95.7 85.7 75.0
14,000 – 19,999 100.0 100.0 98.2 96.8 100.0 100.0
20,000 – 31,999 100.0 100.0 97.6 100.0 86.7 92.9
≥ 32,000 100.0 83.3 90.9 81.8 100.0 100.0
Wealth quintile
Poorest 95.0 92.4 93.1 90.2 81.8 86.2
Second 100.0 98.1 94.3 93.4 86.1 81.8
Middle 97.7 100.0 91.2 95.4 64.3 76.0
Fourth 100.0 100.0 96.4 96.9 94.4 100.0
Richest 100.0 100.0 96.8 96.9 100.0 100.0
Overall 97.4 96.1 93.6 93.3 84.7 85.5
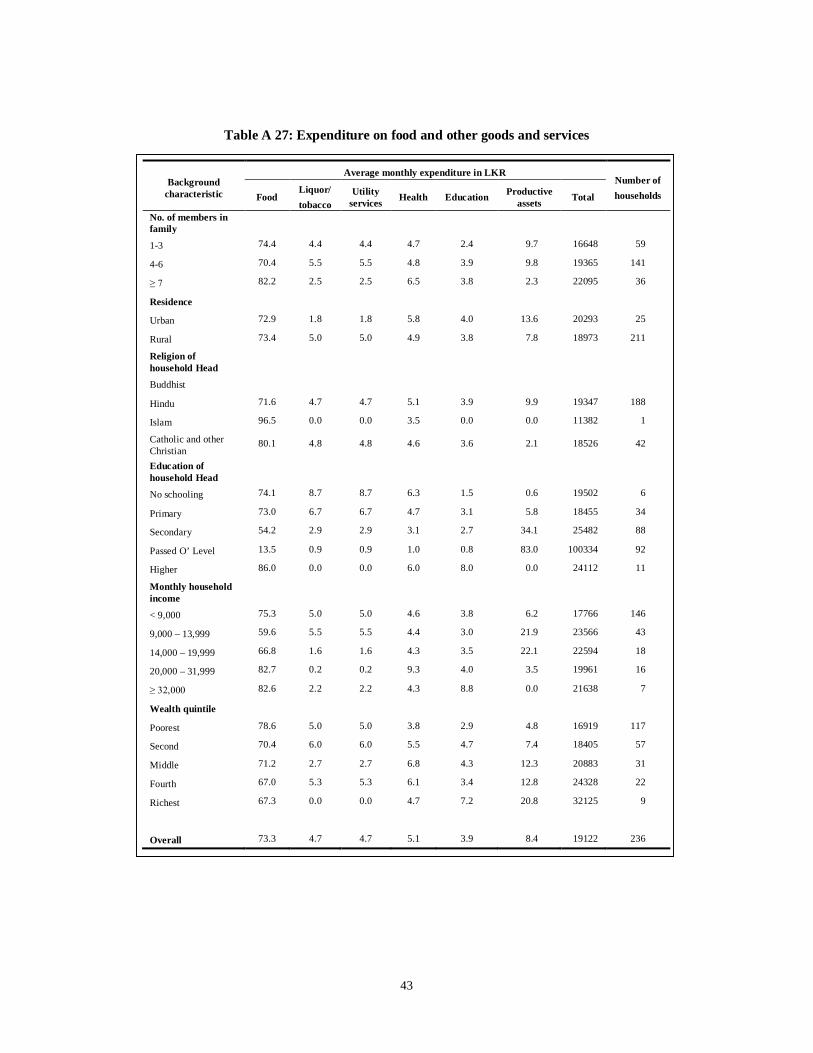
43
Table A 27: Expenditure on food and other goods and services
Background characteristic
Average monthly expenditure in LKR Number of households Food
Liquor/ tobacco
Utility services Health Education Productive
assets Total
No. of members in family
1-3 74.4 4.4 4.4 4.7 2.4 9.7 16648 59
4-6 70.4 5.5 5.5 4.8 3.9 9.8 19365 141
≥ 7 82.2 2.5 2.5 6.5 3.8 2.3 22095 36
Residence
Urban 72.9 1.8 1.8 5.8 4.0 13.6 20293 25
Rural 73.4 5.0 5.0 4.9 3.8 7.8 18973 211
Religion of household Head
Buddhist
Hindu 71.6 4.7 4.7 5.1 3.9 9.9 19347 188
Islam 96.5 0.0 0.0 3.5 0.0 0.0 11382 1
Catholic and other Christian
80.1 4.8 4.8 4.6 3.6 2.1 18526 42
Education of household Head
No schooling 74.1 8.7 8.7 6.3 1.5 0.6 19502 6
Primary 73.0 6.7 6.7 4.7 3.1 5.8 18455 34
Secondary 54.2 2.9 2.9 3.1 2.7 34.1 25482 88
Passed O’ Level 13.5 0.9 0.9 1.0 0.8 83.0 100334 92
Higher 86.0 0.0 0.0 6.0 8.0 0.0 24112 11
Monthly household income
< 9,000 75.3 5.0 5.0 4.6 3.8 6.2 17766 146
9,000 – 13,999 59.6 5.5 5.5 4.4 3.0 21.9 23566 43
14,000 – 19,999 66.8 1.6 1.6 4.3 3.5 22.1 22594 18
20,000 – 31,999 82.7 0.2 0.2 9.3 4.0 3.5 19961 16
≥ 32,000 82.6 2.2 2.2 4.3 8.8 0.0 21638 7
Wealth quintile
Poorest 78.6 5.0 5.0 3.8 2.9 4.8 16919 117
Second 70.4 6.0 6.0 5.5 4.7 7.4 18405 57
Middle 71.2 2.7 2.7 6.8 4.3 12.3 20883 31
Fourth 67.0 5.3 5.3 6.1 3.4 12.8 24328 22
Richest 67.3 0.0 0.0 4.7 7.2 20.8 32125 9
Overall 73.3 4.7 4.7 5.1 3.9 8.4 19122 236

44
Table A 28: Percent of households with coping strategy adopted in the previous 30 days, with its frequency
Coping Strategy
% of households adopted strategy
Total households Never
Ever
Once in a while (1-2 per week)
Pretty often
(3-6 per week)
Daily (>24 days)
Food-related coping strategy
a. Relied on less preferred food 66.2 17.1 10.1 6.7 597
b. Borrowed food 63.3 17.1 14.6 5.0 602
c. Purchased food on credit 67.2 16.2 11.8 4.8 604
d. Consumed seeds held for next season 91.3 5.2 2.0 1.5 598
e. Reduced meal size 64.8 18.3 11.7 5.1 605
f. Reduced number of meals per day 66.6 19.7 9.3 4.5 605
g. Restricted consumption for adults 83.3 9.8 5.0 2.0 605
h. Sent children to live with relatives 94.6 3.6 1.2 0.7 590
i. Reduced expenditure on health and education 81.7 10.0 6.0 2.3 600
Non-food coping strategies % of Households
No Yes Total Households
j. Sold livestock 91.2 8.8 605
k. Pawned jewellary 67.2 32.8 609
l. Sold agricultural tools, seeds 96.2 3.8 607
m. Sold other assets 96.4 3.6 608
n. Used savings 90.1 9.9 608
o. Borrowed money from relatives/neighbours 65.7 34.3 609
p. Took children out of school to earn income 95.1 4.9 608

45
Table A 29: Food-related coping strategies adopted during the 30 days preceding the survey, by background characteristics
Background Characteristic
Percent of households adopted strategy at least once during the preceding 30 days
No
of h
ouse
hold
s ad
opte
d co
ping
st
rate
gies
Rel
ied
on le
ss p
refe
rred
fo
od
Bor
row
ed fo
od
Purc
hase
d fo
od o
n cr
edit
Con
sum
ed s
eeds
hel
d fo
r ne
xt se
ason
Red
uced
mea
l siz
e
Red
uced
num
ber
of
mea
ls p
er d
ay
Res
tric
ted
cons
umpt
ion
for
adul
ts
Sent
chi
ldre
n to
live
w
ith r
elat
ives
Red
uced
exp
endi
ture
on
hea
lth a
nd
educ
atio
n
No. of members in Household
1-3 73 72.6 71.2 68.5 16.4 65.8 58.9 13.7 5.5 13.7
4-6 171 66.7 76.6 64.3 17.0 70.2 66.7 38.0 13.5 42.7
≥ 7 49 71.4 77.6 77.6 22.4 91.8 91.8 53.1 10.2 55.1
Sector
Urban 39 79.5 66.7 64.1 28.2 69.2 69.2 25.6 5.1 25.6
Rural 254 67.3 76.8 68.1 16.1 73.2 68.9 35.8 11.8 39.4
Monthly household income
< 9,000 220 70.9 76.8 68.6 14.5 75.5 70.9 35.5 12.7 36.8
9,000 – 13,999 39 64.1 76.9 66.7 33.3 66.7 64.1 33.3 5.1 41.0
14,000 – 19,999 17 52.9 52.9 52.9 29.4 52.9 58.8 29.4 0.0 29.4
20,000 – 31,999 6 50.0 66.7 66.7 16.7 50.0 50.0 16.7 16.7 50.0
≥ 32,000 1 0.0 0.0 0.0 0.0 0.0 0.0 100.0 0.0 100.0
Wealth quintile
Poorest 147 68.0 81.6 72.8 10.2 80.3 74.8 40.8 15.0 46.3
Second 71 78.9 71.8 67.6 18.3 70.4 66.2 36.6 9.9 39.4
Middle 53 64.2 71.7 66.0 34.0 69.8 66.0 22.6 3.8 17.0
Fourth 17 47.1 52.9 35.3 17.6 35.3 47.1 11.8 5.9 29.4
Richest 5 80.0 60.0 40.0 60.0 40.0 40.0 20.0 0.0 0.0
Overall 293 68.9 75.4 67.6 17.7 72.7 68.9 34.5 10.9 37.5
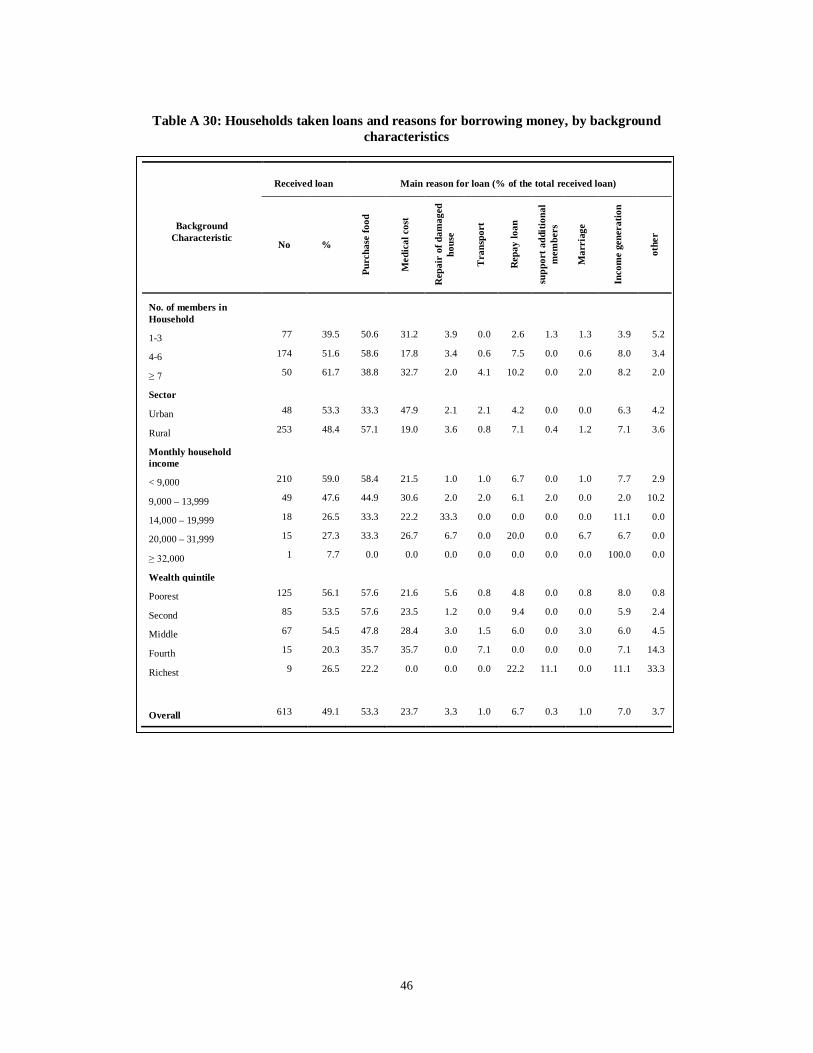
46
Table A 30: Households taken loans and reasons for borrowing money, by background characteristics
Background Characteristic
Received loan Main reason for loan (% of the total received loan)
No %
Purc
hase
food
Med
ical
cos
t
Rep
air
of d
amag
ed
hous
e
Tra
nspo
rt
Rep
ay lo
an
supp
ort a
dditi
onal
m
embe
rs
Mar
riag
e
Inco
me
gene
ratio
n
othe
r
No. of members in Household
1-3 77 39.5 50.6 31.2 3.9 0.0 2.6 1.3 1.3 3.9 5.2
4-6 174 51.6 58.6 17.8 3.4 0.6 7.5 0.0 0.6 8.0 3.4
≥ 7 50 61.7 38.8 32.7 2.0 4.1 10.2 0.0 2.0 8.2 2.0
Sector
Urban 48 53.3 33.3 47.9 2.1 2.1 4.2 0.0 0.0 6.3 4.2
Rural 253 48.4 57.1 19.0 3.6 0.8 7.1 0.4 1.2 7.1 3.6
Monthly household income
< 9,000 210 59.0 58.4 21.5 1.0 1.0 6.7 0.0 1.0 7.7 2.9
9,000 – 13,999 49 47.6 44.9 30.6 2.0 2.0 6.1 2.0 0.0 2.0 10.2
14,000 – 19,999 18 26.5 33.3 22.2 33.3 0.0 0.0 0.0 0.0 11.1 0.0
20,000 – 31,999 15 27.3 33.3 26.7 6.7 0.0 20.0 0.0 6.7 6.7 0.0
≥ 32,000 1 7.7 0.0 0.0 0.0 0.0 0.0 0.0 0.0 100.0 0.0
Wealth quintile
Poorest 125 56.1 57.6 21.6 5.6 0.8 4.8 0.0 0.8 8.0 0.8
Second 85 53.5 57.6 23.5 1.2 0.0 9.4 0.0 0.0 5.9 2.4
Middle 67 54.5 47.8 28.4 3.0 1.5 6.0 0.0 3.0 6.0 4.5
Fourth 15 20.3 35.7 35.7 0.0 7.1 0.0 0.0 0.0 7.1 14.3
Richest 9 26.5 22.2 0.0 0.0 0.0 22.2 11.1 0.0 11.1 33.3
Overall 613 49.1 53.3 23.7 3.3 1.0 6.7 0.3 1.0 7.0 3.7
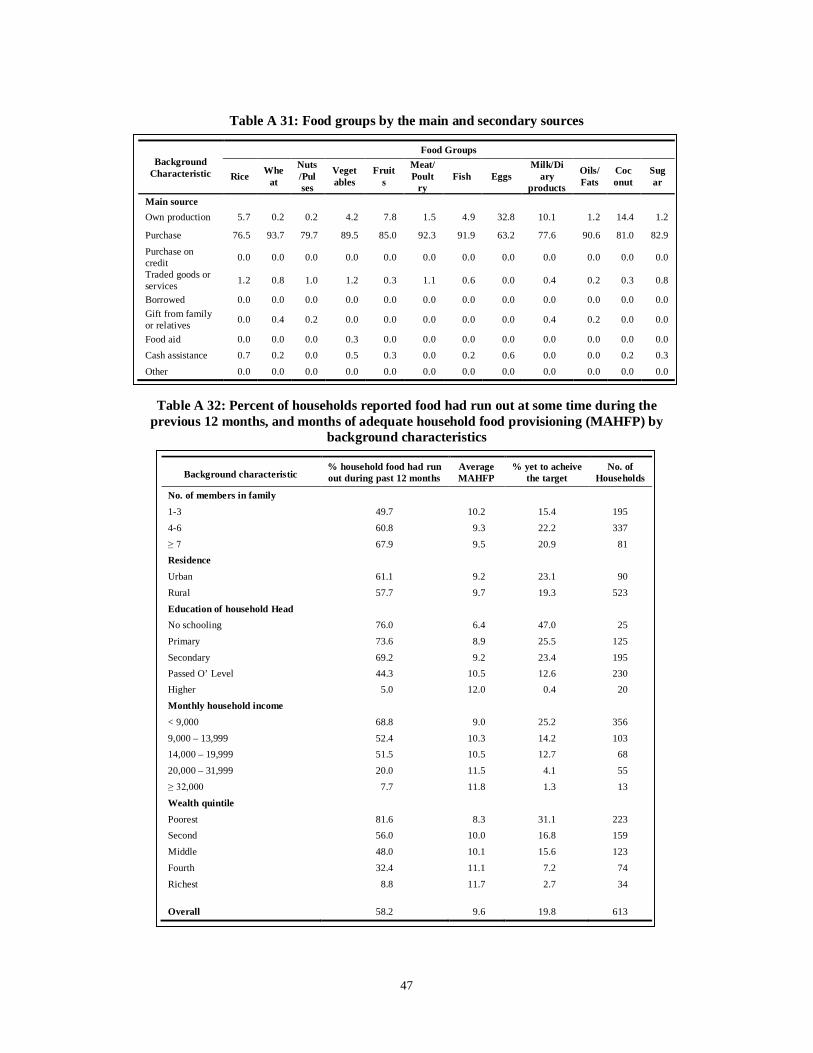
47
Table A 31: Food groups by the main and secondary sources
Background Characteristic
Food Groups
Rice Wheat
Nuts/Pulses
Vegetables
Fruits
Meat/Poult
ry Fish Eggs
Milk/Diary
products
Oils/Fats
Coconut
Sugar
Main source
Own production 5.7 0.2 0.2 4.2 7.8 1.5 4.9 32.8 10.1 1.2 14.4 1.2
Purchase 76.5 93.7 79.7 89.5 85.0 92.3 91.9 63.2 77.6 90.6 81.0 82.9
Purchase on credit 0.0 0.0 0.0 0.0 0.0 0.0 0.0 0.0 0.0 0.0 0.0 0.0
Traded goods or services 1.2 0.8 1.0 1.2 0.3 1.1 0.6 0.0 0.4 0.2 0.3 0.8
Borrowed 0.0 0.0 0.0 0.0 0.0 0.0 0.0 0.0 0.0 0.0 0.0 0.0 Gift from family or relatives 0.0 0.4 0.2 0.0 0.0 0.0 0.0 0.0 0.4 0.2 0.0 0.0
Food aid 0.0 0.0 0.0 0.3 0.0 0.0 0.0 0.0 0.0 0.0 0.0 0.0 Cash assistance 0.7 0.2 0.0 0.5 0.3 0.0 0.2 0.6 0.0 0.0 0.2 0.3
Other 0.0 0.0 0.0 0.0 0.0 0.0 0.0 0.0 0.0 0.0 0.0 0.0
Table A 32: Percent of households reported food had run out at some time during the
previous 12 months, and months of adequate household food provisioning (MAHFP) by background characteristics
Background characteristic % household food had run out during past 12 months
Average MAHFP
% yet to acheive the target
No. of Households
No. of members in family
1-3 49.7 10.2 15.4 195
4-6 60.8 9.3 22.2 337
≥ 7 67.9 9.5 20.9 81 Residence
Urban 61.1 9.2 23.1 90
Rural 57.7 9.7 19.3 523
Education of household Head No schooling 76.0 6.4 47.0 25
Primary 73.6 8.9 25.5 125
Secondary 69.2 9.2 23.4 195 Passed O’ Level 44.3 10.5 12.6 230 Higher 5.0 12.0 0.4 20
Monthly household income
< 9,000 68.8 9.0 25.2 356
9,000 – 13,999 52.4 10.3 14.2 103 14,000 – 19,999 51.5 10.5 12.7 68
20,000 – 31,999 20.0 11.5 4.1 55
≥ 32,000 7.7 11.8 1.3 13
Wealth quintile
Poorest 81.6 8.3 31.1 223 Second 56.0 10.0 16.8 159
Middle 48.0 10.1 15.6 123
Fourth 32.4 11.1 7.2 74
Richest 8.8 11.7 2.7 34 Overall 58.2 9.6 19.8 613
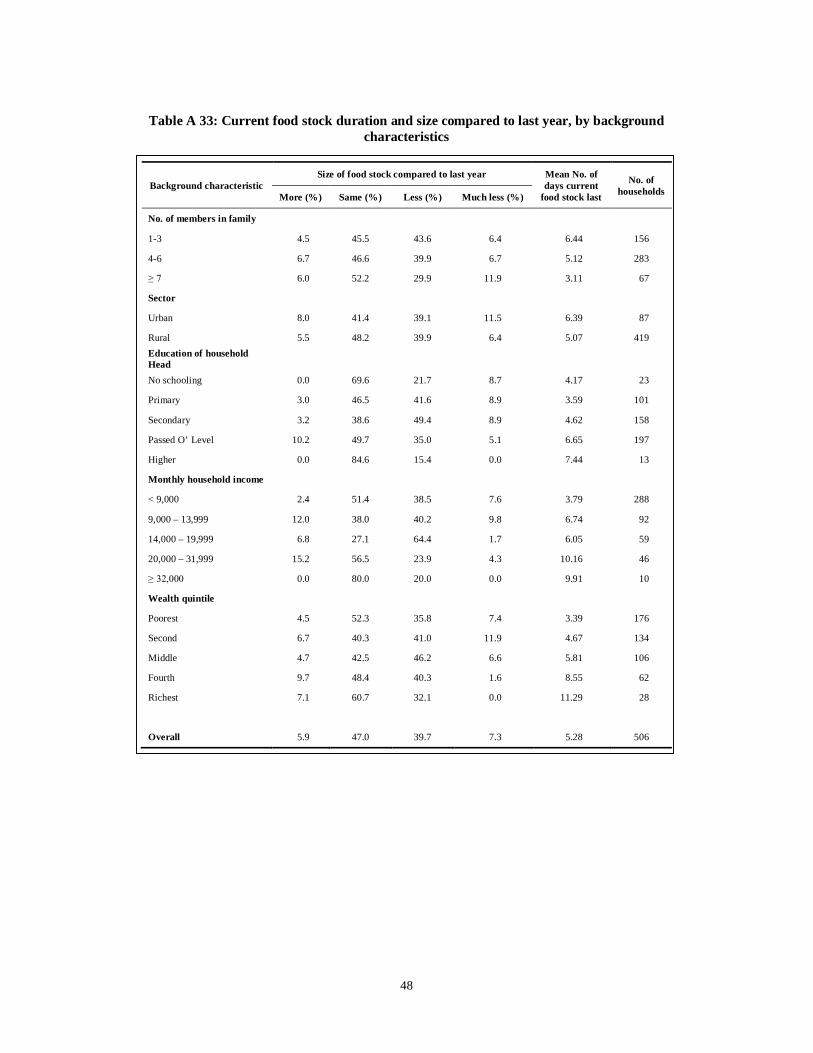
48
Table A 33: Current food stock duration and size compared to last year, by background characteristics
Background characteristic Size of food stock compared to last year Mean No. of
days current food stock last
No. of households More (%) Same (%) Less (%) Much less (%)
No. of members in family
1-3 4.5 45.5 43.6 6.4 6.44 156
4-6 6.7 46.6 39.9 6.7 5.12 283
≥ 7 6.0 52.2 29.9 11.9 3.11 67
Sector
Urban 8.0 41.4 39.1 11.5 6.39 87
Rural 5.5 48.2 39.9 6.4 5.07 419 Education of household Head
No schooling 0.0 69.6 21.7 8.7 4.17 23
Primary 3.0 46.5 41.6 8.9 3.59 101
Secondary 3.2 38.6 49.4 8.9 4.62 158
Passed O’ Level 10.2 49.7 35.0 5.1 6.65 197
Higher 0.0 84.6 15.4 0.0 7.44 13
Monthly household income
< 9,000 2.4 51.4 38.5 7.6 3.79 288
9,000 – 13,999 12.0 38.0 40.2 9.8 6.74 92
14,000 – 19,999 6.8 27.1 64.4 1.7 6.05 59
20,000 – 31,999 15.2 56.5 23.9 4.3 10.16 46
≥ 32,000 0.0 80.0 20.0 0.0 9.91 10
Wealth quintile
Poorest 4.5 52.3 35.8 7.4 3.39 176
Second 6.7 40.3 41.0 11.9 4.67 134
Middle 4.7 42.5 46.2 6.6 5.81 106
Fourth 9.7 48.4 40.3 1.6 8.55 62
Richest 7.1 60.7 32.1 0.0 11.29 28
Overall 5.9 47.0 39.7 7.3 5.28 506

49
Table A 34: Average number of times a household received food aid in the last 6 months, by background characteristics
Characteristic
Type of food aid (mean no. of times per 6 month)
No. of households
Not
rec
eive
d fo
od a
ids
WFP
/GA
Sam
urdh
i
Food
Bas
ket
Scho
ol
feed
ing
CSB
Thr
ipos
ha
Food
for
wor
k
Oth
er
No. of members in family
1-3 37.9 4.0 3.1 3.0 96.7 5.3 3.6 0.0 4.7 195
4-6 29.8 3.7 2.8 3.8 100.9 5.0 3.9 1.0 3.7 337
≥ 7 25.0 4.4 2.9 4.5 117.2 5.6 3.3 0.0 3.7 81
Sector
Urban 31.5 3.5 2.8 0.0 150.0 3.2 2.5 0.0 2.3 90
Rural 31.8 4.0 2.9 3.8 103.2 5.3 3.8 1.0 4.3 523
Monthly household income
< 9,000 20.0 4.0 2.9 4.1 103.8 5.0 3.8 1.0 4.3 356
9,000 – 13,999 37.9 3.5 2.8 4.0 100.0 5.7 3.4 0.0 2.8 103
14,000 – 19,999 47.8 3.5 3.1 0.0 93.3 5.7 4.0 0.0 5.0 68
20,000 – 31,999 70.9 2.5 3.4 0.0 112.5 5.0 5.3 0.0 0.0 55
≥ 32,000 84.6 0.0 0.0 0.0 0.0 6.0 2.0 0.0 0.0 13
Wealth index quintile
Poorest 14.4 4.0 2.8 4.3 108.7 4.9 3.7 1.0 4.1 223
Second 34.0 4.0 2.8 3.0 101.6 5.8 3.4 0.0 4.0 159
Middle 35.2 3.8 3.3 3.0 86.7 5.6 3.4 0.0 4.5 123
Fourth 56.8 3.5 2.8 3.0 60.0 5.0 5.0 0.0 1.0 74
Richest 67.6 3.0 2.7 0.0 0.0 4.0 2.0 0.0 4.0 34
Overall 31.8 3.9 2.9 3.8 103.8 5.1 3.7 1.0 4.1 613

50
Table A 35: Household Food Consumption Adequacy Score (HFCAS) and prevalence of household food insecurity status, by background characteristics
Background characteristic Mean (SD) HFCAS Score*
HFCAS Score Category (%) No. of households Poor Borderline Adequate
No. of members in family 1-3 64.4 17.3 1.0 2.6 96.4 192
4-6 67.3 16.5 0.0 1.8 98.2 334
≥ 7 61.4 16.4 0.0 3.8 96.3 80
Residence
Urban 70.5 15.5 0.0 1.1 98.9 89
Rural 64.7 16.9 0.4 2.5 97.1 517
Religion of household Head
Buddhist 0.0 0.0 0.0 0.0 0.0 0
Hindu 66.1 16.8 0.4 2.2 97.4 502
Islam 83.7 8.5 0.0 0.0 100.0 3
Catholic and other Christian 62.2 17.3 0.0 2.2 97.8 90
Education of household Head
No schooling 67.0 10.9 0.0 0.0 100.0 25
Primary 62.2 15.9 0.0 1.6 98.4 123
Secondary 63.7 16.8 0.5 4.6 94.8 194
Passed O’ Level 68.5 17.7 0.4 0.4 99.1 226
Higher 68.6 12.5 0.0 0.0 100.0 20
Monthly household income
< 9,000 63.2 16.8 0.0 3.4 96.6 351
9,000 – 13,999 67.1 16.4 1.9 1.0 97.1 103
14,000 – 19,999 74.3 15.3 0.0 0.0 100.0 67
20,000 – 31,999 70.1 15.0 0.0 1.8 98.2 55
≥ 32,000 61.5 23.0 0.0 0.0 100.0 12
Wealth quintile
Poorest 62.8 16.7 0.5 3.2 96.4 221
Second 65.1 14.9 0.6 1.3 98.1 158
Middle 66.8 17.5 0.0 4.1 95.9 122
Fourth 68.5 19.9 0.0 0.0 100.0 71
Richest 75.5 12.4 0.0 0.0 100.0 34
Overall 65.6 16.9 0.3 2.3 97.4 606
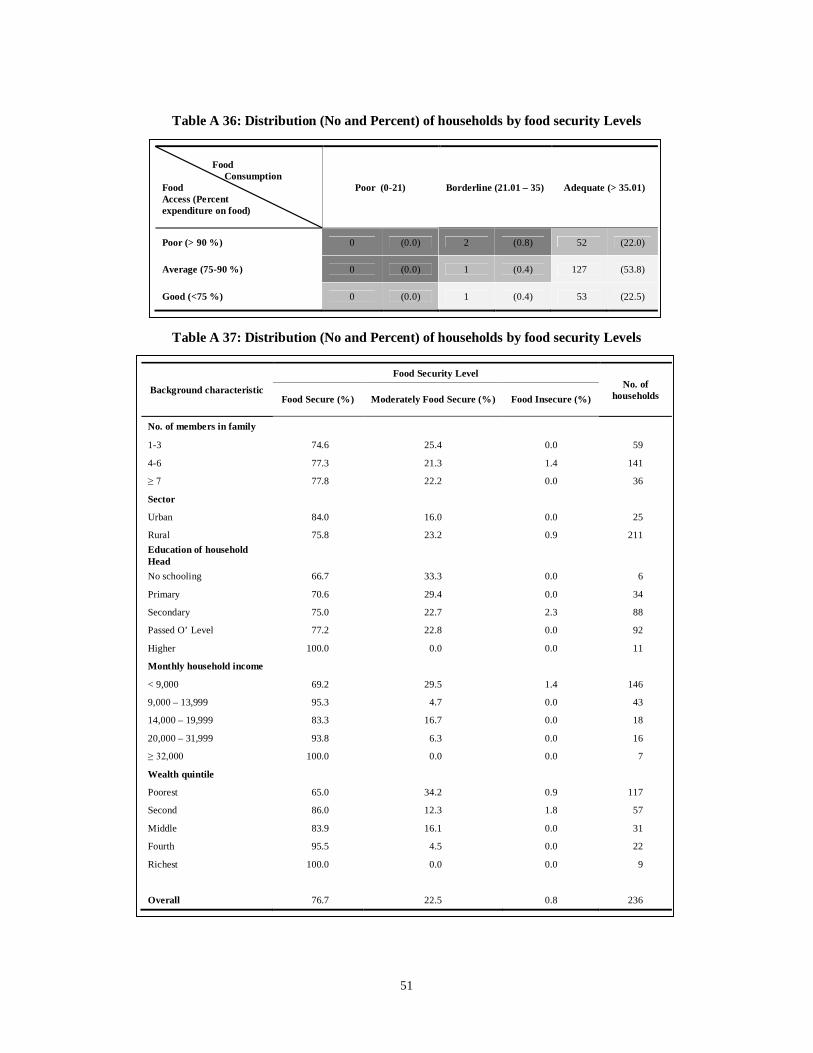
51
Table A 36: Distribution (No and Percent) of households by food security Levels
Food Consumption Food Access (Percent expenditure on food)
Poor (0-21) Borderline (21.01 – 35) Adequate (> 35.01)
Poor (> 90 %) 0 (0.0) 2 (0.8) 52 (22.0)
Average (75-90 %) 0 (0.0) 1 (0.4) 127 (53.8)
Good (<75 %) 0 (0.0) 1 (0.4) 53 (22.5)
Table A 37: Distribution (No and Percent) of households by food security Levels
Background characteristic
Food Security Level No. of
households Food Secure (%) Moderately Food Secure (%) Food Insecure (%)
No. of members in family 1-3 74.6 25.4 0.0 59
4-6 77.3 21.3 1.4 141
≥ 7 77.8 22.2 0.0 36
Sector
Urban 84.0 16.0 0.0 25
Rural 75.8 23.2 0.9 211 Education of household Head
No schooling 66.7 33.3 0.0 6
Primary 70.6 29.4 0.0 34
Secondary 75.0 22.7 2.3 88
Passed O’ Level 77.2 22.8 0.0 92
Higher 100.0 0.0 0.0 11
Monthly household income
< 9,000 69.2 29.5 1.4 146
9,000 – 13,999 95.3 4.7 0.0 43
14,000 – 19,999 83.3 16.7 0.0 18
20,000 – 31,999 93.8 6.3 0.0 16
≥ 32,000 100.0 0.0 0.0 7
Wealth quintile
Poorest 65.0 34.2 0.9 117
Second 86.0 12.3 1.8 57
Middle 83.9 16.1 0.0 31
Fourth 95.5 4.5 0.0 22
Richest 100.0 0.0 0.0 9
Overall 76.7 22.5 0.8 236

52
ANNEX II The steps followed in estimating levels of food insecurity were as follows:
Step1: Calculate a household food consumption adequacy score (HFCAS) based on food groups consumed during 1 week prior to survey, grouped into 3 categories as described in footnote4. Step 2: Estimating the expenditure on food as a percentage of the total household expenditure, and categorizing the households into 3 groups indicating different levels of food access (<75 percent - good; 75t o 90 percent - average and >90 percent - poor food access). Step 3: Cross-tabulation between food consumption categories and food access categories.
Food insecurity levels were assessed in accordance with the classification given in Figure 2.
Figure 2: Assessment of food insecurity levels
Food consumption Poor Borderline Adequate
Food access
Poor Severely food insecure Severely food insecure Moderately food insecure
Average Severely food insecure Moderately food insecure Food Secure
Good Moderately food insecure Food Secure Food Secure
4 Eight food groups were used to calculate the Food consumption adequacy score.
Food group Food times 1. Staple foods (starches) Rice, bread / chapti /roti 2. Pulses/legumes Pulses 3. Vegetables vegetables (including leaves) 4. Fruits fruits 5. Animal protein Fish, meat (beef, pork, chicken), eggs 6. Sugar sugar/ jaggary 7. Dairy products Curd, milk (liquid or powder) 8. Oil/fats palm oil, vegetable oil, fats, coconut products (dried copra)
The number of days the food items were consumed during the previous week was summed for the food items in each of the 8 food groups. If the total sum of the number of days of the separate items in a food group was higher than 7 days, the sum is converted to 7. Thus, the maximum score for each food group is 7 days. The food score of each household is calculated as follows: Simple food score = 2 * staple + 3 * pulses + 1 * vegetables + 1* fruit + 4 * animal protein + 0.5 * sugar + 3 * dairy + 0.5 * oil The households were grouped according to their scores by applying the standard cut-offs as follows:
Poor food consumption: simple food score is 0 – 21 Borderline food consumption: simple food score is 21.01 – 35 Adequate food consumption: simple food score is 35.01 and higher