nutrition 2.0 molecular phenotyping in humans - · pdf filenutrition 2.0 – molecular...
TRANSCRIPT

1 Nestlé Institute of Health Sciences 2 Ecole Polytechnique Fédérale
Lausanne (EPFL) 3 Aarhus University (AU) Denmark
Nutrition 2.0 – Molecular Phenotyping in Humans Martin Kussmann1,2,3 Head of Molecular Biomarkers
September 9th 2015

World Healthcare in 2020… … 1 out of 5 will be over 65
• 70% of developed countries with more 50+ than 50-
• Over 200M people aged 65+ in China
Requires healthcare systems better adapted to needs of the elderly
Source: UN, WEF, IBM, PWC, Litsearch, Bain analysis / estimate
… 3 out of 5 will die from a chronic disease
• 50M Alzheimer’s patients
• 7% of the world’s adult population will live with Diabetes
More emphasis on prevention and treatment of chronic diseases
… 1 out of 5 will be overweight or obese
• 120M people in the US
• 20% of people under 18 year in China
Need to treat increasing co-morbidities such as cardiovascular diseases and diabetes
… US$ 5 to 10 Trillion will be spent on healthcare
• More than 16% of GDP spent on healthcare
• National health expenditures in USA per capita will reach US$ ~14'000
Requires radical ways to contain costs and / or increase available funding
… Malnutrition causes 35% of disease burden in children <5 years • Maternal and child malnutrition is the underlying cause of 3-5 million deaths
• Associated to increased susceptibility to chronic disease later in life

Page 3
Systems Nutrition & Health
Cell Biology - Stem Cell - Flow Cytometry - Device Engineering
Mitochondrial Function Natural Bioactives & Screening
Functional Genomics Molecular Biomarkers
Biosystems Informatics
Brain Health Cognitive Health
Sarcopenia Metabolic Health
Obesity and Weight Mgmt Diabetes
Met Sensing & Adaptation Beta Cell Function
Circadian Cycle GI Health
GI Health and Microbiome
Scientific Platforms…

…to understand the interplay between…
Diet
Lifestyle
Genes
Kussmann, Hager, Morine, Sonderegger, Kaput. Frontiers 2013 Kussmann, Kaput. Appl. Transl. Genomics 2014

• Employees: 150 61% Ph.D., 19% Master 28 nationalities Average age : 39
• Scientific Development and Interaction:
• 9 Adjunct Lecturers/Professors PhD & Master program with 20 mandates
• > 100 publications • 4 grants
• Numerous collaborations with
national and international partners
NIHS 2015
5
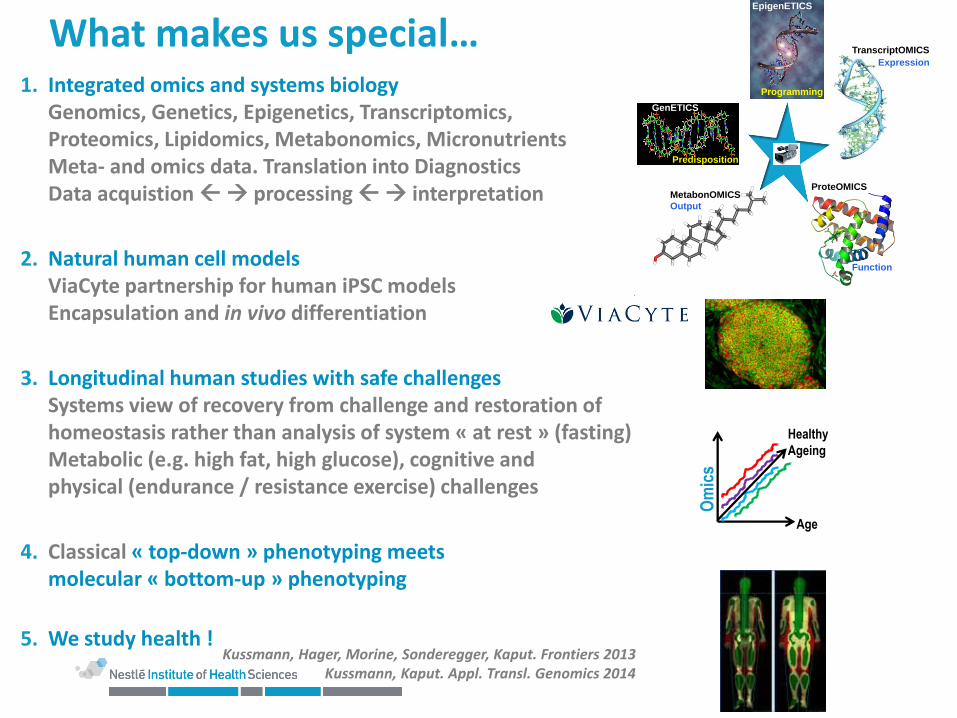
1. Integrated omics and systems biology Genomics, Genetics, Epigenetics, Transcriptomics, Proteomics, Lipidomics, Metabonomics, Micronutrients Meta- and omics data. Translation into Diagnostics Data acquistion processing interpretation
2. Natural human cell models ViaCyte partnership for human iPSC models Encapsulation and in vivo differentiation
3. Longitudinal human studies with safe challenges Systems view of recovery from challenge and restoration of homeostasis rather than analysis of system « at rest » (fasting) Metabolic (e.g. high fat, high glucose), cognitive and physical (endurance / resistance exercise) challenges
4. Classical « top-down » phenotyping meets molecular « bottom-up » phenotyping
5. We study health !
What makes us special…
Age
Om
ics
Healthy
Ageing
ProteOMICSMetabonOMICS
TranscriptOMICS
GenETICS
EpigenETICS
Predisposition
Programming
Expression
Function
Output
Kussmann, Hager, Morine, Sonderegger, Kaput. Frontiers 2013 Kussmann, Kaput. Appl. Transl. Genomics 2014

Molecular Biomarkers – Platforms and Staff
Proteomics • Clinical and Translational • Molecular & Cellular • Technology
Metabonomics • Metabolism
• Molecular Phenotyping
• Technology
Diagnostics • Clinical and
Translational
• Assay
Development
MARTIN KUSSMANN Head Molecular Biomarkers @ NIHS
Honorary Prof. @ Aarhus Univ. Denmark Lecturer (MER) @ EPF Lausanne

Molecular Biomarkers @ NIHS: Where Genes and Environment intersect…
• EpiGenomics
• Transcriptomics
EpiGenotype
• Proteomics
• Metabonomics
• Diagnostics
Molecular Phenotype • MicroNutrients
• Physical Activity
• Cognitive Activity
Diet and Lifestyle
PHYSIOLOGY PATHOLOGY
PREDISPOSITION PROGRAMMING
ENVIRONMENT

Scope : Health Areas
• METABOLIC HEALTH
• GASTRO-INTESTINAL HEALTH
• BRAIN HEALTH
• AGEING
Longevity Frailty
Muscle Health
Phenotyping Cognitive Decline
Alzheimer’s Biomarkers
Juvenile Diabetes
DiOGenes
Circadian Biology
Host-Microbe Metabolism
IBD
Sebastiano Collino Loïc Dayon
François-Pierre Martin François-Pierre Martin John Corthésy Loïc Dayon
India Severin Loïc Dayon
John Corthésy

Study Levels : Clinics Analyses Data
CLINICS
Longevity
Frailty
IBD
Diabetes
Alzheimer’s
ANALYSIS
Proteomics
Metabonomics
1-Carbon Metabolism
Diagnostics
DATA
Biomarkers
Chemometrics
Pathways
Networks
Omics Data Processing Iv
an M
on
toliu
O
rne
lla C
om
inet
ti

Proteomics: Discovery and Targeted/Validation
http://www.nature.com/doifinder/10.1038/nmeth.2309

Human Plasma Proteomics
Inez
Fin
ou
lst,
Mar
tijn
Pin
kse,
Will
iam
Van
Do
nge
n, P
eter
Ver
hae
rt, J
. Bio
med
. Bio
tech
no
l. 2
01
1;2
011:
245
291
“Sample preparation is key and has been neglected”. Bruno Domon, EuPA 2013 7th Annual Conf. Saint-Malo, France, Oct. 2013
“We cannot do HT without sample preparation automation but nothing is available on the market”. Roman Zubarev, EuPA 2013, 7th Annual Conf. Saint-Malo, France, Oct. 2013
Concentration range: 10-12 logs
Abundant proteins represent > 99% of the total bulk
Abundant tryptic peptides dominate MS analysis
Many variants and modifications of few abundant proteins
Dayon, Nuñez Galindo, Corthésy, Cominetti…Kussmann. J. Proteome Res. 2014 & 2015

Human Plasma Proteomics
Innovative biomarkers: discovery / verification / validation
Small to higher number of samples for discovery
Nader Rifai, Michael A. Gillette, Steven A. Carr, Nature Biotechnology 24, 971 - 983 (2006)
150-200
500-1000
Dayon, Nuñez Galindo, Corthésy, Cominetti…Kussmann. J. Proteome Res. 2014 & 2015

Human Plasma Proteomics Workflow 96 individual, identical samples on MTP-format
Dayon, Nuñez Galindo, Corthésy, Cominetti…Kussmann. J. Proteome Res. 2014 & 2015

• Automation of proteomics of human CSF
• Application to CHUV AD cohort
Page 15
Human CSF Proteomics Workflow
Nuñez Galindo, Kussmann, Dayon. Anal. Chem. submitted

NMR–/MS–based Metabonomics
16
NMR LC-NMR LC-NMR/MS Rezzi/Collino/Martin/Kochhar/Nicholson et al. J. Proteome Res. 2007 + 2012. Anal. Chem. 2009, Trends Anal. Chem. 2013
Kussmann, Raymond, Affolter; J. Biotechnol. 2006, Curr. Opin. Biotechnol. 2008
Sebastiano
Collino
Laeticia
Da Silva
François-Pierre
Martin Seu-Ping
Guiraud

Matrices: plasma, urine, saliva, synovial fluid, feces, cells , tissues… Key features High throughput: 5 min scan for urine, 15 min for plasma Both solid and liquid state Highly robust/reproducible: CV: 0.02% across QC samples 0.04% across instruments Provides information on:
• Central E metabolism • Amino acids • Lipids (lipoproteins) • Glucose • Microbial metabolites
Provides guidance for subsequent targeted analyses Metabolome coverage (based on known metabolites):
• Urine: 209 (out of 605) compounds • Plasma: 50 compounds • CSF: 54 compounds
Plasm
a U
rine
Lip
id extracts
Metabonomics: Clinical Screening and Discovery
Da Silva, Godejohann, Martin, Collino…Franceschi, Hervonen, Spraul, Moco. Anal.Chem. 2013 Moco S, Colino S, Rezzi S, Martin FPJ. Ped. Res. 2013. Collino, Martin, Rezzi. J. Clin. Pharm. 2013
Rezzi, Collino, Goulet, Martin. Trends Anal. Chem. 2013

AGEING

Prenatal Infancy
Childhood Puberty Ageing
Maturity Reproduction
Genes Epigenetics Maternal behaviours Environmental factors Family behaviours Learned behaviours Family environment Biological factors Genes/epigenetics Fat mass / obesity Family behaviours Learned behaviours Environmental factors
Environmental pressures Biological ageing Poor new adaptation Previous maladaptation
Disease
What is ageing and how does it progress ?
Collino, Martin… Moco, Franceschi, Kussmann, Offord Mech. Ageing Dev’t 2013

Role of nutritional deficiency in the development of frailty was suggested long ago. However, research in this area is only recent.
2%–16% of community-dwelling elderly are nutritionally deficient in protein and calories (Whitehead 1997). If mineral and vitamin deficiencies are included, malnutrition in persons older than 65 years may be 35% (Chandra 2002).
Low energy and protein intake and low nutrients positively associate with frailty. Energy intake, serum Se, carotenoids and albumin levels are lower in frailty (Smit et al 2013). MMA: marker for available vitamin B12 (Mocchegiani 2010).
Elderly become particularly vulnerable to compromised nutrient intakes. Their diets should be nutrient-dense to ensure adequate intakes of e.g. n-3 fatty acids, protein, dietary fibre, B vitamins and other micronutrients such as iron, combined with low intakes of sodium.
Need better nutritional assessment tools for both successful diagnosis of malnutrition and development of appropriate and comprehensive treatment plans for frail (and others).
Ageing and Nutrition

Plasma samples from n = 3’700 ageing males and females aged 18 to 67
NMR profiling
Statistical modeling (PLS)
1.01.52.02.53.03.54.04.55.05.56.06.57.07.5 ppm
1.01.52.02.53.03.54.04.55.05.56.06.57.07.5 ppm
1.01.52.02.53.03.54.04.55.05.56.06.57.07.5 ppm
1.01.52.02.53.03.54.04.55.05.56.06.57.07.5 ppm
1.01.52.02.53.03.54.04.55.05.56.06.57.07.5 ppm
1.01.52.02.53.03.54.04.55.05.56.06.57.07.5 ppm
The observed metabolic distributions suggest that chronological age differs from metabolic (biological) age
Metabolic phenotyping reveals differences between biological and chronological age
Collino, Martin… Moco, Franceschi, Kussmann, Offord Mech. Ageing Dev’t 2013

Our centenarians are lean, youthful-looking, energetic,
independent, and have low rates of heart disease and diabetes
Healthy ageing involves the interaction between genes, the environment, and lifestyle factors, particularly diet
Centenarians appear to be capable of neutralizing/diminishing the
deleterious effects of low-grade, chronic inflammation,
characteristic of the aging process
Franceschi et al. 2007
Longevity (centenarians) as a model of healthy ageing Factor Centenarians Elderly Young Pvalue
BMI, kg/m2
HOMA, μU/mL
Diabetes1, n
Cholesterol, mg/dl
Triglycerides, mg/dl
HDL, mg/dl
LDL, mg/dl
CRP, mg/L
A-SAA, mg/ml
IL-6, pg/ml
IL-8, pg/ml
IL-10, pg/ml
TNF-alpha, pg/ml
MMSE2
24.2+3.8 (13.3-31.2)
1.77±1.1 (0.20-23)
1
185.0±32.7 (112-264)
114.4±46.1 (60-283)
48.2±13.1 (25-99)
105.6±35.1 (75-165)
5.0±5.3 (0.28-28.2)
437.6±483.7 (15.5-851)
46.9±41.6 (7.5-225)
20.9±20.8 (6-71)
3.93±4.3 (0.6-19.9)
23.5±4.3 (0.40-113)
20.4±7.04 (1.3-30.3)
26.9±4.6 (16.7-54.7)
2.81±2.57 (0.20-28.9)
25
201.0±37.2 (5-335)
129.9±65.7 (44-530)
55.2+20.4 (20-147)
118.7±45.7 (23.8-199)
2.7±3.6 (0.11-25.7)
149.1±204.6 (0.01-186)
35.4±54.9 (0.28-28.2)
22.72±27 (2.3-100)
6.07±15.4 (1.5-20)
49.1±153.1 (0.1-80)
27.3±1.3 (1.3-31.0)
22.1±2.0 (18.3.24.6)
n/a
n/a
162.3±28.4 (133-207)
71.7±32.1 (28-143)
51.8±8.7 (38-66)
89.8±51.5 (49-144)
0.72±0.4 (0.28-2.08)
n/a
20.3±17.5 (2.70-28.2)
19.3±13.3 (4.4-46.6)
2.38±2.58 (0.80-3.80)
18.5±28.5(5.80-65.5)
n/a
a(***), b(***)
a (***), n/a
n/a
a (***), b (***)
a (*), b (***)
a (**), b (**)
a (**), b (***)
a (***), b (***)
a(***), n/a
a, b (***)
a ,b (*)
a,b (***)
a,b (***)
n/a
Rampelli S. et al, Aging 2013, Montoliu et al, Aging 2014, Collino et al. MAD 2014 Santoro et al. MAD 2014, Garagnani et al. Biomed research 2014, Cominetti et. al. 2014, AgroFoodTech

Human Longevity Most comprehensive genotype, microbiome, and phenotype database
NGS-based gut microbiota fingerprint
Diversity analysis of gut microbiota composition resulted in significant segregation of 105+ from other groups
Whole Genome Sequencing
• Developed and applied novel statistical genetic, bioinformatic, and data mining algorithms
Genetic variants for pathogenesis, risk and protection Distribution of variants for single genes
Sebastiano Collino, Laetitia Da Silva

METABOLIC HEALTH

≈ 1’000 subjects
> 4’000 samples
> 7’000 variables
(clinical, food
diaries, behavior,
molecular) 1. Base line 2. Weight loss period
(800 kcal/day) 3. Weight maintenance
Quantitative Multivariate
Analysis
www.diogenes-eu.org Larsen et al., N. Engl. J. Med., 2010, 363, 2102–2113
DiOGenes DiOGenes stands for Diet, Obesity, and Genes
EU program incl. weight loss/maintenance in obese
NIHS questions: Can we predict success in weight loss/maintenance at baseline ? Who needs which diet to succeed ?

Proteomics and clinical center effect
Ratios CID1/CID3
Individual samples

Proteomics and clinical variables
Gender
Age

Validation: C-Reactive Protein
Measured in clinics
Measured by MS-proteomics
Comparison of: 𝒍𝒐𝒈𝟐 𝑪𝑹𝑷@𝑪𝑰𝑫𝟑
𝑪𝑹𝑷@𝑪𝑰𝑫𝟏
Good correlation between techniques

Variability of the proteins
Protein variability is consistent across the time points.
Technical variability is smaller than biological variability.
Low-variability proteins can be used for normalization
Complement C1r shows potential to be used as an internal protein standard in human plasma
Protein variability in CID3 and CID1
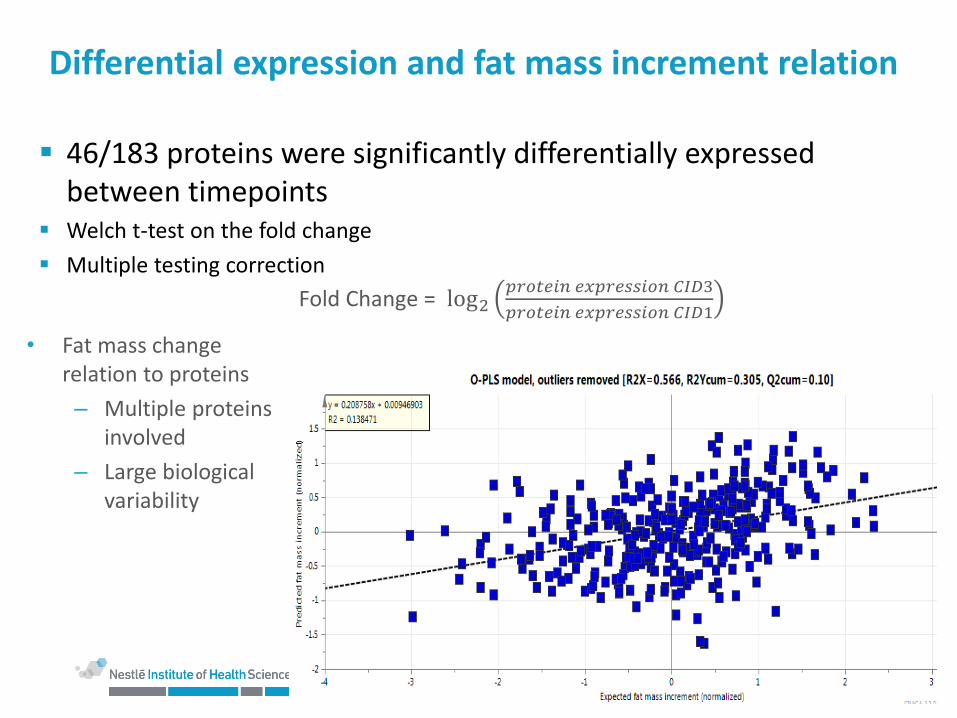
Differential expression and fat mass increment relation
46/183 proteins were significantly differentially expressed between timepoints
Welch t-test on the fold change
Multiple testing correction
• Fat mass change
relation to proteins
– Multiple proteins involved
– Large biological variability
Fold Change = log2𝑝𝑟𝑜𝑡𝑒𝑖𝑛 𝑒𝑥𝑝𝑟𝑒𝑠𝑠𝑖𝑜𝑛 𝐶𝐼𝐷3
𝑝𝑟𝑜𝑡𝑒𝑖𝑛 𝑒𝑥𝑝𝑟𝑒𝑠𝑠𝑖𝑜𝑛 𝐶𝐼𝐷1

PAEDIATRIC METABOLIC HEALTH

Juvenile Diabetes
Background Science Deliverables
• How do diet, lifestyle and environment interact with genes and metabolism during childhood and adolescence ?
• How does that determine health in child- and adulthood ?
Earlybird Cohort: • Longitudinal cohort study • 300 children and their parents • Measurement every
6 months/12 months from 5-19 years
Describe: • Normal childhood and puberty • Origins of childhood weight gain
and IR • Impact on long-term risks of
diabetes and cardiovascular disease.
Unique longitudinal database across childhood: • Body composition • Dietary intake • Clinical and metabolic status • Energy expenditure
• Establish relationships between genes, metabolism and childhood glucose metabolism
• Findings in mothers of IFG children suggest that b cell defect may be transmissible (gestational and/or genetics)
• Metabolic, anthropometric and nutritional characterization across childhood
François-Pierre Martin

Forecasting metabolic trajectories, disease risk and childhood physiology
Growth curve reference
5 6 7 8 9 10 11 12 13 14 15 16 17 18 19 20 21 22 23 24 … days
Met
abo
lic f
lexi
bili
ty
Modelling known trajectory e.g. Bayesian modelling
Forecasting
Insights
Cominetti, Martin. Agro FOOD Industry 2014 Sperisen, Cominetti, Martin. Frontiers Mol. Biosci. 2015
