nutrient use in agriculture - united nations · maximize crop production and minimize environmental...
TRANSCRIPT

Nutrient Use in Agriculture: Managing Nutrients for Economics and the Environment
Bill HerzVice President, Scientific Programs
The Fertilizer InstituteMay 14, 2008
Who We Are:The Fertilizer Institute
• TFI represents the nation’s fertilizer industry including producers, importers, retailers, wholesalers and companies that provide services to the fertilizer industry.

Who We Are:TFI Mission Statement
• TFI seeks optimum plant nutrition for an abundant, economical, safe and nutritious food and fiber supply.
• We also seek to encourage farmers and their advisers to responsibly protect and improve air and water quality.
Presentation Overview
I. The Global Food CrisisII. What are NutrientsIII. Managing Agricultural Nutrients for Economics
and Environmenta. Nutrient Management Planningb. Toolbox
IV. Review of Factors Driving Nutrient Usea. Bioenergy Production b. Energy Costsc. World Fertilizer Demand

The Global Food Crisis
The Rubber BandIs Stretched Really Far
“The squeeze on the supply of fertilizer has been building for roughly five years. Rising demand for food and biofuels prompted farmers everywhere to plant more crops. As demand grew, the fertilizer mines and factories of the world proved unable to keep up.”
The New York Times, April 30, 2008“Shortages Threaten Farmers’ Key Tool: Fertilizer”

y = 16.47x ‐ 31,445R² = 0.98
y = 15.03x ‐ 28,575R² = 0.87
1,0001,1001,2001,3001,4001,5001,6001,7001,800
1975 1980 1985 1990 1995 2000 2005 2010
Million m
etric to
ns
Year (2007 =2007/08)
Domestic consumption
Production
1998‐2007y = ‐1.89x + 3816
R² = 0.930510152025303540
1975 1980 1985 1990 1995 2000 2005 2010
% of con
sumption
Year (2007 =2007/08)
Ending stocks
Source: USDA-FAS, 12/2007
World Wheat Plus World Wheat Plus Coarse Grains, Coarse Grains,
19781978--20072007
1998‐2007y = ‐23.57x + 47,563
R² = 0.89
0
100
200
300
400
500
1975 1980 1985 1990 1995 2000 2005 2010
Million m
etric to
ns
Year (2007 =2007/08)
Ending stocks
Essential to Improved Soil Fertility•For arid and semi-arid regions results show that nutrient limitations set a stronger ceiling on yield than water availability. •In much of Africa, fertilizer use is low. With improvements in soil fertility and water management, yields in West African rain-fed agriculture can double or quadruple.•Developing country fertilizer use
– Sub-Saharan Africa 9 kg/ha– Latin America 73 kg/ha– South Asia 100 kg/ha– East and Southeast Asia 135 kg/ha– Western Europe and U.S. >250 kg/ha
Source: Molden, David. 2007. Water for Food, Water for Life: A Comprehensive Assessment of Water Management. Earthscan, London.

What is a Plant Nutrient?
Nitrogen (N) is a primary building block for all organisms. It is essential to making proteins, helps keep plants green and is a critical component of soil structure
Phosphorus (P) is a component of DNA and it also plays vitals roles in capturing light during photosynthesis, helping with seed germination, and helping plants use water efficiently. Plants also use phosphorus to help fight external stress and prevent disease.
N PPotassium (K) plays an important role in plant’s water utilization and also helps regulate the rate of photosynthesis. Other aspects of plant health include the growth of strong stalks, protection from extreme temperatures, and the ability to fight stress and pests.
K
Green Revolution
Source: http://nobelprize.org/nobel_prizes/peace/articles/borlaug/borlaug-lecture.pdf
World Cereal Production –Area Saved Through
Improved Technology,1950-1998

N in Soil OMSchulten & Schnitzer, 1997
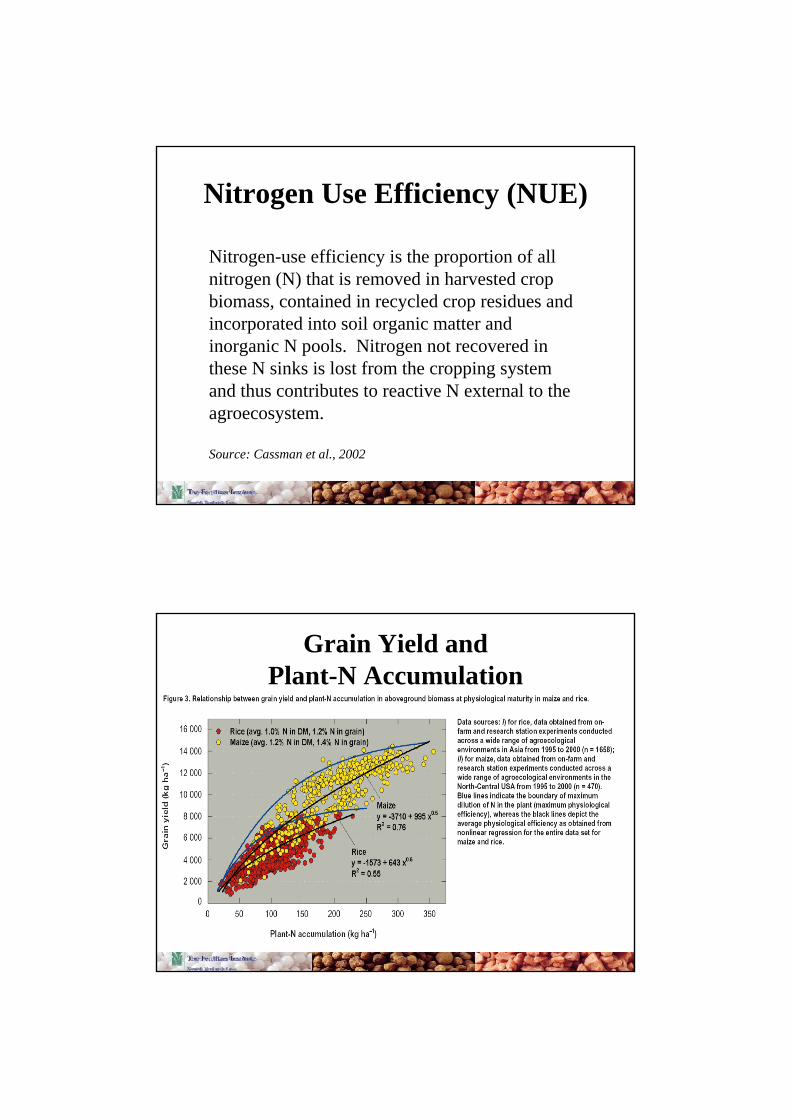
Nitrogen Use Efficiency (NUE)
Nitrogen-use efficiency is the proportion of all nitrogen (N) that is removed in harvested crop biomass, contained in recycled crop residues and incorporated into soil organic matter and inorganic N pools. Nitrogen not recovered in these N sinks is lost from the cropping system and thus contributes to reactive N external to the agroecosystem.
Source: Cassman et al., 2002
Grain Yield and Plant-N Accumulation

Trends in maize grain Trends in maize grain yield, use of N fertilizer yield, use of N fertilizer and partial factor and partial factor productivity from applied productivity from applied N fertilizer (PFPN fertilizer (PFPNN, kg grain , kg grain yield kgyield kg--11 N applied) in the N applied) in the United States. United States.
Source: Source: Cassman, et al., 2002
Every Farm and Field is Different
Lbs.
per n
utrie
nt a
pplie
d pe
r bus
hel p
rodu
ced
Source: Computed by TFI from USDA data
We are growing more with lessWe are growing more with less

Atmosphere
Terrestrial Ecosystems
Aquatic Ecosystems
Human Activities Groundwater Effects
Stream & River Effects
Coastal Effects
Stratospheric Effects
Greenhouse Effects
Energy Production
PM & Visibility
Effects
Ozone Effects
Agroecosystem EffectsNHxFood
Production
NOx
NOx
Crop Animal
People (Food; Fiber)
Soil
NO3
The Nitrogen Cascade
NH3
N2O
N2O--Indicates denitrification potential
Norg
Forests & Grassland
Soil
Galloway & Cowling, 2002
Managing Nutrients in Agricultural Managing Nutrients in Agricultural Systems is ComplexSystems is Complex……
Nutrient Removal to Fertilizer Use Ratio for US Grain Corn
0%
20%
40%
60%
80%
100%
120%
140%
160%
1963 1973 1983 1993 2003
NPK
P: 106%
K: 85%
Improvement: %
Corn Yield: 52%
N: 42%
Source: USDA-NASS; PPI

http://www.ncga.com/ethanol/pdfs/KenCassman.pdf
Nutrient Use Efficiency Improving

Nitrogen Check Yields and Net Returns in Nitrogen Check Yields and Net Returns in University Corn Studies in Iowa and IllinoisUniversity Corn Studies in Iowa and Illinois
Previous crop
Region No. of sites
N check, % of opt.
yd
Net return to
N, $/ASoybean IA 147 71 188Soybean Central
IL148 58 281
Corn IA 73 44 326Corn Central
IL53 49 315
At risk: $60 to $90/A of input costs 30% to 55% of total yield$200 to $300/A net income from one input
Millennium Development GoalsMillennium Development Goals
Fertilizer is part of the solutionFertilizer is part of the solution……–– Goal 1Goal 1
Eradicate extreme poverty and hunger–– Goal 7 Goal 7
Ensure environmental sustainability –– Goal 8Goal 8
Develop a global partnership for development
Source: http://www.un.org/millenniumgoals/

Mitigating Environmental/EconomicRisks
• Economic penalty for over or under estimating need or for nutrient loss is much greater with today’s higher prices … greater risk
• Tools for Mitigating Risk– Precision input application, enhanced efficiency N sources– Guidance systems– Soil testing and plant analysis, soil or plant imaging– On-farm strip trials, omission plots– Other forms of decision support including simulation models– Investing in determination of right source, rate, time and
place for nutrients … risk management tools
Source: Fixen, IPNI, EPA Integrated N SAB presentation, April 10, 2008
Right Product, Time, Rate and Place Paradigm
Right Place
Right Product
Right Rate
Right Time

Decision Making for Nutrient Application
Right Nutrients
• Select appropriate nutrients and on farm nutrient sources for the cropping system.
• Soil Testing• N, P, K and micro-nutrient
data• Enhanced fertilizer
efficiency• Nutrient management
planning

Soil and Plant Testing
Is there a full tank of Nutrients, or are we running on empty?
Ask the question with soil testing…
Right Time
• Application Timing • Controlled Release
Technologies• Inhibitors• Fertilizer Product Choice

Right Place
• Application method• Incorporation of fertilizer• Buffer strips• Conservation tillage• Cover cropping
Right Rate
• Soil testing• Yield goal analysis• Crop removal balance• Nutrient management
planning• Plant tissue analysis• Record keeping• Variable rate technologies• Site-specific management

Managing Fertilizers in Agriculture
• The North American fertilizer industry has a long history of partnering with its farmer customers and the more than 13,000 Certified Crop Advisers (CCAs) to ensure maximum crop productivity, while protecting water quality, soil quality and the environment.
Consultants and ExtensionConsultants and ExtensionReduce Complexity

Passes 2 CCA Exams 2 yrs. field experience with a BS Degree Or4 yrs. field experience without advanced degree. Supporting references Sign the CCA Code of Ethics
Each CCA is required to earn 40 hours of continuing education / 2 years.
What are Certified Consultants?
Once Certified:
A CCA works with producers to: Maximize Crop Production and Minimize Environmental Risk!
What is the goal of a Certified Consultant?
Maximize Crop Production and Minimize Environmental Risk and Costs
• Determine the amount of nutrients in the soil that will be available for plant uptake.
• Determine the amount of nutrients needed to produce the desired crop.
• Manage Nutrient:– Source– Placement– Application Timing
Nutrient Management Tool Box
• Tool 1: On Site Evaluation– Identify environmental concerns
• Tool 2: Geographic Information– Aerial photos– Soil type maps– Global Positioning Systems (GPS)
• Tool 3-6: Soil, Manure, and Plant Tests– Soil: Amount of nutrients available is obtained from the soil test.– Plant: Amount of nutrients needed to produce the desired crop.– Manure: Amount of nutrients available in manure
• Tool 7: Nutrients– The nutrient source, timing, and placement can influence crop nutrient
efficiency and the potential for nutrient loss.• Tool 8: Management practices
– Tillage, crop rotation, planting rates, seed selection are all practices that can influence how we manage nutrients.
• Tool 9: Planning Software
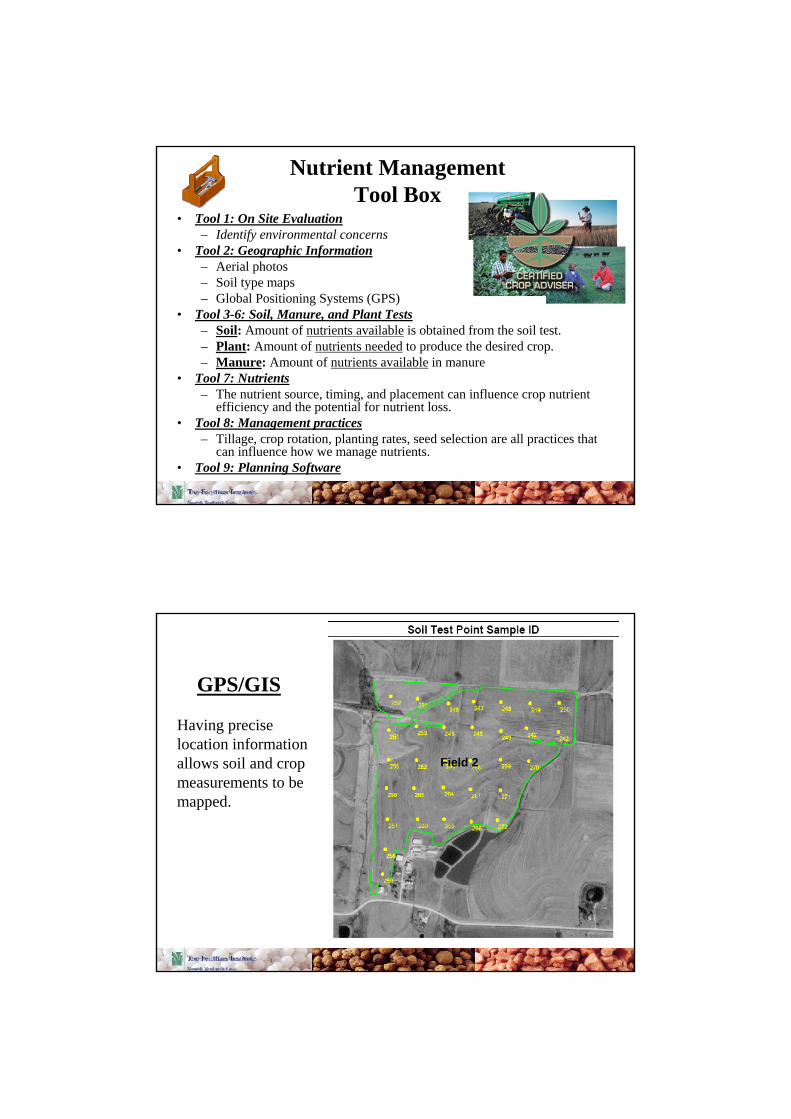
Having precise location information allows soil and crop measurements to be mapped.
Field 2
GPS/GIS

Precision agriculture allows you to place the nutrients where you need them.
• Maximize crop returns with a minimum amount of inputs.
• The environment is protected because only the precise quantity of inputs is applied when and where needed.
“Do the right things in the right place at the right time and in the right way”
Field 2
Modern Corn and Soybean Production, Hoeft R.G et al.
Practice adoption varies across practices and crops, 2001-03

What is going on with fertilizer prices?Index of Fertilizer Prices Paid by Farmers, Jan 1995-Nov 2007
90
100
110
120
130
140
150
160
170
180
190
200
210
22019
95 July
1996 July
1997 July
1998 July
1999 July
2000 July
2001 July
2002 July
2003 July
2004 July
2005 July
2006 July
2007 July
1990
-199
2 =
100
Source: National Agricultural Statistics Service, USDA.
Natural Gas Required to Produce a Ton of Anhydrous Ammonia
30
31
32
33
34
35
36
37
1983
1984
1985
1986
1987
1988
1989
1990
1991
1992
1993
1994
1995
1996
1997
1998
1999
2000
2001
2002
2003
2004
2005
2006
Mill
ion
Btu
per
ton
of a
mm
onia
Source: TFI.
1983 to 2006 => 11 % increase in efficiency

Average Annual Natural Gas Costs ($)
0
1
2
3
4
5
6
7
8
919
86
1987
1988
1989
1990
1991
1992
1993
1994
1995
1996
1997
1998
1999
2000
2001
2002
2003
2004
2005
2006
2007
$ M
MB
tu
Source: Spot-delivered-to-pipeline price, Natural Gas Week.
Rising Energy and Feedstock CostsPRODUCTION COST IMPACTS
Ammonium PhosphatesDirect => higher energy prices
=> higher sulfur pricesIndirect => higher ammonia prices
Potash=> higher electricity and natural gas prices

Fertilizer Nutrient Demand, FY95/96 and FY00/01
-20
0
20
40
60
80
100
120
140
160
United States Rest of World World
mill
ion
shor
t ton
s nut
rient
Demand in FY95/96 Demand Growth - FY95/96 to FY00/01Source: IFA, TFI.
20.7
131.3150.1
Drop in use of 1.4 mil.
nutrient tons
World use rose by only
7.5 mil. nutrient tons over 5 years!
+ 5.2 %
World Fertilizer Demand
Fertilizer Nutrient Demand, FY00/01 and FY05/06
0
20
40
60
80
100
120
140
160
180
United States Rest of World World
mill
ion
shor
t ton
s nut
rient
Demand in FY00/01 Demand Growth - FY00/01 to FY05/06Source: IFA, TFI.
21.2
150.4171.6
20.1 mil. nutrient
tons
5-year growth in world nutrient demand outside the United States equivalent to adding a new U.S.
market to world fertilizer demand!
+ 13.7 %
World Fertilizer Demand

Practice adoption reflects farm and operator characteristics

Summary of Toolbox– On Site Evaluation– Geographic Information– Soil Testing– Right Nutrients– Right Timing, Placement
and Rate– Field Management—
Rotations, Tillage, etc. – Planning Software