nutrient and sediment estimation tools for watershed protection · 2018-08-15 · nutrient and...
TRANSCRIPT

Nutrient and Sediment Estimation Tools for Watershed Protection
EPA 841-K-18-002
March 3, 2018
This document does not confer legal rights or impose legal obligations on any member of the public. The EPA has made every effort to ensure the accuracy of the technical information in this document. Depending on individual circumstances, the general information and descriptions provided here may not apply to a given situation. Decision makers retain the discretion to adopt approaches on a case-by-case basis that differ from the approaches described in this document.

Nutrient and Sediment Estimation Tools for Watershed Protection
2
Introduction
Nutrient and sediment pollution affects many of our local streams and lakes, and can lead to adverse impacts such as algal blooms, fish kills, and dead zones. Given the growing importance of managing nutrient and sediment pollution there is interest in tools that can help estimate and track nutrient losses as well as provide decision support for policy or investment options. The purpose of this document is to identify and catalog many of the tools that are currently in use to estimate nitrogen, phosphorus, and sediment losses and to identify the uses for which these tools are most appropriate. Estimation tools can vary widely in terms of the land uses to which they are applicable, the scale at which they can estimate losses, the data requirements, and the sophistication of their estimates. Deciding which tool is appropriate for a given project will depend largely on the purpose of the project and understanding the tradeoffs of data and level of effort vs. accuracy.
Example uses of nutrient and sediment loss estimation tools include:
• Watershed Scale Planning – Watershed scale tools vary in their capability of assessing theeffectiveness of multiple best management practices (BMPs) or agricultural conservationpractices. The size of the watershed will drive the need for accuracy, and higher or lower dataneeds and level of effort to operate the tool may vary.
• Scenario Building – Scenario building refers to process of identifying one or multiple sets ofBMPs to achieve a desired load reduction. This can occur at the field or watershed scale. Usersshould consider a tool capable of estimating a wide range of BMPs that has sufficient accuracy tomeaningfully compare one scenario against the other.
• Water Quality Trading and Other Market-based Programs – These programs involvefinancial payment to landowners in return for a load reduction outcome. Tools to support theseprograms are at the field scale and should be capable of routing flow through BMPs andcalculating reduction estimates from a wide range of BMPs at high levels of accuracy. Thisimplies that higher data needs and level of effort to operate the tool may be justified.
• Targeting – Targeting BMPs that offer the largest load reductions and/or most cost effective loadreductions will guide implementation to the lands most in need of treatment.
• Tracking and Reporting – Reporting results, to programs and/or the public, requires tracking andreporting the cumulative load reductions from implementation over variable time scales at thewatershed scale.
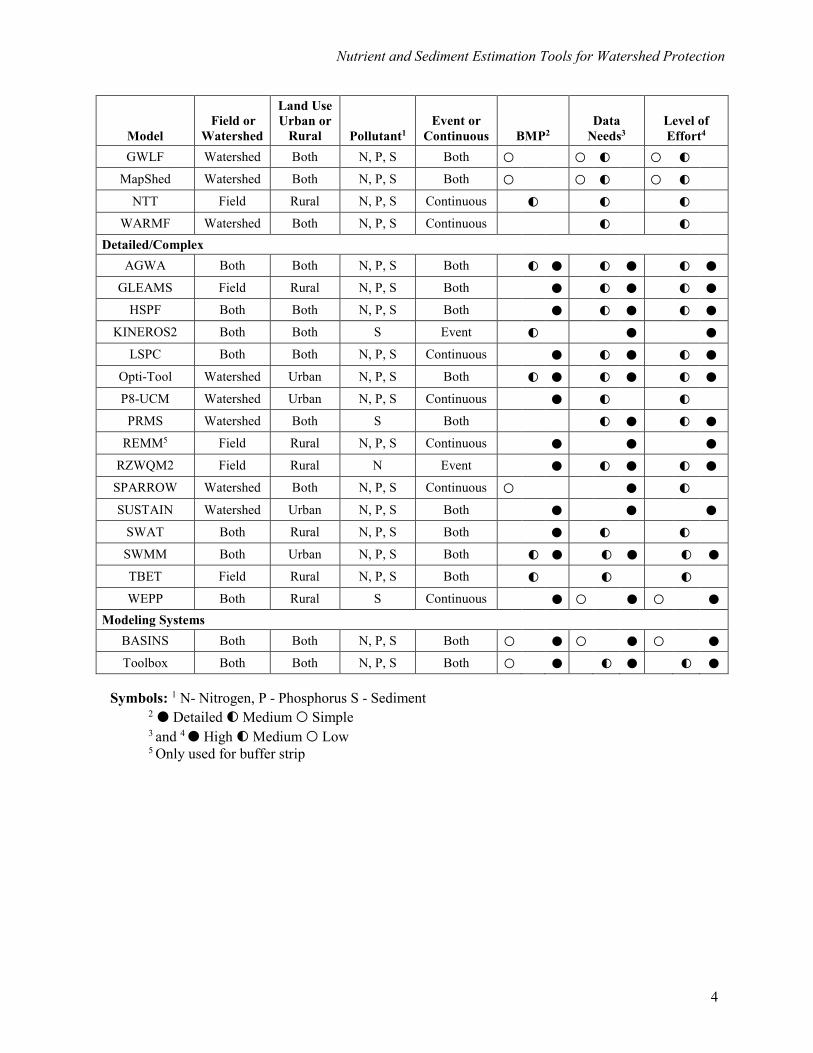
Once the intended use of a nutrient and sediment estimation tool is determined, such as the above examples, identify a model(s) that best fits the need by referring to Table 1. Table 1 compares models in terms of scale, sophistication, sector applicability and their ability to model BMPs. The document also provides a one paragraph description of each model. Please note the list of estimation tools discussed in this document is not exhaustive, nor are the comparison criteria used in Table 1.

Nutrient and Sediment Estimation Tools for Watershed Protection
3
Models for Estimating Nutrient Loads and Load Reductions
Comparison categories appearing across the top of Table 1 are:
Field or Watershed: Identifies whether the tool is suited to field-scale or watershed-scale estimates. Field scale estimates typically estimate loads at the edge of a farm field or urban segment prior to then entering the waterbody. Watershed scale estimates typically estimate loads that enter the waterbody and flow within in the stream or river.
Land Use Urban or Rural: Identifies the type of land use to which the tool is applicable.
Pollutant: Indicates which pollutant(s) the tool is able to estimate. Some tools estimate other loads as well but are not listed.
Event or Continuous: Describes the duration of time that the model estimates. When using event-based models (e.g., individual representative storms during the year), the user may wish to extrapolate results (e.g., either by summing the results of all simulated events, or multiplying the results of the representative storm by the average number of occurrences) to arrive at a monthly or annual total load reductions. The preferred approach for monthly or annual loads would be to use a tool identified as continuous, meaning it uses hourly or daily simulation that is then summarized within the tool itself.
BMP: Identifies at a cursory level if the tool is able to simulate a comprehensive, moderate, or simple list of best management practices (BMPs). The tools can usually estimate load reductions from one BMP or multiple BMPs.
Data Needs: Provides a generalized estimate of the amount of data that is needed to provision the tool (high, medium or low).
Level of Effort: Provides a general estimate of the overall level of effort and sophistication required to operate the tool.
Table 1. Comparison of models for estimating nutrient loads and load reductions
Model Field or
Watershed
Land Use Urban or
Rural Pollutant1 Event or
Continuous BMP2 Data
Needs3 Level of Effort4
Simple CAST Both Both P, N, S Event ○ ○ ○ LTHIA Both Both N, P, S Event ○ ○
NCANAT Field Rural N, P, S Event ○ ○ ○ Region 5 Field Both P, N, S Event ○ ○ ○ SELDM Both Urban N, P Event ○ ○ ○
Simple Method Watershed Urban N, P Event ○ ○ ○ STEPL Both Both P, N, S Event ○ ○ ◐ ○ ◐
Mid-Range AGNPS Both Rural N, P, S Both ● ◐ ● ◐ ●APEX Field Rural N, P, S Continuous ◐ ● ● EPIC Field Rural N, P, S Continuous ◐ ● ●
Nutrient and Sediment Estimation Tools for Watershed Protection
4
Model Field or
Watershed
Land Use Urban or
Rural Pollutant1 Event or
Continuous BMP2 Data
Needs3 Level of Effort4
GWLF Watershed Both N, P, S Both ○ ○ ◐ ○ ◐MapShed Watershed Both N, P, S Both ○ ○ ◐ ○ ◐
NTT Field Rural N, P, S Continuous ◐ ◐ ◐ WARMF Watershed Both N, P, S Continuous ◐ ◐
Detailed/Complex AGWA Both Both N, P, S Both ◐ ● ◐ ● ◐ ●
GLEAMS Field Rural N, P, S Both ● ◐ ● ◐ ●HSPF Both Both N, P, S Both ● ◐ ● ◐ ●
KINEROS2 Both Both S Event ◐ ● ● LSPC Both Both N, P, S Continuous ● ◐ ● ◐ ●
Opti-Tool Watershed Urban N, P, S Both ◐ ● ◐ ● ◐ ●P8-UCM Watershed Urban N, P, S Continuous ● ◐ ◐
PRMS Watershed Both S Both ◐ ● ◐ ●REMM5 Field Rural N, P, S Continuous ● ● ●
RZWQM2 Field Rural N Event ● ◐ ● ◐ ●SPARROW Watershed Both N, P, S Continuous ○ ● ◐ SUSTAIN Watershed Urban N, P, S Both ● ● ●
SWAT Both Rural N, P, S Both ● ◐ ◐ SWMM Both Urban N, P, S Both ◐ ● ◐ ● ◐ ●TBET Field Rural N, P, S Both ◐ ◐ ◐ WEPP Both Rural S Continuous ● ○ ● ○ ●
Modeling Systems BASINS Both Both N, P, S Both ○ ● ○ ● ○ ●Toolbox Both Both N, P, S Both ○ ● ◐ ● ◐ ●
Symbols: 1 N- Nitrogen, P - Phosphorus S - Sediment 2 ● Detailed ◐ Medium ○ Simple 3 and 4 ● High ◐ Medium ○ Low 5 Only used for buffer strip
Nutrient and Sediment Estimation Tools for Watershed Protection
5
Simple Models
CAST. The Chesapeake Assessment and Scenario Tool (CAST) is a web-based nitrogen, phosphorus and sediment load estimator tool that streamlines environmental planning in the Chesapeake Bay watershed. CAST was originally developed in 2011 with funding provided by the EPA, to provide local jurisdictions with a tool to provide input into the Chesapeake Bay TMDL watershed implementation process. The Chesapeake Bay Program released an update in 2017 to reflect the conversion to the Phase 6 Chesapeake Bay watershed model (Chesapeake Bay Program 2017). The tool requires the user to specify a geographic area (such as a county), and then select BMPs to apply on that area, with options for urban, septic, forest, agriculture, animals, and manure transport. The estimated cost of BMPs is also provided by the tool, so users may select the most cost-effective practices to reduce pollutant loads. The user may alternatively provide their own estimated cost data. CAST builds the scenario and provides estimates of nitrogen, phosphorus, and sediment load reductions from all sectors and sources, acres of each BMP, and costs for the scenario. These loads are consistent with the Chesapeake Bay Program’s Watershed Model. Users can create their own scenarios to develop an implementation strategy, calculate loading reductions and costs, or compare and modify existing scenarios to customize a watershed implementation analysis. CAST is free to the public and can be accessed at http://cast.chesapeakebay.net/.
A variation of this tool allows users to define the boundaries of a parcel and the land use areas within that parcel, called the Chesapeake Bay Facility Assessment Scenario Tool (BayFAST). (http://www.bayfast.org). The Maryland Scenario Assessment Tool (MAST) is the Maryland-specific version of CAST (http://www.mastonline.org). MAST has some Maryland-specific geographies available through the interface and also has loads available for historical years to assist with local TMDL watershed planning.
L-THIA. The Long Term Hydrologic Impact Analysis (L-THIA) model, developed by Purdue University, is a quick and accessible tool to estimate runoff, recharge, and nonpoint source (NPS) pollution resulting from past or proposed land use changes. L-THIA is available in three forms: L-THIA WWW, a spreadsheet version that models runoff and NPS pollution changes; ArcL-THIA, a set of Avenue scripts that automate the process of runoff impact modeling within ArcGIS (Park et al. 2013); and L-THIA GIS WWW, a form of L-THIA GIS that allows interactive mapping of an area of interest with a custom Java interface within a web browser (Lim et al 1999). L-THIA produces long-term average annual runoff, and associated nitrogen, phosphorus and suspended sediment loads (as well as bacteria and metals) for a given land use configuration based on long-term climate data for that area. Due to the use of long-term data, L-THIA focuses on average impact as opposed to a specific storm or an extreme year. Model inputs include location data, land use data, hydrologic soil groups, and land area. The model also produces graphical and tabular representations of output data to assist in the interpretation of results and to compare outputs from several runs to determine the best possible land use scenario. More information about L-THIA and L-THIA WWW can be found: https://engineering.purdue.edu/~lthia/. ArcL-THIA can be downloaded from: https://engineering.purdue.edu/mapserve/LTHIA7/arclthia/.
NCANAT. The North Carolina Nutrient Assessment Tool is a North Carolina-specific model that contains two agricultural field-scale tools, a Nitrogen Loss Estimation Worksheet (NLEW) and Phosphorus Loss Assessment Tool (PLAT). NCANAT was developed by North Carolina State University in collaboration with the North Carolina Department of Agriculture & Consumer Services, North Carolina Department of Environment and Natura Resources, and US Department of Agriculture (USDA) – Natural Resources Conservation Service (The N.C. PLAT Committee 2005). The agricultural nitrogen accounting tool, NLEW, uses a modified N-balance equation that accounts for nitrogen inputs and nitrogen reductions from nutrient management and BMPs. NLEW works at the field and county-level scales. PLAT is a mechanistic model that estimates potential loss of phosphorus from a field by considering particulate phosphorus, dissolved phosphorus, leachate phosphorus, and phosphorus source effects on

Nutrient and Sediment Estimation Tools for Watershed Protection
6
phosphorus loss. The model allows you to run each tool independently or together. Inputs include crop and field information, BMP types, nutrient application rate, soil data, drainage information, and hydrologic conditions. The outputs are phosphorus indexed ratings for each of the four loss pathways expressed verbally and numerically, total phosphorus rating, and total nitrogen loss for the various BMP scenarios. To find more information and download the model, visit: http://nutrients.soil.ncsu.edu/software/ncanat/
Region 5 Model. Region 5 Model (MDEQ 1999) is an Excel workbook that provides a gross estimate of sediment and nutrient load reductions from the implementation of agricultural and urban BMPs. The algorithms for non-urban BMPs are based on the "Pollutants controlled: Calculation and documentation for Section 319 watersheds training manual". The algorithms for urban BMPs are based on the data and calculations developed by Illinois EPA. A recent version of the Region 5 Model estimates the flow volume captured and treated by urban stormwater controls (infiltration practices) and adds the functionality of estimating baseline load based on the annual rainfall and event mean concentration in the surface runoff. The Region 5 Model is available to the public at http://it.tetratech-ffx.com/steplweb.
SELDM. The Stochastic Empirical Loading and Dilution Model (SELDM), an update to the FHWA Pollutant Loading Model for Highway Stormwater Runoff, was developed jointly by USGS and Federal Highway Administration (FHWA) in 2013 (Granato 2013). The new model incorporates the existing model in a new software platform and calculates the risk of exceeding water quality criteria with and without defined BMPs. SELDM calculates annual runoff loads and can run simple annual lake-loading analyses. The model provides information on the probability distributions of the following: precipitation characteristics, highway runoff volumes, highway runoff concentrations, upstream flow, upstream receiving-water concentrations, and structural BMP performance. Through USGS, national data sets are available for users to choose the most representative data for their site to use in the model. The available data includes highway-runoff quality, precipitation, streamflow, runoff coefficients, and background water quality. The most recent version includes a different formula to calculate exceedance percentiles. More information is available on the USGS site: https://webdmamrl.er.usgs.gov/g1/ggranato/Software/seldm.html
Simple Method. The Simple Method (Schueler 1987) is an empirical approach developed for estimating pollutant export from urban and developing areas. It is used at the site-planning level to predict pollutant loadings under a variety of development scenarios. This method is best used for a development site, watershed or subwatershed and when data availability is limited, as it requires a modest amount of information. The inputs include: drainage area, pollutant concentrations, a runoff coefficient, which uses impervious cover data, and precipitation data. Pollutant concentrations of phosphorus, nitrogen, chemical oxygen demand, biochemical oxygen demand, and metals are calculated from flow-weighted concentration values for new suburban areas, older urban areas, central business districts, hardwood forests, and urban highways. The method relies on the National Urban Runoff Program (NURP) data for default values. Information on The Simple Method can be found at the following web locations. https://www.des.nh.gov/organization/divisions/water/stormwater/documents/wd-08-20a_ch8.pdf or https://www.hydrocad.net/pdf/NY-Simple-Method.pdf
STEPL. Spreadsheet Tool for Estimating Pollutant Load (STEPL) employs simple algorithms to calculate nutrient and sediment loads from different land uses and the load reductions that would result from the implementation of various BMPs (Tetra Tech 2011). STEPL provides a user-friendly Visual Basic (VB) interface to create a customized spreadsheet-based model in Microsoft Excel. It computes watershed surface runoff; nutrient loads, including nitrogen, phosphorus, and 5-day biological oxygen demand (BOD5); and sediment delivery based on various land uses and management practices.

Nutrient and Sediment Estimation Tools for Watershed Protection
7
For each watershed, the annual nutrient loading is calculated based on the runoff volume and the pollutant concentrations in the runoff water as influenced by factors such as the land use distribution and management practices. The annual sediment load (sheet and rill erosion only) is calculated based on the Universal Soil Loss Equation (USLE) and the sediment delivery ratio. The sediment and pollutant load reductions that result from the implementation of BMPs are computed using the known BMP efficiencies. The STEPL package is available to the public at http://it.tetratech-ffx.com/steplweb.
Nutrient and Sediment Estimation Tools for Watershed Protection
8
Mid-Range Models
AGNPS. Agricultural Non-Point Source Pollution Model (AGNPS) (Young 1989), developed by the USDA Agricultural Research Service (ARS), is designed to estimate loads from agricultural watersheds and to assess the relative effects of alternative management programs. The term “AGNPS” no longer refers to the single event AGNPS of the mid-1990’s, but now refers to the system of modeling components. The model simulates surface water runoff along with nutrient (nitrogen, phosphorus, and organic carbon) and sediment constituents associated with agricultural nonpoint sources, as well as point sources such as feedlots, wastewater treatment plants, and streambank or gully erosion.
Several versions that integrate the model with geographic information system (GIS) and Windows-based graphical user interfaces are available. For instance, the Annualized AGNPS (AnnAGNPS) is a continuous-simulation, multi-event modification of the single-event model AGNPS, which can be used to estimate annualized loads and load reductions (Binger, Theurer and Yuan 2015). AnnAGNPS versions 5.0 and later incorporate enhanced features for many input and output options including ephemeral gullies, automated calibration for pollutants, actual or potential evapotranspiration climate files, and the ability to enter unlimited climate stations with any naming convention. AnnAGNPS also now has the capabilities of the revised universal soil loss equation (RUSLE), an erosion model that evaluates the degree of soil erosion caused by rainfall and associated overland flow and which is often used as a regulatory and conservation planning tool. Additionally, the capability of importing RUSLE2 databases into AnnAGNPS is now available. RUSLE2 is the advanced erosion model that extends the basic USLE structure but with a more user-friendly interface and that uses more physically meaningful input values that are widely available and easily obtained.
AnnAGNPS can now run more comprehensive evaluations of stream systems in regard to channel evolution, erosion, or in-stream structures with the integration of a channel network evolution model, CCHE1D, and a stream corridor model, CONCEPTS. The most recent version of AnnAGNPS also includes an updated output processer. For more information, visit https://www.nrcs.usda.gov/wps/portal/nrcs/detailfull/null/?cid=stelprdb1042468
APEX. The Agricultural Policy/Environmental eXtender (APEX) model (Gassman et al., 2010) was developed by the Blackland Research and Extension Center in Temple, Texas (http://epicapex.tamu.edu/apex/). The APEX model is a flexible and dynamic tool that can perform long-term simulations to addresses the impacts of management on environmental and production issues for whole farms and small watersheds. The modeling framework can evaluate a wide array of management strategies applied to crop, pasture, and grazing lands and estimates long-term sustainability of land management with respect to erosion due to water and wind, economics, water supply, water quality, soil quality, plant competition, weather and pests for crop land as well as grazing and pasture land. Management capabilities simulated include: irrigation; surface and subsurface drainage; furrow diking; buffer strips; terraces; waterways; windbreaks; fertilization and manure management, lagoons and water retention reservoirs, crop selection and rotation; fertilizer, nutrient and pesticide fate and application; grazing management; tillage timing and intensity; and harvest timing and methods. Furthermore, APEX can address strategic implications of global climate/CO2 changes; confined animal feeding facilities, production systems for bioenergy; and other spin off applications.
APEX’s unique feature is the ability to subdivide farms or fields by soil type, landscape position, surface hydrology or management configuration represent crop diversity and landscape characteristics within a field or farm. Each subarea may be linked with each other according to the water routing direction in the farm or watershed, starting from the most distant subarea towards the watershed outlet. Several APEX interfaces and tools have been developed to support the development of APEX application such as i_APEX, ArcGIS APEX, WinAPEX-GIS, and SWAT-APEX. A brief description of these tools can be found in Gassman et al., 2010. The APEX model can be downloaded from http://epicapex.tamu.edu/model-executables/.

Nutrient and Sediment Estimation Tools for Watershed Protection
9
EPIC. The Erosion Productivity Impact Calculator (EPIC) is a field-scale continuous simulation model that assesses the effects of soil erosion on agricultural productivity and water quality (Sharpley and Williams 1990). It can predict the effects of management decisions on soil, water, nutrient, and pesticide movements and their combined impacts on soil loss, water quality, and crop yields for areas of homogeneous soils and management. The model includes two options of estimating the peak runoff rate – the modified rational formula and the SCS TR-55 method. The EPIC wind erosion model, WECS (Wind Erosion Continuous Simulation), is used to calculate wind characteristics, including erosion due to wind. The model simulates several contamination processes including denitrification, mineralization, nitrate losses, organic nitrogen transport, nitrification, soluble phosphorus loss in surface runoff, and mineral phosphorus cycling. All forms of phosphorus can be differentiated within the model. EPIC has been improved over the years through additions of algorithms to simulate water quality, nitrogen and carbon cycling, climate change, and the effects of atmospheric carbon dioxide. The model can be configured for a wide range of crop rotations and other vegetative systems, tillage systems, and other management practices. The model can also assess the cost of erosion for determining optimal management strategies. A copy of EPIC can be obtained from http://epicapex.tamu.edu/model-executables/.
GWLF. The Generalized Watershed Loading Functions (GWLF) model was developed at Cornell University to assess the point and nonpoint loadings of nitrogen and phosphorus from a relatively large, agricultural and urban watershed and evaluate the effectiveness of certain land use management practices (Haith and Shoemaker. 1997). One advantage of this model is that it was written with the express purpose of requiring no calibration, making extensive use of default parameters. The GWLF model includes rainfall/runoff and erosion and sediment generation components, total and dissolved nitrogen and phosphorus loadings, and septic system loads and point source discharge data. The simulation results can be used to identify and rank pollution sources and evaluate basin-wide management programs and land use changes. The model also includes several reporting and graphical representations of simulation output to aid in interpretation of the results. For more information, download the document from this link http://cwam.ucdavis.edu/pdfs/GWLF.pdf.
Versions that integrate the model with GIS and Windows-based graphical user interfaces are available. BasinSIM 1.0 is a model that was developed at the Virginia Institute of Marine Science, College of William and Mary (http://web.vims.edu/bio/vimsida/bsabout.html), which predicts sediment and nutrient loads for small to mid-sized watersheds using the GWLF, a graphic Windows interface, and extensive databases. An in-stream routing and sediment transport component in BasinSIM 1.0 employs the algorithms in AnnAGNPS to simulate sediment transport.
MapShed. Pennsylvania State University developed a GIS-based tool that incorporates GWLF and enhances the functionality using a free GIS software package called MapWindow (Evans and Corradini 2016). MapShed replaces AVGWLF, which used proprietary ArcView software. Moving the tool to a free GIS platform makes it more accessible to a larger number of users. MapShed has enhanced capabilities, such as improved simulation of pollutant transport processes in urban settings, improved assessment of the effects of BMPs on pollutant load reduction, and the inclusion of streambank erosion, agricultural tile drainage routines. The tool automatically derives values for the required model input parameters for the watershed model. Through the interface the user can also access regional climate data to create weather data for a given watershed simulation. The latest version of MapShed includes more direct simulation of loads from farm animals and a new pathogen load estimation. MapShed also includes the GWLF-e model, which uses the algorithms previously included in PRedICT to evaluate the implementation of both rural and urban pollution reduction strategies at the watershed level. GWLF-e compares point and nonpoint pollution loads between scenarios of current and “future” conditions. Future scenarios could include different pollution reduction strategies, stream protection activities, septic system conversions to centralized wastewater treatment, and treatment plant upgrades. For more information, visit http://www.mapshed.psu.edu/index.htm.

Nutrient and Sediment Estimation Tools for Watershed Protection
10
MapShed is scheduled to be phased out by late 2018 and replaced by a web-based platform called Model My Watershed, which is a component of a larger application called Wikiwatershed. More information on these tools can be found at wikiwatershed.org.
NTT. The Nutrient Tracking Tool is a farm-scale tool developed by the Texas Institute of Applied Environmental Research (TIAER) at Tarleton State University in collaboration with USDA-NRCS (Saleh et al., 2011 and 2015). NTT is a user-friendly web-based platform to access the underlying APEX (Agricultural Policy Environmental eXtender) tool, which is a process-based model that uses soil, weather and management information to estimate on farm losses of sediment, nitrogen and phosphorus, through leaching and runoff, and to predict yields on cropland and pasture. APEX is described in more detail elsewhere within this document. NTT was designed to be accessible to the typical farmer and features a user-friendly interface and simplified inputs. The NTT interface allows users to delineate their field(s) using an interactive map for any location in the mainland U.S. and Puerto Rico. The interactive map captures the soils, slope, and weather specific to the selected area. The user can enter field management characteristics, including crop schedule, planting and harvesting dates, grazing operations, fertilizer/manure operations and tillage operations. The user may also indicate one or more conservation practices present on the field, including tile drains, irrigation, buffers, etc. In addition, there are many conservation practices that are represented as part of the field management information entered by the user, e.g. tillage, nutrient management and cover crops. NTT allows the user to enter multiple management scenarios for any field and compare losses between the baseline and conservation management scenarios. Users may choose to run fields individually, or simulate routing by linking the fields. The estimated losses are the result of a 30+ year simulation over historic weather and thus represent the average annual losses for the field given the crop rotation and management practices. Simulation results can be viewed as monthly averages or annual averages. The model can be accessed at http://nn.tarleton.edu/NTT/.
WARMF. The Watershed Analysis Risk Management Framework was developed by Systech Water Resources to support a watershed approach to simulating hydrologic, physical, chemical and biological processes to help users understand their watershed (Systech Engineering 2001). The model has a graphic user interface making it user-friendly. Land uses are represented at the catchment scale and multiple land uses, including urban and agricultural types, can be represented as a percentage of each catchment; point and non-point sources are represented spatially; and the user defines the routing through the watershed. Watershed physical processes can be simulated on a one minute up to a daily time step. Water volume and approximately 40 water quality parameters, including pH, metals, pesticides, nutrients, turbidity, algae, bacteria and mercury bioaccumulation, are simulated. WARMF can represent land use, river segments, canopy, bed sediment, and up to five soil layers. CE-QUAL-W2 was added to WARMF to include 2D reservoir modeling. The TMDL module allows users to define target criteria and WARMF to calculate the point and non-point source loading reductions and whether criteria are met. Multiple allocation scenarios can be run and displayed in the Consensus module, which presents the modeled data in a format suitable for technical and non-technical stakeholders. More information and a copy of the WARMF can be obtained at http://systechwater.com/warmf_software/.

Nutrient and Sediment Estimation Tools for Watershed Protection
11
Complex Models
AGWA. Automated Geospatial Watershed Assessment (AGWA), developed by the USDA-ARS Southwest Watershed Research Center, in cooperation with the EPA Landscape Ecology Branch, is designed to automate the transformation of spatial datasets into model input files for either KINEROS2 or SWAT and evaluate the model results (USDA, USEPA, University of Wyoming, n.d.). AGWA is a GIS-based system that can be used as an event-oriented or continuous daily time step model, depending on which watershed runoff and erosion simulation model the user chooses. AGWA is useful as a research tool for hydraulic modeling, but can also be used as a watershed assessment tool using hydraulic response as the metric of change. The effects of land use change can be assessed in small watershed to basin-scale studies, if multiple land cover data sets are available. AGWA can generate alternative future land-use/cover scenarios and display differences between simulation outputs designed to provide decision support when combined with planning efforts. AGWA does require a large set of GIS data and assumes the user has previously compiled the necessary GIS data layers. An AGWA Tools extension is available for ArcGIS and ArcView. AGWA 3.x utilizes new features in ArcGIS 10.x that are not available in ArcView 3.x. More information can be found here: https://www.epa.gov/water-research/automated-geospatial-watershed-assessment-agwa-tool-hydrologic-modeling-and-watershed.
GLEAMS. Groundwater Loading Effects of Agricultural Management Systems (GLEAMS) is a continuous simulation, field scale model, which was developed as an extension of the Chemicals, Runoff and Erosion from Agricultural Management Systems (CREAMS) model (Leonard et al. 1987). GLEAMS can be used to estimate surface runoff, sediment, nutrient, and pesticide losses from the field (e.g., edge-of-field) and nutrient leaching within, through and below the root zone. GLEAMS can provide estimates of the impact of management systems, such as planting dates, cropping systems, irrigation scheduling, and tillage operations, on the potential for chemical movement. Application rates, methods, and timing can be altered to account for these systems and to reduce the possibility of root zone leaching. The model also accounts for varying soils and weather in determining leaching potential. Erosion in overland flow areas is estimated using a modified Universal Soil Loss Equation (USLE). GLEAMS was not developed with the intention to be an absolute predictor of pollutant loading; it is a tool for comparative analysis of complex pesticide chemistry, soil properties, and climate. More information can be found at: https://www.ars.usda.gov/plains-area/temple-tx/grassland-soil-and-water-research-laboratory/docs/gleams/ and http://www.tifton.uga.edu/sewrl/Gleams/gleams_y2k_update.htm.
HSPF. The Hydrological Simulation Program-FORTRAN (HSPF) is a comprehensive package developed by Aqua Terra Consultants for EPA and USGS for simulating water quantity and quality for a wide range of organic and inorganic pollutants from complex watersheds to receiving waters (Bicknell et al. 2001). It is a comprehensive model of watershed hydrology and water quality that allows the integrated simulation of land and soil contaminant runoff processes with in-stream hydraulic and sediment-chemical interactions. The model uses continuous simulations of water balance, pollutant generation, transformation, and transport and incorporates the watershed-scale Agricultural Runoff Management Model (ARM) and Nonpoint Source Runoff Model (NPS) model. HSPF uses such information as the time series of rainfall, temperature, evaporation, and parameters related to land use patterns, soil characteristics, and agricultural practices to simulate watershed processes. Runoff flow rate, sediment loads, nutrients, pesticides, toxic chemicals, and other quality constituent concentrations can be predicted. The model uses these results and stream channel information to simulate instream processes. HSPF contains three application modules that simulate the hydrologic/hydraulic and water components of the watershed. One capability of the modules is the routing of phosphorus. PERLND, IMPLND, and RCHRES work together to model phosphorus behavior and balances along overland flow, interflow, groundwater flow, urban areas, and through stream channel networks and reservoirs. HSPF is one of the supported models of the EPA Better Assessment Science for Point and Nonpoint Sources, BASINS system and the Window-based HSPF model (WinHSPF) can be downloaded from the BASINS Web site at https://www.epa.gov/exposure-assessment-models/basins.
Nutrient and Sediment Estimation Tools for Watershed Protection
12
In addition, web-based HSPF tools were developed to extend the model’s application to urban watersheds with sewer system networks and to areas with flow-modifying BMPs, such as detention basins. The Green Tool represents infiltration-based stormwater control practices while the Gray Tool represents sewer networks and storage-based stormwater control structures. The toolkit can be used in low impact development (LID) modeling applications. More information about HSPF can be found at: https://www.epa.gov/exposure-assessment-models/hspf.
KINEROS2. Kinematic Runoff and Erosion Model 2 (KINEROS2) is an event-oriented, physically-based model that describes the processes of interception, infiltration, surface runoff, and erosion from small agricultural and urban watersheds (Woolhiser et al. 1990). The model allows for pipe flow and pond elements, as well as infiltrating surfaces and includes a partially paved element for use in urban area simulation. The model can be used to determine the effects of urban development, small detention reservoirs or lined channels on flood hydrographs and sediment yield. Both splash erosion and hydraulic erosion are simulated and soil and sediment can be distributed into up to five particle size classes. New features in KINEROS2 include an infiltration algorithm that handles a two-layer soil profile and incorporates a new method to redistribute soil water during rainfall interruptions. A detention pond model is also included in the new features and incorporates seepage through the wetted area, rainfall on the pond itself, and initial storage. The open channel algorithm in the model has been extended to allow a compound cross section where one section can differ in parameters from the other. Time varying inflow from external sources can also be included in the model system classes. The model is available from http://www.tucson.ars.ag.gov/kineros/.
LSPC. Loading Simulation Program in C++ (LSPC) is a watershed modeling system that includes streamlined Hydrologic Simulation Program FORTRAN (HSPF) algorithms for simulating hydrology, sediment, and general water quality on land, as well as a simplified stream transport model (Tetra Tech 2009). Land processes for pervious and impervious areas are simulated through water budget, sediment generation and transport, and water quality constituent generation and transport. Sediment production is based on detachment and/or scour from a soil matrix and transport by overland flow in pervious areas. Solids buildup and washoff is simulated for impervious areas. LSPC does not simulate BMPs explicitly; however, the essential functions of BMPs (such as detention, infiltration, and evapotranspiration losses), can be represented in LSPC through separate configuration of land and intermediate channel routing segments. More information can be found at: https://cfpub.epa.gov/si/si_public_record_Report.cfm?dirEntryId=75860&CFID=22884508&CFTOKEN=98267566. To obtain the model executable files and source codes, contact the EPA lead Tim Wool at [email protected].
Opti-Tool. Stormwater Nutrient Management Optimization Tool (Opti-Tool), developed by Tetra Tech for EPA Region 1, is a spreadsheet-based tool that provides both a planning level and an implementation level analysis to assist stormwater managers in developing technically sound and economically feasible management plans to address stormwater impacts and reduce excessive nutrient loadings (Tetra Tech 2016). The planning level analysis uses BMP performance curves and Excel Solver to identify an optimal solution. The implementation level analysis calls the SUSTAIN (System for Urban Stormwater Treatment and Analysis Integration) dynamic link library to estimate BMP performance and retrieve optimization results to provide cost-effective BMP sizing strategies.
Opti-Tool consists of a Microsoft-Excel platform and external EPA SUSTAIN BMP process and optimization modules. The user interacts with the Excel platform for data input, and can direct Excel to call the SUSTAIN module to estimate BMP performance and provide optimization at a given assessment point in the watershed. The user-friendly tool provides the ability to evaluate options for determining the best mix of structural BMPs in a particular geographic area to achieve quantitative water resource goals. The tool incorporates long-term runoff responses (Hydrologic Response Unit (HRU) time series) for regional climate conditions that are calibrated to regional monitored stormwater data and annual average

Nutrient and Sediment Estimation Tools for Watershed Protection
13
load export rates from 9 major land uses. Also, the tool includes regionally representative BMP cost functions and regionally calibrated BMP performance parameters for 4 pollutants including total phosphorus and total nitrogen to calculate long-term cumulative load reductions for a variety of structural controls (Tetra Tech, 2010). Structural controls simulated by the tool include LID and green infrastructure (GI) practices such as infiltration systems, biofiltration and gravel wetlands.
Opti-Tool is designed to provide a flexible and yet consistent platform for local decision-makers and stormwater practitioners to develop and implement technically sound and robust nutrient management plans capable of demonstrating accountable progress and compliance with permit requirements based on TMDLs that include stormwater impacts and excessive nutrient loadings. The default data used in the tool is customized for New England region, but the data can easily be updated to use for any other location outside the New England region. The Opti-Tool package is available to the public at https://www.epa.gov/npdes-permits/massachusetts-small-ms4-general-permit.
P8-UCM. Program for Predicting Polluting Particle Passage through Pits, Puddles, and Ponds – Urban Catchment Model (P8-UCM) predicts the generation and transport of stormwater pollutants in urban watersheds (Walker and Walker 2015). Continuous water balance and mass balance calculations are performed on a user-defined system consisting of watersheds, treatment devices (such as runoff storage, treatment areas, and BMPs), particle classes, and water quality components. Simulations are driven by continuous hourly rainfall and daily air temperature time series data. The model simulates pollutant transport and removal in a variety of treatment devices (BMPs), including swales, buffer strips, detention ponds, flow splitters, and infiltration basins, pipes and aquifers. Water quality components include total suspended solids, broken into five size classes, total phosphorus, total Kjeldahl nitrogen, copper, lead, zinc and hydrocarbons. Version 3.5 has been updated to be compatible with Excel versions up to 2013 and Windows 7, 8 or 10. This version also supports the conversion of temperature and precipitation files from Excel formats. This model is available from http://www.wwwalker.net/p8/.
PRMS. The Precipitation-Runoff Modeling System is a―modular-design, deterministic, distributed-parameter, physical-process watershed model that was developed to evaluate the effects of various combinations of precipitation, climate, and land use on watershed response (Leavesley et al. 2005). Each watershed is divided into hydrologically homogeneous units, based on slope, aspect, elevation, vegetation, soils and precipitation distribution. These units are known as hydrologic response units (HRUs). The response from all HRUs is summed to develop the system response and streamflow. Watershed response can be simulated at both a daily and a storm time scale. Response to normal and extreme rainfall and snowmelt can be simulated to evaluate changes in water-balance relations, flow regimes, flood peaks and volumes, soil-water relations, sediment yields, and ground-water recharge. PRMS was redesigned and is now a component of the USGS Modular Modeling System (MMS), which has a GIS interface. Version 4.0.3 was released in June 2017. A copy of the model can be obtained from https://wwwbrr.cr.usgs.gov/projects/SW_MoWS/PRMS.html.
REMM. Riparian Ecosystem Management Model (REMM) is a tool to quantify the water quality benefits of riparian buffers (Lowrance et al. 2000). REMM simulates movement and water storage in a process-based two-dimensional water balance. The model simulates the movement of surface and subsurface water, sediment transport and deposition, nutrient transport, sequestration and cycling, and vegetative growth in riparian forest systems on a daily timestep. Each riparian system is comprised of three zones between the field and the waterbody. The zones consist of undisturbed forest, managed forest, and runoff control. Together the three zones include litter, three soil layers, and a plant community with six plant types in two canopy levels. REMM can be used to quantify nitrogen and phosphorus trapping in the riparian buffer zone, to determine buffer effectiveness, to investigate the long-term fate of nutrients in the buffer zones, to evaluate the influence of vegetation type on buffer effectiveness, and to determine the impacts of harvesting on buffer effectiveness. Future modifications include aims to adequately represent variations in riparian slope shape – convergence/divergence, spatial variation in streambank flooding, as

Nutrient and Sediment Estimation Tools for Watershed Protection
14
well as to include an ArcView interface to incorporate the spatial variability. REMM can be downloaded at: http://www.tifton.uga.edu/remmwww/.
RZWQM2. The Root Zone Water Quality Model, developed by the USDA Agricultural Research Service, is a one-dimensional (vertical in the soil profile) process-based model that simulates the growth of the plant and the movement of water, nutrients and pesticides over, within and below the crop root zone within an agricultural cropping area (USDA RZWQM website). RZWQM2 (Ma et al. 2012) is the revised and enhanced version of the model, which was developed to include the DSSAT 4.0 Cropping System Models with the cooperation of the University of Georgia and DSSAT modeling group. RZWQM2 has a quasi-two-dimensional macro pore/lateral flow component. The primary function of the model is to assess the effects of alternative agricultural management strategies on nitrate and pesticide loading to groundwater, and by extension the nonpoint source runoff loading to surface waters. Tile drainage can be simulated. Alternative management strategies in the model include conservation plans, tillage and residue practices, crop rotation, planting data and density, and irrigation, fertilizer and pesticide application, amount and timing. Six sub-processors represent physical processes (hydraulic, infiltration, chemical transport during infiltration and runoff, soil heat flow, etc.), plant growth processes (carbon dioxide assimilation, carbon allocation, dark respiration, mortality, root growth, etc.), soil chemical processes (soil pH, solution concentrations of ions, and adsorbed cations on the exchange complex), nutrient processes ( carbon and nitrogen transformation – mineralization, nitrification, immobilization, denitrification and volatilization), pesticide processes (pesticide fate, transformation, degradation, etc.) and management processes (tillage practices and the impacts on surface roughness, soil bulk density; fertilizer, pesticide and manure applications; crop planting, irrigation schedules and BMP algorithms for dynamic nitrogen-rate determination). The Generic Crop Growth model is parameterized to simulate corn, soybean and wheat fields, however, users may parameterize their own generic crop. The DSSAT Cropping System Models simulate growth and development of 23 crop species with many varieties each. Frozen soil dynamics are not represented. A copy of the model can be obtained from https://www.ars.usda.gov/plains-area/fort-collins-co/center-for-agricultural-resources-research/rangeland-resources-systems-research/docs/system/rzwqm/.
SPARROW. SPAtially Referenced Regression On Watershed attributes (SPARROW) is an empirical, regression-based model using mass balance calculations to relate in-stream water quality measurements to spatially referenced characteristics of watersheds (Smith et al. 1997). Riverine pollutant loading rate predictions can be made for sediment, nutrients and other contaminants. Pollutants can be simulated at different spatial scales, depending on the level of detail in the datasets, and different temporal scales, either annually or for a user-defined modeling period. National level datasets such as RF1 (stream reach file), NLCD (USGS land use/land cover) and STATSGO (NRCS soil data) can be used. Estimates of pollutant loads and fate/transport characteristics are somewhat coarse due to the use of national and regional water quality datasets to develop the statistical relationship between stream processes and the model outputs. More information can be found here: https://water.usgs.gov/nawqa/sparrow/.
SUSTAIN. System for Urban Stormwater Treatment and Analysis Integration (SUSTAIN) is a decision support system to facilitate selection and placement of BMPs and LID techniques at strategic locations in urban watersheds (Shoemaker, et. al., 2009). Tetra Tech designed and developed the tool for the EPA, Office of Research and Development (ORD). SUSTAIN was designed for use by watershed and stormwater practitioners to develop, evaluate, and select optimal BMP combinations at various watershed scales on the basis of cost and effectiveness at protecting source waters and meeting water quality goals. SUSTAIN is a tool for answering the following questions: (1) How effective are BMPs in reducing runoff and pollutant loadings? (2) What are the most cost-effective solutions for meeting objectives? and (3) Where, what type, and how big should BMPs be?
Various practitioners, municipalities, and watershed groups at the regional and local levels can use SUSTAIN to address a variety of stormwater management planning questions on: (1) developing TMDL

Nutrient and Sediment Estimation Tools for Watershed Protection
15
implementation plans, (2) identifying management practices to achieve pollutant reductions in an area under an MS4 stormwater permit, (3) determining upstream source control strategies for reducing volume and peak flows to CSO systems, and (4) evaluating the benefits of distributed BMP implementation on water quantity and quality in urban streams. SUSTAIN has seven key components: framework manager with ArcGIS 9.3 interfaces, BMP siting tool, land module, BMP module, conveyance module, optimization module, and post-processor. They are integrated under a common ArcGIS platform. SUSTAIN supports evaluation of BMP placement at multiple scales from a few city blocks to large watersheds. SUSTAIN provides a public domain tool that incorporates the best available research that could be practically applied to decision making including the tested algorithms from SWMM, HSPF, and other BMP modeling techniques. Linking those methods into a seamless system provides a balance between computational complexity and practical problem solving. The modular approach used in SUSTAIN facilitates updates as new solutions become available. The software and the technical reports (Shoemaker, et. al., 2009, 2012, and 2013) are available for download at: http://www.epa.gov/water-research/system-urban-stormwater-treatment-and-analysis-integration-sustain.
SWAT. The Soil and Water Assessment Tool (SWAT) is a river basin or watershed scale model that can be used to predict the impact of land management practices on water, sediment and agricultural chemical yields in complex watersheds with varying soils, land use and management conditions over long periods of time (Neitsch et al. 2011). The model is continuous, physically-based, and requires specific information about weather, soil properties, topography, vegetation, and land management practices occurring in the watershed. The physical processes associated with water movement, sediment movement, crop growth, nutrient cycling, etc. are directly modeled by SWAT using this input data. The model offers many agricultural BMPs and practices, but limited urban BMPs. Current urban BMPs include detention basins, infiltration practices, vegetative filter strips, street sweeping, and wetlands. SWAT is one of the supported models of EPA BASINS 4.1 system. The model can be downloaded at http://swatmodel.tamu.edu.
SWMM. The EPA Storm Water Management Model (SWMM) is a comprehensive watershed model which is widely used for analysis of water quality and quantity problems related to stormwater runoff, combined sewers, sanitary sewers, and other drainage systems in urban areas, with many applications in non-urban areas as well, including floodplain hydraulics and analysis (Rossman 2015). SWMM simulates hydrographs and pollutographs (concentration vs. time) at any point in the drainage system. Rainfall/runoff simulation is accomplished by the nonlinear reservoir approach. The lumped storage scheme is applied for soil/groundwater modeling. For impervious areas, a linear formulation is used to compute daily/hourly increases in particle accumulation. For pervious areas, a modified USLE determines sediment load. SWMM can be used to evaluate the effectiveness of BMPs for reducing wet weather pollutant loadings, reduction in dry-weather buildup due to street cleaning, reduction in constituent concentration through treatment in storage units or by natural processes in pipes and channels, and designing control strategies for minimizing combined sewer overflows. SWMM is available for download at: https://www.epa.gov/water-research/storm-water-management-model-swmm. The updated model allows engineers and planners to accurately represent any combination of LID controls within an area to evaluate their effectiveness in regard to stormwater and combined sewer overflow management.
TBET. Texas Best Management Practice Evaluation Tool (TBET) is a simplified graphic user interface for SWAT and developed for field-scale application in Texas (White and Harmel 2012). TBET is an input/output interpreter that uses a simpler version of SWAT that predicts mean annual runoff, sediment, nitrogen, and phosphorus losses from agricultural fields under various agricultural BMP scenarios and conservation practices. Each farm is limited to 10 fields, and each field is limited to 3 soil types. Internal databases account for local climate, soils, topography, and management. The most recent version of the tool can be downloaded: https://nlet.brc.tamus.edu/Home/Other. More information can be found: https://nlet.brc.tamus.edu/data/Other/Users%20Manual.pdf.

Nutrient and Sediment Estimation Tools for Watershed Protection
16
WEPP. The Watershed Erosion Prediction Project (WEPP) is a process-based, distributed parameter, continuous simulation model that can be used to estimate soil erosion and sediment delivery from hillslope profiles, as well as for simulation of the hydrologic and erosion processes on small watersheds (USDA Agricultural Research Service 1995). Processes considered in hillslope profile model applications include rill and inter-rill erosion, sediment transport and deposition, infiltration, soil consolidation, residue and canopy effects on soil decomposition, percolation, evaporation, transpiration, snow melt, frozen soil effects on infiltration and erodibility, climate, tillage effects on soil properties, effects of soil random roughness, and contour effects including potential overtopping of contour ridges. In watershed applications, the model allows linkage of hillslope profiles to channels and impoundments. The latest version of the WEPP model including a Windows version and related utilities (e.g., climate generator) can be downloaded from http://www.ars.usda.gov/Research/docs.htm?docid=10621. Simpler and web-based versions of the WEPP model mainly targeted for specific BMPs in forests are also available on the Web site. Version 2012.8 of the model includes updates such as new channel routing code, water balance updates involving tile drainage, additional frozen soil hydraulic conductivity factors, and fixed model bugs.

Nutrient and Sediment Estimation Tools for Watershed Protection
17
Watershed Modeling Systems
BASINS. Better Assessment Science Integrating point and Nonpoint Sources (BASINS) is a multipurpose environmental analysis system designed for watershed and water quality-based studies. BASINS works with a GIS framework and consists of: (1) national databases; (2) assessment tools; (3) a watershed delineation tool; (4) classification utilities; (5) characterization reports; (6) watershed loading and transport models HSPF and SWAT; (7) a simplified GIS-based model (PLOAD) that estimates annual average nonpoint source pollutant loads; (8) the Automated Geospatial Watershed Assessment (AGWA) tool, a GIS-based hydrologic modeling tool; and (9) the Parameter Estimation (PEST) tool for model calibration. BASINS has the flexibility to perform simple watershed-level screening analysis or detailed water quality modeling. Unlike previous versions, BASINS 4.0 runs on non-proprietary, open source GIS system architecture. However, v4.0 does not include linkages to AGWA and SWAT models. Versions 3.1 and 4.0 can coexist in the same folder and still function properly. BASINS version 4.1 is built upon the latest stable version of the open-source MapWindow GIS. The interface of BASINS 4.1 has changed from BASINS 4.0, however, the functions remain the same. BASINS 4.1 also includes updated watershed delineation tools that use version 5 of Terrain Analysis Using Digital Elevation Model (TauDEM) from Utah State University. The newest version of BASINS also uses DFLOW, a tool to estimate design stream flows for use in water quality studies. The latest version of BASINS can be downloaded from https://www.epa.gov/exposure-assessment-models/basins.
TMDL Modeling Toolbox. The TMDL Modeling Toolbox is a collection of models, tools and databases used in the development of Total Maximum Daily Loads (TMDLs). The Toolbox provides the capability to more readily integrate watershed loading models with receiving water applications. Although each model is a stand-alone application, the Toolbox provides an exchange of information between the models through common linkages. Models and tools included in the Toolbox are the Gray Tool, the Green Tool, Desktop HDFT, HDFT Web Version, and HSPF. More information about the Toolbox can be found at: https://www.epa.gov/sites/production/files/2015-10/documents/toolbox-overview.pdf. The Toolbox can be accessed at https://www.epa.gov/exposure-assessment-models/tmdl-models-and-tools.

Nutrient and Sediment Estimation Tools for Watershed Protection
18
References
Bicknell, B.R., J.C. Imhoff, J.L. Kittle, Jr., T.H. Jobes, and A.S. Donigian, Jr. 2001. Hydrological Simulation Program – FORTRAN (HSPF) Version 12 User’s Manual. Prepared for U.S. Geological Survey, Hydrologic Analysis Software Support Program, Reston, VA and U.S. Environmental Protection Agency, Office of Research and Development, Athens, GA. Prepared by AQUA TERRA Consultants, Mountain View, CA.
Binger, R.L., F.D. Theurer, and Y. Yuan. 2015. AnnAGNPS Technical Processes Documentation Version 5.4.
Chesapeake Bay Program. 2017. Chesapeake Assessment and Scenario Tool (CAST) Version 2017. Chesapeake Bay Program Office. http://cast.chesapeakebay.net/About.
Evans, B.M. and K. J. Corradini. 2016. MapShed Version 1.5 Users Guide. Prepared for Penn State Institutes of Energy and the Environment. University Park, PA.
Evans. B.M., D.W. Lehning, K.J. Corradini, G.W. Petersen, E. Nizeyimana, J.M. Hamlett, P.D. Robillard, R.L. Day. 2002. A comprehensive GIS-based modelling approach for predicting nutrient loads inwatersheds. Journal of Spatial Hydrology. 2(2).
Foster, G. R., L. J. Lane, J. D. Nowlin, J. M. Laflen, and R. A. Young. 1980. A model to estimate sediment yield from fieldsize areas: Development of model. In CREAMS: A Field-Scale Model for Chemicals, Runoff, and Erosion from Agricultural Management Systems, 36-64. W. G. Knisel, ed. Conservation Research Report No. 26. Washington, D.C.: USDA Science and Education Administration.
Gassman, P.W., J.R. Williams, X. Wang, A. Saleh, E. Osei, L. Hauck, C. Izaurralde, and J. Flowers. 2010. The Agricultural Policy Environmental Extender (APEX) Model: An emerging tool for landscape and watershed environmental analyses. Technical Report. Center for Agricultural and Rural Development, Iowa State University, Ames, Iowa. Published in the American Society of Agricultural and Biological Engineers ISSN 2151-0032, Vol. 53(3):711-740.
Gowda, P. H., B. J. Dalzell, and D. J. Mulla. 2007. Model-based nitrate TMDLs for two agricultural watersheds of southeastern Minnesota. Journal of the American Water Resources Association. 43(1):1-10.
Granato, G.E. 2013. Stochastic empirical loading and dilution model (SELDM) version 1.0.0. U.S. Geological Survey Techniques and Methods, Book 4, Chapter C3, pp.112.
Haith, D.A. and L.L. Shoemaker. 1987. Generalized watershed loading functions for stream flow nutrients. Water Resources Bulletin. 23(3):471-478.
Knisel, W. G., R. A. Leonard, and F. M. Davis. 1993. The GLEAMS Model Plant Nutrient Component: Part I: Model Documentation. Tifton, Ga.: University of Georgia, Department of Agricultural Engineering.
Leavesley, G.H., S. L. Markstrom, R. J. Viger, and L. E. Hay (2005), USGS Modular Modeling System (MMS) - Precipitation-Runoff Modeling System (PRMS) MMS-PRMS, in Singh, V., and Frevert, D., eds., Watershed Models. Boca Raton, FL, CRC Press, p. 159-177.
Leonard, R. A., W. G. Knisel, and D. A. Still. 1987. GLEAMS: Groundwater loading effects of agricultural management systems. Trans. ASAE 30(5):1403-1418.
Lim, K.J., Engel, B.A., Kim,Y., Bhaduri, B. and J. Harbor. 1999. Development of the Long Term Hydrologic Impact Assessment (L THIA) WWW Systems. Soil Conservation Organization Meeting, May 24-29, 1999. p.1018-1023.
Nutrient and Sediment Estimation Tools for Watershed Protection
19
Lowrance, R., L.S. Altier, R.G. Williams, S.P. Inamdar, J.M. Sheridan, D.D. Bosch, R.K. Hubbard, and D.L. Thomas. 2000. REMM: The Riparian Ecosystem Management Model. Journal of Soil and WaterConservation. 55(1):27-34.
Ma, L., L.R. Ahuja, B.T. Nolan, R.W. Malone, T.J. Trout and Z. Qi. 2012. Root zone water quality model (RZWQM2): model use, calibration, and validation. Transactions of the ASABE. 55(4): 1425-1446.
MDEQ (Michigan Department of Environmental Quality). 1999. Pollutants Controlled Calculation and Documentation for Section 319 Watersheds Training Manual. Lansing, MI.
Neitsch, S.L., J.G. Arnold, J.R. Kiniry, J.R. Williams. 2011. Soil and Water Assessment Tool Theoretical Documentation Version 2009. Texas Water Resources Institute Technical Report No. 406. Texas A&M University System, College Station, TX.
Park, Y.S., K.J. Lim, L. Theller, and B.A. Engel. 2013. L-THIA GIS Manual. Department of Agricultural and Biological Engineering, Purdue University.
Rossman, L.A. 2015. Storm Water Management Model User’s Manual Version 5.1. U.S. Environmental Protection Agency, Office of Research and Development, National Risk Management Laboratory. Cincinnati, OH.
Saleh, A. O. Gallego, and E. Osei. 2015. Evaluating Nutrient Tracking Tool and Simulated Conservation Practices. Journal of Soil and Water Conservation. 70(5):115A-120A.
Saleh, A., O. Gallego, E. Osei, H. Lal, C. Gross, S. McKinney, and H. Cover. 2011. Nutrient Tracking Tool –a user-friendly tool for calculating nutrient reductions for water quality trading. Journal of Soil and Water Conservation. 66(6):400-410.
Schueler, T. 1987. Controlling Urban Runoff: A Practical Manual for Planning and Designing Urban BMPs. Metropolitan Washington Council of Governments. Washington, DC.
Sharpley, A.N. and J.R. Williams, eds. 1990. EPIC- Erosion/Productivity Impact Calculator: 1 Model Documentation. U.S. Department of Agriculture Technical Bulletin No. 1768. Agricultural Research Service.
Shoemaker, L., J. Riverson, K. Alvi, J. X. Zhen, R. Murphy, B. Wood. 2013. Stormwater Management for TMDLs in an Arid Climate: A Case Study Application of SUSTAIN in Albuquerque, New Mexico. EPA/600/R-13/004. U.S. Environmental Protection Agency, Water Supply and Water Resources Division, National Risk Management Research Laboratory, Cincinnati, OH.
Shoemaker, L., J. Riverson, K. Alvi, J. X. Zhen, and R. Murphy. 2012. Report on Enhanced Framework (SUSTAIN) and Field Applications to Placement of BMPs in Urban Watersheds. EPA/600/R-11/144. U.S. Environmental Protection Agency, Washington, DC.
Shoemaker, L., J. Riverson, K. Alvi, J. X. Zhen, S. Paul, and T. Rafi. 2009. SUSTAIN—A Framework for Placement of Best Management Practices in Urban Watersheds to Protect Water Quality. EPA/600/R-09/095. U.S. Environmental Protection Agency, Washington, DC.
Skaggs, R. W. 1980. A Water Management Model for Artificially Drained Soils. Tech. Bulletin No. 267. Raleigh, N.C.: North Carolina State University, North Carolina Agricultural Research Service.
Smith, R.A., G.E. Schwarz, and R.B. Alexander. 1997. Regional interpretation of water quality monitoring data. Water Resources Research. 33(12):2781-2798.

Nutrient and Sediment Estimation Tools for Watershed Protection
20
Systech Engineering. 2001. Watershed Analysis Risk Management Framework: Update One: A Decision Support System for Watershed Analysis and Total Maximum Daily Load Calculation, Allocation and Implementation. Prepared for EPRI, Palo Alto, CA. Prepared by Systech Engineering, San Ramon, CA.
Tetra Tech, Inc. 2009. Loading Simulation Program in C++ (LSPC) Version 3.1 User’s Manual. Fairfax, VA.
Tetra Tech, Inc. 2010. Stormwater Best Management Practices (BMP) Performance Analysis. Prepared for: U.S. EPA Region 1, Boston, MA. Prepared by: Tetra Tech, Inc. Fairfax, VA.
Tetra Tech, Inc. 2011. User’s Guide Spreadsheet Tool for the Estimation of Pollutant Load (STEPL) Version 4.1. Prepared for U.S. Environmental Protection Agency, Washington, DC. Prepared by Tetra Tech, Inc. Fairfax, VA.
Tetra Tech, Inc. 2016. Opti-Tool for Stormwater and Nutrient Management User’s Guide. Prepared for U.S. Environmental Protection Agency, Region 1. Boston, MA. Prepared by Tetra Tech, Inc., Fairfax, VA.
The N.C. PLAT Committee. 2005. North Carolina Phosphorus Loss Assessment: I. Model Description and II. Scientific Basis and Supporting Literature. North Carolina Agricultural Research Service Technical Bulletin 323. North Carolina State University, Raleigh, NC.
USDA Agricultural Research Service (ARS). RZWQM – Root Zone Water Quality Model website. http://www.ars.usda.gov/Main/docs.htm?docid=17740. Last accessed June 02, 2017.
USDA ARS National Soil Erosion Research Laboratory. 1995. Technical Documentation USDA-Water Erosion Prediction Project (WEPP). West Lafayette, IN.
USDA ARS Southwest Watershed Research Center, USEPA Office of Research and Development and University of Wyoming Rangeland Ecology and Watershed Management. N.D. Automated Geospatial Watershed Assessment (AGWA) 3.X User Guide.
Walker, W.W. and J.D. Walker. 2015. P8 Urban Catchment Model Version 3.5. Concord, MA.
White, M. and D. Harmel. 2012. Texas BMP Evaluation Tool (TBET) Users Guide Version 0.2. U.S. Department of Agriculture Grassland Soil and Water Research Laboratory. Temple, TX.
Woolhiser, D.A., R.E. Smith, and D.C. Goodrich. 1990. KINEROS, A Kinematic Runoff and Erosion Model: Documentation and User Manual. U.S. Department of Agriculture, Agricultural Research Service, ARS-77, 130pp.
Young, R.A., C.A. Onstad, D.D. Bosch, and W.P. Anderson. 1989. AGNPS: A nonpoint-source pollution model for evaluating agricultural watersheds. Journal of Soil and Water Conservation. Vol 44 (2) 168-173.