numerical stress-life curves for the aisi 4340 steel using
TRANSCRIPT

Thematic Section: Solid Mechanics in Brazil 2017
Latin American Journal of Solids and Structures, 2018, 15 11 Thematic Section , e89
Numerical stress-life curves for the AISI 4340 steel using two sets of materials properties and different bi-axial stress ratios
Abstract Fatigue assessments by the more robust strain-based approach demand the determination of the local strain history from nominal stresses. For notched members, a cyclic constitutive relation, the stress concentration factor SCF and a strain concentration rule are used with this aim in some approximate solutions. The plastic part of the cyclic constitutive relations for many materials is well adjusted by a Ramberg-Osgood RO type equation. The parameters in the RO equation are the cyclic strength coefficient and exponent H’ and n’ respectively. These parameters can be experimentally determined or estimated from the condition of strain compatibility between the RO and the Coffin-Manson-Basquin CMB equations. The present paper discusses the influence that the use of both types of parameters, independent or experimentally determined and compatible or estimated , has on the numerical stress-life curves of the AISI 4340 Aircraft Quality steel. By numerical stress-life curves we mean the stress amplitudes and the fatigue-life that result from the numerical solution of both, the strain-life CMB and the stress-strain RO relations, for the same strain amplitude. This would be equivalent to using a linear strain concentration rule notched members with two RO equations, one with independent parameters and the other with compatible parameters, for stress and life calculations. The effects of the stress state are also accounted for in the present investigation since both, stress-life and stress-strain equations are modified in accordance with the total deformation theory of plasticity and through the introduction of a plane stress biaxial ratio. The principal finding of the present paper is that, for the studied material, the numerical stress-life curves that result from the use of compatible and independent parameters are indistinguishable for the same stress state. Consequently, there are no important implications on life time calculations when the cyclic stress-strain curve is estimated in such a way that compatibility conditions for the AISI 4340 aircraft quality steel are ensured.
Keywords low-cycle fatigue, Coffin-Manson equation, Ramberg-Osgood model, lifetime predictions
1 INTRODUCTION
Local approaches have found wide acceptance for modeling the fatigue phenomenon mainly because the damage process that leads to this type of failure is highly localized. The philosophy underlying the fatigue strain-based approach is simple: the local cyclic strain history in regions of stress concentration, being experimentally related to the number of fatigue cycles, can be used as a parameter for design purposes Stephens et al. 2000 . The robustness of the strain as a fatigue parameter is enhanced in the elastic-plastic regime and for materials with low strain hardening characteristics. Nevertheless the local strain-based approach for fatigue analysis is also adequate in the high cycle fatigue regime. Even when most part of the component is under elastic conditions, some volumes, mainly in the neighborhood of the unavoidable notches, can undergo plastic deformation. No matter the model that is used for defining fatigue damage, i.e. the degradation in ductility properties of the material due to cyclic slip of crystal grains Murakami and Miller 2005 or the behavior of small cracks Murakami et. al 2016, Murakami and Miller 2005 , the Coffin-Manson equation still convincingly represents the
Jorge Alberto Rodriguez Durana* Dionisio Jose Rodrigues da Costaa Luiz Carlos de A. Ribeiro Juniora
a Escola de Engenharia Industrial Metalúrgica de Volta Redonda, Universidade Federal Fluminense UFF , Volta Redonda, Rio de Janeiro, Brasil. E-mail: [email protected], [email protected], [email protected]
*Corresponding author
http://dx.doi.org/10.1590/1679-78254308
Received: July 24, 2017 In Revised Form: December 05, 2017 Accepted: April 20, 2018 Available Online: May 08, 2018

Jorge Alberto Rodriguez Duran et al. Numerical stress-life curves for the AISI 4340 steel using two sets of materials properties and different bi-axial stress ratios
Latin American Journal of Solids and Structures, 2018, 15 11 Thematic Section , e89 2/12
amplitude strain εa versus number of cycles Nf or number of reversals 2.Nf experimental data. For uniaxial loading in the first principal direction this relation is:
11 11 11
' 2' 2
b
cf fe pa a a f f
NN
E
1
In Eq. 1 σ’f and ε’f are the fatigue strength and ductility coefficients, respectively, while b and c are the corresponding fatigue exponents. Laboratory uniaxial strain-controlled tests, normally performed under a constant minimum to maximum strain ratio R εmin/εmax 1, provides the necessary set of εa and Nf data for the determining the fatigue coefficients and exponents in Eq. 1 . The elastic εae and plastic εap components of the total strain εa are separated and a simple linear regression is made to fit the experimental data to each term in Eq. 1 . The material parameters can also be found applying numerical procedures Nieslony et al. 2012 and the
more recent 3D method Nieslony et al. 2008 . There are also methods that allow the estimation of these parameters from tensile or hardness properties Kim et al 2002 and Troshchenko and Khamaza, 2010 . In these cases, however, care must be taken for not using the same estimates for different alloys groups Meggiolaro and Castro 2004 .
Neglecting the transients of cyclic softening or hardening, the local strains necessary for life-time calculations according to Eq. 1 can be directly related to the applied stresses and consequently to the external loads through the stabilized cyclic stress-strain curve of the material. For many materials, equations that have the Ramberg-Osgood form can be used to represent these curves:
1
'11 11
11 11 11 '
ne p a a
a a a E H
2
where E is the Young´s modulus, H’ and n’ are the cyclic strength coefficient and cyclic strain hardening exponent, respectively. These parameters are fitted to a set of stress and strain amplitude values corresponding to stabilized hysteresis loops, usually at the half-life stage of the strain-life tests. Some alternative methods consist of using only one specimen submitted to multiple steps of increasing or decreasing amplitude strains Jones and Hudd 1999 . In the case of notched members in plane stress, in addition to the cyclic stress-strain curve, the amplitude strains should also satisfy some approximated strain distributions such as those proposed by Neuber 1961 and Glinka 1985 for entering in Eq. 1 . Under plane strain conditions some authors e.g. Stephens et al. 2000 suggest the use of the Linear Strain Rule.
For a given material, there are no physical reasons for the amplitude strains represented in equations 1 and 2 to be different, even when alternative approaches are used for measuring the cyclic curve. This is the compatibility principle which presumes that the elastic-plastic properties are not affected by the duration of the fatigue tests. Mathematically the compatibility equation is expressed as:
1
'11 11
11
' 2' 2
'
bncf f a a
f f a
NN
E E H
3
The Eq. 3 can be numerically solved for life left hand side and for stress right hand side for each value of an arbitrary defined strain amplitude vector. This numerical exercise can be performed using independent or compatible to be derived latter material´s parameters. The result is a numerical stress-life curve that allows an evaluation of the possible implications that the use of compatible material´s parameters, i.e. stress-strain constants calculated from strain-life curves, has on fatigue life calculations. We have also included in this study the influence of the stress state, particularly the plane stress state represented by a biaxial stress ratio.
The paper is divided into three parts: in the first part an expression for relating the total strain in the elastic-plastic regime versus stress in a given direction normally the principal direction for plane stress and using modified material parameters is derived. The expression is based on the total deformation theory and therefore only valid for proportional loading conditions. In the second part of the paper, the strain-life relation is extended to multiaxial loading by considering an effective strain approach. Lastly, in the third part of the paper, the analysis related with the strain compatibility between strain-life and stress-strain curves is performed for different biaxial stress ratios.
Jorge Alberto Rodriguez Duran et al. Numerical stress-life curves for the AISI 4340 steel using two sets of materials properties and different bi-axial stress ratios
Latin American Journal of Solids and Structures, 2018, 15 11 Thematic Section , e89 3/12
2 Constitutive relations in the context of the total deformation theory
In the elastic regime, the relationship between the stress and strain tensors obeys the well-known Hooke´s law which, in compact form is:
11e
ij ij ij kkE 4
The ratio of the change of volume to the original volume volumetric strain εv dV/V εkk is obtained by multiplying both sides of Hooke´s law by the delta of Kronecker:
1 2kk kkE
5
For ductile materials, the onset of yielding under multiaxial stresses is well modeled by equivalent stress
and equivalent plastic strain p quantities, both of which are directly scaled in relation to the deviatoric strain
energy density SED’.
3 2,
2 3p p
ij ij p ij ijS S e e 6
In Eq. 6 ijS and pije are the deviatoric components of the stress and the plastic strain tensor, respectively.
They can be calculated by the following equations:
1
31
3
ij ij ij kk
p p pij ij ij kk
S
e
7
For isotropic materials, the experimental data obtained under different modes of loadings, in the plastic regime, should fall in the same curve if equivalent stress and strain quantities are used for plotting them because of their proportionality with SED’ . The plastic part of the Ramberg-Osgood relation type is frequently used for representing these curves:
1
n
p H
8
The material properties or tuning constants, H and n used in Eq. 8 are considered to be the same as those that were obtained in uniaxial tension tests. The secant modulus Ep is a variable quantity defined as:
pp
E
9
Experimental evidence in metals suggests that plastic deformation proceeds with no volume changes. Hence, a Poisson´s ratio ν 1/2 is expected in the plastic regime since this value causes εv 0 in Eq. 5 . The term
0pkk in Eq. 7 results in:
2
3p p
p ij ij 10
With the above elements in mind, it is possible to formulate constitutive relations between the plastic strain and stress tensors similar to Eq. 4 . For example, the element with subscripts 11 of the plastic strain tensor is:

Jorge Alberto Rodriguez Duran et al. Numerical stress-life curves for the AISI 4340 steel using two sets of materials properties and different bi-axial stress ratios
Latin American Journal of Solids and Structures, 2018, 15 11 Thematic Section , e89 4/12
11 11 22 33
1 1
2p
pE
11
The similarity between equations 4 and 11 also indicates that Eq. 5 can still be used for calculations of volumetric strain, even in the presence of plastic strains. Generalizing the Eq. 11 for the other components and using the expression for secant modulus Ep from Eq. 9 we have:
3
2pp
ij ijS
12
The constitutive relations in the total deformation theory are then obtained after adding the elastic and plastic components of the strain tensor:
1 31
2pe p
ij ij ij ij ij kk ijSE
13
For a given biaxial stress ratio λ σ2/σ1 and σ3 0 plane stress Eq. 13 can be used for including the effect of stress state in the constitutive relation for a selected direction. Choosing e.g. the first principal direction and defining a new Young´s modulus Eλ E,λ , the elastic part of ε11 is:
1111
1
e
E
EE
14
The component of the deviatoric stress tensor in the desired direction S11 can be obtained by Eq. 7 :
1111 2
3S
15
The equivalent stress Eq. 6 and the equivalent plastic strain p as a function of the first Eq. 8
are also needed. For the particular stress state investigated we have:
211
1
211
1
1n
p H
16
Substituting equations 15 and 16 in Eq. 12 gives the plastic strain in the desired direction:
1 11
2 11 11211
12 2
1 12
1 12
n n n np
n n
H H
HH
17
where a new Hλ H,λ has been defined in the same sense that was done previously with Eλ. Then, for plane stress with σ11/σ22 λ and σ33 0 an effective total strain ε11 σ11,n,Eλ,Hλ can be defined as follows:
1
11 1111
n
E H
18

Jorge Alberto Rodriguez Duran et al. Numerical stress-life curves for the AISI 4340 steel using two sets of materials properties and different bi-axial stress ratios
Latin American Journal of Solids and Structures, 2018, 15 11 Thematic Section , e89 5/12
The stress state of pure shear has a significant practical importance because it is the loading mode encountered in important machine elements such as the power transmitting rotating shafts. This constitutes a particular case of plane stress where λ σ11 / σ33 1 and for which the modified elastic modulus Eλ and strength coefficient Hλ, according to equations 14 and 17 , are respectively:
1
2
1
2
3
n
n
EE
HH
19
Note that we can also use the engineering shear strain definition γij 2 εij i j and Eq. 18 for obtaining a constitutive equation for the stress state of pure shear relating only shear quantities as follows:
1
1
22 1
3
n
n
G H
E HG H
20
The uniaxial cyclic curve for most structural materials is also well fitted by a Ramberg-Osgood relation type in εa vs. σa coordinates. New cyclic strength H’ and hardening exponent n’ substitute the monotonic H and n in Eq. 18 , respectively. These properties are almost always measured in the first principal direction. Therefore, a new
cyclic curve for plane stress can be defined on this basis:
1
'11 11
11 '
na a
a E H
21
3 The strain-life Coffin-Manson relation in the context of the total deformation theory
Coffin and Manson first observed that fatigue life is related to plastic strains by a power law relationship. In that time 1950s there was a need for designing components and structures at stresses above the endurance limit and the Coffin-Manson relationship emerged on this direction. Later, a general equation in the form εa 2 Nf was proposed, where εa is the sum of the plastic and elastic strains amplitudes Eq. 1 . When the stress state is different from uniaxial but the principal directions remain unchangeable, i.e. for proportional loading, it is
assumed that the controlling variable is the effective strain amplitude a that, again, is composed of elastic and
plastic parts:
e p paa a a aE
22
Low cycle fatigue strength data is mainly reported in the first principal direction where the equivalent stress
and strain in accordance with equations 6 and 10 , respectively are reduced to 11a a and 11p
p a .
Then Eq. 22 takes the form:
1111 11pa
a a aE
23
If the effective strain amplitude is the driving force for nucleation of fatigue cracks under multiaxial loading, it should have the same role for the uniaxial case and right hand side of both Eq. 1 and Eq. 22 can be equated resulting in:
Jorge Alberto Rodriguez Duran et al. Numerical stress-life curves for the AISI 4340 steel using two sets of materials properties and different bi-axial stress ratios
Latin American Journal of Solids and Structures, 2018, 15 11 Thematic Section , e89 6/12
' 2' 2
' 2 ' 2
b
cf fpaa a f f
b cpa f f a f f
NN
E E
N N
24
We can use a similar procedure to that shown in equations 14 to 16 to obtain expressions for the elastic and plastic parts of the total amplitude strain for the case of proportional λ constant plane stress state:
1111 2 2
1111 11 2 2
11
' 2
1 1
' 2 ' 23 32 1
2 2 3 21 1
b
f fe a aa
c cp
f f f fp a aa
a a
N
E E E
N NS
25
A modified strain-life equation that includes the influence of the stress state through the biaxial stress ratio λ can be obtained after adding both terms of Eq. 25 :
11 2
2 2
1 ' 2 / 1 ' 2 ' 22' 2
1
' 1 / 2' '
1 1
b cb
f f f fcf f
a f f
ff f
N E N NN
E
26
As it was already done for the constitutive relation, Eq. 26 can also be expressed in terms of shear strain for the particular and important case of pure shear λ 1 :
12
' 23 ' 2
3
b
cf f
a f f
NN
G
27
4 Compatibility conditions
In many cases the nominal cyclic loadings are enough for inducing elastic-plastic stress-strain histories in the most loaded point in the structure. Neglecting the transients, it is possible to consider that the initial stress-strain path follows the cyclic curve described by Eq. 21 . The shape of subsequent hysteresis loops can be approximated by direct expansion of the cyclic curve by a factor of two. This is the so-called Masing´s behavior and is schematically represented in Figure 1.

Jorge Alberto Rodriguez Duran et al. Numerical stress-life curves for the AISI 4340 steel using two sets of materials properties and different bi-axial stress ratios
Latin American Journal of Solids and Structures, 2018, 15 11 Thematic Section , e89 7/12
Figure 1 – The initial stress-strain path follows the cyclic curve while subsequent hysteresis loops are commonly
modeled expanding this curve by a factor of two.
The same stress-strain path is obviously followed by the material when tested under strain control until crack nucleation or fracture. These experimental data are represented in εa vs. Nf coordinates and modelled by Eq. 26 . Therefore, from a physical point of view both of the total strains described by 21 and 26 have the same
elastic and plastic components:
1
'11 11
11 11
1
'11 11
11
' 2' 2
'
' 2' 2
'
bn cf fe pa a
a a f f
bn cf fa a
a f f
NN
E E H
NN
E H E
28
This compatibility condition can only be ensured when the following relation holds between the material properties:
'' '
'
fcompcompb
cf
bH n
c
29
The new constants have been labeled as “comp” to enhancing the fact that they are estimated from other constants and not independently determined. The complete procedure for obtaining Eq. 29 was outlined by Nieslony et al. 2012 and the relation is based on the independency of the material properties on the life Nf.
Plots of the ratios between ' / ' compH H and '/ 'compn n for different biaxial stress ratios λ can be made for a
given material Figure 2 . In this paper the AISI 4340 steel of Aircraft Quality was chosen for this purpose and its properties are shown in Table 1. The material underwent a heat treatment consisting of quenching in oil from 830oC, tempering at 540oC for 30 minutes followed by oil quenching.

Jorge Alberto Rodriguez Duran et al. Numerical stress-life curves for the AISI 4340 steel using two sets of materials properties and different bi-axial stress ratios
Latin American Journal of Solids and Structures, 2018, 15 11 Thematic Section , e89 8/12
Figure 2 – Two-axes plot showing the relation between experimental and compatibility constants for the AISI 4340
steel of Aircraft Quality for various λ-ratios.
Table 1 – Mechanical properties of the material under analysis in the present investigation Dowling 2009 .
Properties AISI 4340 steel, Aircraft Quality E, GPa 207
ν 1/3 H’, MPa 1655
n' 0.131 σ’f, MPa 1758
ε’f 2.12 b -0.0977 c -0.744
As seen in Figure 2 the relationship between cyclic strength coefficients of this material varies with the biaxial stress ratio and becomes positive for transverse tension λ 0 . On the other hand and as expected from equations 21 and 29 , the relationship between cyclic strength exponents is independent of the stress state.
5 Numerical stress-life curves
Determining the possible implications that the use of independent and compatible material properties have on numerical stress-life curves is the aim of the present study. Keeping this in mind, we have numerically found the amplitude stress σa11 and the number of cycles Nf that simultaneously satisfy the second line of Eq. 28 for a given vector of total strain amplitudes. The values of the vector εa11 span between 100 and 10000 μs. Two set of
constants were used: independent H’λ and n’, from Table 1 and compatible ' compH and 'compn , from Eq. 29 .
The effect of the stress state was also studied through the biaxial stress ratio λ. The result of this numerical
exercise are the vectors 11,i aiNf and 11comp
ai . From these results we can define the experimental
and compatibility elastic and plastic strain ratios between each component of the total strain from the constitutive law Eq. 21 and from the strain-life relation Eq. 26 as:
Jorge Alberto Rodriguez Duran et al. Numerical stress-life curves for the AISI 4340 steel using two sets of materials properties and different bi-axial stress ratios
Latin American Journal of Solids and Structures, 2018, 15 11 Thematic Section , e89 9/12
1
'11
11
1
'11
11
'
' 2 ' 2
'
' 2 ' 2
comp
na
ae pb c
f f f f
comp nacompcomp
comp compae pb c
f f f f
HR R
N N
HR R
N N
30
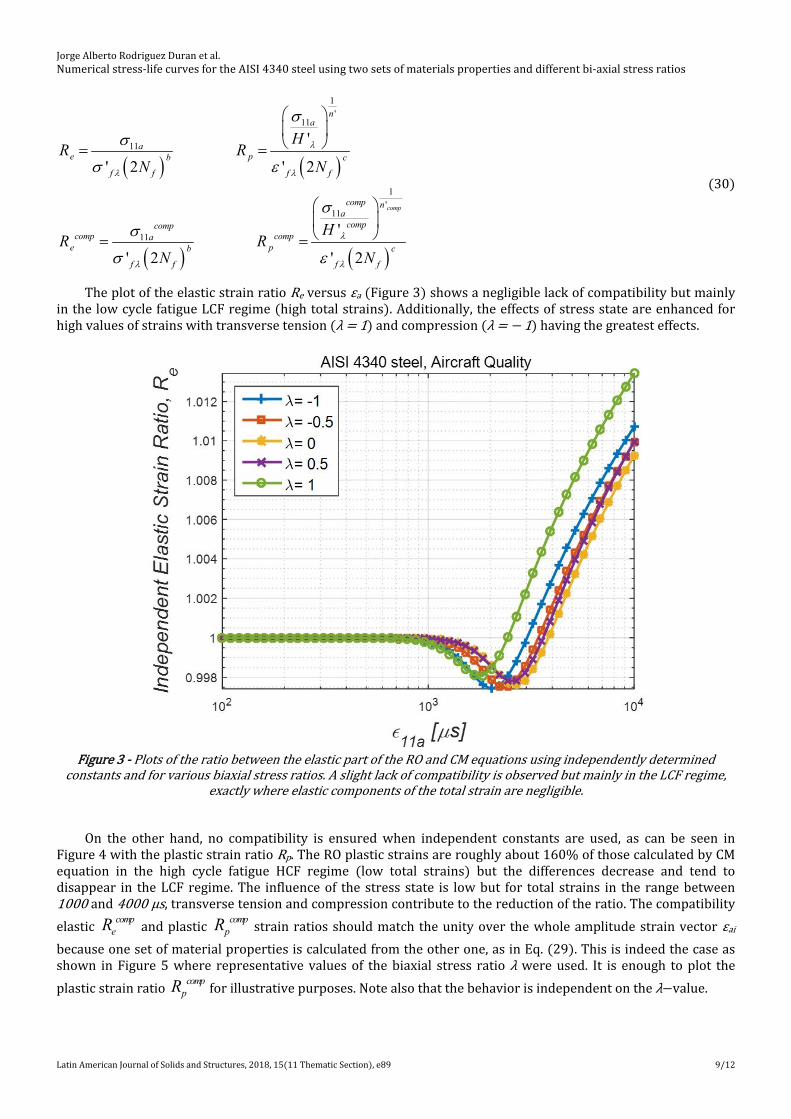
The plot of the elastic strain ratio Re versus εa Figure 3 shows a negligible lack of compatibility but mainly in the low cycle fatigue LCF regime high total strains . Additionally, the effects of stress state are enhanced for high values of strains with transverse tension λ 1 and compression λ 1 having the greatest effects.
Figure 3 - Plots of the ratio between the elastic part of the RO and CM equations using independently determined
constants and for various biaxial stress ratios. A slight lack of compatibility is observed but mainly in the LCF regime, exactly where elastic components of the total strain are negligible.
On the other hand, no compatibility is ensured when independent constants are used, as can be seen in Figure 4 with the plastic strain ratio Rp. The RO plastic strains are roughly about 160% of those calculated by CM equation in the high cycle fatigue HCF regime low total strains but the differences decrease and tend to disappear in the LCF regime. The influence of the stress state is low but for total strains in the range between 1000 and 4000 μs, transverse tension and compression contribute to the reduction of the ratio. The compatibility
elastic compeR and plastic
comppR strain ratios should match the unity over the whole amplitude strain vector εai
because one set of material properties is calculated from the other one, as in Eq. 29 . This is indeed the case as shown in Figure 5 where representative values of the biaxial stress ratio λ were used. It is enough to plot the
plastic strain ratio comppR for illustrative purposes. Note also that the behavior is independent on the λ value.

Jorge Alberto Rodriguez Duran et al. Numerical stress-life curves for the AISI 4340 steel using two sets of materials properties and different bi-axial stress ratios
Latin American Journal of Solids and Structures, 2018, 15 11 Thematic Section , e89 10/12
Figure 4 – Plots of the ratio between the plastic part of the RO and CM equations using independently determined
constants. The compatibility is not ensured because the RO plastic strain component is well above for low strains than its equivalent in CM equation.
Figure 5 – Plot of the plastic compatibility strain ratio
comppR from Eq. 30 . As expected, a total compatibility between
Jorge Alberto Rodriguez Duran et al. Numerical stress-life curves for the AISI 4340 steel using two sets of materials properties and different bi-axial stress ratios
Latin American Journal of Solids and Structures, 2018, 15 11 Thematic Section , e89 11/12
RO and CM plastic strain parts is obtained, independent of the stress state, since the material´s parameters were calculated in accordance with Eq. 29 .
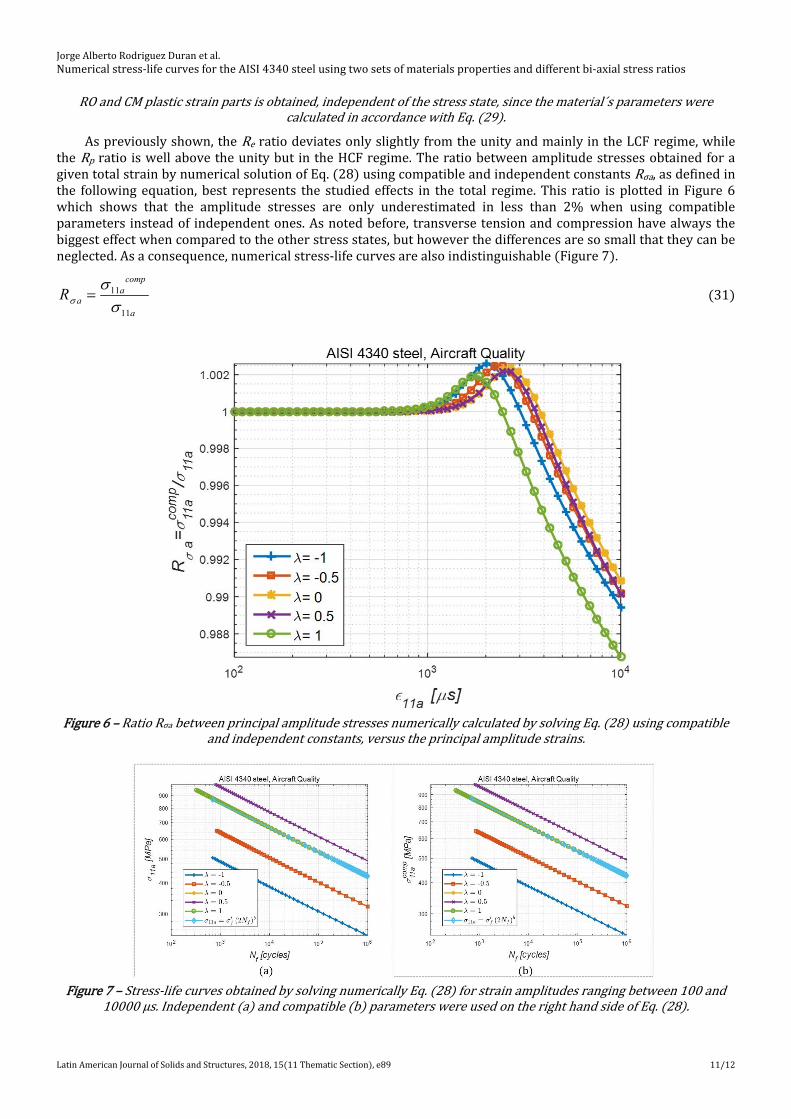
As previously shown, the Re ratio deviates only slightly from the unity and mainly in the LCF regime, while the Rp ratio is well above the unity but in the HCF regime. The ratio between amplitude stresses obtained for a given total strain by numerical solution of Eq. 28 using compatible and independent constants Rσa, as defined in the following equation, best represents the studied effects in the total regime. This ratio is plotted in Figure 6 which shows that the amplitude stresses are only underestimated in less than 2% when using compatible parameters instead of independent ones. As noted before, transverse tension and compression have always the biggest effect when compared to the other stress states, but however the differences are so small that they can be neglected. As a consequence, numerical stress-life curves are also indistinguishable Figure 7 .
11
11
compa
aa
R
31
Figure 6 – Ratio Rσa between principal amplitude stresses numerically calculated by solving Eq. 28 using compatible
and independent constants, versus the principal amplitude strains.
Figure 7 – Stress-life curves obtained by solving numerically Eq. 28 for strain amplitudes ranging between 100 and
10000 μs. Independent a and compatible b parameters were used on the right hand side of Eq. 28 .

Jorge Alberto Rodriguez Duran et al. Numerical stress-life curves for the AISI 4340 steel using two sets of materials properties and different bi-axial stress ratios
Latin American Journal of Solids and Structures, 2018, 15 11 Thematic Section , e89 12/12
6 Conclusions
The conclusions derived from the present investigation are: 1 The independent strain ratios exhibit a lack of compatibility exactly in the opposite range of their respective validity ranges, signifying that
the elastic strain ratios deviate from the unity in the LCF regime and the plastic strain ratio shows similar behavior but in the HCF regime.
2 In any case the extreme values of the biaxial stress ratio (transverse tension and compression) enhance the differences. 3 The use of compatible parameters, as expected, ensures that the strain ratios remain near the unit (total compatibility) in the whole range of
strain values studied. 4 In virtue of conclusions 1 and 2, the stress ratio was used targeting for an analysis that includes both fatigue regimes. This ratio shows
negligible differences. As a consequence, the numerical stress-life curves are indistinguishable and no serious problems are faceted in fatigue design when using compatible parameters instead of independent ones.
5 The conclusions of the present investigation are restricted to the AISI 4340 Aircraft Quality Steel whose properties are reported in reference (Dowling 2009).
References
Dowling NE 2009 , Mean stress effects in strain-life fatigue, Fatigue Fract. Engng. Mater. Struct. 32, 1004-1019.
Glinka G 1985 , “Energy density approach to calculation of inelastic strain-stress near notches and cracks”. Engineering Fracture Mechanics, vol. 22, No. 3, pp. 485-508.
Jones A, Hudd RC 1999 , Cyclic stress-strain curves generated from random cyclic strain amplitude tests, International Journal of Fatigue, 21, 521 – 530.
Kim KS, Chen X, Han C et al. 2002 , Estimation methods for fatigue properties of steels under axial and torsional loadings, International Journal of Fatigue, 24, 783-793.
Meggiolaro MA, Castro JTP 2004 , Statistical evaluation of strain-life fatigue crack initiation predictions, International Journal of Fatigue, 26, 463-476.
Murakami Y, Ferdous Md S, Makabe C 2016 , Low cycle fatigue damage and critical crack length affecting loss of fracture ductility, International Journal of Fatigue 82, 89-97.
Murakami Y, Miller KJ 2005 , What is fatigue damage? A view point from the observation of low cycle fatigue process, International Journal of Fatigue 27, 991-1005.
Neuber H 1961 , “Theory of Stress Concentration for shear-strained prismatic bodies with nonlinear stress-strain law”. Transactions of ASME, Journal of Applied Mechanics, Series E, vol. 28, No. 4, pp. 544-550.
Nieslony A, Dsoki C, Kaufmann H et al. 2008 , New method for evaluation of the Manson–Coffin–Basquin and Ramberg–Osgood equations with respect to compatibility, International Journal of Fatigue, 30, p. 1967-1977.
Nieslony A, Kurek A, Dsoki C et al. 2012 , A study of compatibility between two classical fatigue curves models based on some selected structural materials, International Journal of Fatigue, 39, 88-94.
Stephens RI, Fatemi A, Stephens RR, Fuchs HO 2000 , Metal fatigue in engineering, 2nd ed. Wiley Interscience. Murakami S 2012 , Continuum Damage Mechanics: a continuum mechanics approach to the analysis of damage and fracture, Springer.
Troshchenko VT, Khamaza LA 2010 , Strain-Life curves of steels and methods for determining the curve parameters, Strength of Materials, 42 6 , 647-659.