numerical optimization of air quality and airborne infection...
TRANSCRIPT
Proceedings of the International Conference on Industrial Engineering and Operations Management Pretoria / Johannesburg, South Africa, October 29 – November 1, 2018
© IEOM Society International
Numerical optimization of air quality and airborne infection control in healthcare facility
Matlaweng Jan Magampa Doornfontein Department of Mechanical Engineering
University of Johannesburg Doornfontein, 55 beit street, South Africa
[email protected], [email protected]
The computation of airflow within the healthcare facilities (hospitals and clinics) is challenging. The balance of air ventilation and infection control within the facilities geometries is primarily a concern that requires detailed investigation. The objective of this work was to simulate airflow of various geometrical configurations of ducting system in building. The outcome being recommendations to air conditioning and ventilation designers for new healthcare buildings on placement of functional departments relative to airflow demands and quality. ANSYS® Fluent® 19.0 a student commercial package for Computational Fluid Dynamics (CFD) was used to provide flow visualization and the magnitude pollutant species in the airflow at the healthcare facility. The results will be compared to experimental data from lab-built apparatus for various duct designs.
Keywords Airborne; ventilation; Computational Fluid Dynamics; modelling; health care facility. Pollutant species
1. Introduction
Air ventilation is the system/method used to allow natural/mechanical airflow to get into the building with the intention of replacing the existing air in the area mostly for healthier respiration. In the healthcare facilities, Ventilation is one of the most reliable methods of creating comfortable and health friendly environment for personnel together with the machineries. Ventilation airflows in the healthcare facility are the most important aspect from the mechanical engineering scope. One of the most difficult tasks Mechanical engineers face is getting the ventilation airflow balancing correct and effectively addressing the space comfort issue as well as airborne infection control.
There are different types of ventilation airflow systems offered in the building constructions, but the most dominating systems are natural air ventilation, mechanical/convectional air ventilation and mixed air ventilation. Natural air ventilation is the system that completely relies of natural air coming in and leaving the space. Its airflow directions and magnitude depend on the orientation and geometry of building. This system is used in the non-critical areas of the building departments. Mechanical air ventilation is the system that is made up of mechanical component to collect and supply air in the required space. Its airflow direction and magnitude depends of the air handling units, ducting and diffusers. Most of the critical spaces of the building use mixed air ventilation. This is the combination of the natural and mechanical air ventilation. It suits better in the departmentalized building structures, with critical and non-critical spaces.
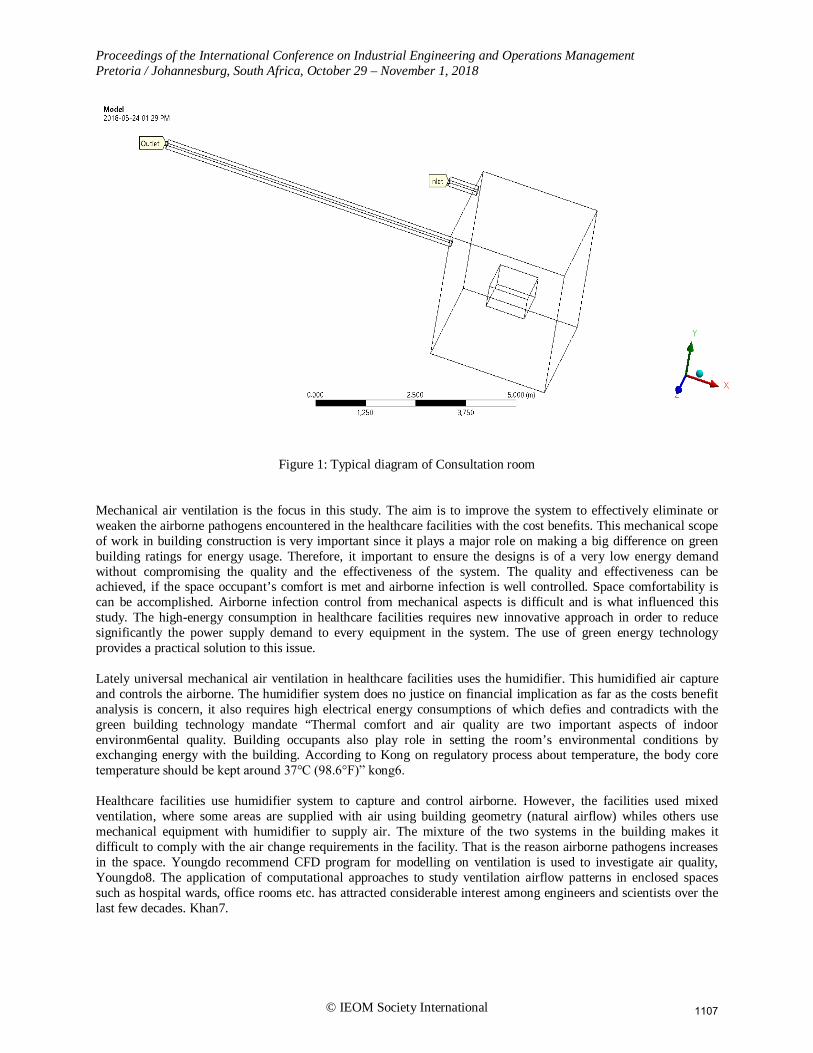
The figure below shows the modelling geometry of typical consultation room in the healthcare facility. The air (containing Nitrogen) comes from the inlet and reacts with ethyl-alcohol-air in the room. The reactant mixture leaves through the outlet duct. The room has square area of 9 meters with the ceiling height of 3 meters.
1106
Proceedings of the International Conference on Industrial Engineering and Operations Management Pretoria / Johannesburg, South Africa, October 29 – November 1, 2018
© IEOM Society International
Figure 1: Typical diagram of Consultation room Mechanical air ventilation is the focus in this study. The aim is to improve the system to effectively eliminate or weaken the airborne pathogens encountered in the healthcare facilities with the cost benefits. This mechanical scope of work in building construction is very important since it plays a major role on making a big difference on green building ratings for energy usage. Therefore, it important to ensure the designs is of a very low energy demand without compromising the quality and the effectiveness of the system. The quality and effectiveness can be achieved, if the space occupant’s comfort is met and airborne infection is well controlled. Space comfortability is can be accomplished. Airborne infection control from mechanical aspects is difficult and is what influenced this study. The high-energy consumption in healthcare facilities requires new innovative approach in order to reduce significantly the power supply demand to every equipment in the system. The use of green energy technology provides a practical solution to this issue. Lately universal mechanical air ventilation in healthcare facilities uses the humidifier. This humidified air capture and controls the airborne. The humidifier system does no justice on financial implication as far as the costs benefit analysis is concern, it also requires high electrical energy consumptions of which defies and contradicts with the green building technology mandate “Thermal comfort and air quality are two important aspects of indoor environm6ental quality. Building occupants also play role in setting the room’s environmental conditions by exchanging energy with the building. According to Kong on regulatory process about temperature, the body core temperature should be kept around 37℃ (98.6°F)” kong6. Healthcare facilities use humidifier system to capture and control airborne. However, the facilities used mixed ventilation, where some areas are supplied with air using building geometry (natural airflow) whiles others use mechanical equipment with humidifier to supply air. The mixture of the two systems in the building makes it difficult to comply with the air change requirements in the facility. That is the reason airborne pathogens increases in the space. Youngdo recommend CFD program for modelling on ventilation is used to investigate air quality, Youngdo8. The application of computational approaches to study ventilation airflow patterns in enclosed spaces such as hospital wards, office rooms etc. has attracted considerable interest among engineers and scientists over the last few decades. Khan7.
1107
Proceedings of the International Conference on Industrial Engineering and Operations Management Pretoria / Johannesburg, South Africa, October 29 – November 1, 2018
© IEOM Society International
Modelling system is one resources of design in improving the reality of human nature in fluid. In order to estimate this risk and optimize the design of an intensive care room intended to host severely burned patients. Christian advised to use computational fluid dynamic methodology (CFD), Christian5.Systems such as (a) Gaussian-based models,(b)Computational fluid dynamics and (c)”Similarity-profile model, Liu1.Computational Fluid Dynamic(CFD) and Chemkim simulation software’s are mostly used in improving the airflow direction in building facilities, and Chemkim is also used for chemical species that are not offered/listed in the CFD model system. Various researchers, Park2, have now studied different types of ventilation. Perform the CFD modelling of ventilation ducts for improving the air quality. Designers of air ventilation systems use simulations results from computational fluid dynamics (CFD) modelling. Computational fluid dynamics study was developed on two conducts of are:(1) to estimate the source strength,(2) simulate the subsequence dispersion of gas like C02 in the atmosphere, Xioung4.
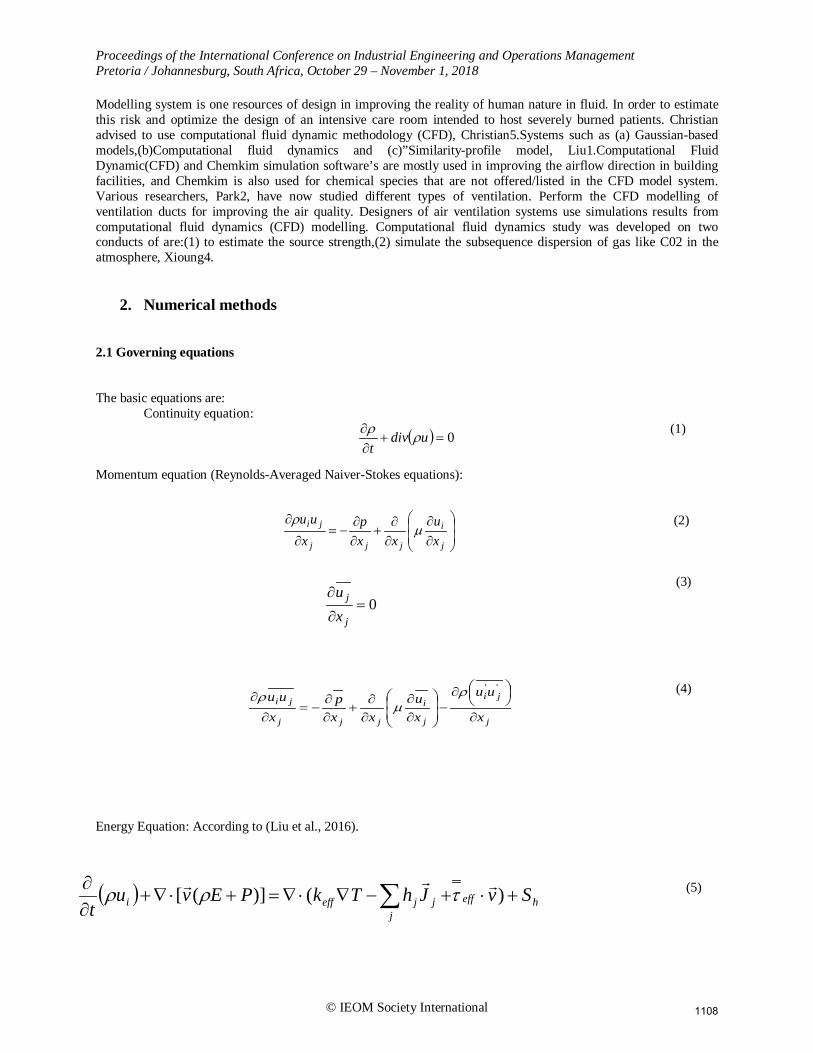
2. Numerical methods 2.1 Governing equations The basic equations are: Continuity equation: (1) Momentum equation (Reynolds-Averaged Naiver-Stokes equations): (2) (3)
(4) Energy Equation: According to (Liu et al., 2016).
(5)
( ) 0=+∂∂ udiv
tρρ
∂∂
∂∂
+∂∂
−=∂
∂
j
i
jjj
ji
xu
xxp
xuu
µρ
0=∂
∂
j
j
xu
j
ji
j
i
jjj
ji
x
uu
xu
xxp
xuu
∂
∂
−
∂∂
∂∂
+∂∂
−=∂
∂''ρ
µρ
( ) heffj
jjeffi SvJhTkPEvut
+⋅+−∇⋅∇=+⋅∇+∂∂ ∑ )()]([ τρρ
1108
Proceedings of the International Conference on Industrial Engineering and Operations Management Pretoria / Johannesburg, South Africa, October 29 – November 1, 2018
© IEOM Society International
Where E is the total specific energy,the effective thermal conductivity, jh the enthalpy of species j, jJ
the diffusion flux of species j,and hS the source.
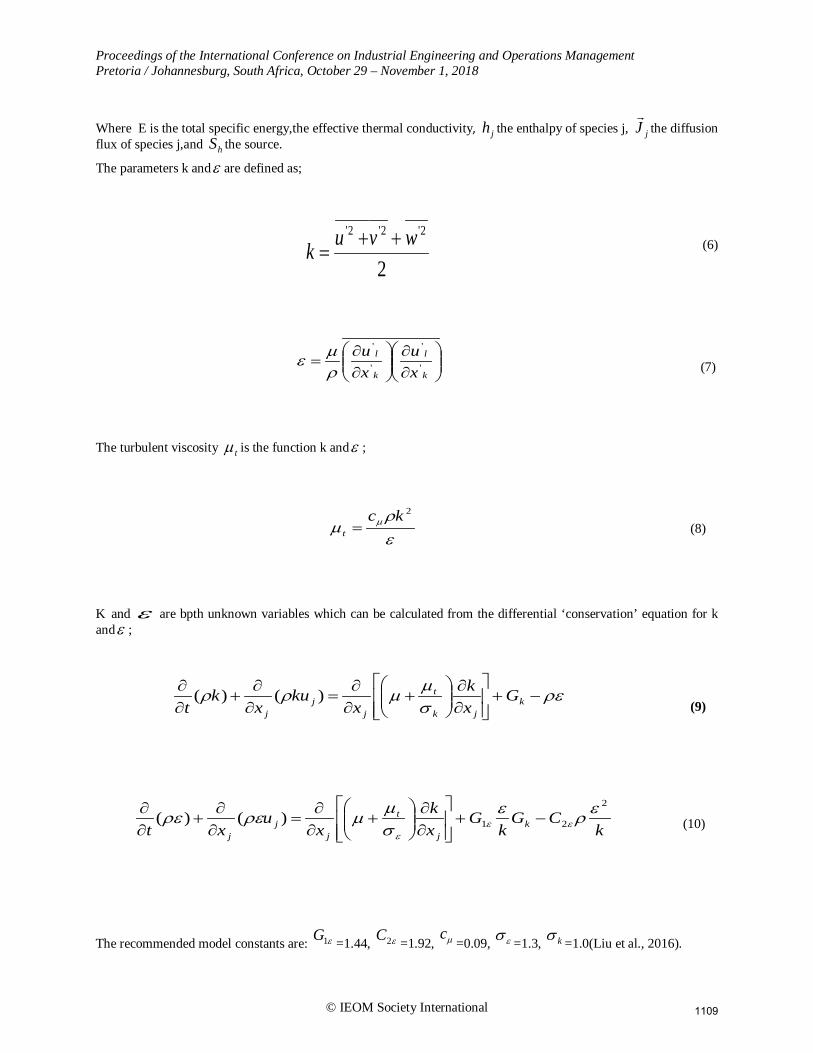
The parameters k andε are defined as;
(6) (7) The turbulent viscosity tµ is the function k andε ; (8)
K and ε are bpth unknown variables which can be calculated from the differential ‘conservation’ equation for k andε ; (9)
(10)
The recommended model constants are: ε1G =1.44, ε2C =1.92, µc=0.09, εσ =1.3, kσ =1.0(Liu et al., 2016).
ερ
µ µ2kc
t =
ρεσµµρρ −+
∂∂
+
∂∂
=∂∂
+∂∂
kjk
t
jj
j
Gxk
xku
xk
t)()(
2
2'2'2' wvuk ++=
∂∂
∂∂
=k
l
k
l
xu
xu
'
'
'
'
ρµε
kCG
kG
xk
xu
xt kj
t
jj
j
2
21)()( ερεσµµρερε εεε
−+
∂∂
+
∂∂
=∂∂
+∂∂
1109
Proceedings of the International Conference on Industrial Engineering and Operations Management Pretoria / Johannesburg, South Africa, October 29 – November 1, 2018
© IEOM Society International
In this study, Ethyl-alcohol-air is released at ambient pressure and with relativity of regulated duct airflow in the health care facility, the flow is considered incompressible. Then, both ethyl-alcohol and air are defined as incompressible ideal gases in the CFD code.
The Shear Stress Transport (SST) equations (Siriboonluckul et al) are as follows:
(11)
(12)
Terms in E.q 5 and 6 are explained as follows:
• ωρβ k* and 2βρω represents the dissipation of and due to turbulence
• and represents diffusivity of and due to turbulence
• represents the cross-diffusion term
Where:
,
The constants are expressed in terms of the blending function are:
Where and stand for coefficients of the and models respectively, for which the following values are recommended:
, , , ,
With the blending function defined as
( ) ωρβσµµρρ kPkgraddivkdiv
tk
k
t * −+
+=+
∂∂ U
( ) ( ) ωω
ρσβρωνγω
σµ
µρωρωω
ω 121 21
2 gradkgradFPgraddivdivt t
t ∗−+−+
+=+
∂∂ U
k
t
σµ
µ +ωσµ
µ t+
( ) ωω
ρσω 121 21 gradkgradF ∗−
j
jji x
UuuP
∂
∂−= ρ 09.0* =β
k ω
ωk
( ) 2111 1 βββ FF −+=1F
1β 2β
21 =kσ 12 =kσ 168.1=ωσ 075.01 =β 0828.02 =β
1F
ω−k ε−k
1110

Proceedings of the International Conference on Industrial Engineering and Operations Management Pretoria / Johannesburg, South Africa, October 29 – November 1, 2018
© IEOM Society International
(13) A limiter is included to prevent the excessive growth of the turbulent shear stress. Where (14) Where: Y is the distance to the next surface. The conservation of the local mass fraction of each species is expressed as: (15) (16)
Where iY is obtained through the solution of conservation –diffusion equation for the ith species. In the equation (9)
iJ
, is the diffusion flux of species i, tµ is the turbulent viscosity and tD is the turbulent and diffusivity. The turbulent Schmidt number is calculated using: (17)
The default value tSc is 0.7(Liu et al.8)
2.2 Grid-sensitivity study and modeling parameters.
( )411 argtanh=F
= 2
22*1
4;500;maxminargyCDk
yyk
kω
ωρσων
ωβ
∂∂
∂∂
= −202 10:12max
jjk xx
kCD ωω
σωω
( )21
1
2:max SFaka
tωρ
µ = ( )222 argtanh=F
=
ων
ω 22500;
2maxarg
yyk
31.0=a
iii JYvYt
⋅−∇=⋅∇+∂∂ )()( ρρ
TTDY
ScDJ iTi
t
tmii
∇−∇
+−= ,,µρ
t
tt D
Scρµ
=
1111
Proceedings of the International Conference on Industrial Engineering and Operations Management Pretoria / Johannesburg, South Africa, October 29 – November 1, 2018
© IEOM Society International
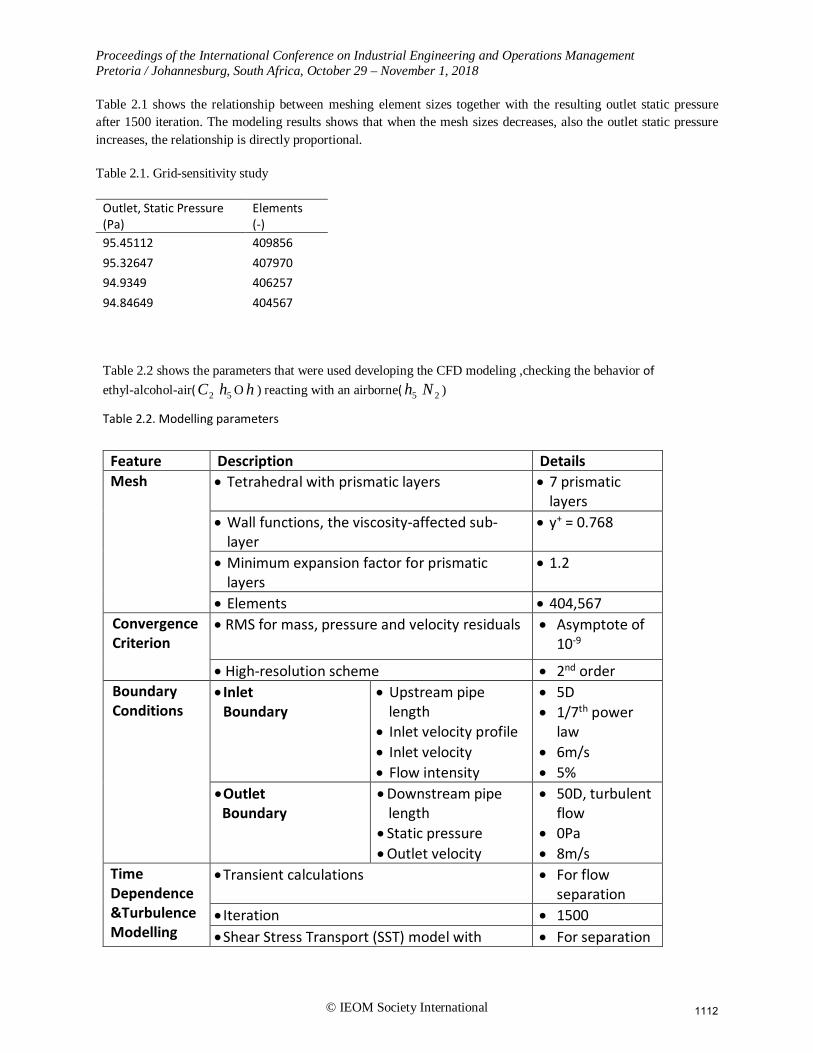
Table 2.1 shows the relationship between meshing element sizes together with the resulting outlet static pressure after 1500 iteration. The modeling results shows that when the mesh sizes decreases, also the outlet static pressure increases, the relationship is directly proportional.
Table 2.1. Grid-sensitivity study
Outlet, Static Pressure (Pa)
Elements (-)
95.45112 409856 95.32647 407970 94.9349 406257 94.84649 404567
Table 2.2 shows the parameters that were used developing the CFD modeling ,checking the behavior of ethyl-alcohol-air( 2C 5h O h ) reacting with an airborne( 5h 2N )
Table 2.2. Modelling parameters
Feature Description Details Mesh
• Tetrahedral with prismatic layers • 7 prismatic layers
• Wall functions, the viscosity-affected sub-layer
• y+ = 0.768
• Minimum expansion factor for prismatic layers
• 1.2
• Elements • 404,567 Convergence Criterion
• RMS for mass, pressure and velocity residuals • Asymptote of 10-9
• High-resolution scheme • 2nd order Boundary Conditions
• Inlet Boundary
• Upstream pipe length
• Inlet velocity profile • Inlet velocity • Flow intensity
• 5D • 1/7th power
law • 6m/s • 5%
• Outlet Boundary
• Downstream pipe length
• Static pressure • Outlet velocity
• 50D, turbulent flow
• 0Pa • 8m/s
Time Dependence &Turbulence Modelling
• Transient calculations • For flow separation
• Iteration • 1500 • Shear Stress Transport (SST) model with • For separation
1112
Proceedings of the International Conference on Industrial Engineering and Operations Management Pretoria / Johannesburg, South Africa, October 29 – November 1, 2018
© IEOM Society International
AUTOMATIC near-wall treatment along the wall Species • Inlet, 2C 5h O h
• Contaminant, 5h 2N • 80%, mass
fraction • 10%, , mass
fraction
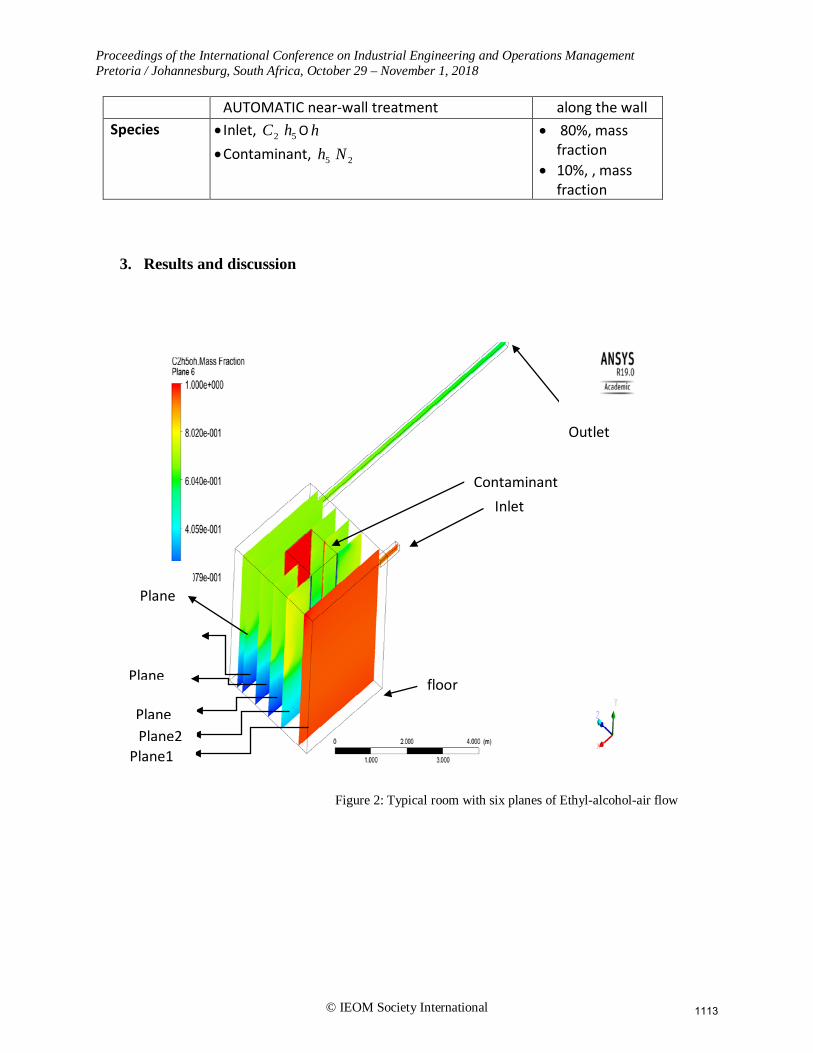
3. Results and discussion
Figure 2: Typical room with six planes of Ethyl-alcohol-air flow
floor
Inlet
Outlet
Plane
Plane1
Plane2
Plane
Plane
Contaminant
1113
Proceedings of the International Conference on Industrial Engineering and Operations Management Pretoria / Johannesburg, South Africa, October 29 – November 1, 2018
© IEOM Society International
The figure above shows the model structure that represents health care facility room with the inlet and the dissipation of the fluent all the way from inlet, then exit on the outlet. The six planes were inserted to help and track
the reaction mixture of ethyl-alcohol-air( 2C 5h O h ) and airborne( 5h 2N ).Ethyl-alcohol-air is higher in the inlet and as it reacts within the room, it becomes less above the one meter height from the floor ground, while it is even much lesser below one meter as it reacts completely with air. At the contaminant space, the ethyl-alcohol-air reacts with airborne and we can see ethyl-alcohol-rises much high at the wall of the contaminant, and as it leaves the wall it now changes to reactant mixture of less ethyl-alcohol-air and then it exits the room through extraction system of 6m/s outlet velocity. This results shows that ethyl-alcohol-air can react and breakdown airborne molecules, much more iteration need to be completed and the dosing molecules of both ethyl-alcohol-air and airborne be determined to provide accurate solutions.
The chemical calculations
221.0 O +0.79 2N +( 5h 2N )+ OhChCh 23 ⇔ 2Ch ( )()() 222 vapourOhOhNhChNh +
221.0 O +0.79 2N where this is air with 21% of oxygen and 79% of nitrogen
5h 2N This is airborne chemical formula which is ionic
OhChCh 23 This is ethanol chemical formula
2Ch OhNhChNh )() 22 ) this is 1, 2 diamino ethanol and )(2 vapourOh water vapour as the results. This results will be proven using experiments to check if is healthy for inhaling.
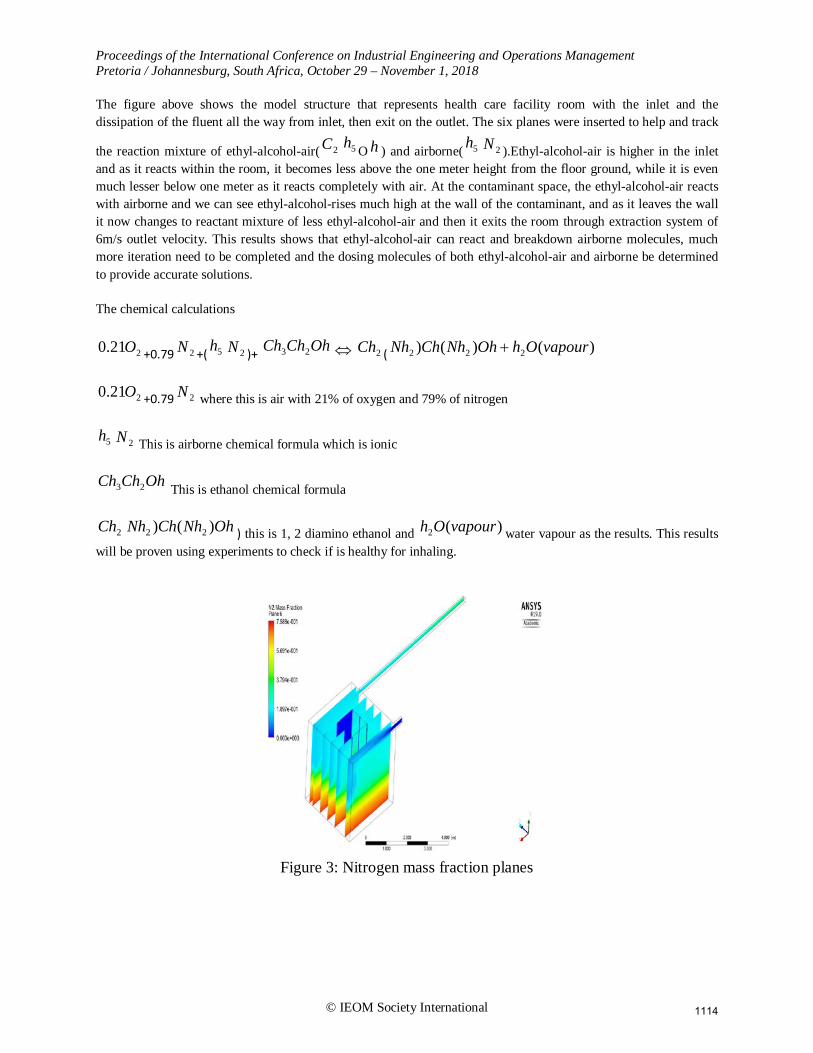
Figure 3: Nitrogen mass fraction planes
1114

Proceedings of the International Conference on Industrial Engineering and Operations Management Pretoria / Johannesburg, South Africa, October 29 – November 1, 2018
© IEOM Society International
The figures above on nitrogen mass fraction shows that nitrogen is concentrated below one-meter height to the floor ground of the room, which proves better air circulation in the room if supplied from the top and extracted from the bottom of the room.
Step time Ethyl-alcohol-air presentation
Figure 4: Nitrogen mass fraction planes
The Mass fraction of the alcohol prayed into the room shows high concentration on the inlet. The alcohol reacts immediately with the air then turns into alcohol-air with less concentration. This model tells us how well alcohol can react with air, this step time model was ran for 2.2seconds on 8000 iterations which took 12 hours.
Simulation line graph showing 1500 iteration against drag coefficient. Displaying the converging results of the reaction mixture.
Figure 5:Cd and iteration line graph
1115
Proceedings of the International Conference on Industrial Engineering and Operations Management Pretoria / Johannesburg, South Africa, October 29 – November 1, 2018
© IEOM Society International
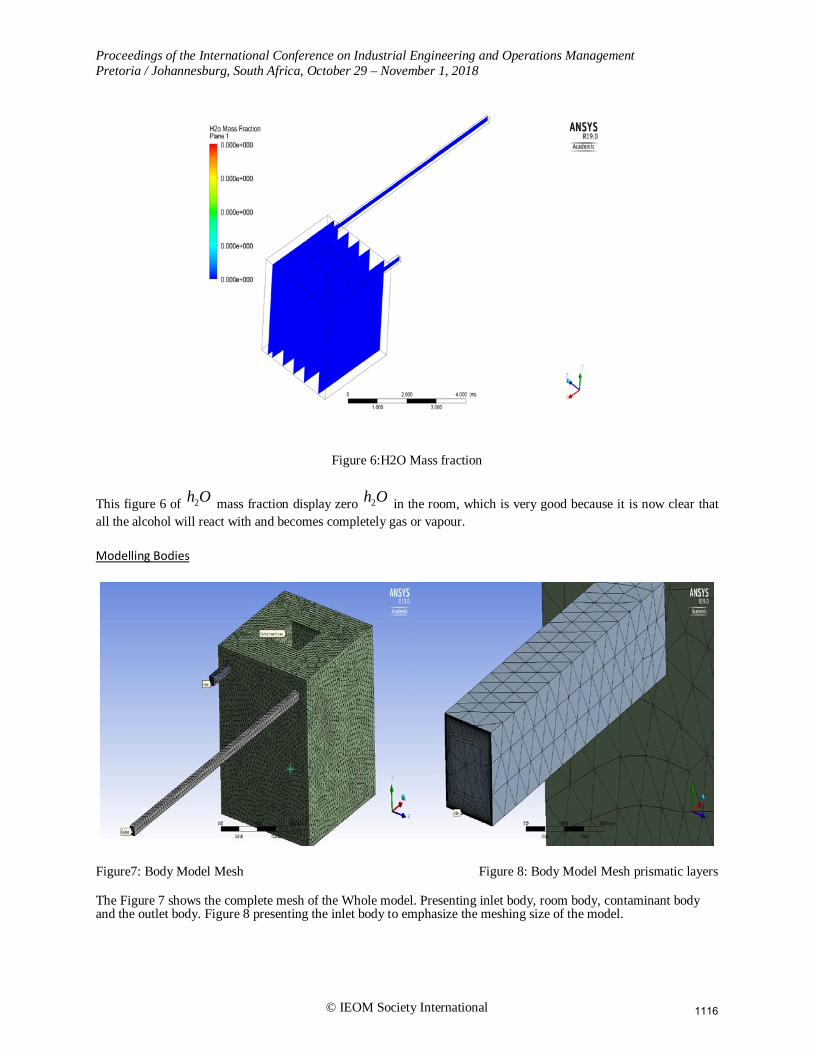
Figure 6:H2O Mass fraction
This figure 6 of Oh2 mass fraction display zero Oh2 in the room, which is very good because it is now clear that all the alcohol will react with and becomes completely gas or vapour.
Modelling Bodies
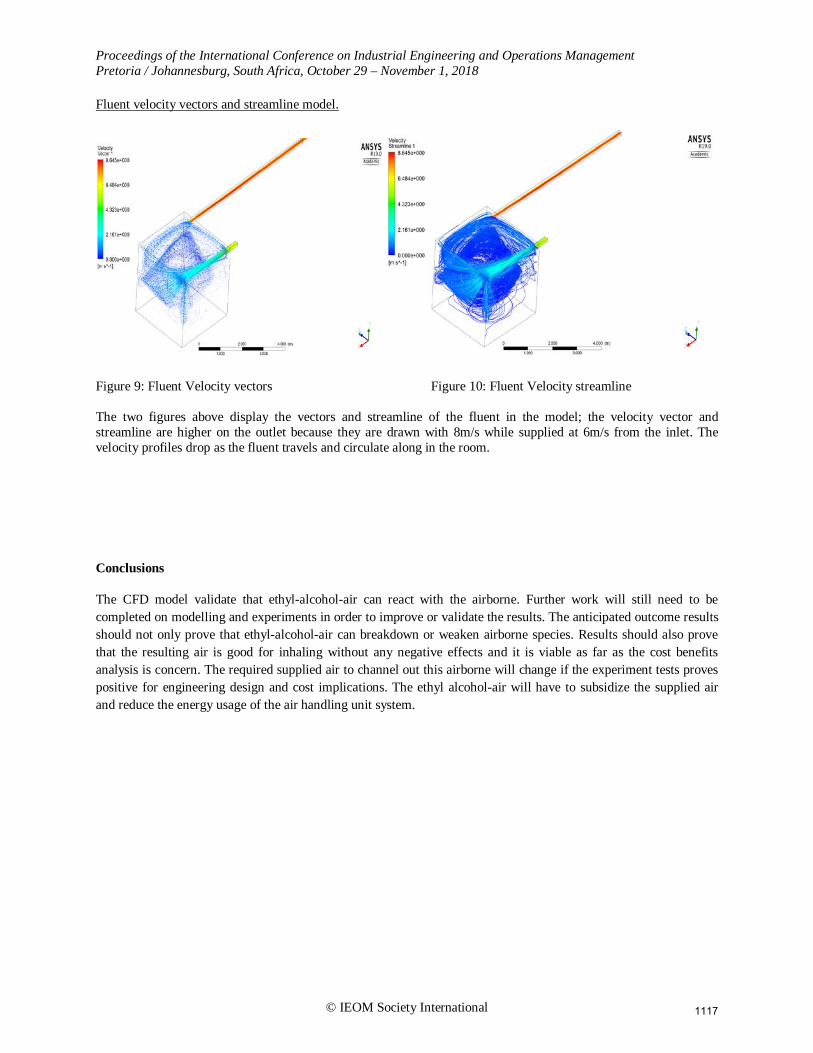
Figure7: Body Model Mesh Figure 8: Body Model Mesh prismatic layers
The Figure 7 shows the complete mesh of the Whole model. Presenting inlet body, room body, contaminant body and the outlet body. Figure 8 presenting the inlet body to emphasize the meshing size of the model.
1116
Proceedings of the International Conference on Industrial Engineering and Operations Management Pretoria / Johannesburg, South Africa, October 29 – November 1, 2018
© IEOM Society International
Fluent velocity vectors and streamline model.
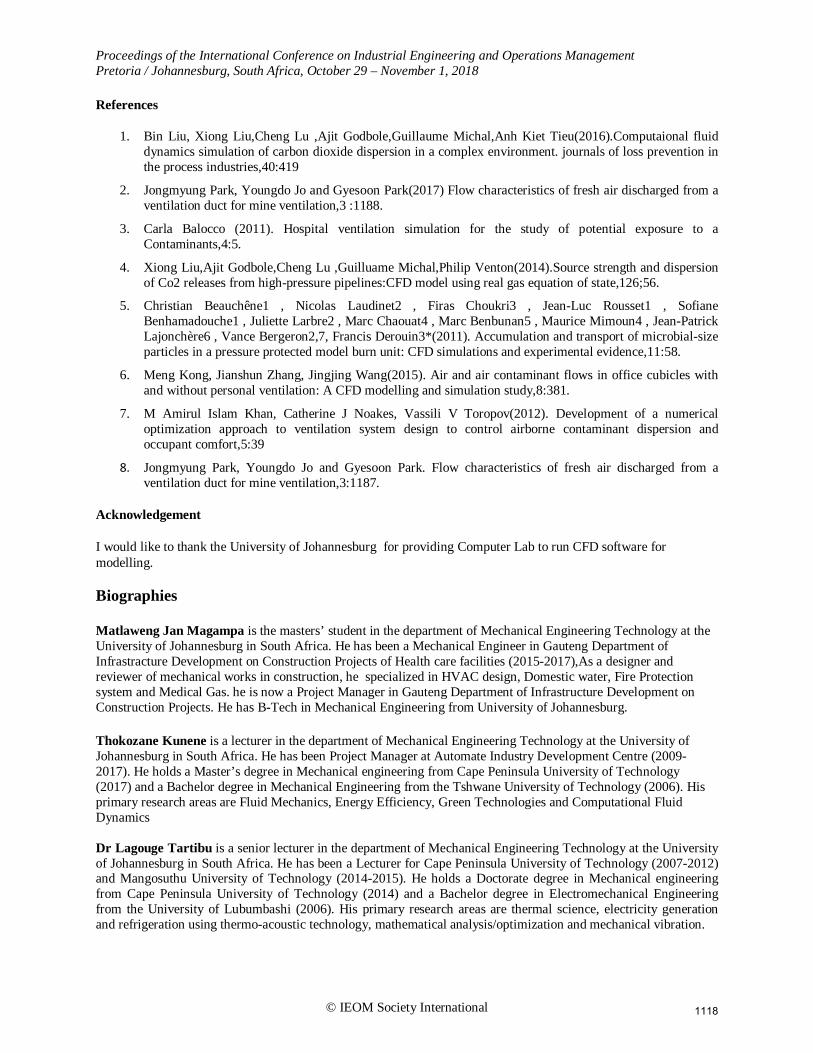
Figure 9: Fluent Velocity vectors Figure 10: Fluent Velocity streamline
The two figures above display the vectors and streamline of the fluent in the model; the velocity vector and streamline are higher on the outlet because they are drawn with 8m/s while supplied at 6m/s from the inlet. The velocity profiles drop as the fluent travels and circulate along in the room.
Conclusions
The CFD model validate that ethyl-alcohol-air can react with the airborne. Further work will still need to be completed on modelling and experiments in order to improve or validate the results. The anticipated outcome results should not only prove that ethyl-alcohol-air can breakdown or weaken airborne species. Results should also prove that the resulting air is good for inhaling without any negative effects and it is viable as far as the cost benefits analysis is concern. The required supplied air to channel out this airborne will change if the experiment tests proves positive for engineering design and cost implications. The ethyl alcohol-air will have to subsidize the supplied air and reduce the energy usage of the air handling unit system.
1117
Proceedings of the International Conference on Industrial Engineering and Operations Management Pretoria / Johannesburg, South Africa, October 29 – November 1, 2018
© IEOM Society International
References
1. Bin Liu, Xiong Liu,Cheng Lu ,Ajit Godbole,Guillaume Michal,Anh Kiet Tieu(2016).Computaional fluid dynamics simulation of carbon dioxide dispersion in a complex environment. journals of loss prevention in the process industries,40:419
2. Jongmyung Park, Youngdo Jo and Gyesoon Park(2017) Flow characteristics of fresh air discharged from a ventilation duct for mine ventilation,3 :1188.
3. Carla Balocco (2011). Hospital ventilation simulation for the study of potential exposure to a Contaminants,4:5.
4. Xiong Liu,Ajit Godbole,Cheng Lu ,Guilluame Michal,Philip Venton(2014).Source strength and dispersion of Co2 releases from high-pressure pipelines:CFD model using real gas equation of state,126;56.
5. Christian Beauchêne1 , Nicolas Laudinet2 , Firas Choukri3 , Jean-Luc Rousset1 , Sofiane Benhamadouche1 , Juliette Larbre2 , Marc Chaouat4 , Marc Benbunan5 , Maurice Mimoun4 , Jean-Patrick Lajonchère6 , Vance Bergeron2,7, Francis Derouin3*(2011). Accumulation and transport of microbial-size particles in a pressure protected model burn unit: CFD simulations and experimental evidence,11:58.
6. Meng Kong, Jianshun Zhang, Jingjing Wang(2015). Air and air contaminant flows in office cubicles with and without personal ventilation: A CFD modelling and simulation study,8:381.
7. M Amirul Islam Khan, Catherine J Noakes, Vassili V Toropov(2012). Development of a numerical optimization approach to ventilation system design to control airborne contaminant dispersion and occupant comfort,5:39
8. Jongmyung Park, Youngdo Jo and Gyesoon Park. Flow characteristics of fresh air discharged from a ventilation duct for mine ventilation,3:1187.
Acknowledgement
I would like to thank the University of Johannesburg for providing Computer Lab to run CFD software for modelling.
Biographies Matlaweng Jan Magampa is the masters’ student in the department of Mechanical Engineering Technology at the University of Johannesburg in South Africa. He has been a Mechanical Engineer in Gauteng Department of Infrastracture Development on Construction Projects of Health care facilities (2015-2017),As a designer and reviewer of mechanical works in construction, he specialized in HVAC design, Domestic water, Fire Protection system and Medical Gas. he is now a Project Manager in Gauteng Department of Infrastructure Development on Construction Projects. He has B-Tech in Mechanical Engineering from University of Johannesburg. Thokozane Kunene is a lecturer in the department of Mechanical Engineering Technology at the University of Johannesburg in South Africa. He has been Project Manager at Automate Industry Development Centre (2009-2017). He holds a Master’s degree in Mechanical engineering from Cape Peninsula University of Technology (2017) and a Bachelor degree in Mechanical Engineering from the Tshwane University of Technology (2006). His primary research areas are Fluid Mechanics, Energy Efficiency, Green Technologies and Computational Fluid Dynamics Dr Lagouge Tartibu is a senior lecturer in the department of Mechanical Engineering Technology at the University of Johannesburg in South Africa. He has been a Lecturer for Cape Peninsula University of Technology (2007-2012) and Mangosuthu University of Technology (2014-2015). He holds a Doctorate degree in Mechanical engineering from Cape Peninsula University of Technology (2014) and a Bachelor degree in Electromechanical Engineering from the University of Lubumbashi (2006). His primary research areas are thermal science, electricity generation and refrigeration using thermo-acoustic technology, mathematical analysis/optimization and mechanical vibration.
1118