numerical modeling of dielectric barrier discharge … · issue 10 - decemer 015 - dielectric...
TRANSCRIPT

Issue 10 - December 2015 - Dielectric Barrier Discharge Based Plasma Actuators for Flow Control AL10-05 1
Plasmas for Aeronautics
Numerical Modeling of Dielectric Barrier Discharge Based
Plasma Actuators for Flow Control : the COPAIER/CEDRE Example
G. Dufour, F. Rogier (ONERA)
E-mail: [email protected]
DOI : 10.12762/2015.AL10-05
Numerical simulation of active flow control using plasma actuators is dependent upon the development of models accounting for the effects of the actuators on the
flow. These can be obtained either by using experimental results coupled with strong assumptions regarding the plasma force distribution, or through numerical simulation. The objective of this paper is to investigate the characteristics of DBD plasma source terms obtained using direct numerical simulation. Using ONERA's in-house plasma solver COPAIER, we propose an insight of a complete chain of numerical models, ranging from the plasma discharge description to the computation of a DBD-induced ionic wind.
Introduction
Flow control with active actuators requires efficient, robust, easy to integrate and low energy consumption devices. Among these, Die-lectric Barrier Discharge (DBD) actuators have already demonstrated their efficiency in delaying flow separation or turbulence effects [5]. Following these promising results, some numerical studies have been conducted in order to estimate the effects of such actuators in other situations and also to try to determine their best locations and opera-ting conditions [6]. As far as flow control is concerned, these nume-rical simulations involving plasma actuators are mainly focused on the aerodynamical effects and, in order to model the plasma actuator, simplified source term expressions are used, with regard to both the geometrical and temporal aspects. Indeed, in such studies, the effects of Dielectric Barrier Discharges are mainly considered to be localized in a small rectangular area around the tip of the exposed electrode and the total exerted force is assumed to be uniformly distributed within this volume. The mean value of the source term is then fixed using some experimental measurements [5]. As for exploring the time-mo-dulation of the actuator effects, periodic Heaviside-shaped functions are considered, the only remaining parameters being the duty cycle and the operating frequency [6]. In order to obtain a more accurate source term describing the plasma actuator, it can be reconstructed from the Navier-Stokes equations using experimental measurements, such as the gas velocity distribution, and some simplifying assump-tions such as neglecting the pressure gradient [9]. Another idea is to completely model the discharge numerically and then to estimate the electric force exerted by the plasma on the flow from the computed
electric field, the charged species densities and their velocities. Such numerical simulations are particularly challenging and some strate-gies, such as asynchronous [3] or implicit [14] [15] [16] ones, have been tested in order to tackle these multiscale problems.
In this paper we will investigate how this last approach is developed within the plasma solver COPAIER developed at ONERA, focusing on a particular sinusoidal DBD actuator. In a first section, we will des-cribe the physical model used for the plasma. Then, in a second part, the numerical hurdles inherent to this model will be presented, as well as the numerical methods used in COPAIER, in order to overcome them. In a third section, the specific test-case of DBD actuation will be presented, as well as its numerical discretization. The dynamics of its discharge will be explained thoroughly in the next part. Then, the estimate of the electric force will be discussed in a fifth section. Finally, in the last two parts, the coupling of the COPAIER solver with the in-house Navier-Stokes solver CEDRE is presented and the effect of the time resolution of the source term will be investigated.
Plasma Model
The simulation of the dynamics of all of the species composing the plasma is based on the resolution of conservation equations for the densities of the species taken into account. These equations can be written in the generic form:
( ) . t i x i i in n v S∂ +∇ =

Issue 10 - December 2015 - Dielectric Barrier Discharge Based Plasma Actuators for Flow Control AL10-05 2
where ni is the density of the i-th species and vi is its velocity. The right-hand term Si describes the kinetic source term accounting for the creation (or destruction) of the charged species. The velocities should, in theory, be obtained by solving a similar equation for the momentum. Nevertheless, the inertia of charged particles being very low, the COPAIER solver assumes that the velocity is given by a mo-bility law depending on the local flow velocity and Electric Field. This mobility law is written as follows:
x ii g i i
i
nv U E Dn
µ ∇= + +
where Ug is the surrounding flow velocity, E is the electric field and µi and Di are respectively the mobility and diffusion coefficients of the considered species. As for the Electric Field, E, it is assumed to be the solution of a Poisson equation.
( ). ; E Eε ρ ϕ−∇ = =−∇
i ii
n qρ =∑where is the volumic charge induced by the charged species, is the local permittivity of the material and is the Electric Potential. It is assumed that the boundary conditions allowing the Poisson equation to be solved are either of Dirichlet type (anode and cathode) or of Neumann type (exterior boundaries).
The source term Si describes the kinetics responsible for the crea-tion of the charged species. Numerous kinetics models exist for atmospheric plasma discharges, involving different numbers of species [8]. In order to limit the number of species and reactions to be considered, some studies consider plasma discharges in nitrogen where the kinetics can be described using two reactions and three species only. However, one key-point of discharges in air is the possibility of creating negative ions by attaching electrons to dioxygen, which is not possible using only nitrogen. Although the user of the COPAIER solver could define a set of hundreds of species and reactions to model the kinetics, he would face major problems due to a heavy computational load, so it is of prime impor-tance to limit the complexity of this part. Thus, henceforth we will consider, as proposed by J.-P. Boeuf in [2], a reduced model for the kinetics, composed of electrons and three species Nn, Np and Nm, standing respectively for the neutral, positive and negative ions. The set of reactions to be considered can then be limited to only four, as described in the following Table 1.
Name Description Coeff.
Ionisation 2n p
N e N e+ → + ki
Attachment n mN e N+ → k
Electron-ionRecombination
p nN e N+ → kR
Ion-ionRecombination
p m nN N N+ → kR
Table 1 - Reduced kinetics
It must be noted that these coefficients depend on the local electric field. In particular, no ionization occurs if the electric field magnitude is lower than the breakdown value for air. The BOLSIG+ solver [4] provides values for all coefficients (ionization, attachment, etc.) for
both nitrogen and dioxygen. The values for the coefficients associa-ted with the reactions defined here are then calculated so that they are consistent with the composition of N (20% dioxygen and 80% nitrogen) and can be found in [17].
For the kind of discharge that we are interested in, it has already been shown that the photoionization process does not play an important role and may instead induce a higher computational burden [13]. Its interest is limited to the spontaneous creation of electrons out of neu-tral particles in order to guarantee a minimum density of electrons available for the ionization process. In this model, this phenomenon is not considered and, instead, a minimum density has been introduced for each species. Practically, this minimum has not been reached during our simulations. Furthermore, some specific phenomena must be considered for the plasma dynamics. These are of two kinds: the first is the secondary emission of electrons at both the cathode and dielectric surface. De-noting the positive and electronic fluxes at these surfaces by J+ and Je respectively, there is a secondary emission coefficient g, depending on the material of the surface, such that Je = - .J+ . Obviously, when an AC voltage is used, the stressed electrode plays the role of an anode and a cathode alternatively. It must be noted that in the anode alternative, the incoming positive ion flux is assumed to be zero so that no secondary emission occurs during this phase.
The other phenomenon describes the fact that some charged species can be trapped on the surface of a dielectric material and then act as a surface charge for the Poisson equation. This induces a disconti-nuity for the electric field in the direction normal to the surface of the dielectric material:
.E nε σ=
Finally, the electric force exerted on the fluid can be modeled using the electric field and the densities of the charged species. It can be written as:
i ii
F n q E=∑Solving this model is challenging, since it is heavily multiscale in both space and time; this point has already been reported in other refe-rences, with similar models and setups; see for example [3], [14], [15] or [16]. In these studies, these problems have been tackled either by using specific numerical approaches (asynchronous or implicit schemes) or by focusing on lower voltages and/or higher frequencies. We will recall here the main reasons explaining why this problem is multiscale. Firstly, more than the obvious scale difference between the actuator size (some centimeters) and the characteristic length of the flow when dealing with drag reduction (about one meter or more), the plasma model introduces its own scale differences in size and, as a consequence, in time. In order to illustrate this point, let us consider the case of electron dynamics. We first must remark that the Electric Field generated has a singular point near the tip of the stressed electrode (illustrated in Figure 5), introducing steep varia-tions over very small distances. Describing this effect accurately thus requires the consideration of very small characteristic lengths, even smaller than the anode thickness, which is of about 70 microme-ters. Moreover, given that the electronic mobility is dependent on the electric field value, their drift velocity is large in this area. The charac-teristic time associated with the transport phenomenon can then be

Issue 10 - December 2015 - Dielectric Barrier Discharge Based Plasma Actuators for Flow Control AL10-05 3
defined as the ratio between the characteristic length and the velocity, leading to characteristic times as small as some picoseconds. Never-theless, this multiscale aspect is not limited to the tips of the stressed electrodes. Indeed, when the densities of charged species are high enough, the effect of the local charge on the electric field must be considered, introducing a new characteristic length, known as the Debye length:
2B e
De e
k Tn qελ =
For atmospheric plasma discharges such as those that we are in-terested in, for an electronic temperature around 10000 K and an electronic density that can be as high as 1018 m-3, the Debye length can shrink rapidly down to one micrometer, introducing a three or-der scale difference between the geometry of the electric field and the actuator size, which is generally millimetric. Other phenomena, such as ion kinetics, also have characteristic times depending on the electric field values, although their dynamics might not be the most constraining ones. The table below sums up the different time scales that we have to deal with when trying to simulate an atmospheric plasma discharge.
Phenomenon Characteristic time
Transport of electrons From 1 ns to 1 ps
Electric field variations From 1 µs to 0.01 ns
Kinetics From 0.1 to 10 µs
Transport of heavy species (ions) From 0.1 to 1 ns
Plasma dynamics From 0.01 to 0.1 ms
Ionic wind About 1 ms
Table 2 - Characteristic times for a plasma discharge
Numerical methods used in COPAIER
Turning to numerical models, the multi-scale aspect discussed in the model translates into two different notions, which are the mesh size and the time step. As regards the first one of these, a refined mesh must be used, at least locally, in order to accurately solve the electric field profile. Nevertheless, in order to correctly describe the experi-mental set-up, the size of the computational domain must remain large enough, which can lead to computations involving a huge num-ber of unknowns if the mesh size is almost constant.
In order to overcome this difficulty, the COPAIER solver is able to simultaneously use two types of meshes. On the one hand, a struc-tured mesh based on quadrangles can be used where precision is needed. It is well-known in the Applied Mathematics community that structured meshes allow for better (precision-wise) and often faster numerical results, but also introduce numerous unneeded mesh cells where mesh refining is concerned. On the other hand, an unstructu-red triangle-based mesh enables complex actuator geometries to be taken into account and also enables less-refined mesh zones to be easily defined, in order to limit the number of Degrees of Freedom (DOFs). This aspect is illustrated in Figure 4.
For the time step, the major hurdle is to deal with the multi-scale aspect of the model. The simplest way to tackle this would ob-viously be to numerically solve all phenomena using the most constrained time step. Unfortunately, some equations, such as the Poisson equation for the Electric Field, require relatively high computational times so this approach would not be able to provide numerical results within a reasonable time. As a consequence, a different approach has been chosen in COPAIER. As explained pre-viously, the numerical model for plasma discharges can be split into three different parts (drift-diffusion, kinetics and the Poisson equation). Each of these will then be dealt with using a specific numerical method, which allows for adapted time-integration strate-gies such as sub-cycling (for the phenomena with the smallest time steps) and splitting methods. For this last point, given that all of the numerical methods used in COPAIER are second-order accurate in time, the Strang splitting strategy, which guarantees a second-order accurate coupling, has been used. We will now briefly explain the various numerical methods used to solve all of the equations of the plasma model.
In order to solve the drift-diffusion equation, a Finite Volume ap-proach, which is well-suited when dealing with conservation equa-tions, has been chosen. More precisely, the fluxes at each edge of the mesh are estimated using a MUSCL reconstruction, ensuring a second-order (space-wise) approximation [18]. This kind of method requires an estimate for the gradient of the density profile. When the mesh is unstructured, a dual-mesh algorithm using the Green formula to estimate the gradient is implemented. The time-integration part is performed using the Heun Method, which is known to be conditionally stable (the time step must comply with the classic CFL condition) and also second-order accurate in time.
The Finite Element Method has been used to solve the Poisson equa-tion. In order to remain consistent with the accuracy provided by the numerical scheme used for the transport of the species, a P1-Finite Element formulation has been implemented for the unstructured mesh, while a Q1 formulation has been used for the structured part of the mesh. In order to limit the computational burden imposed by this method when refined meshes are used, a non-overlapping Schur method has been developed. It relies on a decomposition of the rigidity matrix, allowing the values of the potential on the nodes corresponding to the interface between the structured and unstructured meshes to first be determined. It must be noted that this requires either solving a linear system of size Ninterf (i.e., the number of nodes on the interface) at each time step, or inverting the Schur matrix (of size Ninterf
2). The efficiency of this algorithm is then lessened when the interface size grows, which should limit its use to 2D meshes. Given that the structure of the Schur matrix does not change over time, a LU decomposition is performed (only once, as a preprocessing task), in order to compute its inverse. Another matrix inversion is needed at every time step, when compu-ting the electric field within each domain. Depending on the size of the mesh, either a direct LU decomposition or an iterative Conjugate Gradient Method can be used.
Finally, considering the kinetics dynamics, a second-order explicit Runge-Kutta method has been developed. This method is based on the estimation of a maximum time step ensuring the positivity of the components of the kinetics.

Issue 10 - December 2015 - Dielectric Barrier Discharge Based Plasma Actuators for Flow Control AL10-05 4
Numerical computation of a plasma actuator effect: a DBD Test-case
In this section, we will present the numerical computation of the elec-tric force induced by a DBD-type discharge. The test-case that has been chosen corresponds to an experimental setup proposed by S. Roy [1] and illustrated in Figure 1.
Exposedelectrode
Exposed electrode
Dielectric Mat' I (Acrylic*)
D=5
mm
E=3 w
y
xx
z
F=155 mm
A=200 mm
C=70
mm B=
230
mm
H=3
mm
Groundedelectrode**
Groundedelectrode**
* www.mcmaster.com-8589K41Grounded** 70 µm thick copper electrodes
Figure 1 - Experimental Set-Up
Such a configuration is an interesting one to model numerically, since it has been extensively studied and its working frequency is quite high so the periodic behavior of the actuator is reached within a short time. This last point is of prime importance, since it allows us to perform numerical computations of this periodic behavior while limiting the associated computational cost.
3.5 cm
0.5 cm 2.5 cm0.5 cm
0.9
cm
0.3
cm
Air
Dielectrique
Figure 2 - Computational Domain
The experimental setup can be described numerically using a 2D computational domain defined as in Figure 2. It must be noted that the cathode does not appear on this figure; this is motivated by the absence of plasma in the area near the cathode. Thus, describing the volumic cathode would require small mesh cells where no plasma dynamics would occur.
The effect of the cathode is instead taken into account by using a Dirichlet boundary condition on the part of the lower domain boun-dary corresponding to the location of the cathode. The potential profile shown in Figure 3 matches the results already presented by
Figure 3 - Potential profile
Unfer et al in [3] for a Laplacian potential for the same configuration, which shows that this representation indeed provides a correct elec-tric field.
The phenomena discussed in Part 2, such as the secondary emission and the electric field discontinuity at the boundary of the dielectric, are included through an identification of all the mesh edges corres-ponding to the surface of the dielectric or the anode. For each edge, the “incoming” flux of charged species is used either for computing the contribution of the secondary emission (modification of the flux for the electrons) or to update the accumulated charge on the surface of this part of the dielectric. The total charge on the dielectric can then be calculated at every time step through a sum of all of the charges contained within the “dielectric edges”.
With this model, the mesh used focuses on the part where precision is needed, more specifically near the surface of the dielectric and in the vicinity of the tip of the anode. In order to contain the computa-tional cost as much as possible, the size of the mesh cells increases quickly as the distance to the anode grows. Such a strategy is well-suited for our numerical resolution of the Poisson equation. Indeed, as stated before, Neumann boundary conditions have been used for the exterior boundary, so that the profile of the computed electric field can be significantly modified if the size of the computational domain is not large enough. The use of an unstructured mesh allows us to define a computational domain large enough to neglect the effect of the Neumann condition (see again Figure 3) on the results, while limi-ting the number of degrees of freedom.
The structured part of the mesh contains the area where the electric field singularity is located, as is shown in Figure 5 and Figure 6, where the electric field is represented near the anode with the mesh used.
Figure 4 - Example of mesh refinement
Figure 5 - Example of an electric field profile and mesh

Issue 10 - December 2015 - Dielectric Barrier Discharge Based Plasma Actuators for Flow Control AL10-05 5
Figure 6 - Electric field singularity and mesh (zoom)
The model for the kinetics has already been discussed in Section 2. The discharge is assumed to occur in air at atmospheric pressure and ambient temperature. The accumulation of charged species at the surface of the dielectric material is taken into account. The applied potential has an amplitude of 10.5 kV, which corresponds to 21 kV peak-to-peak (ptp).
Physical parameters
Signal shape Sinusoidal
Applied voltage (ptp) 21 kV
Frequency 14 kHz
Relative permitivity (dielectric) R=3
Secondary emission coefficient =10-4
The use of a structured mesh allows the precision of the results to be preserved, while limiting the number of cells used. It must be noted that the minimum mesh size corresponds to the discretization of the anode width and leads practically to dimensions comparable to the minimum Debye length attained during the discharge. This ensures that the electric field will be correctly solved even when the plasma is established.
Numerical parameters
total number of cells 15192
Total number of edges 27361
Min mesh size 10 µm
Min time step 5.10-12s
Physical time simulated 300 µs
As for the initial condition, only the density profiles have to be given. We assumed that the densities of the charged species are all constant within the computational domain and an arbitrary low value of 10-9.m-3 has been used. The neutral density is the one measured in air at at-mospheric pressure and ambient temperature, which is 2.5.1026.m-3. The charge on the surface of the dielectric is assumed to be zero at the beginning. Practically, our computations using several different values showed that the effects of the initial conditions remain limited to the dynamics of the first period of the discharge. The COPAIER
solver version used in to simulate this test-case is single-threaded. This computation took about a week to complete, on an Intel quad-core 2.66 GHz workstation equipped with 8 GB of RAM.
Discharge Dynamics
After the first period, the discharge dynamics enters a periodic re-gime, with the same period T of the actuation (T=1/14000 s), which can be split into four different steps. In a first part, the voltage applied to the anode rises and as soon as the Voltage breakdown value is reached, the process of ionization begins, yielding a cloud of high positive ions densities.
Figure 7 - Positive ion density – streamer beginning time = 3T + T/10
This streamer propagates along the dielectric material while charging its surface, as represented in Figure 7 and Figure 8. Given that the density level variations may reach several orders of magnitude, the quantity represented in these figures is the logarithm of the density.
Figure 8 - Positive ions - maximum streamer extension time = 3T + T/4
Please note that in all of the figures, the anode and dielectric part are indicated respectively by the grey and (thin) white areas, but they can also be inferred from the cloud profile: the dielectric lies at the bottom of the cloud, while the downstream tip of the anode is located at the very bottom-left corner of the cloud. This streamer leads to a modification of the electric field, as shown in Figure 9 (in this figure, only the anode and the dielectric surface have been specified). The electric force created in this phase has the shape of the ionic cloud. The density of the force is expressed in N.m-3 in Figure 10.
Then, after the voltage peak, the electric field decreases rapidly until its value is driven by the local charge instead of by the voltage applied to the anode, as seen in Figure 9. During this phase, the cloud of positive ions moves a little backwards toward the anode, which is represented in Figure 11. In a third phase, the discharge enters a negative regime as the ap-plied voltage becomes negative. During this part, the behavior of the
Issue 10 - December 2015 - Dielectric Barrier Discharge Based Plasma Actuators for Flow Control AL10-05 6
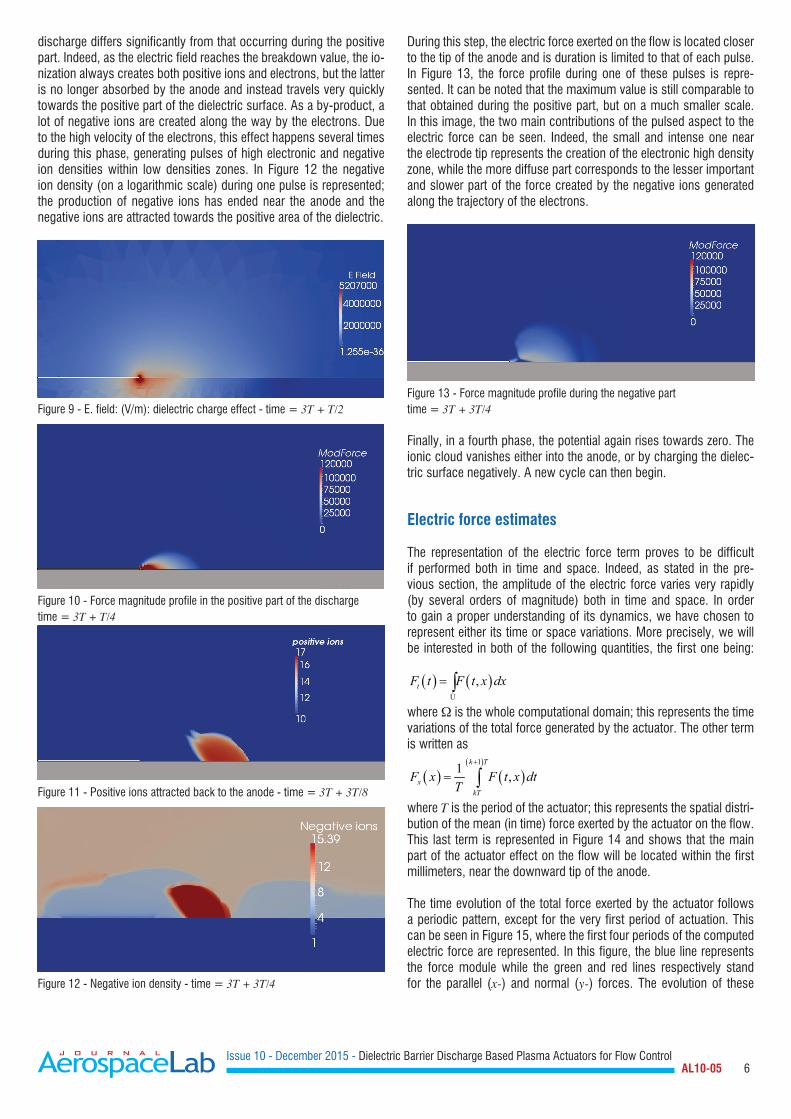
discharge differs significantly from that occurring during the positive part. Indeed, as the electric field reaches the breakdown value, the io-nization always creates both positive ions and electrons, but the latter is no longer absorbed by the anode and instead travels very quickly towards the positive part of the dielectric surface. As a by-product, a lot of negative ions are created along the way by the electrons. Due to the high velocity of the electrons, this effect happens several times during this phase, generating pulses of high electronic and negative ion densities within low densities zones. In Figure 12 the negative ion density (on a logarithmic scale) during one pulse is represented; the production of negative ions has ended near the anode and the negative ions are attracted towards the positive area of the dielectric.
Figure 9 - E. field: (V/m): dielectric charge effect - time = 3T + T/2
Figure 10 - Force magnitude profile in the positive part of the discharge time = 3T + T/4
Figure 11 - Positive ions attracted back to the anode - time = 3T + 3T/8
Figure 12 - Negative ion density - time = 3T + 3T/4
During this step, the electric force exerted on the flow is located closer to the tip of the anode and is duration is limited to that of each pulse. In Figure 13, the force profile during one of these pulses is repre-sented. It can be noted that the maximum value is still comparable to that obtained during the positive part, but on a much smaller scale. In this image, the two main contributions of the pulsed aspect to the electric force can be seen. Indeed, the small and intense one near the electrode tip represents the creation of the electronic high density zone, while the more diffuse part corresponds to the lesser important and slower part of the force created by the negative ions generated along the trajectory of the electrons.
Figure 13 - Force magnitude profile during the negative part time = 3T + 3T/4
Finally, in a fourth phase, the potential again rises towards zero. The ionic cloud vanishes either into the anode, or by charging the dielec-tric surface negatively. A new cycle can then begin.
Electric force estimates The representation of the electric force term proves to be difficult if performed both in time and space. Indeed, as stated in the pre-vious section, the amplitude of the electric force varies very rapidly (by several orders of magnitude) both in time and space. In order to gain a proper understanding of its dynamics, we have chosen to represent either its time or space variations. More precisely, we will be interested in both of the following quantities, the first one being:
( ) ( )Ù
,tF t F t x dx= ∫where is the whole computational domain; this represents the time variations of the total force generated by the actuator. The other term is written as
( )( )
( )11 ,
k T
xkT
F x F t x dtT
+
= ∫where T is the period of the actuator; this represents the spatial distri-bution of the mean (in time) force exerted by the actuator on the flow. This last term is represented in Figure 14 and shows that the main part of the actuator effect on the flow will be located within the first millimeters, near the downward tip of the anode.
The time evolution of the total force exerted by the actuator follows a periodic pattern, except for the very first period of actuation. This can be seen in Figure 15, where the first four periods of the computed electric force are represented. In this figure, the blue line represents the force module while the green and red lines respectively stand for the parallel (x-) and normal (y-) forces. The evolution of these

Issue 10 - December 2015 - Dielectric Barrier Discharge Based Plasma Actuators for Flow Control AL10-05 7
quantities is consistent with the discharge dynamics, since we have two main behavior types. The first is a smooth curve, which is gene-rated by the positive streamer described in the previous section, while the second shows a series of peaks, which correspond to the electro-nic pulses generated during the negative part of the discharge.
Figure 14 - Electric force profile: mean value over one period of actuation
N/m0.1
0.06
0.020
0 5.10-5 1.10-4 2.10-4 s
Figure 15 - Total force dynamics (N/m), first four periods at 14 kHz
The difference in the first period lies in the force exerted during the positive phase of the discharge. It can easily be explained by the initial conditions used for the numerical simulation. Indeed, at the begin-ning of the simulation, the densities of all species are assumed to be constant over the computational domain and the charge at the surface of the dielectric is set to zero. In fact, after the first period, the dielectric surface has a negative charge because the applied potential begins a new period, yielding higher values for the electric field gene-rated near the tip of the anode and an earlier start of the streamer, allowing for a very important electric force being exerted on the gas.
The total deposited charge on the surface of the electrode is repre-sented in Figure 16 and indeed shows a periodic behavior after the first two periods of the actuator. It can also be noted that the nega-tive charge deposited during the negative part of the cycle is slightly greater than the positive one, but with a shorter duration. Given that our model is 2D and does not model the actual length of the anode, this charge is expressed in C/m (charge by unit of anode length).
We are interested in the evolution of the force during one period. In Figure 17 the force computed for the fourth period of the actuator is represented.
C/m
x 10-5 Charge versus time
6
4
2
0
-2
-4
-6
-8
-10
0 1 2 3 4 5 6 time (s) x 10-4
Figure 16 - Charge deposited on the surface of the dielectric material
mN/
m
Force100
80
60
40
20
0
-20
0 0.25 0.5 0.75 1 time in period
Figure 17 - Force exerted during the fourth period
We observe that the total force is mostly created during the positive part of the cycle, while the streamers triggered later in the negative part seem to hold only a minor contribution. In fact, the positive cycle describes a regime of glow discharge and the negative one is formed of successive streamers triggered at different times, depending stron-gly on the slope of the applied potential.
The total force generated corresponds to the mean value calculated in one period
( )
( )11 ,
k T
TOTkT
F F t x dtdxT
+
Ω
= ∫ ∫For our test-case, the computed value for this set-up is about 19 mN/m and the experimental value given by Durscher and Roy [1] is around 20 mN/m. Hence, the discrepancy between measurement and modeling is here less than 1mN/m, which is a good estimation, given the (relatively) low level of complexity of the modeling.
Y(m
)
120000109000
980008700076000650005400043000320002100010000
0.0045
0.004
0.0035
0.003 0.009 0.0095 0.01 0.0105
X (m)

Issue 10 - December 2015 - Dielectric Barrier Discharge Based Plasma Actuators for Flow Control AL10-05 8
Having such a numerical model allows for a parametric study to de-termine the trends of the discharge dynamics and characteristic when the applied voltage or the frequency are changed.
In Figure 18 the average force time-profiles for both 7 kHz and 14 kHz actuators are represented. The dynamics of both discharges remain similar with the smooth positive part and the pulsed negative one. In terms of amplitude, it can be noted that a higher frequency yields a higher force term.
Stre
ngth
mN/
m
Average force x on one period V=21kV
14 kHz7 kHz
100
50
0
-50 0 0.2 0.4 0.6 0.8 1 1.2 1.4 1.6 1.8 2 Time in number of period of 7 kHz
Figure 18 - Total force dynamics 14 kHz, 7 kHz
Conversely, in Figure 18, both of the average force time-profiles for two different voltages are represented. Unsurprisingly, a higher vol-tage creates a higher force term. It can also be noted that increasing the voltage also increases the number of pulses during the negative part of the discharge.
A parametric study of the total force variation with respect to the ope-rating voltage has been performed. The frequency is set to 14 kHz.
Stre
ngth
mN/
m
Average force x on one period F=14kHz
21 kV16 kV
100
80
60
40
20
0
-20 0 0.1 0.2 0.3 0.4 0.5 0.6 0.7 0.8 0.9 1
time (periods)
Figure 19 - Total force dynamics 16kV 21 kV
In Figure 20, the total body force for voltages ranging from 14kV to 28kV is shown. When comparing these values with the experimental results
of S. Roy [1], we observe a small discrepancy in the total body force (less than 1mN/m) for voltages of around 21kV and a larger one for low voltages. The evolution of the force with the applied voltage seems to follow the well-known “exponential law” (F of order V3/2, represented with a red line in Figure 20), at least for low voltages. In the range of high voltages (larger than 26 kV), the body force seems to reach a threshold. This effect, numerically observed for voltages up to 32 kV (not repre-sented here), still needs further computations, although this phenomenon has been noticed by many experimentalists in other configurations. For example, the induced velocity does not increase with the voltage for a high enough voltage [11]. This fact has also been noted by the group of J.P. Boeuf [7], which suggests that the induced velocity will eventually reach a limit.
mN/
m
Force versus voltage55
50
45
40
35
30
25
20
15
10
5
12 14 16 18 20 22 24 26 28 30 V ptop
Figure 20 - Mean total force vs. applied voltage
Ionic wind estimate
In order to compare our numerical results with experimental data, we need to estimate the ionic wind generated by the discharge. For this purpose, the actuator effect will be modeled as a momentum source term in a Navier-Stokes solver. The ONERA in-house Navier-Stokes solver CEDRE [12] has been used to compute the flow created by the DBD-discharge. This flow computation corresponds to a typical flat plate case. The actuator characteristics are kept unchanged with a 21 kV (ptp) sinusoidal potential at a 14 kHz frequency.
10000900080007000600050004000300020001000
0
0.015
0.01
0.005
0
0 0.01 0.02 0.03
V5
Figure 21 - Source term (N/m3/s) as seen by CEDRE
The electric force, as it appears in its periodic regime, has been com-puted by the plasma solver COPAIER and averaged over one period. It is then introduced as a time-wise constant source term, while it varies

Issue 10 - December 2015 - Dielectric Barrier Discharge Based Plasma Actuators for Flow Control AL10-05 9
in space, as shown in Figure 10. More precisely, the Navier-Stokes solver considers a P1-reconstruction of the source term, which is given as point-located values. In order to avoid errors in the total force due to this interpolation, a very dense set of points has been used near the tip of the electrode. This is illustrated in Figure 21.
The computations were performed using a turbulent k-w model, which provides a better description of the wall-jet nature of the flow [10]. The computation is an unsteady one, but what we are aiming at is a steady-state flow profile, so that this can be compared with the experimentally measured profiles.
The results are shown in Figure 22 and Figure 23 respectively for the x-component and y-component of the ionic wind velocity.
Y(m
)
5.55
4.54
3.53
2.52
1.51
0.50
0.015
0.01
0.005
0 0 0.005 0.01
X (m)
Figure 22 - Parallel (x-) velocity profile
Y
V y
0.04
0.035
0.03
0.025
0.02
0.015
0.01
0.005
0 0.005 0.01 0.015 0.02 0.025 0.03 0.035 0.04 X
0.40.2
0-0.2-0.4-0.6-0.8
-1-1.2-1.4
Figure 23 - Orthogonal (y-) velocity profile
In these figures, it may be noted that the ionic wind maximum parallel velocity is of about 6 m.s-1 and is reached near the tip of the anode, where the electric force source term is the most important. The per-pendicular velocity is negative and its maximum amplitude is of about
1.8 m.s-1, which is reached a little over the exposed electrode. This zone corresponds to a suction zone.
Y (m
)
x=5 mmx=2 mmx=10 mmx=15 mm
0.005
0.004
0.003
0.002
0.001
0 1 2 3 4 5 6Ux (m/s)
Figure 24 - Velocity y-profile for various positions downstream
The profiles of the parallel component Ux of the velocity at various locations downstream from the tip of the anode are represented in Figure 24. The effect of the actuator fades as the distance increases. These numerical results can be compared with the experimental measurements of ionic wind velocities from Durscher and Roy in [1]. The location of the probe is 15 mm downstream from the tip of the anode.
It can be seen in Figure 25 that the shape of the experimental and computed curves is similar, but the “width” of the wind crea-ted experimentally seems to be larger than that computed. While the order of magnitude for the velocity is correct, the difference between the maximum values remains significant (about 5 m/s for the experiment against 3.5 m/s for the computation).
y (m
m)
Pitot
PIV
5
4
3
2
1
0 0 1 2 3 4 5 6
Ux (ms-1)
Figure 25 - Experimental velocity y-profile, probe at location x=15mm, from S. Roy et al [1]

Issue 10 - December 2015 - Dielectric Barrier Discharge Based Plasma Actuators for Flow Control AL10-05 10
Ionic wind profile: influence of the temporal dynamics of the source term
In the previous section, the effect of the actuator on the flow has been assumed to remain constant, given the short period of the actuator. Nevertheless, the time-profile of the space-integrated electric force shown in Section 5 indicates that the actual effect of the actuator does not exactly consist in a continuous medium-amplitude effect, but rather in short pulses of a high amplitude force. In order to inves-tigate the possibility of coupling between the time-dynamics of the actuator and the aerodynamics, allowing for a better efficiency of the ionic wind generation, another computation has been set-up. In this numerical test, the source term is no longer assumed to be constant in time, but rather is approximated using a piecewise-constant function. We then define a sequence of ten different source-term profiles, each one representing the mean effect of the actuator during a tenth of an actual period. They are defined as follows:
( )( )
( )2
10
2 110
10 ,
TT k
kx
TT k
F x F t x dtT
+
+ −
= ∫
Obviously, this piecewise approximation preserves the mean force value over one period, so that this test-case can be compared force-wise with that described in Section 7. It must be noted that, as stated in the introduction of this paper, many numerical experiments have already been conducted in order to determine the effect of the duty
cycle of a plasma actuator on the aerodynamics [6]. The study pro-posed here differs significantly from these by modifying both the tem-poral and spatial distribution of the force source term created by the actuator. More precisely, instead of just adjusting the amplitude of the source term, the changes of its shape throughout the actuator period are also taken into account, performing the complete simulation of the discharge. However, in order to save computational time, the objec-tive remains to use a source term pre-processed by the COPAIER solver, so complete coupling with the fluid solver as in [16] is not considered.
In Figure 26, Figure 27 and Figure 28 the velocity fields and profiles at different times within an actuation period are represented, after the periodic regime of both the actuator dynamics and the flow evolution are reached. The position of the anode tip is indicated with a white line and the width of the image corresponds to 10 millimeters.
In the first of the three figures, the velocity field is that created during the previous periods of actuation and the action of the actuator for the considered period has not yet begun. The velocity of the flow near the tip of the anode shows low values.
In the second figure of the set, a high velocity “bubble” has appeared due to the action of the positive part of the discharge; its effect is mainly located near the anode. As explained previously, the effect of the nega-tive part of the discharge shows a lower relative effect and just allows the transport of the “bubble” downstream to be accompanied.
Figure 26 - Velocity field at t = 400T
1 mm
2 mm
15 mm
y(m)8.2 10-3
8.0 10-3
7.8 10-3
7.6 10-3
7.4 10-3
7.2 10-3
7.0 10-3
6.8 10-3
6.6 10-3
6.4 10-3
6.2 10-3
6.0 10-3
5.8 10-3
5.6 10-3
5.4 10-3
5.2 10-3
5.0 10-3
4.8 10-3
4.6 10-3
4.4 10-3
4.2 10-3
-1 0 1 2 3 4 5 6 7Vx (m/s)

Issue 10 - December 2015 - Dielectric Barrier Discharge Based Plasma Actuators for Flow Control AL10-05 11
Figure 27 - Velocity field at t=400T+T/3
Figure 28 - Velocity field at t=400T+2T/3
1 mm
2 mm
15 mm
y(m)8.2 10-3
8.0 10-3
7.8 10-3
7.6 10-3
7.4 10-3
7.2 10-3
7.0 10-3
6.8 10-3
6.6 10-3
6.4 10-3
6.2 10-3
6.0 10-3
5.8 10-3
5.6 10-3
5.4 10-3
5.2 10-3
5.0 10-3
4.8 10-3
4.6 10-3
4.4 10-3
4.2 10-3
-1 0 1 2 3 4 5 6 7Vx (m/s)
1 mm
2 mm
15 mm
8.2 10-3
8.0 10-3
7.8 10-3
7.6 10-3
7.4 10-3
7.2 10-3
7.0 10-3
6.8 10-3
6.6 10-3
6.4 10-3
6.2 10-3
6.0 10-3
5.8 10-3
5.6 10-3
5.4 10-3
5.2 10-3
5.0 10-3
4.8 10-3
4.6 10-3
4.4 10-3
4.2 10-3
-1 0 1 2 3 4 5 6 7Vx (m/s)
y(m)
Issue 10 - December 2015 - Dielectric Barrier Discharge Based Plasma Actuators for Flow Control AL10-05 12
In the third figure, the merging of the bubble with the already esta-blished velocity field can be seen.
As a consequence of this behavior, the velocity y-profiles (curves in the right hand side of the figures) will show different dynamics depending on their distance to the actuators. If the point of mea-sure is far enough from the downstream tip of the anode, the profile will mainly remain unchanged by the effect of the actua-tor. When considering close enough points of measure (e.g., 1 mm and 2 mm), it can be seen that the profile shows small but still significant differences depending on the part of the actuator period that we are considering. If the shape remains globally the same, the maximum value attained varies (from about 5.7 m.s-1 to 6.2 m.s-1 for the 1mm curve), due to the transport of the “high velocity bubble”. Once this effect has become diffused within the established velocity field, no further dynamical effect is visible.
These preliminary results hint at a new aspect of the definition of the body force term created by a plasma actuator. Indeed, when compared to a constant mean-valued functioning of the actuation, the coupling between the complete dynamics of the actuator and the flow dynamics modifies the velocity field near the anode and leaves it unchanged further away. It can then be inferred that trying to deter-mine a constant value of the electric force using velocities either mea-sured far away from the anode or averaged may lead to inaccurate results.
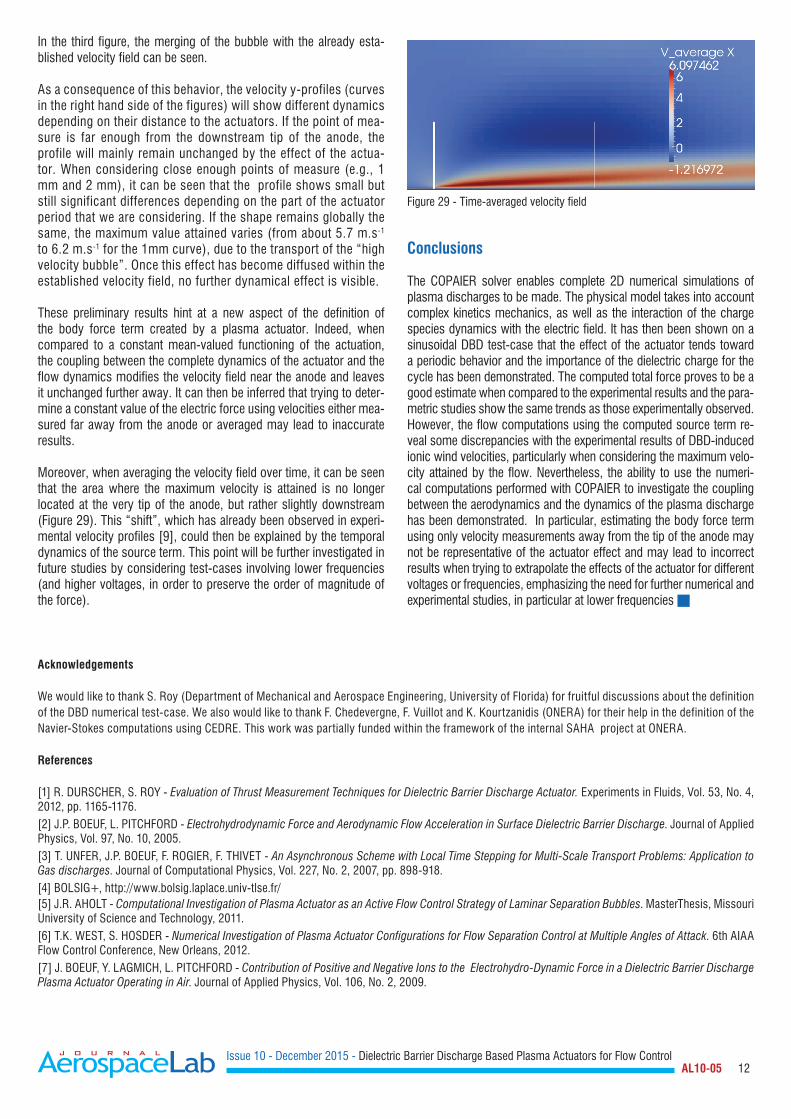
Moreover, when averaging the velocity field over time, it can be seen that the area where the maximum velocity is attained is no longer located at the very tip of the anode, but rather slightly downstream (Figure 29). This “shift”, which has already been observed in experi-mental velocity profiles [9], could then be explained by the temporal dynamics of the source term. This point will be further investigated in future studies by considering test-cases involving lower frequencies (and higher voltages, in order to preserve the order of magnitude of the force).
Figure 29 - Time-averaged velocity field
Conclusions
The COPAIER solver enables complete 2D numerical simulations of plasma discharges to be made. The physical model takes into account complex kinetics mechanics, as well as the interaction of the charge species dynamics with the electric field. It has then been shown on a sinusoidal DBD test-case that the effect of the actuator tends toward a periodic behavior and the importance of the dielectric charge for the cycle has been demonstrated. The computed total force proves to be a good estimate when compared to the experimental results and the para-metric studies show the same trends as those experimentally observed. However, the flow computations using the computed source term re-veal some discrepancies with the experimental results of DBD-induced ionic wind velocities, particularly when considering the maximum velo-city attained by the flow. Nevertheless, the ability to use the numeri-cal computations performed with COPAIER to investigate the coupling between the aerodynamics and the dynamics of the plasma discharge has been demonstrated. In particular, estimating the body force term using only velocity measurements away from the tip of the anode may not be representative of the actuator effect and may lead to incorrect results when trying to extrapolate the effects of the actuator for different voltages or frequencies, emphasizing the need for further numerical and experimental studies, in particular at lower frequencies
Acknowledgements
We would like to thank S. Roy (Department of Mechanical and Aerospace Engineering, University of Florida) for fruitful discussions about the definition of the DBD numerical test-case. We also would like to thank F. Chedevergne, F. Vuillot and K. Kourtzanidis (ONERA) for their help in the definition of the Navier-Stokes computations using CEDRE. This work was partially funded within the framework of the internal SAHA project at ONERA.
References
[1] R. DURSCHER, S. ROY - Evaluation of Thrust Measurement Techniques for Dielectric Barrier Discharge Actuator. Experiments in Fluids, Vol. 53, No. 4, 2012, pp. 1165-1176.[2] J.P. BOEUF, L. PITCHFORD - Electrohydrodynamic Force and Aerodynamic Flow Acceleration in Surface Dielectric Barrier Discharge. Journal of Applied Physics, Vol. 97, No. 10, 2005.[3] T. UNFER, J.P. BOEUF, F. ROGIER, F. THIVET - An Asynchronous Scheme with Local Time Stepping for Multi-Scale Transport Problems: Application to Gas discharges. Journal of Computational Physics, Vol. 227, No. 2, 2007, pp. 898-918.[4] BOLSIG+, http://www.bolsig.laplace.univ-tlse.fr/[5] J.R. AHOLT - Computational Investigation of Plasma Actuator as an Active Flow Control Strategy of Laminar Separation Bubbles. MasterThesis, Missouri University of Science and Technology, 2011.[6] T.K. WEST, S. HOSDER - Numerical Investigation of Plasma Actuator Configurations for Flow Separation Control at Multiple Angles of Attack. 6th AIAA Flow Control Conference, New Orleans, 2012.[7] J. BOEUF, Y. LAGMICH, L. PITCHFORD - Contribution of Positive and Negative Ions to the Electrohydro-Dynamic Force in a Dielectric Barrier Discharge Plasma Actuator Operating in Air. Journal of Applied Physics, Vol. 106, No. 2, 2009.

Issue 10 - December 2015 - Dielectric Barrier Discharge Based Plasma Actuators for Flow Control AL10-05 13
[8] I.A. KOSSYI, A.Y. KOSTINSKY, V.P. SILAKOV, T. UNFER, J. BOEUF - Kinetic Scheme of the Non-Equilibrium Discharge in Nitrogen-Oxygen Mixtures. Plasma Sources Science and Technology, Vol. 1, No. 207, 1992, pp. 207-220.[9] N. BENARD, A. DEBIEN, E. MOREAU - Time-Dependent Volume Force Produced by a Non-Thermal Plasma Actuator from Experimental Velocity Field. Journal of Physics D Applied Physics, Vol. 46, No. 24, 2013.[10] K. KOURTZANIDIS - Numerical Simulation of Plasma Actuators for Flow Control. 51st AIAA Aerospace Sciences Meeting, Texas, USA, 2013.[11] M. FORTE, J. JOLIBOIS, J. PONS, E. MOREAU, G. TOUCHARD, M. CAZALENS - Optimization of a Dielectric Barrier Discharge Actuator by Stationary and Non-Stationary Measurements of the Induced Flow Velocity: Application to Airflow Control. Experiments in Fluids, Vol. 43, No. 6, 2007, pp. 917-928.[12] A. REFLOCH, B. COURBET, A. MURRONE, P. VILLEDIEU, C. LAURENT, P. GILBANK, J. TROYES, L. TESSÉ, G. CHAINERAY, J.B. DARGAUD, E. QUÉMERAIS, F. VUILLOT - CEDRE Software. Aerospace Lab Journal Issue 2 - March 2011[13] J.C. MATEO-VELEZ - Modélisation et simulation numérique de la génération de plasma dans les décharges couronnes et de son interaction avec l'aérodynamique. PhD. Thesis, Université Toulouse III, France, 2006.[14] A.V. LIKHANSKII, M.N. SHNEIDER, S.O. MACHERET, R.B. MILES - Modeling of Dielectric Barrier Discharge Plasma Actuator in Air. Journal of Applied Physics, Vol. 103, 2008[15] D. BREDEN, K. MIKI, L.L. RAJA - Self-Consistent Two-Dimensional Modeling of Cold Atmospheric-Pressure Plasma Jets/Bullets. Plasma Sources Science and Technology, Vol. 21, 2012[16] A.V. LIKHANSKII, M.N. SHNEIDER, D.F. OPAITS, R.B. MILES, S.O. MACHERET - Numerical Modeling of DBD Plasma Actuators and the Induced Air Flow. 38th AIAA Plasmadynamics and Lasers Conference, Miami, june 2007[17] Y. LAGMICH - Diagnostic et modélisation d'une décharge à barrière diélectrique pour le contrôle d'écoulement. PhD. Thesis, Université Toulouse III, France, 2006.[18] R.J. LEVEQUE - Finite Volume Methods for Hyperbolic Problems. Cambridge University Press 2002.
Nomenclature
E Electric Field (V/m)Ug Gas velocity (m/s)F Frequency of the discharge (Hertz)V0 Voltage applied to the exposed electrodekB Boltzmann ConstantPIV Particle Image VelocimetryTe Electronic Temperature (K)vi Velocity of the species “i” (m/s)Vb Voltage breakdown of the air gap (Volt)
AUTHORS
François Rogier : Senior researcher, in charge of the Mathe-matical Modeling and Numerical Simulation (M2SN) research unit of the Department of Modeling and Information Processing at ONERA. He graduated from École Centrale de Paris in 1984 and he obtained his PhD in Applied Mathematics in 1989 at
Pierre et Marie Curie University. He joined ONERA in 1989 and has led the M2SN research unit since 2004. He has worked in many numerical analysis fields (domain decomposition methods, kinetic theory), as well as in plasma modeling, for more than ten years.
Guillaume Dufour is a researcher working in the Mathematical Modeling and Numerical Simulation (M2SN) research unit of the Department of Modeling and Information Processing at ONERA. He received the Agrégation (civil service competitive examination for positions in public education) in Mathematics
and the Magistère Degree from École Normale Superieure de Lyon, France, in 2001 and 2002 respectively. He obtained his PhD in Applied Mathematics from the University of Toulouse in 2005. Since 2006, he has been working at ONERA and is involved in research and development of mathematical models for plasmas, in both an atmospheric and space context. His research inte-rests include mathematical modeling and numerical analysis of fluid models for complex discrete systems, with applications to various areas of physics and informatics (aerodynamics, plasmas, networks, etc.).