numerical modeling of accretionary wedge mechanics ... · pdf filebarbados subduction zone...
TRANSCRIPT

JOURNAL OF GEOPHYSICAL RESEARCH, VOL. 94. NO. B7, PAGES 9323-9339, JULY 10, 1989
Numerical Modeling of Accretionary Wedge Mechanics' Application to the Barbados Subduction Problem
RONALDO I. BORJA
Department of Civil Engineering, Stanford University, Stanford, California
SHIRLEY J. DREISS
Department of Earth Science, University of California, Santa Cruz
The mechanisms for the development of accretionary prisms in subduction complexes is numerically simulated using finite element plasticity analysis and the Barbados problem as an example. The accreted and subducting sediments are modeled as elastoplastic continua separated by rigid-plastic contact elements to simulate the thrusting mechanism. Results of the analyses demonstrate the importance of both lateral compression and topographic slope in the development and propagation of accretionary prisms in the Barbados subduction complex, affirming the analytical theory on the mechanics of thin-skinned fold-and-thrust belts presented by Chappie [1978]. Numerical analyses also reveal that the shape of the accretionary prism requires a critical balance in material characteristics such as the frictional strength of the basal layer, the modulus of the d•collement, and the flow laws governing the yielding of the elastoplastic accretionary prism itself. Finally, it is shown that, unless the high normal stress at the base of the overriding plate is counteracted by a high fluid pressure localized in the d6collement region, the frictional component of the basal traction will make the horizontal propagation of accretionary prisms difficult.
INTRODUCTION
The objective of this paper is to demonstrate the impor- tance of lateral compression and topographic slope in the development and propagation of accretionary prisms in the Barbados subduction complex. Previous theoretical studies reveal opposing viewpoints as to which of the two factors plays a major role in the formation of accretionary wedges [Elliott, 1976; Chapple, 1978]. By fixing the basal strength of the wedge to essentially equal that of the wedge, Elliott [1976] concluded that the gravitational term dominated the horizontal push term. By explicitly allowing the basal strength to be very weak, however, Chapple [1978] con- cluded that the horizontal compression term dominated the gravity term, unless the basal strength approaches that of the wedge. In this paper, numerical solutions are obtained using the finite element method to demonstrate that, in support of Chapple's analytical conclusion, both lateral compression and topographic slope can play a major role in the develop- ment and propagation of thrust sheets.
The mechanical model employed for characterizing the Barbados subduction zone involves a wedge-shaped deform- ing region in which the back part is thicker than the toe of the thrusts, similar to those adopted by Chapple [1978] and Stockreal [1983]. However, unlike their models where the material had a constant strength, the present model allows for material strength and stiffness which both increase with the effective overburden stress. An essential feature of the
present model is the existence of a weak, shallow-dipping d•collement at which sliding and thrusting take place. In the development of accretionary prisms, the overthrusting layer is made to shorten and thicken. A prism is formed naturally
Copyright 1989 by the American Geophysical Union.
Paper number 89JB00341. 0148-0227/89/89JB-00341 $05.00
from the imposed boundary movements described in the mechanical model.
Recent theoretical studies suggest that the mechanics of accretionary wedges can be modeled analytically using the theory of plasticity [Hill, 1950], with appropriate solutions formulated either graphically, such as by the slip line method [Stockreal, 1983], or in closed form [Chappie, 1978; Davis et al., 1983; Dahlen et al., 1984; Zhao et al., 1986]. Such analytical solutions are constrained by the need to use simplistic assumptions such as perfect plasticity and thin- skinned wedges to overcome the difficulty of dealing with nonlinear materials and complicated two- and three- dimensional problem geometry. The finite element method is used in this study to incorporate complicated geometry and material nonlinearities that would otherwise make the devel-
opment of a general analytical solution impossibly difficult. The finite element solution employed in this study is based
on a continuum formulation. Material response is modeled using the theory of plasticity [Hill, 1950]. The accretionary prism in the Barbados subduction complex is modeled as a Drucker-Prager elastoplastic material whose yield stress is a linear function of the confining stress and whose strength parameters are as given by Marlow et al. [1984]. The highly sheared decollement is modeled as a weaker Drucker-Prager elastoplastic material overlying an undeformed underthrust- ing sediment [Moore et al., 1987], the base of which is assumed to move at an estimated rate of 20 mm/yr [Minster and Jordan, 1978]. The elastic stiffness of the accreted sediments is assumed to increase with increasing overburden stress.
To demonstrate the applicability of the mechanical model to other rheologies, a patch test is presented in which accretionary prisms are shown to develop on an elastoplastic material governed by the von Mises yield criterion with a bilinear hardening law. We show in this verification test that
9323

9324 BORJA AND DREISS' NUMERICAL MODELING OF WEDGE MECHANICS
IMBRICATE ,- 4 .uss /
•,----•.....__.• 74 , 675 675 /
X .......... t .... 2 ............... ••• ....... ........ 2•2Z•22• .... .• ................... - 6
r -- UNDER. RUST • SEDIMENTS
Fig. 1. Toe of Barbados Ridge Complex from seismic reflection data showing geometry of accretionary prism, d•collement, and underthrusting sediments and indicating sites of ODP Leg 110 and DSDP Leg 78A drill holes.
sliding is a necessary ingredient in modeling the develop- ment of an accretionary prism.
To simulate a "sliding" mechanism, contact elements are employed. These node-on-node elements allow the accreted sediments to slide in relation to the subducting layer. Theo- retical formulations are described which enable one to
specify a maximum basal traction obtained by applying the Mohr-Coulomb failure criterion in the contact element logic. It is shown that basal shearing resistance should be approx- imately uniform; otherwise any significant frictional resis- tance would make the development of accretionary wedges extremely difficult.
TECTONIC SETTING
The Barbados Ridge Complex is located east of the Lesser Antilles volcanic arc where Atlantic Ocean crust subducts
beneath the Carribean Plate. The rate of plate convergence has been estimated as 20 to 22 mm/yr [MacDonald and Holcombe, 1978; Minster and Jordan, 1978; Dorel, 1981; Tovish and Schubert, 1978] with one estimate as high as 40 mm/yr [Sykes et al., 1982].
A d6collement extends more than 100 km westward of the
deformation front and separates offscraped, deformed sedi- ments from a section of underthrust sediments (Figure 1). At the latitude of Ocean Drilling Project (ODP) Leg 110, ap- proximately two thirds of the 700-m section of incoming sediments are underthrust with the downgoing plate while one third is accreted into the prism [Biju-Duval et al., 1984]. The complex is dominated by fine-grained sediments with low intrinsic permeability [Marlow et al., 1984]. Cores recovered during ODP Leg 110 and Deep Sea Drilling Project (DSDP) Leg 78A drilling reveal several different lithologies [Wright, 1984]. Prism sediments consist predom- inantly of pelagic calcareous mudstones and hemipelagic clays. Seismic reflection profiles and core samples suggest that the prism is made up of fault-bounded packets of deformed, tectonically mixed sediments [Biju-Duval et al., 1984].
At Site 671 the d6collement is a zone, approximately 40 m thick, composed of lower Miocene radiolarian mudstones with a well-developed scaly fabric [Biju-Duval et al., 1984]. This zone correlates stratigraphically with sediments at Site 672, located 6 km seaward of the deformation front (Figure 1). Low-angle shear zones and normal and reverse faults at Site 672 suggest incipient seaward propagation of the d6collement within this stratigraphic unit [Moore et al., 1987]. Arcward of the deformation front, seismic reflection profiles indicate that the d6collement follows the same staffgraphic horizon for 12 km and then follows a deeper stratigraphic horizon arcward of Site 673.
MODEL FORMULATION
We formulate in this section a mechanical model to
examine the deformation pattern in the Barbados subduction complex based on the above setting, focusing on the major driving forces necessary to generate and propagate a prism. We refer to the profile shown in Figure 1 and consider the following mechanical model.
Model Description
The model used in this study is shown in Figure 2. The cross section in this figure is divided into three zones typical in the Barbados complex: (1) an elastoplastic accretionary wedge subjected to a significant amount of shortening and thickening represented by region A; (2) a highly sheared elastoplastic d•collement in which sliding and thrusting take place, represented by region B; and (3) an undeformed underthrusting sediment represented by region (2. Region B is considered essential in demonstrating that in addition to the strength of wedge materials, the wedge shape is also influenced by the d•collement's strength and stiffness. Re- gion (2 allows the displacements of the moving boundaries to be imposed via the "penalty method" described by Bathe [1982], enhancing quick convergence of the iterative solu- tion.
Relative plate movements can be imposed by allowing boundaries 1-2-3-4 in Figure 2 to move leftward (i.e., arcward in Barbados) in relation to the upper accreted sediments. Shortening of region A is achieved by fixing boundary 5-6 laterally with roller supports so that heaving is allowed and a prism is developed concurrently. In the context of wedge mechanics, boundary 5-6 is the backstop
FORWARD SLOPE
SUBDUCTION ANGLE
Fg Fh
Fig. 2. Mechanical model. Regions A, B, and C are modeled as elastoplastic continua. Region A is deformable, B is weak, and C is rigid. Displacements are imposed on boundary 1-2-3-4 at the rate of 20 mm/yr subducting at an angle of/3. Boundary 5-6 is fixed laterally with roller supports to simulate wedge formation. Sliding takes place across interface 5-2.
BORJA AND DREISS: NUMERICAL MODELING OF WEDGE MECHANICS 9325
which creates the bulldozing action of the overriding plate, representing a wedge portion where lateral movement essen- tially ceases [Barr and Dahlen, 1988]. Thrusting and sliding are simulated using "stick-slip" contact elements on the slip zone represented by the interface 5-2. Details of the contact theory employed are presented at the end of this section. A plane strain condition is assumed. Initial geometry and material nonlinearities can be varied in the mechanical
model, thus providing the versatility and solution accuracy not achievable with analytical models for simulating the motion of thrust sheets thus far presented in the literature.
Equilibrium Equations in Differential and Finite Element Forms
Consider the following nonlinear boundary value problem associated with the configuration shown in Figure 2. Let x be the position vector defining the coordinates of any point inside the total region shown, and let the gravity load and surface traction vectors be represented by f - f(x) and h = h(x), respectively. We seek the displacement vector u = u(x) such that the following differential equations of equilibrium are satisfied:
div •r(u)-f - 0 (1)
subject to the boundary conditions
u = ug (2)
on the boundary F g and
n ß o' = h (3)
on the boundary ['h, where •r is the Cauchy stress tensor, u•, is the prescribed displacement vector, h is the prescribed traction vector, n is the surface unit normal, and (Fg, ['h) are the problem boundaries. Using effective stresses throughout so that water pressures may be eliminated from the solution, f may be taken as the submerged unit weight vector, while the boundary ['h representing the bathymetric surface may be considered free of tractions (i.e., h = 0 on ['h). The prescribed displacement vector u,, may vary from point to point on the boundary Fg. At the base of the region shown in Figure 2, for example, u• defines the subduction movement, while at constrained surfaces, u•, (or some of its components) is zero.
The finite element matrix counterpart of equations (1)-(3) may be derived using the standard lines of variational formulation [see Zienkiewicz, 1977]. Dividing the region in Figure 2 into finite elements, the resulting nonlinear matrix equations can be written as
FisT(d, •1) - FEXT = 0 (4)
where FiN T is the internal nodal force vector representing the nodal forces equivalent to the internal stresses •r, FEXT is the external nodal force vector equivalent to the gravity loads, d is the unknown nodal displacement vector, and • is the prescribed nodal displacement vector consistent with any imposed boundary restraints or subduction movements. The solution of equation (4) corresponds to the evolution of d for a given imposed subduction movement • at any time t. This matrix equation can be solved iteratively by the New- ton-Raphson method described in Appendix A.
In addition to equations (1)-(3), the solution of the above boundary value problem should satisfy a constitutive equa-
tion characterizing the mathematical response of the subject material to imposed movements. In equivalent terms, we seek the evolution of stresses •r = •e) corresponding to given strains e = e(t) consistent with a given rheological model used in defining the response of the material.
Plasticity Models
In this paper we consider two fundamental plasticity models widely used in finite element applications to describe the constitutive behavior of the accreted and subducting materials: the Drucker-Prager and Von Mises plasticity models. The choice of these simple models over more complicated models is justified by the fact that (1) laboratory and field test data are scarce and inadequate to provide the large number of material parameters usually required with more sophisticated constitutive models and (2) whatever advantages more.complicated models can provide are offset by the uncertainties involved in extrapolating test data to soil response at greater depths (in Discovery 109, for example [Moore et al., 1987], seismic reflection tests indicated that deformable sediments extend to subbottom depths of around 1 km, whereas test data reported by Marlow et al. [1984] are representative of samples only to subbottom depths of 160 m and shallower). We shall describe the essential features of these plasticity models from a computational (as opposed to analytical) standpoint.
Drucker-Prager model. The Drucker-Prager model is a plasticity model capable of automatically generating higher- yield stresses and stiffness at greater overburden stresses. Let •r denote the Cauchy stress tensor, I is the rank two-unit tensor with components 10. = •o (the Kronecker delta),
I
p -- x tr •r is the mean normal effective stress (the symbol tr denotes a trace operator such that tr •r = •r,), • = •r - pl is the deviatoric part of •r, c is the soil's cohesion, & is the soil's friction angle, and assume a perfectly plastic (nonhard- ening) Drucker-Prager material. The Drucker-Prager crite- rion is defined by the yield surface
• -- •(•, P) = IIl- (2/3)l/2K(P) = 0 (5)
where
6
•<(P) = 3 - sin & (c cos & + p sin &) (6) is the size of the yield surface corresponding to the mean effective stress p and the double vertical symbols denote a tensor norm (i.e., II•l = scosc0-). Equation (5) defines a circular cone centered about the hydrostatic p axis in the stress space (see Figure 3).
Von Mises model. Without committing ourselves to the Drucker-Prager yield criterion to demonstrate the applica- bility of the proposed model, we next consider another yield criterion represented by the pressure-independent Von Mises model. The Von Mises yield criterion is defined by the yield surface
- -IIl- (2/3)1/2(6-0 + H'gP) = 0 (7)
where 6-0 is the uniaxial yield stress, k p is the effective plastic strain, H' is the hardening parameter [see Hill, 1950], and all other symbols are as previously decribed in equations (5) and (6). Equation (7) defines a circular cylinder centered about the hydrostatic p axis in the stress space (see Figure

9326 BOPUA AND DREISS: NUMERICAL MODELING OF WEDGE MECHANICS
HYDROSTATIC AXIS
2 3
STRESS SPACE
Fig. 3. Stress integration algorithm for the Drucker-Prager model. An elastic stress predictor is represented by the stress vector 1-2; an associative flow rule returns the trial stress at 2 to the yield surface at 3; a nonassociative flow rule returns 2 deviatorically to the yield surface at 4.
4). This yield model, with H' = 0 or perfect plasticity, has previously been used either graphically or analytically by a number of investigators to mathematically describe the subduction phenomena based on plasticity concepts [Chap- ple, 1978; Stockmal, 1983].
Algorithmic details of the above models for implementa- tion into a finite element program are presented in Appendix B.
Contact Elements
The use of contact elements for simulating the sliding mechanism in Barbados offers a desirable feature in that
known oceanic crustal movements can be imposed while allowing the solution to determine if a prescribed available basal shearing traction in the d6collement zone can be
developed. Thus one can investigate the order of magnim,de of the available basal shear strength in relation to the
HYDROSTATIC AXIS
,5,
i ,,y I /Y ,"-'%.
/ ,-'
.,5/I .x'
.//:----.1% ,' ,.:( l'-'v,: /-'
// •\ I. / 'xx. /./'
Fig. 4. Stress integration algorithm for the Von Mises model. An elastic stress predictor is represented by the stress vector 1-2; the yield surface is allowed to expand during this time step, and the stress point at 2 is brought back "radially" to the yield surface at 3.
n
XB +dB m• SLIP PLANE
Fig. 5. Geometric representation of a node-on-node contact element A-B. The coordinates of nodes A and B were originally identical. The normal separation is 8 while the tangential relative movement is y. Specifying k,, >> 1 forces B to lie on the contact plane.
strength of accreted sediments at the same depth, for wedges of known shapes to form.
Contact stress problems occur in a variety of mechanical and geotechnical engineering problems such as in the design of pistons, valves, and mechanical bearings, and the analysis of soil-structure interaction problems and are not new to finite element (FE) numericists [Johnson, 1985; Hartnett, 1980; Francavilla and Zienkiewicz, 1975; Hughes et al., 1976; Hughes and Prevost, 1979; Pascoe and Mottershead, 1988; Desai, 1987]. However, depending on the nature of the problem to be solved, specific treatment is appropriate if the contact theory is to be applied successfully.
To allow finite elements to slide as they are thrusted, inequality constraints are imposed via node-on-node contact elements, thus allowing nodal separation to take place. A typical contact element is defined by nodes A and B in Figure 5, two directional spring constants k n and k t called penalty parameters, and a prescribed unit vector n assumed to lie perpendicular to the contact plane. In two dimensions, n = {n j, r/2}, while in three dimensions, n = {n•, n2, F/3}, where is the direction cosine of n with respect to the axis x i. Node A is always assumed to lie on the contact plane and is given by the current position vector x A + dA, where x A is the initial position vector and dA is the displacement vector. The present position of node B is given by x o + do, where xo denotes its initial position and do denotes the current dis- placement. See Figure 5 for a schematic representation of these position and kinematic vectors.
Let
1= xB +dB - XA -- dA (8)
be the relative displacement of node B with respect to node A. Then,
8: ! ß n (9)
is the normal component of the displacement of B relative to the contact plane. Defining
1- 8n
1- 8n- ym m = i1_ 8n (10) where --Ill - •nll is the tangential movement of B relative to A; then m is seen to represent a unit vector perpendicular
- BORJA AND DREISS' NUMERICAL MODELING OF WEDGE MECHANICS 9327
CONTACT ELEMENT: • NODES A AHD B HAVE THE
SAME COORDINATES • PRESCRIBED BOUNDARY MOVEMENT
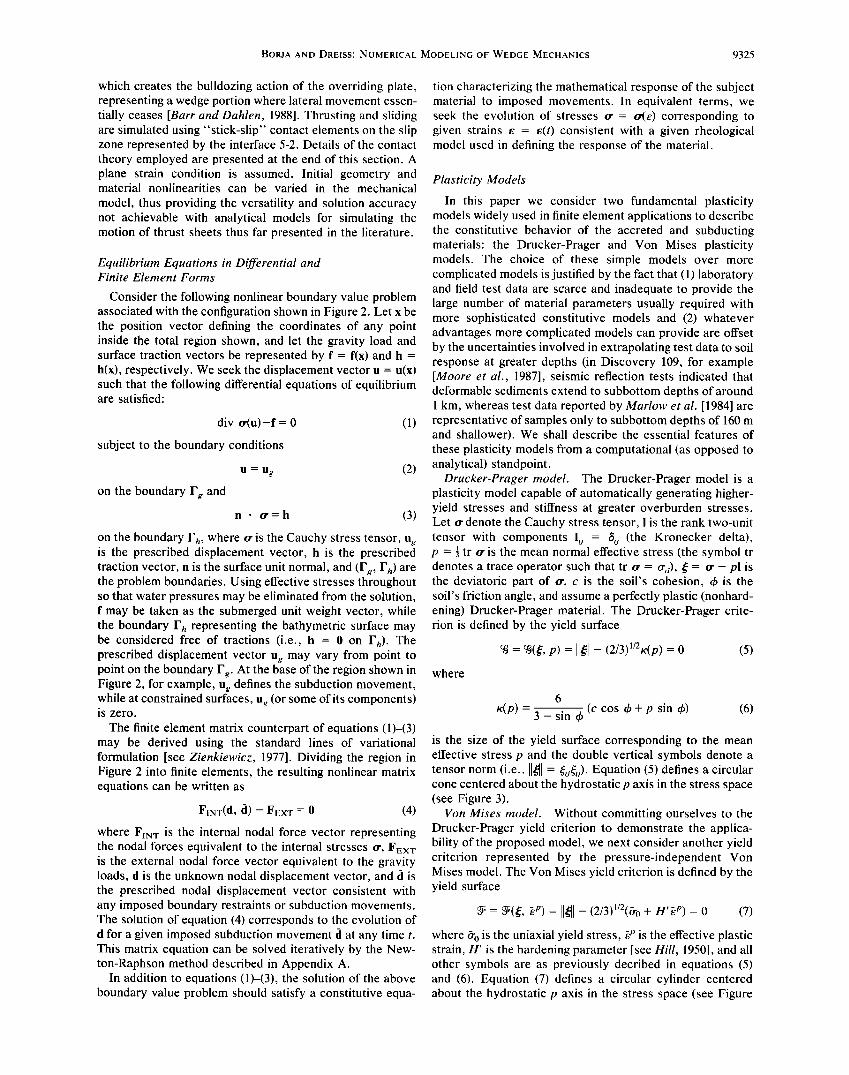
Fig. 6. Finite element mesh used for patch test: Von Mises model.
to n (and is therefore tangent to the contact plane in the projection of 1).
The internal force in a contact element has a component f, = k, 5 in the direction n and a component f, = kty in the direction m. By specifying large values of k,, and kt, the separations 5 and y can be made as small as the computer system permits. The contact logic is that when y is large enough to cause ft to reach a maximum threshold f,•ax, the contact elements will rip tangentially and adjacent elements will slide, thus allowing thrusting to take place.
In line with the failure strength criterion widely used in soil mechanics, we shall derive an expression for the param- eter fmax based on the Mohr-Coulomb failure criterion as follows. Let the interface sliding strength parameters be defined by the "cohesive force per unit length" c i and the friction angle &i, and assume a straight line failure envelope. The limiting sliding resistance is then obtained by
/max = cimi q-- knt• tan (•i (11)
where L i is the tributary length over which the normal contact force is k, 5. If the interface is divided into finite elements of the same lengths, then Li is the length of these elements. Detailed formulations as well as the algorithmic treatment of the above contact theory are presented in Appendix C.
The question of whether to position the slip zone above region B in Figure 2 (the d•collement), or below it, is a matter of personal choice. In reality, this distinct slip zone does not exist as a distinct plane but is instead a zone of soil remolding, shearing, and particle migration. We have chosen to locate the slip zone above the d•collement and allowed the accreted sediments to slide directly above it. This allows the FE program to internally determine the velocity of tangential separation at the slip zone as a function of the prescribed oceanic crustal movement.
PATCH TEST
We first illustrate the mechanical features of the model
described using a hypothetical example. Consider a "belt" with a constant initial thickness and yielding under compres- sion. The finite element mesh employed to model the prob- lem, shown in Figure 6, is composed of 10 overthrusting quadrilateral elements, 10 quadrilateral elements represent-
ling a weaker underthrust, and 11 node-on-node contact elements deforming in plane strain. The left-most vertical face of the overlying sediment is laterally fixed with two roller supports, while the right-most vertical face is assumed to move at the same rate as the base of the underthrust. Thus
the upper layer is forced to shorten and thicken in the analysis.
The overthrusting sediments are modeled as a Von Mises elastoplastic material with a bilinear hardening and possessing the following parameters: E = 10, t, = 0.4, H' = 10, and 6- 0 = 0.1 (consistent units are implied throughout). The underthrust is modeled as a weaker Von Mises elastoplastic material defined by the following parameters: E = 1.0, t, = 0.4, H' = 1 O, and 6-0 = 0.1. Contact elements are defined by the following spring constants: k n = l0 s, k t = 10 2. These values guarantee that the desired constraints are appropriately imposed. Sliding is assumed to take place when the tangential contact force reaches a constant value Offmax > 0, simulating a frictionless interface (•b• = 0). The convergence criteria employed in the solution are discussed in Appendix A.
A gravity load represented by a unit weight of 1.0 per unit volume is applied in full during the first time increment, and the displacement vector is reinitialized to zero thereafter. A total horizontal plate movement of 1.0 unit leftward was imposed in 10 steps on the moving boundaries. A separate analysis employing two load steps was also performed with results not differing by more than 5% from those obtained using a 10-step solution, demonstrating that the closest point stress integration procedure described in the preceding sec- tion results in a solution accuracy that does not significantly depend on the number of load steps employed. Considering that each time step will potentially require a significant number of iterations for convergence and may be expensive particularly when solving large-scale problems, this algorith- mic accuracy is extremely desirable from the computing standpoint, since one can use fewer time steps in the solution and still expect to obtain equally accurate results.
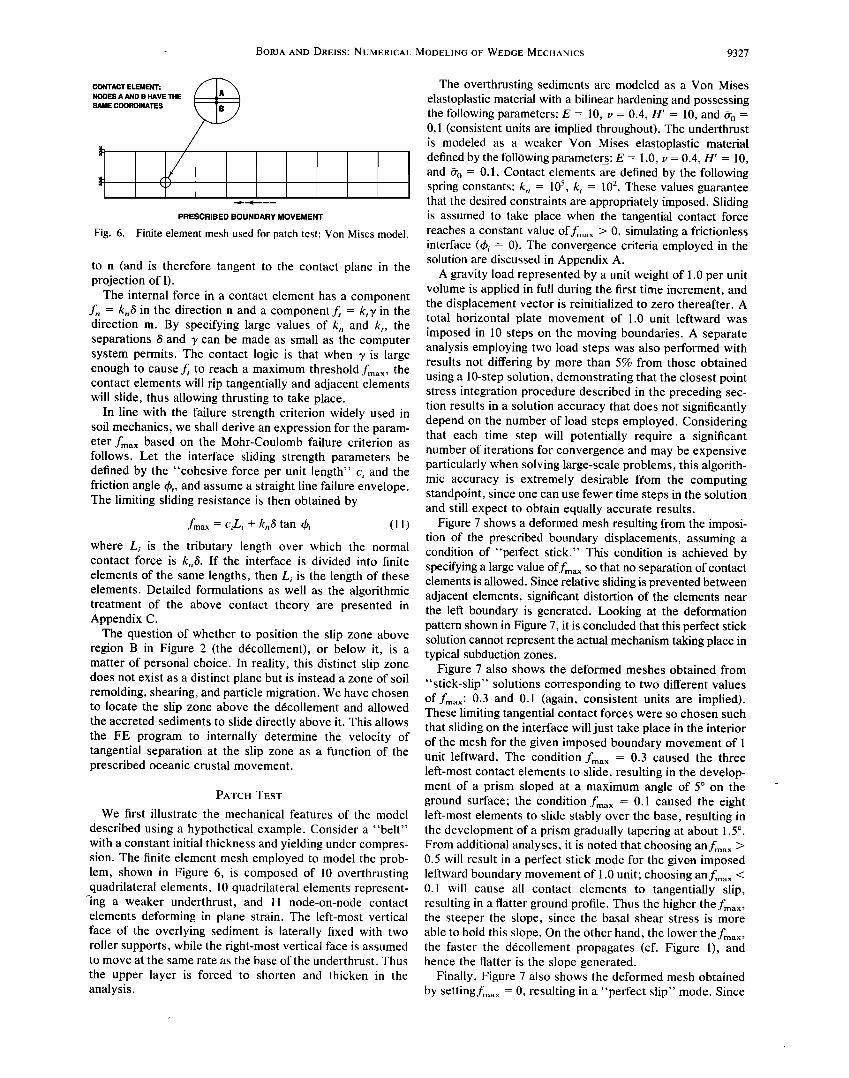
Figure 7 shows a deformed mesh resulting from the imposi- tion of the prescribed boundary displacements, assuming a condition of "perfect stick." This condition is achieved by specifying a large value Offmax SO that no separation of contact elements is allowed. Since relative sliding is prevented between adjacent elements, significant distortion of the elements near the left boundary is generated. Looking at the deformation pattern shown in Figure 7, it is concluded that this perfect stick solution cannot represent the actual mechanism taking place in typical subduction zones.
Figure 7 also shows the deformed meshes obtained from "stick-slip" solutions corresponding to two different values of fm•,x: 0.3 and 0.1 (again, consistent units are implied). These limiting tangential contact forces were so chosen such that sliding on the interface will just take place in the interior of the mesh for the given imposed boundary movement of 1 unit leftward. The condition fmax = 0.3 caused the three left-most contact elements to slide, resulting in the develop- ment of a prism sloped at a maximum angle of 5 ø on the ground surface; the condition fmax -- 0.1 caused the eight left-most elements to slide stably over the base, resulting in the development of a prism gradually tapering at about 1.5 ø. From additional analyses, it is noted that choosing an fmax > 0.5 will result in a perfect stick mode for the given imposed leftward boundary movement of 1.0 unit; choosing an fmax < 0.1 will cause all contact elements to tangentially slip, resulting in a flatter ground profile. Thus the higher the fmax, the steeper the slope, since the basal shear stress is more able to hold this slope. On the other hand, the lower the fmax, the faster the d6.collement propagates (cf. Figure 1), and hence the flatter is the slope generated.
Finally, Figure 7 also shows the deformed mesh obtained by settingfmax = 0, resulting in a "perfect slip" mode. Since
9328 BORJA AND DREISS: NUMERICAL MODELING OF WEDGE MECHANICS
PERFECT STICK: fmax >> 1 • 5o
/ / / / STICK-SLIP: fmax = 0.3
1.5 o . •
/ / / / / / / /
STICK-SLIP: fmax = 0.1
PERFECT SLIP: fmax = 0
Fig. 7. Deformed meshes for various values of the contact element parameterfmax. The higher the J .... the steeper is the slope; the lower the fmax, the faster the "d•collement" propagates, the flatter is the slope.
no tangential traction at the base is developed for this condition, the laterally compressed accreted sediments heaved uniformly owing to Poisson's ratio effects. Since a zero taper is contrary to observed shapes of accretionary wedges, a perfect slip mode cannot represent the true mechanism actually taking place in typical subduction zones either.
The fact that the resulting topography obtained from this numerical test is not flat for the condition fmax > 0 implies that basal shear stresses, produced by subduction of the underlying plate, are major driving forces for the deforma- tion within the wedge. The fact that the initial topography is flat and yet a prism is formed implies that lateral stresses play a major role in the development and propagation of a prism. In the next section we shall focus on a more realistic application of the above modeling technique and demon- strate that both lateral compression and topographic slope can be major driving forces for the generation of prisms.
APPLICATION TO BARBADOS
Applications of the above modeling technique to the Barba- dos Ridge Complex shows how we can estimate unknown
model parameters and interpret results based on known geo- metric features in this subduction zone. In the analyses, some model parameters were chosen a priori, particularly those obtained directly from laboratory tests. Parametric studies will focus on basal shearing tractions as they influence the shapes of accretionary wedges. For purposes of defining the initial geom- etry, we consider two initial finite element meshes: (1) a mesh consisting of initially rectangular elements to demonstrate how a prism begins to form and (2) a mesh consisting of initially wedge-shaped elements to demonstrate how a prism is hori- zontally propagated.
Physical Properties
Marlow et al. [1984] have reported the physical properties of sediment samples from the Lesser Antilles margin along the Barbados Ride Complex. These samples were cored from a subbottom depth of about 160 m at sites 541 and 542 from DSDP Leg 78A (Figure 1) and have been tested in the laboratory for compressibility and shear strength.
Table 1 summarizes the results of six one-dimensional
consolidation tests performed on samples from Leg 78A. Except for one sample cored from Section 543-17-5 at a
BORJA AND DREISS: NUMERICAL MODELING OF WEDGE MECHANICS 9329
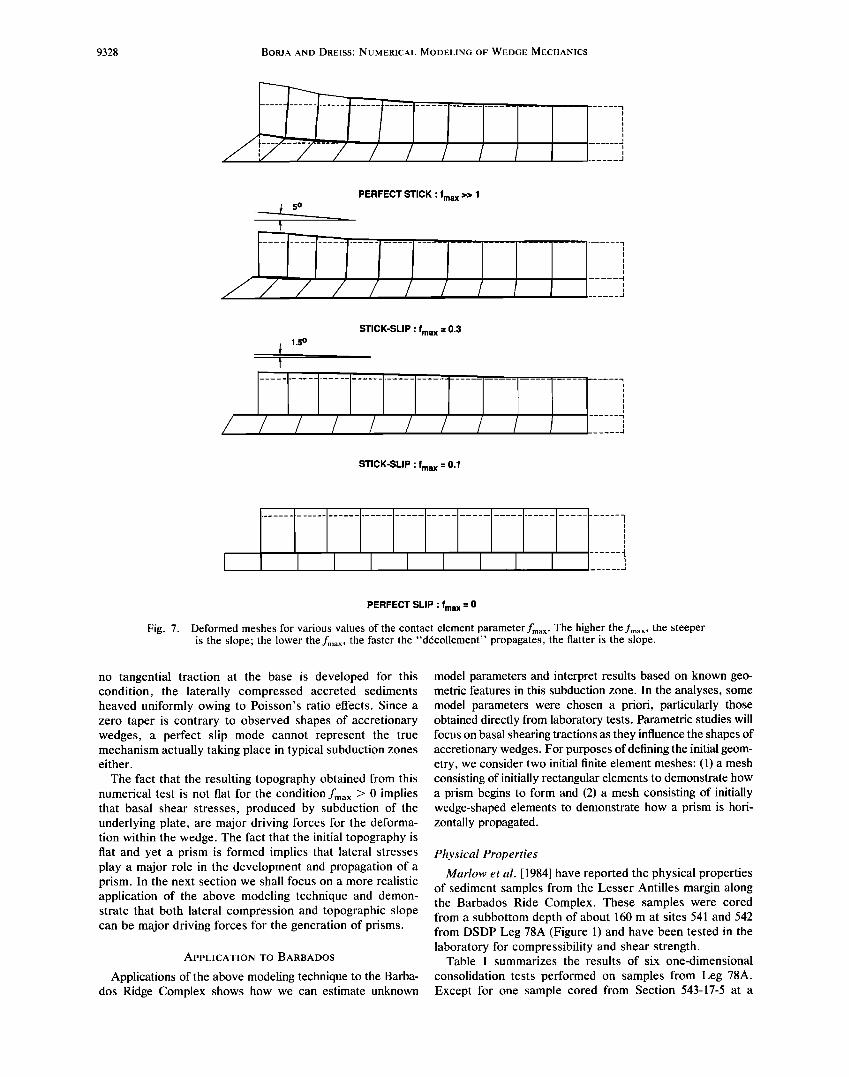
TABLE 1. Compressibility Properties
Section Subbottom
Depth, m
Effective Maximum
Overburden, Past Stress, Overconsolidation Compression kN/m 2 kN/m 2 Ratio Index Cc
Recompression/Swell Index Cr
541-3-3 15 70 160 2.28 0.53 0.08 541-7-5 55 340 310 0.91 0.87 0.09 541-11-3 90 583 410 0.70 0.52 0.07 541-15-4 129 880 520 0.59 0.42 0.05 543-12-4 112 599 450 0.75 0.90 0.12 543-17-5 160 813 520 0.64 2.24 0.16
Average Standard
deviation
0.91 0.10
0.62 0.04
From Marlow et al. [1984].
subbottom depth of 160 m which exhibited a slightly higher compression index Co, the compressibility of the soil sam- ples is generally uniform with depth with an average com- pression index value of 0.91. From the consolidation plots for cores recovered from the same sections, the average swelling-recompression index Cr was estimated to be around 0.10 with a (low) standard deviation of 0.04, suggesting that this index property is also uniform with depth. The uniform- ness of the compressibility of the soil in the wedge is further substantiated by sonic velocity tests conducted at Sites 541 and 542 which also reveal an extremely uniform compres- sional velocity downhole. Since both Cc and C,. are approx- imately constant with depth, it may be concluded that the sediment's stiffness is a linear function of depth or, equiva- lently, a linear function of the overburden stress [Roscoe and Burland, 1968; Ladd and Foott, 1974].
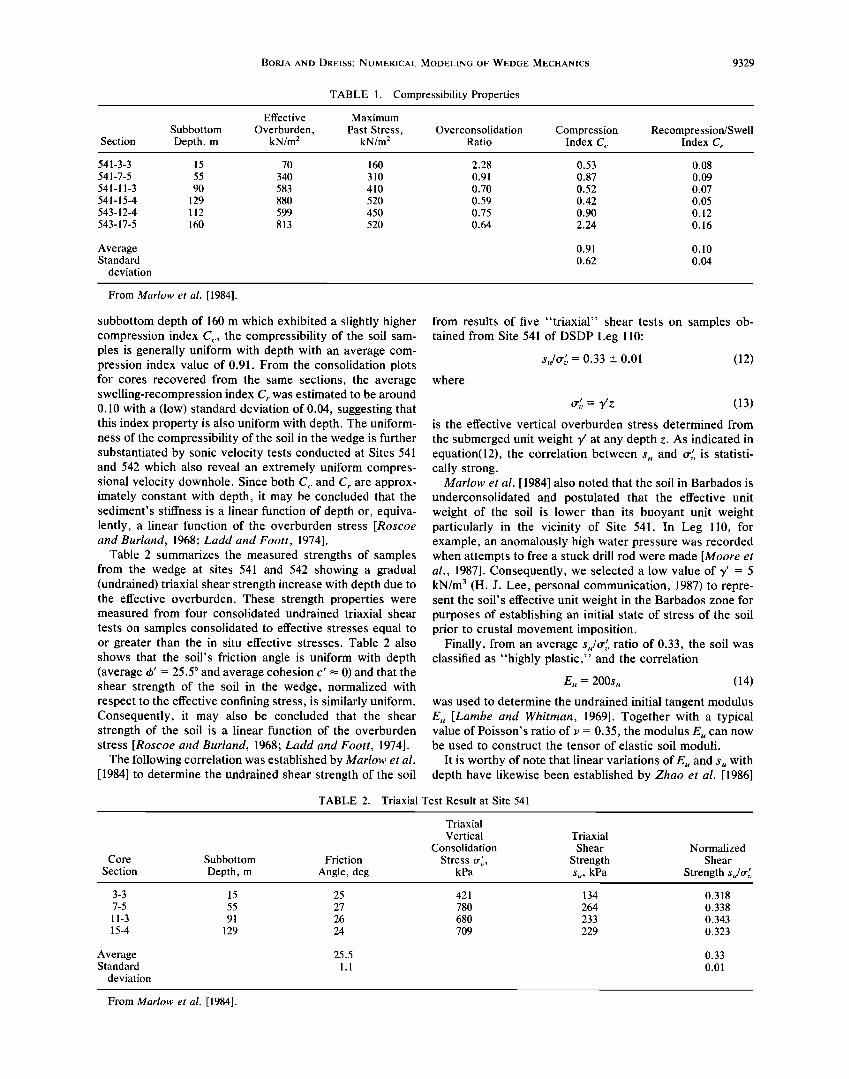
Table 2 summarizes the measured strengths of samples from the wedge at sites 541 and 542 showing a gradual (undrained) triaxial shear strength increase with depth due to the effective overburden. These strength properties were measured from four consolidated undrained triaxial shear
tests on samples consolidated to effective stresses equal to or greater than the in situ effective stresses. Table 2 also shows that the soil's friction angle is uniform with depth (average 4/ = 25.5 ø and average cohesion c' • 0) and that the shear strength of the soil in the wedge, normalized with respect to the effective confining stress, is similarly uniform. Consequently, it may also be concluded that the shear strength of the soil is a linear function of the overburden stress [Roscoe and Burland, 1968; Ladd and Foott, 1974].
The following correlation was established by Marlow et al. [1984] to determine the undrained shear strength of the soil
from results of five "triaxial" shear tests on samples ob- tained from Site 541 of DSDP Leg 110:
s•/•r6 = 0.33 + 0.01 (12)
where
y' rr•', = z (13)
is the effective vertical overburden stress determined from
the submerged unit weight y' at any depth z. As indicated in equation(12), the correlation between s, and •r•' is statisti- cally strong.
Marlow et al. [1984] also noted that the soil in Barbados is underconsolidated and postulated that the effective unit weight of the soil is lower than its buoyant unit weight particularly in the vicinity of Site 541. In Leg 110, for example, an anomalously high water pressure was recorded when attempts to free a stuck drill rod were made [Moore et al., 1987]. Consequently, we selected a low value of y' - 5 kN/m 3 (H. J. Lee, personal communication, 1987) to repre- sent the soil's effective unit weight in the Barbados zone for purposes of establishing an initial state of stress of the soil prior to crustal movement imposition.
Finally, from an average s,/rr•' ratio of 0.33, the soil was classified as "highly plastic," and the correlation
E,= 200su (14)
was used to determine the undrained initial tangent modulus E, [Lambe and Whitman, 1969]. Together with a typical value of Poisson's ratio of v = 0.35, the modulus E, can now be used to construct the tensor of elastic soil moduli.
It is worthy of note that linear variations of E, and s, with depth have likewise been established by Zhao et al. [1986]
TABLE 2. Triaxial Test Result at Site 541
Core
Section Subbottom
Depth, m Friction
Angle, deg
Triaxial Vertical
Consolidation
Stress rr•'•, kPa
Triaxial Shear
Strength s,, kPa
Normalized Shear
Strength
3-3
7-5
11-3
15-4
Average Standard
deviation
15
55
91
129
25
27
26
24
25.5
1.1
421
78O
680
7O9
134
264
233
229
0.318
0.338
0.343
0.323
0.33
0.01
From Marlow et al. [1984].
9330 BORJA AND DREISS: NUMERICAL MODELING OF WEDGE MECHANICS
OVERTHRUST
SLIP ZONE CONTACT ELEMENT
DECOLLEMENT
UNDERTHRUST
DRAWN TO SCALE:
I km
I •1
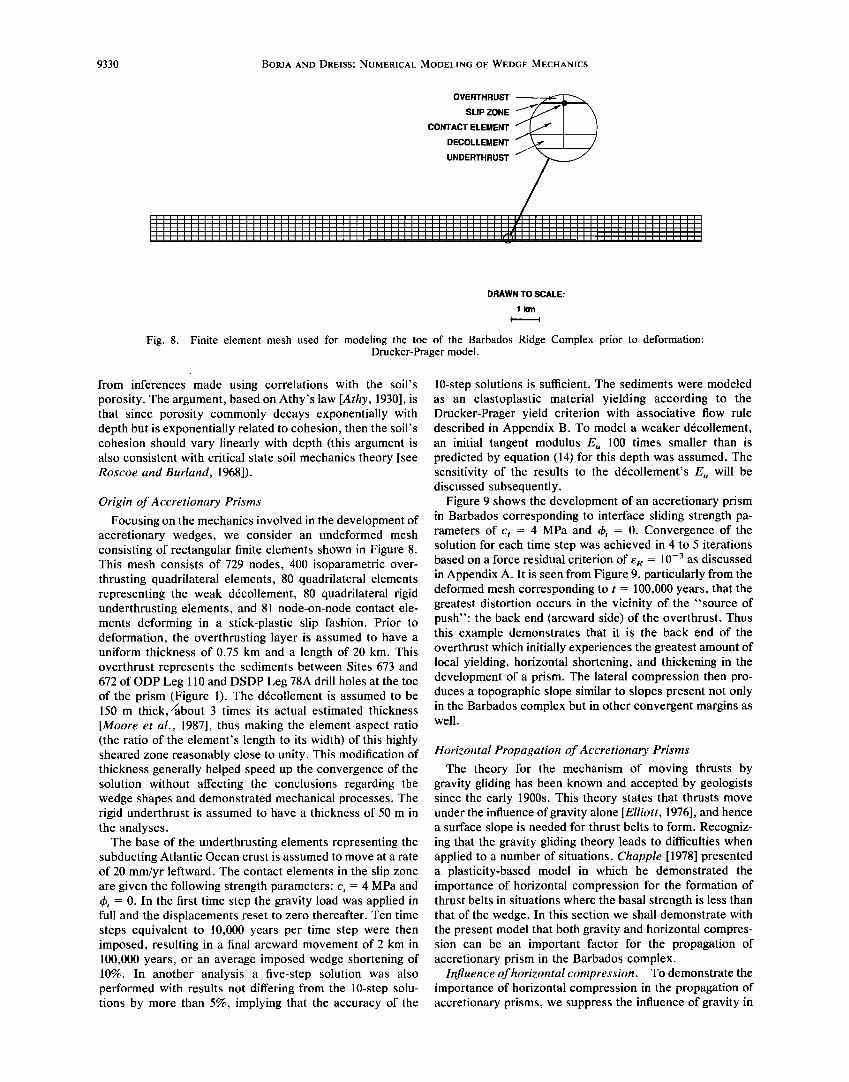
Fig. 8. Finite element mesh used for modeling the toe of the Barbados Ridge Complex prior to deformation: Drucker-Prager model.
from inferences made using correlations with the soil's porosity. The argument, based on Athy's law [Athy, 1930], is that since porosity commonly decays exponentially with depth but is exponentially related to cohesion, then the soil's cohesion should vary linearly with depth (this argument is also consistent with critical state soil mechanics theory [see Roscoe and Burland, 1968]).
Origin of Accretionary Prisms
Focusing on the mechanics involved in the development of accretionary wedges, we consider an undeformed mesh consisting of rectangular finite elements shown in Figure 8. This mesh consists of 729 nodes, 400 isoparametric over- thrusting quadrilateral elements, 80 quadrilateral elements representing the weak d6collement, 80 quadrilateral rigid underthrusting elements, and 81 node-on-node contact ele- ments deforming in a stick-plastic slip fashion. Prior to deformation, the overthrusting layer is assumed to have a uniform thickness of 0.75 km and a length of 20 km. This overthrust represents the sediments between Sites 673 and 672 of ODP Leg 110 and DSDP Leg 78A drill holes at the toe of the prism (Figure 1). The d6collement is assumed to be 150 m thick, /about 3 times its actual estimated thickness [Moore et al., 1987], thus making the element aspect ratio (the ratio of the element's length to its width) of this highly sheared zone reasonably close to unity. This modification of thickness generally helped speed up the convergence of the solution without affecting the conclusions regarding the wedge shapes and demonstrated mechanical processes. The rigid underthrust is assumed to have a thickness of 50 m in the analyses.
The base of the underthrusting elements representing the subducting Atlantic Ocean crust is assumed to move at a rate of 20 mm/yr leftward. The contact elements in the slip zone are given the following strength parameters: c i = 4 MPa and Oi = 0. In the first time step the gravity load was applied in full and the displacements reset to zero thereafter. Ten time steps equivalent to 10,000 years per time step were then imposed, resulting in a final arcward movement of 2 km in 100,000 years, or an average imposed wedge shortening of 10%. In another analysis a five-step solution was also performed with results not differing from the 10-step solu- tions by more than 5%, implying that the accuracy of the
10-step solutions is sufficient. The sediments were modeled as an elastoplastic material yielding according to the Drucker-Prager yield criterion with associative flow rule described in Appendix B. To model a weaker d6collement, an initial tangent modulus E, 100 times smaller than is predicted by equation (14) for this depth was assumed. The sensitivity of the results to the d•collement's E, will be discussed subsequently.
Figure 9 shows the development of an accretionary prism in Barbados corresponding to interface sliding strength pa- rameters of c i = 4 MPa and (hi = 0. Convergence of the solution for each time step was achieved in 4 to 5 iterations based on a force residual criterion of eR = 10 -3 as discussed in Appendix A. It is seen from Figure 9, particularly from the deformed mesh corresponding to t = 100,000 years, that the greatest distortion occurs in the vicinity of the "source of push": the back end (arcward side) of the overthrust. Thus this example demonstrates that it is the back end of the overthrust which initially experiences the greatest amount of local yielding, horizontal shortening, and thickening in the development of a prism. The lateral compression then pro- duces a topographic slope similar to slopes present not only in the Barbados complex but in other convergent margins as well.
Horizontal Propagation of Accretionary Prisms
The theory for the mechanism of moving thrusts by gravity gliding has been known and accepted by geologists since the early 1900s. This theory states that thrusts move under the influence of gravity alone [Elliott, 1976], and hence a surface slope is needed for thrust belts to form. Recogniz- ing that the gravity gliding theory leads to difficulties when applied to a number of situations, Chapple [1978] presented a plasticity-based model in which he demonstrated the importance of horizontal compression for the formation of thrust belts in situations where the basal strength is less than that of the wedge. In this section we shall demonstrate with the present model that both gravity and horizontal compres- sion can be an important factor for the propagation of accretionary prism in the Barbados complex.
Influence of horizontal compression. To demonstrate the importance of horizontal compression in the propagation of accretionary prisms, we suppress the influence of gravity in

BORJA AND DREISS: NUMERICAL MODELING OF WEDGE MECHANICS 9331
,,,,,ll•ll,,,[,,,[llllllltlllllrlll[tl[ll[[]lll[llt[•t[[,[, Illill
II1111111![1111111111 II IIIt]l]lllll!lJ•l•]l!lll]Jl!!!!!!!l
T=O
T = 25,000 YEARS
T = 50,000 YEARS
T = 75,000 YEARS
T = 100,000 YEARS
Fig. 9. Formation of accretionary prism with time. As thrusting takes place, the arcward side of the overthrust yields, shortens, and thickens, thus forming a wedge.
the solution by prescribing a zero initial topographic slope in the model (a = 0 in Figure 2). Consider an initially wedge- shaped mesh shown in Figure 10 consisting of 400 over- thrusting elements, 80 elements representing the weak d6- collement, 80 rigid underthrusting elements, and 81 node- on-node contact elements in plane strain. The subduction angle was assumed equal to/3 = 2 ø. The crustal movements were imposed and the results plotted in Figure 11 for various values of ci and 4•i at elapsed time t = 100,000 years.
Figure 11a shows the initial (undeformed) mesh used. Figure 1 lb shows the deformed mesh corresponding to ci = 20 MPa and 4•i = 0. Note that the basal resistance in this case is too low and the back end of the wedge too thick (and too
stiff) so that the horizontal compression-induced deforma- tion is concentrated primarily in the forward end, which is too thin (and is, therefore, too weak). Consequently, the horizontal constraint in the forward end (seaward side) caused the slumped soil in that end to form its own prism. We therefore conclude that the chosen interface strength parameters are too low for this configuration, causing the development of an unrealistic prism shape.
We next increase the sliding friction angle to 4•i = 1 ø and 2 ø while holding ci constant at 20 MPa. Figures 11c and 11d show that the strength of the thickened back end is now somewhat offset by the higher basal shear strength contrib- uted by the frictional component of the interface strength, so
OVERTHRUST
SLIP ZONE
CONTACT ELEMENT
DECOLLEMENT
UNDERTHRUST
INITIAL FORWARD SLOPE
-- • DRAWN TO SCALE:
SUBDUCTION ANGLE = 2 ø I km , ß
Fig. 10. Wedge-shaped FE mesh used for modeling the toe of the Barbados Ridge Complex. A zero initial topographic slope is assumed to demonstrate the importance of lateral compression in the horizontal propagation of accretionary prism.

9332 BORJA AND DREISS: NUMERICAL MODELINt OF WEDGE MECHANICS
(a) INITIAL CONDITION
(b) c i = 20 MPa; •)i = 0
(c) c i = 20 MPa; •)i = lO
(d) c i = 20 MPa; •)i = 20
Fig. 11. Deformed meshes at elapsed time T = 100,000 years demonstrating the capability of lateral compression to propagate an accretionary prism. Note that the resulting prism shape depends significantly on the "shear strength" of the contact elements.
that a smooth, convex topographic slope is eventually formed in Figure 11d for ci = 20 MPa and (3i = 2 ø.
In summary, this section demonstrates that lateral com- pression can be transmitted at significant horizontal dis- tances within a wedge and can even move a mass of earth "up" the basal slope (in this example, /3 = 2 ø) even in the absence of an initial topographic slope.
Influence of topographic slope. In order to demonstrate the importance of topographic slopes in the propagation of accretionary prisms, two meshes of the same dimensions were considered: the first with an initial forward slope of a = 0 and the second with an initial forward slope of a = 2 ø. We enforce the condition that a + /3 = const, so that the effect of horizontal compression will be the same for these two meshes, thus focusing our attention on the sole effect of surface topography. Consequently, we choose the following subduction angles:/3 = 2 ø for the first mesh and/3 = 0 for the second.
Figure 12a shows the initial finite element mesh. Figure 12b represents the deformed mesh, after 100,000 years, corresponding to the first case in which a = 0 and/3 = 2 ø, assuming that ci = 20 MPa and (3i = 2ø (this figure is identical to Figure 11d). Using the same material parameters but increasing the forward slope to a = 2 ø, Figure 12c shows a resulting topography significantly different from that shown in Figure 12b and characterized by gravity-assisted soil slumping in the forward end of the mesh. This slumping in the forward end is due to higher driving forces, which now include the gravity component derived from the topographic slope, which are much too high for the now seemingly weakened base to carry. Holding the initial topographic slope constant and increasing the friction angle to (3i = 3ø and 3.5 ø (Figures 12d-12e), the higher driving forces are now gradually offset by correspondingly higher available basal tractions, so that at (3i - 3.5ø, the wedge thus formed again shows the convex shape typical in Barbados.
The question of whether the topographic slope is first formed by lateral compression or whether lateral compres-
sion is a result of an initial topographic slope in the formation and propagation of thrust sheets is a chicken-and-egg issue and will not be resolved in this paper. However, what is important is to note that results of the above analyses show that both factors influence the shape of accretionary prisms significantly once the wedge has formed.
On the Frictional Behavior of Contact Elements
It is of interest to investigate what the shape of the prism would be like if the basal layer is treated as a frictional, rather than plastic, material. It is also of interest to study the influence of the ddcollement's stiffness on the shape of the resulting prism. To this end, we again consider the mesh of Figure 12a with a = 2 ø and /3 = 0 and now assume a ddcollement stiffness E, 10 times smaller than is given by equation (14) for a given depth (note that this modulus is now 10 times larger than what was used previously). Figure 13a shows the initial mesh. Plugging in the values for the interface friction angle of (3i = 4ø, 5ø, and 6 ø, the results are plotted in Figures 13b-13d. Observe that the prism of Figure 13b ((3• = 4ø) resembles the shape of the prism of Figure 12d ((3• = 3 ø) more closely than it does the prism of Figure 12e ((3• = 3.5ø), suggesting that the shape of the prism requires a critical balance in material characteristics (in this case, the variables are (3• and the ddcollement's E,,) and does not depend on the values of c• and 4•i alone.
Figures 13c and 13d demonstrate that the wedge shape of the accretionary prism does little to horizontally transmit compressive forces when the material behavior at the base becomes increasingly frictional in character. Notice that for •b• = 6 ø, for example, wedge distortion is concentrated near the backstop, with the "deformation front" remaining es- sentially undeformed. In this example the basal cohesion is assumed to be fixed at c i = 20 MPa and sensitivity analyses were performed, with the interface friction angle 4•i taken as the free variable. Looking at these figures, it is concluded that the probable friction angle for the cohesive-frictional base of the Barbados prism cannot exceed 5 ø .

BORJA AND DREISS: NUMERICAL MODELING OF WEDGE MECHANICS 9333
(a) INITIAL CONDITION
(b) c: = O; J• = 2ø; c i = 20 MPa; (I) i = 2 ø
(c) c: = 2ø; J• = O; c i = 20 MPa; •i = 2ø
(d) a = 2ø; [• =0; c i = 20 MPa; •i = 3ø
(e) a = 2ø; I•= O; c i= 20 MPa; •i = 3'5ø
Fig. 12. Deformed meshes at elapsed time T = 100,000 years demonstrating the importance of topographic slope in the horizontal propagation of an accretionary prism. Again, note that the resulting prism shape depends significantly on the "shear strength" of the contact elements.
A more significant observation can be gleaned from Fig- ures 14a-14c, which show the resulting prism shapes corre- sponding to a purely frictional base (ci = 0), assuming that a - 2 ø and/3 - 0. In this example the wedge is assumed to slide directly above a rigid substrate so that previous ana- lytical results [Chappie, 1978; Davis et al., 1983; Dahlen et al., 1984] can be numerically tested. Figure 14a shows that a
friction angle of 6i = 5ø is now too low for a realistic wedge shape to form, since ci was set to zero (compare Figure 13c). Increasing the basal friction angle to (•i -- 7'5ø to offset the loss of the interface cohesive strength results in the convex prism of Figure 14b typical in Barbados. However, Figure 14c shows that increasing the friction angle further to (•i = 8.5 ø would again inhibit the transmission of horizontal com-
(a) INITIAL CONDITION
(b) •i = 40
(c) (•i = 5ø
(d) •i =60
Fig. 13. Deformed meshes at elapsed time T = 100,000 years showing the resulting prism shapes corresponding to probable interface friction angle values of 4 ø, 5 ø, and 6 ø in the Barbados Complex. The initial mesh has a = 2 ø,/3 = 0; the assumed cohesion of the contact elements is ci = 20 MPa.

9334 BORJA AND DREISS: NUMERICAL MODELING OF WEDGE MECHANICS
(8) •i:5 ø
(b) (•i = 7'50
(c) (Di = 8'5ø
Fig. 14. Deformed meshes at elapsed time T = 100,000 years showing the resulting prism shapes corresponding to interface friction angle values of 5 ø, 7.5 ø, and 8.5 ø for cohesionless contact elements.
pressive stresses. Clearly, this example shows that Byedee's law [Byedee, 1978], which is central to the analytical results of Davis et al. [1983] and Dahlen et al. [1984], is not consistent with the observed numerical results. Thus it is
concluded from these analyses that unless the high normal stresses at the base of the thick end, which produces a high frictional resistance, is counteracted by a high fluid pressure localized in the ddcollement region [Hubbert and Rubey, 1959; Zhao et al., 1986; Shi and Wang, 1988], a purely frictional basal traction in the context of Byedee [1978] will make the horizontal propagation of accretionary prisms difficult.
Other Factors Affecting the Prism Shape
In general, the accretionary prism shape is influenced by a number of other factors not mentioned previously. Previous
analyses also suggest the dependence of the prism shape upon the flow rule used to define plastic strains. Recall that the associative flow rule on the Drucker-Prager cone was used in previous discussions to evaluate the plastic strain rate tensor. In general, this flow rule often predicts excessive dilatancy when used in conjunction with the Drucker-Prager model. To correct excessive dilatancy inherent in this model, a nonassociative flow rule is often employed. An example of a nonassociative flow rule is provided by a model where the yield surface is defined by the Drucker-Prager cone while the plastic potential is defined by the Von Mises cylinder. This nonassociative model, which we will use for comparison purposes in this section, is described further in Appendix B.
To illustrate the dependence of the prism shape on the flow rule, we consider a mesh shown in Figure 15a having a
(a) INITIAL CONDITION
(b) ASSOCIATIVE FLOW
(c) NON-ASSOCIATIVE FLOW, NO UNDERPLATING
(d) NON-ASSOCIATIVE FLOW, UNDERPLATING
Fig. 15. Deformed meshes at elapsed time T = 100,000 years demonstrating the influence on the shape of the accretionary prism of (1) flow laws used in conjunction with the Drucker-Prager model and (2) underplating.
BORJA AND DREISS: NUMERICAL MODELING OF WEDGE MECHANICS 9335
forward slope of a = 0 and an underthrust subducting angle of/3 - 2 ø. Setting ci = 20 MPa and •b = 2 ø for the contact elements, basal movements corresponding to t - 100,000 years were again imposed. Figure 15b shows the resulting prism shape assuming an associative flow rule on the Drucker-Prager cone, while Figure 15c shows the equivalent prism corresponding to the nonassociative model discussed in Appendix B. Both analyses resulted in a convex prism shape, although the prism of Figure 15b shows greater convexity in some local regions due to material dilatancy.
Another factor not explicitly treated thus far in the pro- posed model is underplating, or the addition of crustal materials in the overriding plate from the subducted plate before they reach mantle depths. Underplating can be incor- porated in the model by imposing a component of movement normal to the base of the wedge [Stockmal, 1983]. This is illustrated in Figure 15d, which shows the resulting prism when a perfectly horizontal leftward movement was imposed at the base of a subducting plate tilted at/3 = 2 ø relative to the horizontal (the wedge material is assumed to obey the nonassociative flow rule of Appendix B in this analysis). For comparison, the final position of the base of the subducted plate is denoted by the dashed line in Figure 15d if it is allowed to move parallel to itself. Comparing Figures 15b and 15d, it can be seen that, although the prism shapes are not identical, the use of the associative flow rule tends to correct the underplating process ignored in previous analyses.
SUMMARY AND CONCLUSIONS
A mathematical model describing the mechanics of wedge formation in the Barbados subduction complex by the finite element method has been presented. The characteristics of the model include an upper layer laterally compressed and thrusted over a weak basal layer. Sliding of the thrust over the weak base is modeled using stick-plastic slip node- on-node contact elements. The continua are characterized
using plasticity concepts. Results of the numerical analyses for the Barbados problem indicate the following:
1. In support of Chapple's [1978] theory, horizontal compression plays a major role in the formation of a prism. A prism is formed when the back end is pushed laterally causing this part of the thrust to yield, shorten, and thicken.
2. Lateral forces within a prism can be transmitted across horizontal distances many times its thickness. Hori- zontal propagation of accretionary prisms is effected both by horizontal compression and topographic slope.
3. Computer runs reveal that the probable basal shear stresses in Barbados obtained from parametric studies at subbottom depths of about 0.5-1.0 km are of the order of 4 to 20 MPa. The yield strengths of the contact elements are about 25-80% of the yield stress of the prism at the same depth. Since the yield stresses in the prism are computed based on the Drucker-Prager yield criterion and since the Drucker-Prager cone may actually taper off at large values of confining stresses, the above yield stresses are overesti- mates and may be taken as upper bounds of the in situ yield stresses.
4. The frictional component of the basal resistance in the Barbados subduction complex makes the development of the prism extremely difficult. If there is any frictional strength available at the base, the friction angle cannot be greater than 8 ø .
5. Although the solutions presented herein were based primarily on the Drucker-Prager yield model with associa- tive flow rule for the constitutive characterization of thrust
sheets, it is not our intention to commit ourselves to any specific rheology in demonstrating the validity of the me- chanical model presented. This is the reason why the Von Mises model was used in the patch test. Any realistically valid constitutive model might result in the same general conclusions.
We close by pointing out the following limitations of the model presented:
1. The finite element solution employed in the analyses is based on a small deformation formulation. This implies that the geometry of the mesh is the same before and after deformation. Because the solution does not update the geometry of the mesh, a rectangular mesh was used to demonstrate the formation, and a wedge-shaped mesh was used to demonstrate the propagation of accretionary wedges. For a complete analysis demonstrating the se- quence of events in which the geometry of the mesh is updated and rigid-body rotations incorporated, a finite de- formation formulation must be employed [McMeeking and Rice, 1975; Malvern, 1969; Hughes, 1983]. This is the subject of another study now in progress.
2. The model requires that the location of the weak basal layer be specified a priori. In equivalent terms, material weaknesses are prescribed in the solution rather than tracked from a complicated process of material softening and remolding as would naturally occur. This is in line with the paper's objective to present a general trend rather than duplicate a case history.
3. The model presents the development and propagation of the prism at the toe of the complex. A more complete analysis, which involves the evolution of the entire prism on a regional scale, is still under investigation.
4. The model described herein was based on the assump- tion of full drainage. The significance of pore pressures in the buildup of prisms [see Shi and Wang, 1988; Wuthrich et al., 1987] is also under investigation and will be addressed in a separate paper.
APPENDIX A: SOLUTION OF NONLINEAR
FINITE ELEMENT EQUATIONS WITH IMPOSED DISPLACEMENTS
Consider the model shown in Figure 2. Here we consider a region, or domain, composed generally of nonlinear mate- rials and surrounded by well-defined boundaries. Some parts of the boundaries may be fixed and some parts moving at a prescribed velocity. The remaining parts represent the por- tion of the total boundaries where movements are unknown
and are to be computed from a set of simultaneous nonlinear equations. Let the domain of the problem be denoted as 12 and let this domain be divided into a mesh of subdomains or
finite elements. In the figure the nodal degrees of freedom are represented by the nodal displacements dn+• and •n+•, where d,+• is the vector of unknown nodal displacements and •,• is the vector of prescribed displacements measured at some future time station t,+ •. To illustrate the significance of these displacement vectors as applied to the Barbados problem, the vector •,+• may be considered as the accumu- lated movement of the underthrusting Atlantic Ocean Crust, while d,+• represents the resulting accumulated displace-

9336 BORJA AND DREISS: NUMERICAL MODELING OF WEDGE MECHANICS
ments of the overthrusting Carribean Plate relative to a fixed reference frame.
Imposing the condition of equilibrium, the finite element equations at time station tn+• can be written as
FINT(dn + 1, an + 1) - (FExT)n + 1 --- 0 (A1)
where 0 is a null vector, (FEXT)n+i is the vector of applied nodal forces (i.e., the gravity loads), and FiN t is the vector of internal nodal forces given by
FINT = ffi BT{O'n + 1} dD (A2) in which B is the strain-displacement transformation matrix and {•r,+ •} = {•r(d,+ •, •, •)} is the vector of internal stresses resulting from the imposed total displacement a,+• and the accompanying movement d, •. In general, a residual vector represented by the left-hand side of equation (A1) will always be formed from the process of instantaneously im- posing the incremental displacements d,• -dn at discrete time steps At = t,• - t, This can be gleaned from equation (A1) by noting that (FExT), • representing gravity loads is constant at any time instant t,•, while FiN T will instanta- neously vary as soon as the incremental displacements are imposed. At any iteration stage denoted by the counter k, therefore, the residual vector is given by
rk= FINT(d/'• + 1' •n + 1)- (FEXT)n + 1 (A3) We now seek the solution of equation (A3) that drives the residual vector r k to zero, and this we accomplish iteratively by performing the following procedure.
Linearizing equation (A1) yields
, k •n 1) Adk (FEXT)n +1 -- FINT(d/'• +1 •n + 1) - FINT(dn + l, + = , (A4)
where •' is the kth estimate to dn+ •, Ad •' is the k search dn+l direction for the solution vector d,,+•, and FiN T is the JacobJan matrix defined by
, k an )= fn B rCB dO., (A5) FINT(dn + •, +l
numerically accurate and stable, is based on the notion of operator splitting [Krieg and Key, 1976; Simo and Taylor, 1985] and is a variant of the radial return algorithm proposed by Wilkins [ 1964]. In concise form, the incremental evolution of stresses can be written as
tr _ce . (AE/•n ) (B1) ø'n+l = ø'n+l +1
where tr = •r,, + ce'zx..• is the trial stress tensor o'jj+ i
representing an elastic stress predictor, •r. is the converged (Cauchy) stress tensor of the previous time step, •r.+• is the stress tensor corresponding to a future time instant t.+ •, c e is the tensor of elastic moduli, zXe.• is a given increment of strain tensor, and zX" is the tensor of incremental plastic En+ 1
strains. In equation (B 1) the colon denotes an inner tensor P if the elastic stress predictor product while (Aen+ •) = Ae,p,+ •
tr goes beyond the elastic region defined by the appro- o';•+ 1
priate yield surface in the stress space; otherwise, (Ae,p,+ • = 0, indicating an elastic process. This incremental technique for updating stresses is composed of two parts' (1) an elastic stress predictor represented by t• and (2) if the appro- O'•+ 1,
priate yield criterion is violated, a return to the yield surface via the tensor c • ß Ae,P,+• to satisfy the consistency condition [Owen and Hinton, 1980]. Specific applications to yield criteria considered in this paper are described below.
Von Mises Model
1 ptr tr Let p = • tr •r,+• = « tr s t = •r,, - pl, and , 0'•+ 1, +1
•tr = tr • , o';,+l -- ptrl, where the symbol 'tr' again denotes a trace operator, the stress integration equation for the Von Mises yield model is described by the incremental equations
p = ptr (B2)
s• : • - 2•A yP (B3)
where/x is the elastic shear modulus, A• is a consistency parameter determined by substituting (B2) and (B3) in the yield equation (7), • = •, and • = sc0.sc0.. Equations (B2) and (B3) coincide with the radial return stress integra- tion algorithm proposed by Wilkins [ 1964] and is represented graphically by the stress path 1-2-3 in Figure 4.
and where
0{O•+ 1} C = O{Ei• + 1} (A6)
is the material stress-strain matrix, with {e,•+ l} representing the strain vector. Applying Newton's method, the next estimate of d,,+• is computed from the formula
, k 8.)] - lr/' dn • +l = dt• +1 --[FINT(dn +1 +1 (h7) + •
Convergence is said to have been achieved when the mag- nitude of the residual vector reaches a certain maximum
error tolerance, i.e.,
r • :(r•+r•+ ß ß ß +r,2.) '/2<e•r ø (A8) where IIr•ll is the length of the vector r • and e• is a small number. In the analyses, the value e• = 10 -3 was used.
APPENDIX B' STRESS INTEGRATION FOR
RATE-INDEPENDENT ELASTOPLASTICITY
A procedure for integrating (or tracking the evolution of) stresses which has proved to be extremely simple, yet
Drucker-Prager Model With Associated Flow Law
The incremental stress evolution equations for the Drucker-Prager model with associative flow rule are
6K
p = ptr + 3 - sin 4> AyP (B4) IIl--IIg*rll- (us)
where K is the elastic bulk modulus, 4> is the soil's friction angle, and AT p is again the consistency parameter deter- mined by substituting (B4) and (B5) in the yield equation (5). The stress path 1-2-3 for this incremental constitutive equa- tion is shown schematically in Figure 3. The above model is applicable to frictional, dilatant materials.
Drucker-Prager Model With a Deviatoric Flow Rule
This model uses the Drucker-Prager cone to define the yield criterion and the Von Mises cylinder to define the plastic potential. The resulting incremental equations are
p = ptr (B6)
BORJA AND DREISS: NUMERICAL MODELING OF WEDGE MECHANICS 9337
IIl: IItrll- (g7)
where A3/p is the consistency parameter determined by using the yield equation (5). The return path corresponding to equation (B7) is a line perpendicular to the hydrostatic axis represented by stress path 2-4 in Figure 3. A nonassociative flow rule such as indicated in (B6) and (B7) tends to correct the often excessive dilatancy predicted by the normality rule in conjunction with the Drucker-Prager model.
Having obtained the pair of stresses p and II•l from any of the above models, the complete stress tensor is now written as
tr = pl + II•l a (g8)
where fi = •r/ll•rll is the unit tensor in the radial direction defined by •tr.
APPENDIX C: IMPLEMENTATION OF CONTACT
ELEMENTS IN A NONLINEAR FINITE
ELEMENT PROGRAM
The internal force contribution of the contact element
defined in Fig. 5 to the global finite element equations is
where
f- knrSn + ktTm (C2)
and where k,• is normal spring stiffness and k t is tangential spring stiffness. Note that neither k,, nor k t are unknowns; these spring constants are penalty parameters specified as a large number to impose a given constraint.
Let kn >> kt >> 1 in equation (C2). Typically, k, - 1000k t will suffice. Enforcing a large kn prevents either penetration or separation of adjacent finite elements across the mesh interface. The inequality k,>> k t forces the vector m to approximately become parallel to 1, since /5 << 3' for this condition. Thus only sliding can take place across the interface, and equation (C2) can be written as
f•kntSn + ktl (C3)
Specifying k t >> 1 implies a perfect stick mode, a condition in which neither normal separation (or penetration) nor tangential sliding can take place across the interface; speci- fying kt -- 0 implies a perfect slip mode, a condition in which a normal separation (or penetration) is prevented but tan- gential sliding is allowed freely. Assuming that k t >> 0 and that the quality ktTis bounded, we invoke a stick-slip logic in which a perfect stick mode is achieved when the tangential contact force kty < fmax, while a sliding mode is enforced when ktT --> fmax, with the tangential component of the contact force remaining at fmax in this "plastic stage." Thus for the plastic slip phase,
f = k,Sn + J[naxm (C4)
where m • l/lllll. Now, let d be the global displacement vector. For various
combinations of k• and kt, the possibilities that follow will arise.
Perfect Stick
Setting k,= k t • k in the expression for the internal nodal force vector results in
fleNT =-- k{ 1} -l (C5)
The tangent operator consistent with this internal nodal force vector is
ke 0f[NT [l,dAl,dB] = 0•= -k =k (C6) -- l,d A -- l,d•,] -- I where I is the nsa-dimensional identity matrix (nsa is the number of spatial dimensions) and where a comma denotes differentiation. If k >> 1, the global finite element equations will be dominated by the constraint
which is equivalent to imposing the condition Ad A • Ad•, thus achieving a condition of "perfect stick" (i.e., no separation is allowed to take place between nodes A and B).
Perfect Slip
We next consider the condition in which k t = 0. In this case the internal nodal force vector simplifies to
The tangent operator consistent with this internal nodal force vector is
k e 0liNT kn (C9) 0d - -
where the superscript t denotes a vector transposition. If k,, >> 1, the global matrix equation will be dominated by the constraint
- - [AdBJ --
and since • • 0 for k, >> 1, nodes A and B will be forced to lie on the contact plane but will be allowed to tangentially translate freely on this plane. Thus sliding, or a condition of "perfect slip," is achieved.
Stick Slip
Neither the perfect stick nor the perfect slip condition can simulate the mechanism taking place in subduction zones. A more realistic stick-slip model is provided by the following contact element logic:
Let k,, >> k t >> 1 in equation (C2), thus forcing the vector m to approximately become parallel to 1, since/5 << 3' for this condition. Thus equation (C2) can be written as
f • kniSn + ktl (C 11)
Specifying k t >> 1 implies a perfect stick mode; specifying k t = 0 implies a perfect slip mode. Assuming that k t >> 0 and that the quantity k t 3/is bounded, we invoke a stick-slip logic in which a perfect stick mode is achieved when the tangential contact force kt 3/< fm•x, while a sliding mode is enforced when k t 3/->f .... with the contact force remaining at fm•x in this "plastic stage." Thus for the plastic slip phase,
f = k, tSn + fmaxm (C12)

9338 BORJA AND DREISS: NUMERICAL MODELING OF WEDGE MECHANICS
1. Compute
2. If kt7 } < fmax, then stick mode:
3. If kt7 } _• fmax, then slip mode:
f} = k, 5}n + fm•xm and k e = k• + k•
Fig. C1. Stick-slip logic for the Barbados problem.
where m • viinil. The tangent operator consistent with this internal nodal force is
OflNT ke __ __ e e 0d kl + k2 (C13)
where
and
k•=k. _n - (C14)
k•=-fmax [ m,dA -- m,d A --
I - _fmax I - mm t -I + mm t -•- -I+mm t I-mm t (C15)
If k, >> fmax/Y, then k•. in equation (C13) may be ignored. The algorithm employed is shown in the flow chart of
Figure C 1. In Figure C 1 the superscript k refers to a counter for use with Newton-Raphson iterations, while d•A and d• represent the trial displacements of nodes A and B at the kth iteration phase. Note that the k, term (slip) is actually redundant when a perfect-stick mode is enforced and is therefore omitted in step 2 of the flow chart. Also note that this flow chart does not contain a provision for load reversal (reverse subduction), since plate movement is assumed to be monotonic in a fixed direction.
Acknowledgments. Financial support for these studies was pro- vided by the U.S. National Science Foundation under grant OCE- 8609745. The authors also wish to express their gratitude to Ilan Kroo of the Aero-Astro Department at Stanford University for providing us access to his microcomputer plotter. Constructive reviews of the first draft of this paper were provided by Sierd Cloetingh, Glen Stockmal, and Kevin Furlong which are gratefully acknowledged.
REFERENCES
Athy, L. F., Density, porosity, and compaction of sedimentary rocks, Am. Assoc. Pet. Geol. Bull., 14, 1-24, 1930.
Barr, T. D., and F. A. Dahlen, Thermodynamic efficiency of brittle frictional mountain building, Science, 242, 749-752, 1988.
Bathe, K. J., Finite Element Procedures in Engineering Analysis, Prentice-Hall, Englewood Cliffs, N.J., 1982.
Biju-Duval, B., et al., Initial Reports of the Deep Sea Drilling Project, Leg 78A, 621 pp., U.S. Government Printing Office, Washington, D.C., 1984.
Byeflee, J., Friction of rocks, Pure Appl. Geophys., 116, 615-626, 1978.
Chappie, W. M., Mechanics of thin-skinned fold-and-thrust belts, Geol. Soc. Am. Bull., 89, 1189-1198, 1978.
Dahlen, F. A., J. Suppe, and D. M. Davis, Mechanics of fold- and-thrust belts and accretionary wedges: Cohesive Coulomb theory, J. Geophys. Res., 89, 10,087-10,101, 1984.
Davis, D. M., J. Suppe, and F. A. Dahlen, Mechanics of fold- and-thrust belts and accretionary wedges, J. Geophys. Res., 88, 1153-1172, 1983.
Desai, C. S., Static and cyclic response of interfaces for analysis and design of soil-structure interaction problems, in Geotechnical Modeling and Applications, edited by S. M. Sayed, pp. 147-180, Gulf Publishing, Houston, Tex., 1987.
Dorel, J., Seismicity and seismic gap in the Lesser Antilles arc and earthquake hazard in Guadaloupe, Geophys. J. R. Astron. Soc., 67, 679-695, 1981.
Elliott, D., The motion of thrust sheets, J. Geophys. Res., 81, 949-963, 1976.
Francavilla, A., and O. C. Zienkiewicz, A note on numerical computation of elastic contact problems, Int. J. Numer. Methods Eng., 9, 913-924, 1975.
Hartnett, M. J., A general numerical solution for elastic body contact problems, in Solid Contact and Lubrication, AMD Syrup. Set., vol. 39, pp. 51-56, Applied Mechanics Division, American Society of Mechanical Engineers, New York, 1980.
Hill, R., The Mathematical Theory of Plasticity, 355 pp., Oxford University Press, New York, 1950.
Hubbert, M. K., and W. W. Rubey, Role of fluid pressure in mechanics of overthrust faulting, Geol. Soc. Am. Bull., 70, 115-166, 1959.
Hughes, T. J. R., Numerical implementation of constitutive models: Rate independent deviatoric plasticity, in Workshop on Theoret- ical Foundations for Large Scale Computations on Nonlinear Material Behavior, Northwestern University, Press, Evanston, I11., 1983.
Hughes, T. J. R., and J. H. Prevost, DIRT H, A Nonlinear Quasi-Static Finite Element Analysis Program, user's manual, 240 pp., 1979.
Hughes, T. J. R., R. L. Taylor, J. L. Sackman, A. Curnier, and W. Kanoknukulchai, A finite element method for a class of contact- impact problems, Comp. Methods Appl. Mech. Eng., 8, 249-276, 1976.
Johnson, K. L., Contact Mechanics, Cambridge University Press, New York, 1985.
Krieg, R. D., and S. W. Key, Implementation of a time dependent plasticity theory into structural computer programs, in Constitu- tive Equations in Viscoplasticity : Computational and Engineering Aspects, AMD-20, edited by J. A. Stricklin and K. J. Saczalski, American Society of Mechanical Engineers, New York, 1976.
Ladd, C. C., and R. Foott, New design procedure for stability of soft clays, J. Geotech. Eng. Div. Am. Soc. Civ. Eng., 100, 763-786,1974.
Lambe, T. W., and R. V. Whitman, Soil Mechancis, 553 pp., John Wiley, New York, 1969.
MacDonald, K., and T. Holcombe, Inversion of magnetic anomalies and seafloor spreading in the Cayman Trough, Earth Planet. Sci. Lett. , 40, 407-414, 1978.
Malvern, L. E., Introduction to the Mechanics of a Continuous Medium, Prentice-Hall, Englewood Cliffs, N.J., 1969.
Marlow, M. S., H. J. Lee, and A. W. Wright, Physical properties of sediments from the Lesser Antilles Margin along the Barbados Ridge: Results from Deep Sea Drilling leg 78A, Initial Rep. Deep Sea Drill. Proj., 78A, 549-558, 1984.
McMeeking, R. M., and J. R. Rice, Finite-element formulations for problems of large elastic-plastic deformations, Int. J. Solids Struct., 11,601-616, 1975.
Minster, J. B., and T. H. Jordan, Present-day plate motion, J. Geophys. Res., 83, 5331-5354, 1978.
BORJA AND DREISS: NUMERICAL MODELING OF WEDGE MECHANICS 9339
Moore, J. C., et al., Expulsions of fluids from depth along a subduction-zone decollement horizon, Nature, 326, 785-788, 1987.
Owen, D. R., and E. Hinton, Finite Elements in Plasticity: Theory and Practice, McGraw-Hill, New York, 1980.
Pascoe, S. K., and J. E. Mottershead, Linear elastic contact problems using curved elements and including dynamic friction, Int. J. Numer. Methods Eng., 26, 1631-1643, 1988.
Roscoe, K. H., and J. B. Burland, On the generalized stress-strain behavior of 'wet' clay, in Engineering Plasticity, edited by J. Heyman and F. A. Leckie, pp. 535-609, Cambridge University Press, New York, 1968.
Shi, Y., and C. Wang, Generation of high pore pressures in accretionary prisms: Inferences from the Barbados subduction complex, J. Geophys. Res., 93, 8893-8910, 1988.
Simo, J. C., and R. L. Taylor, Consistent tangent operators for rate-independent elastoplasticity, Comp. Methods Appl. Mech. Eng., 48, 101-118, 1985.
Stockreal, G. S., Modeling of large-scale accretionary wedge defor- mation, J. Geophys. Res., 88, 8271-8287, 1983.
Sykes, L. R., W. R. McCann, and A. L. Kafka, Motion of Carribean plate during last 7 million years and implications for earlier Cenozoic movements, J. Geophys. Res., 87, 10,656-10,676, 1982.
Tovish, A., and G. Schubert, Island arc curvature, velocity of
convergence and angle of subduction, Geophys. Res. Lett., 5, 329-332, 1978.
Wilkins, M. L., Calculation of elastic-plastic flow, in Methods in Computational Physics, vol. 3, Academic, Orlando, Fla., 1964.
Wright, A., Sediment accumulation rates of the Lesser Antilles intraoceanic arc, Initial Rep. Deep Sea Drill. Proj., 78A, 357-368, 1984.
Wuthrich, D. R., E. J. Screaton, and S. J. Dreiss, A model of fluid flow and pore pressures for the lesser Antilles accretionary prism (abstract), Eos Trans. AGU, 68, 1486, 1987.
Zhao, W.-L., D. M. Davis, F. A. Dahlen, and J. Suppe, Origin of convex accretionary wedges: Evidence from Barbados, J. Geo- phys. Res., 91, 10,246-10,258, 1986.
Zienkiewicz, O. C., The Finite Element Method, 3rd ed., McGraw- Hill, New York, 1977.
R. I. Borja, Department of Civil Engineering, Stanford Univer- sity, Stanford, CA 94305.
S. J. Dreiss, Department of Earth Science, University of Califor- nia, Santa Cruz, CA 95064.
(Received October 5, 1988; revised January 25, 1989;
accepted February 14, 1989.)