numeracy gr 7
TRANSCRIPT
7/21/2019 Numeracy Gr 7
http://slidepdf.com/reader/full/numeracy-gr-7 1/166
These workbooks have been developed for the children of South
Africa under the leadership of the Minister of Basic Education,
Mrs Angie Motshekga, and the Deputy Minister of Basic Education,
Mr Enver Surty.
The Rainbow Workbooks form part of the Department of
Basic Education’s range of interventions aimed at improving the
performance of South African learners in the first six grades.
As one of the priorities of the Government’s Plan of Action, this
project has been made possible by the generous funding of the
National Treasury. This has enabled the Department to make these
workbooks, in all the official languages, available at no cost.
We hope that teachers will find these workbooks useful in their
everyday teaching and in ensuring that their learners cover the
curriculum. We have taken care to guide the teacher through each
of the activities by the inclusion of icons that indicate what it is
that the learner should do.We sincerely hope that children will enjoy working through the book
as they grow and learn, and that you, the teacher, will share their
pleasure.
We wish you and your learners every success in using these
workbooks.
Mrs Angie Motshekga,
Minister of Basic
Education
Mr Enver Surty,
Deputy Minister
of Basic Education
Term 3& M A T H E M A
T I C S i n E N G L I S H
Name:I S B N 9 7 8 -1 -4 3 1 5 - 0 2 2 0 -2
Class:
M A T H E M A T I C S i nE N G
L I S H -G ra d e7
B o o k 2
Grade7
MATHEMATICS IN ENGLISH
GRADE 7 - TERMS 3&4
SBN 978-1-4315-0220-2
THIS BOOK MAYNOT BE SOLD.

7/21/2019 Numeracy Gr 7
http://slidepdf.com/reader/full/numeracy-gr-7 2/166
Published by the Department of Basic Education222 Struben StreetPretoriaSouth Africa
© Department of Basic Education
First published in 2011
ISBN
The Department of Basic Education has made every effort to trace copyright
holders but if any have been inadvertently overlooked the Department will be
pleased to make the necessary arrangements at the first opportunity.
This book may not be sold.
978-1-4315-0220-2
1 2 3 4 5 6 7 8 9 10 11 12 13 14 15 16 17 18 19 20
2 4 6 8 10 12 14 16 18 20 22 24 26 28 30 32 34 36 38 4 0
3 6 9 12 15 18 21 24 27 30 33 36 39 42 45 48 51 54 57 60
4 8 12 16 20 24 28 32 36 40 44 48 52 56 60 64 68 72 76 80
5 10 15 20 25 30 35 40 45 50 55 60 65 70 75 80 85 90 95 100
6 12 18 24 30 36 42 48 54 60 66 72 78 84 90 96 102 1 08 114 120
7 14 21 28 35 42 49 56 63 70 77 84 91 98 105 112 119 126 133 140
8 16 24 32 40 48 56 64 72 80 88 96 104 112 120 128 136 144 152 160
9 18 27 36 45 54 63 72 81 90 99 108 117 126 135 144 153 162 171 180
10 20 30 40 50 60 70 80 90 100 110 120 130 140 150 160 170 180 190 200
11 22 33 44 55 66 77 88 99 110 121 132 143 154 165 176 187 198 209 220
12 24 36 48 60 72 84 96 108 120 132 144 156 168 180 192 204 216 228 240
13 26 39 52 65 78 91 104 117 130 143 156 169 182 195 208 221 234 2 47 2 60
14 28 42 56 70 84 98 112 126 140 154 168 182 196 210 224 2 38 252 2 66 280
15 30 45 60 75 90 105 120 135 150 165 180 195 210 225 2 40 2 55 270 2 85 3 00
16 32 48 64 80 96 112 128 144 160 176 192 208 2 24 2 40 2 56 272 288 3 04 3 20
17 34 51 68 85 102 119 136 153 170 187 204 221 238 255 272 289 3 06 3 23 340
18 36 54 72 90 108 126 144 162 180 198 216 234 252 270 288 3 06 324 342 360
19 38 57 76 95 114 133 152 171 190 2 09 228 247 266 2 85 3 04 3 23 342 361 380
20 40 60 80 100 120 140 160 180 200 220 240 260 280 300 320 340 360 380 400
3 x 4=12 Multiplication table
7
7/21/2019 Numeracy Gr 7
http://slidepdf.com/reader/full/numeracy-gr-7 3/166
Grade
7M
a t h e m a t
i c
s
1
E
N G L I S
H
Book
2
in ENGLISH
Name:
12 13 14 15 16 17 18 19 20 21 22 23 24 25 26 27 28 29 30 31 32 33 34 35
7/21/2019 Numeracy Gr 7
http://slidepdf.com/reader/full/numeracy-gr-7 4/166
2
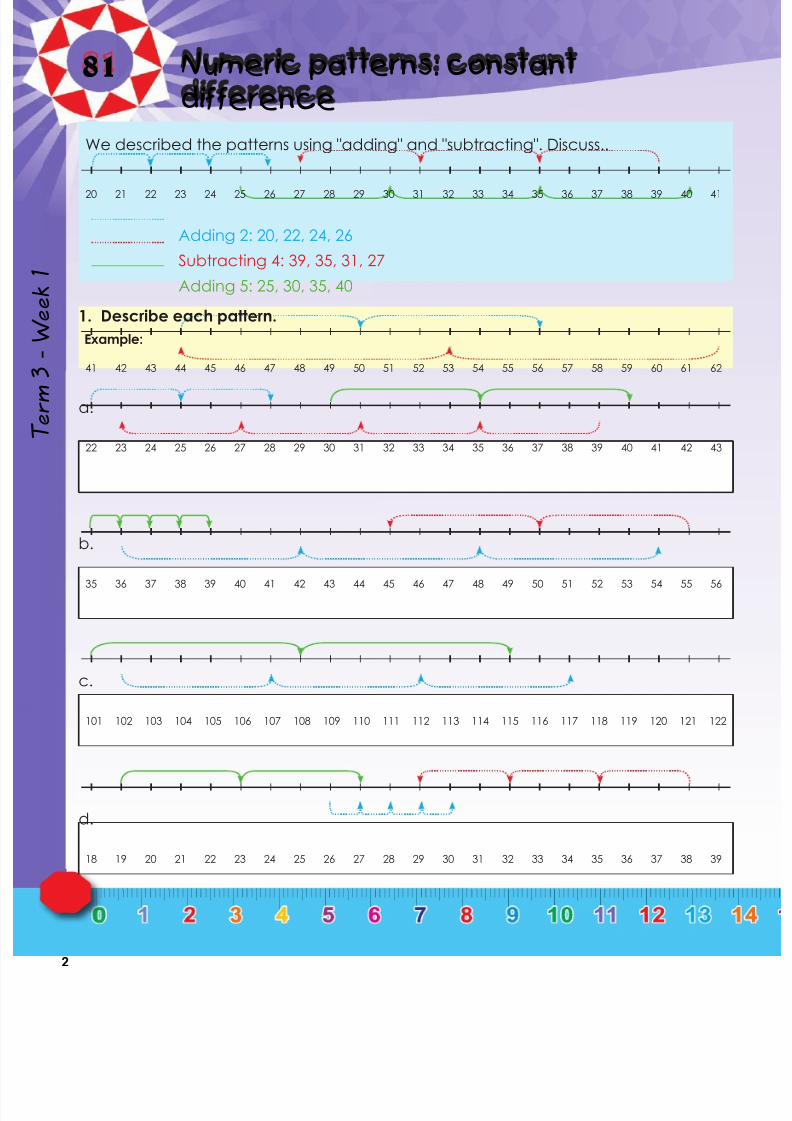
81 Numeric patterns: constantdifference
Term3-Week1
1. Describe each pattern.
a.
We described the patterns using "adding" and "subtracting". Discuss..
20 21 22 23 24 25 26 27 28 29 30 31 32 33 34 35 36 37 38 39 40 41
Adding 2: 20, 22, 24, 26
Subtracting 4: 39, 35, 31, 27
Adding 5: 25, 30, 35, 40
Example:
41 42 43 44 45 46 47 48 49 50 51 52 53 54 55 56 57 58 59 60 61 62
22 23 24 25 26 27 28 29 30 31 32 33 34 35 36 37 38 39 40 41 42 43
b.
35 36 37 38 39 40 41 42 43 44 45 46 47 48 49 50 51 52 53 54 55 56
c.
101 102 103 104 105 106 107 108 109 110 111 112 113 114 115 116 117 118 119 120 121 122
d.
18 19 20 21 22 23 24 25 26 27 28 29 30 31 32 33 34 35 36 37 38 39
7/21/2019 Numeracy Gr 7
http://slidepdf.com/reader/full/numeracy-gr-7 5/166
3
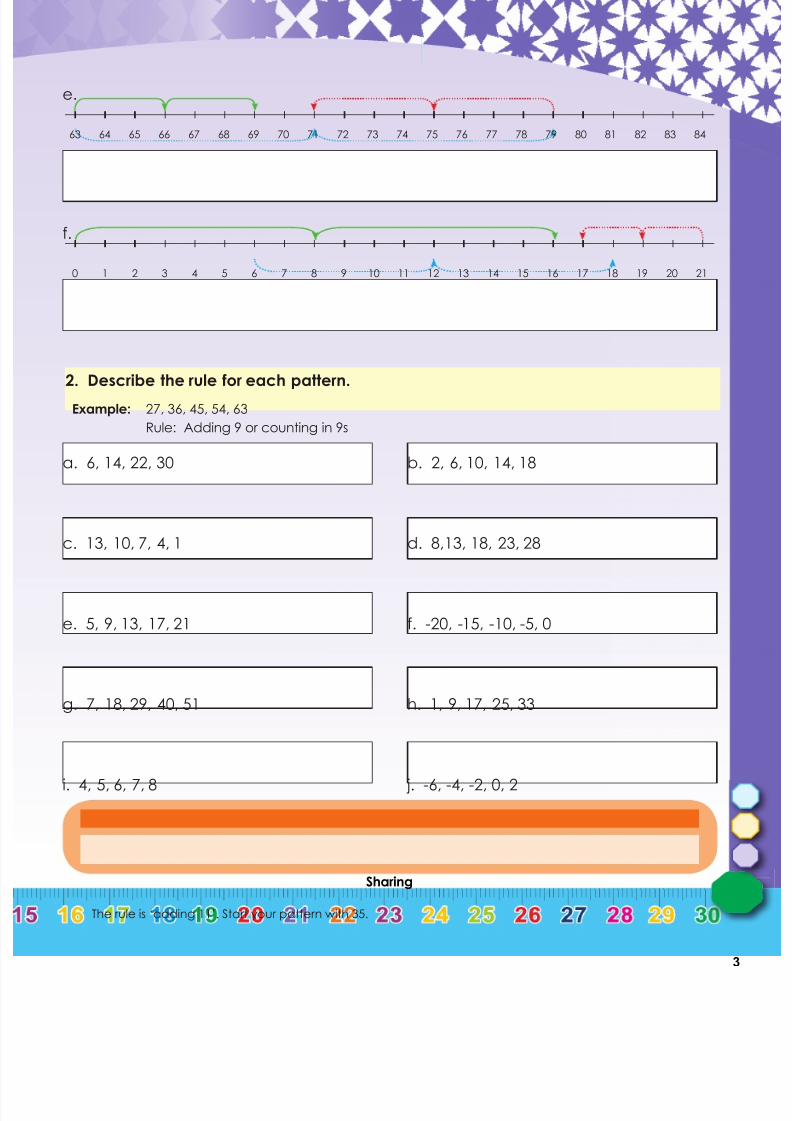
2. Describe the rule for each pattern.
a. 6, 14, 22, 30
e.
63 64 65 66 67 68 69 70 71 72 73 74 75 76 77 78 79 80 81 82 83 84
f.
0 1 2 3 4 5 6 7 8 9 10 11 12 13 14 15 16 17 18 19 20 21
Sharing
The rule is ‘adding 11’. Start your pattern with 35.
Example: 27, 36, 45, 54, 63
Rule: Adding 9 or counting in 9s
c. 13, 10, 7, 4, 1
e. 5, 9, 13, 17, 21
g. 7, 18, 29, 40, 51
i. 4, 5, 6, 7, 8
b. 2, 6, 10, 14, 18
d. 8,13, 18, 23, 28
f. -20, -15, -10, -5, 0
h. 1, 9, 17, 25, 33
j. -6, -4, -2, 0, 2

7/21/2019 Numeracy Gr 7
http://slidepdf.com/reader/full/numeracy-gr-7 6/166
4
82 Numeric patterns: constant ratio
Describe the pattern. Take your time and
think carefully when you
identify the pattern.2, 4, 8, 16, …
1. Describe the pattern and make a number line to show each term.
× 2
Identify the constant ratio between consecutive terms. This pattern can bedescribed in one’s own words as "multiplying the previous number by 2".
× 2 × 22 4 8 16
Can you still remember
what constant ratio
means?
a. 2, 8, 32, 128, 512
Example: 4, 8, 12, 16, 20
0 1 2 3 4 5 6 7 8 9 10 11 12 13 14 15 16 17 18 19 20
Add 4 to
the previous
number.
b. 4, 12, 36, 108, 324
c. 6, 12, 24, 48, 96
Term3-Week1
7/21/2019 Numeracy Gr 7
http://slidepdf.com/reader/full/numeracy-gr-7 7/166
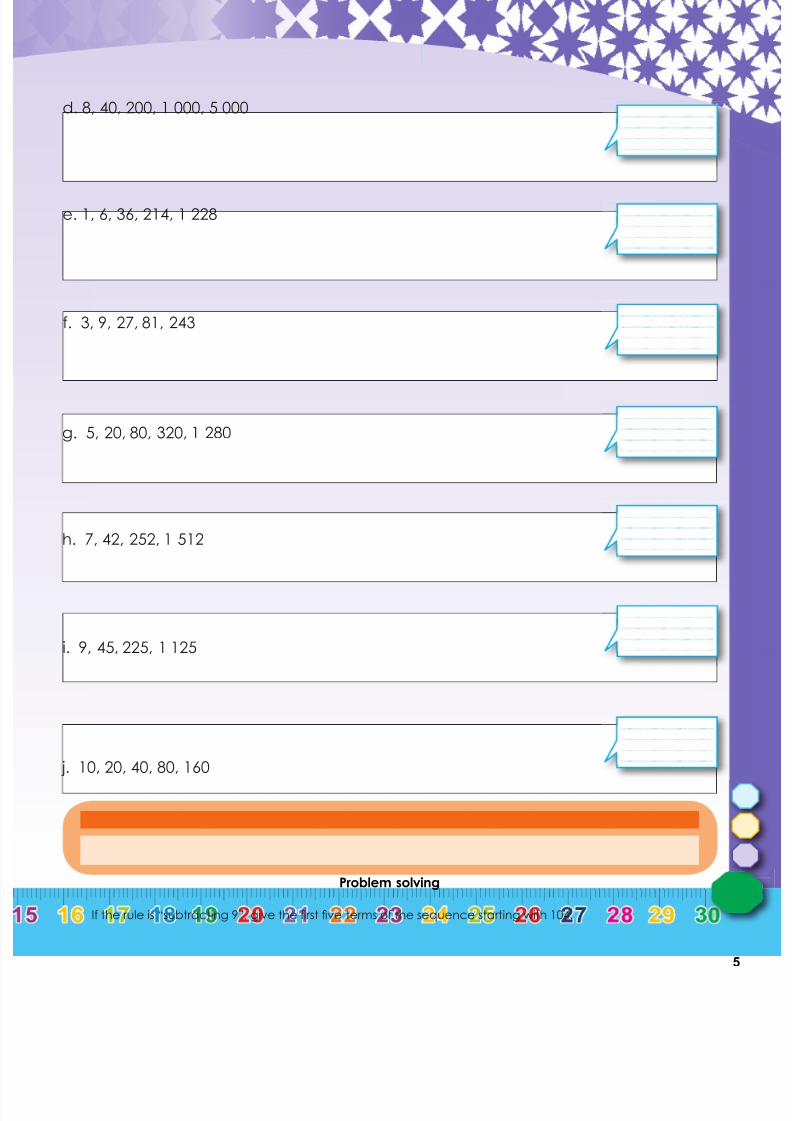
5
d. 8, 40, 200, 1 000, 5 000
e. 1, 6, 36, 214, 1 228
f. 3, 9, 27, 81, 243
g. 5, 20, 80, 320, 1 280
h. 7, 42, 252, 1 512
i. 9, 45, 225, 1 125
j. 10, 20, 40, 80, 160
Problem solving
If the rule is “subtracting 9”, give the first five terms of the sequence starting with 104.
7/21/2019 Numeracy Gr 7
http://slidepdf.com/reader/full/numeracy-gr-7 8/166
6
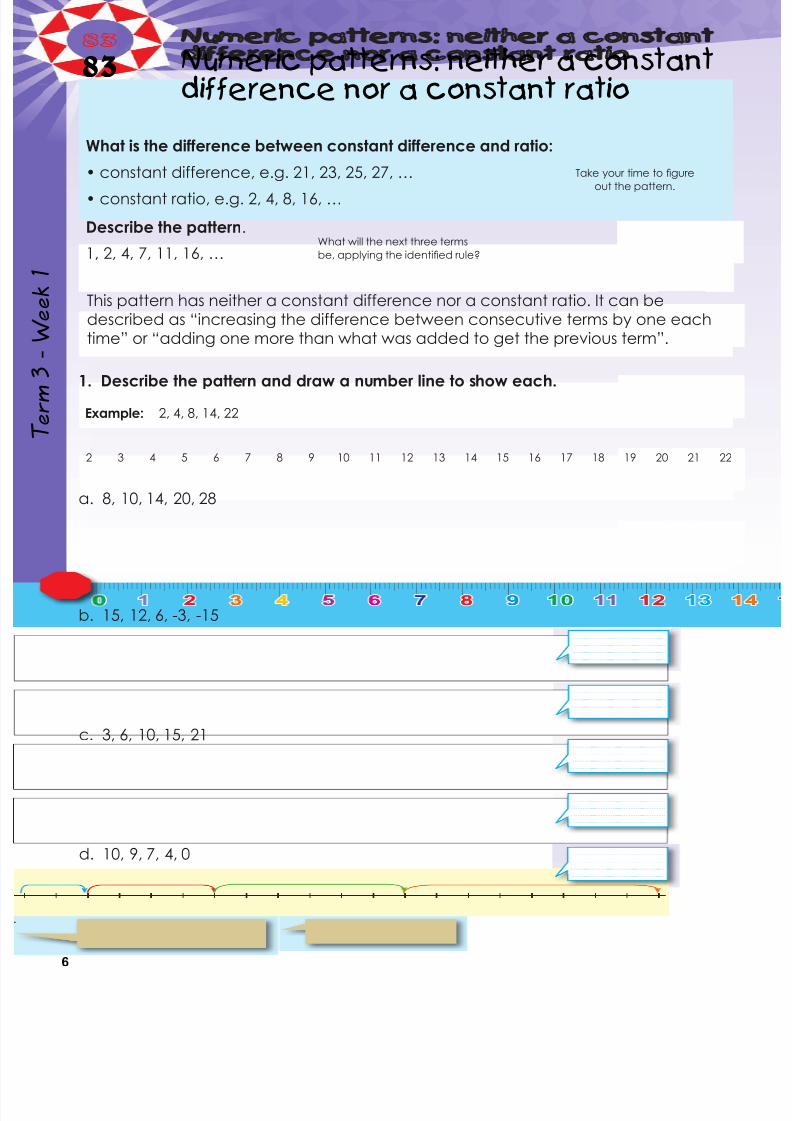
83 Numeric patterns: neither a constantdifference nor a constant ratio
Describe the pattern.
1, 2, 4, 7, 11, 16, …
1. Describe the pattern and draw a number line to show each.
This pattern has neither a constant difference nor a constant ratio. It can bedescribed as “increasing the difference between consecutive terms by one eachtime” or “adding one more than what was added to get the previous term”.
What is the difference between constant difference and ratio:
• constant difference, e.g. 21, 23, 25, 27, …
• constant ratio, e.g. 2, 4, 8, 16, …
What will the next three terms
be, applying the identified rule?
a. 8, 10, 14, 20, 28
Example: 2, 4, 8, 14, 22
2 3 4 5 6 7 8 9 10 11 12 13 14 15 16 17 18 19 20 21 22
b. 15, 12, 6, -3, -15
c. 3, 6, 10, 15, 21
d. 10, 9, 7, 4, 0
Take your time to figure
out the pattern.
Term3-Week1

7/21/2019 Numeracy Gr 7
http://slidepdf.com/reader/full/numeracy-gr-7 9/166
7
e. 6, 7, 9, 12, 21
f. 1, 3, 7, 15, 31
g. 13, 9, 4, -2, -9
h. 9, 14, 20, 27, 35
i. 24, 18, 13, 9, 7
j. 19, 20, 22, 25, 29
Problem solving
Create your own sequence without a constant ratio.

7/21/2019 Numeracy Gr 7
http://slidepdf.com/reader/full/numeracy-gr-7 10/166
8
84 Numeric patterns: tables
1. Describe the pattern and draw a number line to show each.
The “tenth term" refers to position 10 in the number sequence. You have to find
a rule in order to determine the tenth term, rather than continuing the sequenceup to the tenth term. You should recognise that each term in the bottom row isobtained by doubling the number in the top row. So double 10 is 20. The tenth term
is 20.
Give a rule to describe the relationship between the numbers in this sequence:
2, 4, 6, 8, ... Use the rule to find the tenth term
Example:
We can represent a
sequence in a table.
Position in the sequence 1 2 3 4 10
Term 2 4 6 8 ?
Position in the sequence 1 2 3 4 10
Term 3 6 9 12 30
1 × 3 2 × 3 3 × 3 4 × 3 10 × 3
a. Position in the sequence 1 2 3 4 10
Term 4 8 12 16
b. Position in the sequence 1 2 3 4 10
Term 8 16 24 32
c. Position in the sequence 1 2 3 4 10
Term 12 24 36 48
d. Position in the sequence 1 2 3 4 10
Term 7 14 21 28
e. Position in the sequence 1 2 3 4 10
Term 5 10 15 20
Term3-Week1
7/21/2019 Numeracy Gr 7
http://slidepdf.com/reader/full/numeracy-gr-7 11/166
9
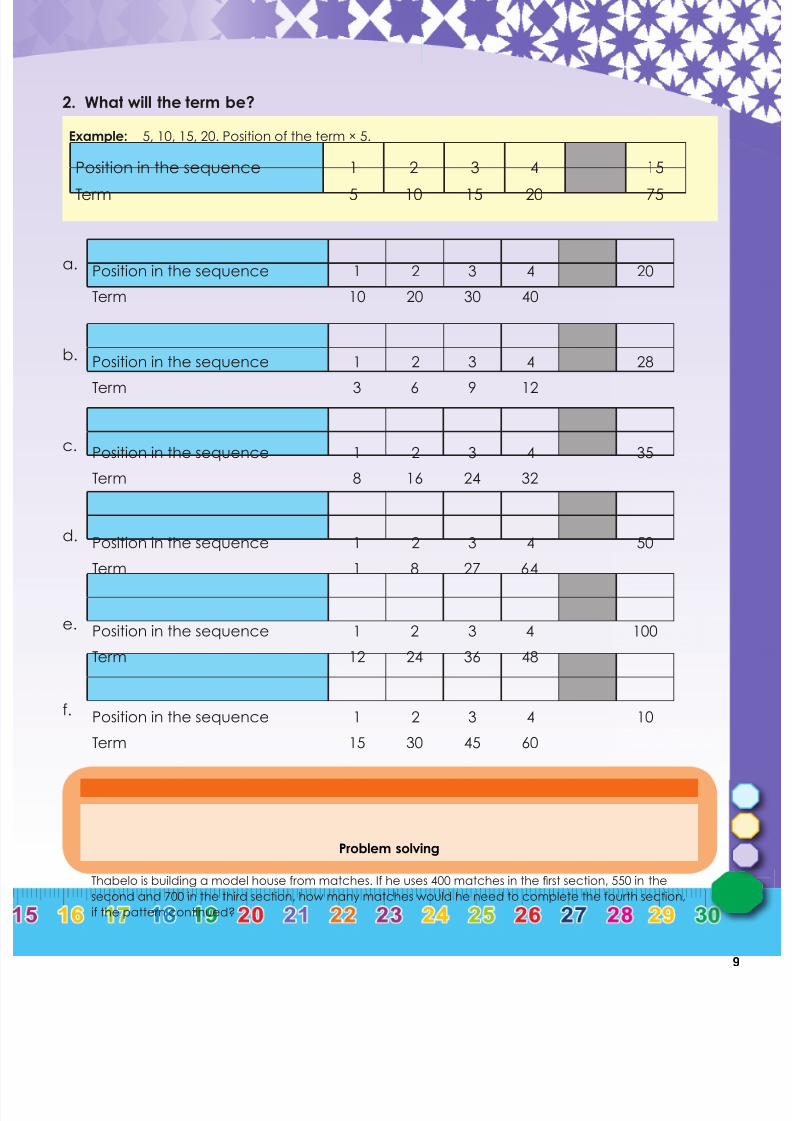
2. What will the term be?
Example: 5, 10, 15, 20. Position of the term × 5.
Position in the sequence 1 2 3 4 15
Term 5 10 15 20 75
a. Position in the sequence 1 2 3 4 20
Term 10 20 30 40
b. Position in the sequence 1 2 3 4 28
Term 3 6 9 12
c. Position in the sequence 1 2 3 4 35
Term 8 16 24 32
d. Position in the sequence 1 2 3 4 50
Term 1 8 27 64
e. Position in the sequence 1 2 3 4 100
Term 12 24 36 48
f. Position in the sequence 1 2 3 4 10
Term 15 30 45 60
Problem solving
Thabelo is building a model house from matches. If he uses 400 matches in the first section, 550 in the
second and 700 in the third section, how many matches would he need to complete the fourth section,
if the pattern continued?
7/21/2019 Numeracy Gr 7
http://slidepdf.com/reader/full/numeracy-gr-7 12/166
10
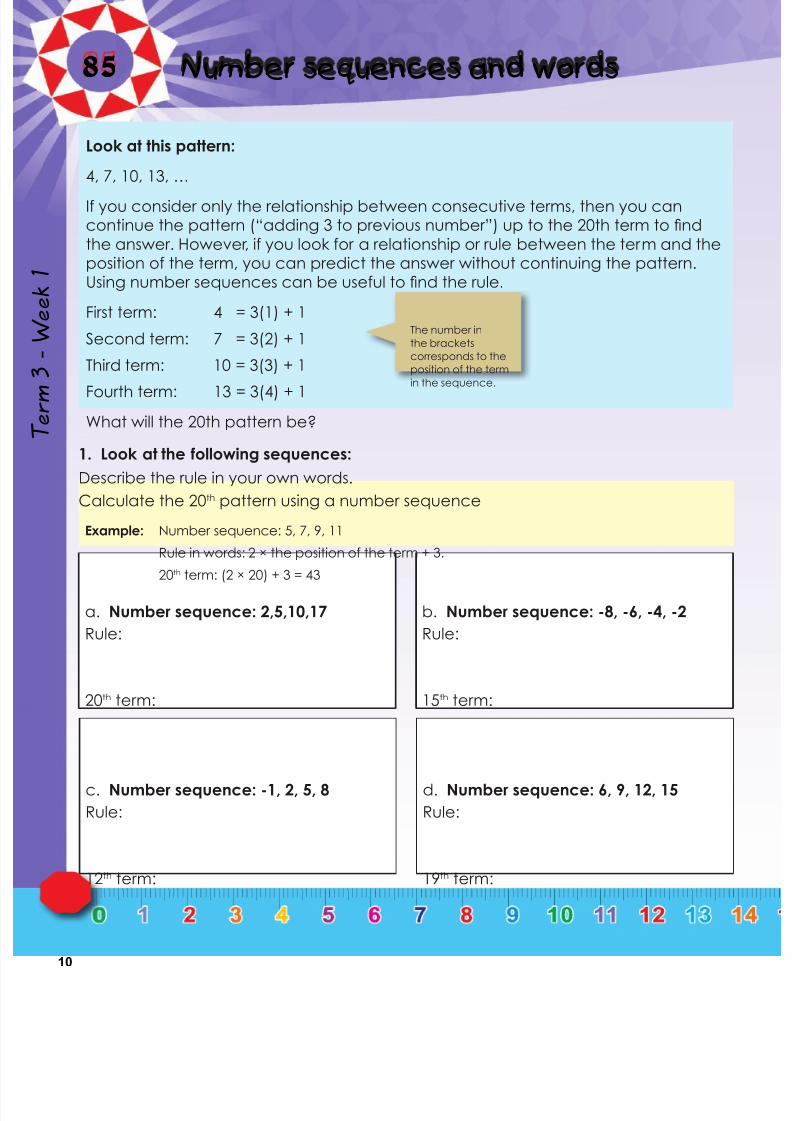
85 Number sequences and words
1. Look at the following sequences:
Describe the rule in your own words.
Calculate the 20th pattern using a number sequence
Look at this pattern:
4, 7, 10, 13, …
If you consider only the relationship between consecutive terms, then you cancontinue the pattern (“adding 3 to previous number”) up to the 20th term to find
the answer. However, if you look for a relationship or rule between the term and theposition of the term, you can predict the answer without continuing the pattern.Using number sequences can be useful to find the rule.
First term: 4 = 3(1) + 1
Second term: 7 = 3(2) + 1
Third term: 10 = 3(3) + 1
Fourth term: 13 = 3(4) + 1
What will the 20th pattern be?
The number in
the brackets
corresponds to the
position of the term
in the sequence.
Example: Number sequence: 5, 7, 9, 11
Rule in words: 2 × the position of the term + 3.
20th term: (2 × 20) + 3 = 43
a. Number sequence: 2,5,10,17
Rule:
20th term:
b. Number sequence: -8, -6, -4, -2
Rule:
15th term:
c. Number sequence: -1, 2, 5, 8
Rule:
12th term:
d. Number sequence: 6, 9, 12, 15
Rule:
19th term:
Term3-Week1

7/21/2019 Numeracy Gr 7
http://slidepdf.com/reader/full/numeracy-gr-7 13/166
11
e. Number sequence: -6, -2, 2, 6
Rule:
18th term:
f. Number sequence: 7, 12, 17, 22
Rule:
12th term:
g. Number sequence: 2,5; 3; 3,5; 4
Rule:
21st term:
h. Number sequence: -3, -1, 1, 3
Rule:
15th term:
i. Number sequence: 3, 7, 11, 15
Rule:
14th term:
j. Number sequence: 14, 24, 34, 44
Rule:
25th term:
Problem solving
Miriam collects stickers for her sticker album. If she collects 4 stickers on day 1, 8 on day 2, 16 on day 3
and 32 on day 4, how many would she collect on day 5 if the pattern continued?
Helen spends 2 hours playing computer games on the first day of the school holidays. On the second
day she plays for 5 hours and on the third day she plays for 8 hours. For how many hours would she play
on the fourth day if she kept on playing?
7/21/2019 Numeracy Gr 7
http://slidepdf.com/reader/full/numeracy-gr-7 14/166
12
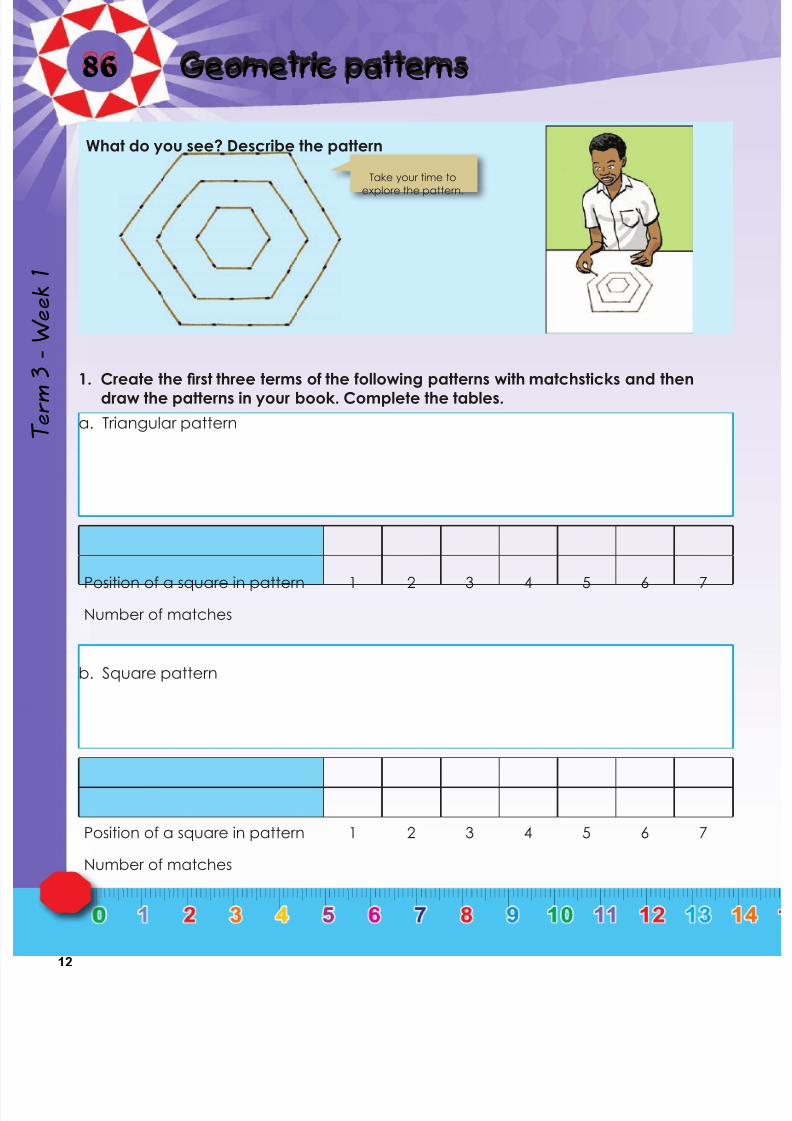
86 Geometric patterns
What do you see? Describe the pattern
Take your time to
explore the pattern.
1. Create the first three terms of the following patterns with matchsticks and thendraw the patterns in your book. Complete the tables.
a. Triangular pattern
Position of a square in pattern 1 2 3 4 5 6 7
Number of matches
b. Square pattern
Position of a square in pattern 1 2 3 4 5 6 7
Number of matches
Term3-Week1

7/21/2019 Numeracy Gr 7
http://slidepdf.com/reader/full/numeracy-gr-7 15/166
13
c. Rectangular pattern
Position of a square in pattern 1 2 3 4 5 6 7
Number of matches
d. Pentagonal pattern
Position of a square in pattern 1 2 3 4 5 6 7
Number of matches
2. Look at worksheets 81-86 again. Explain and give examples of the following:
Problem solving
Represent an octagonal number pattern.
Numericpattern
Deals withaddition andsubtraction
Geometricpattern
Deals withmultiplicationand division
7/21/2019 Numeracy Gr 7
http://slidepdf.com/reader/full/numeracy-gr-7 16/166
14
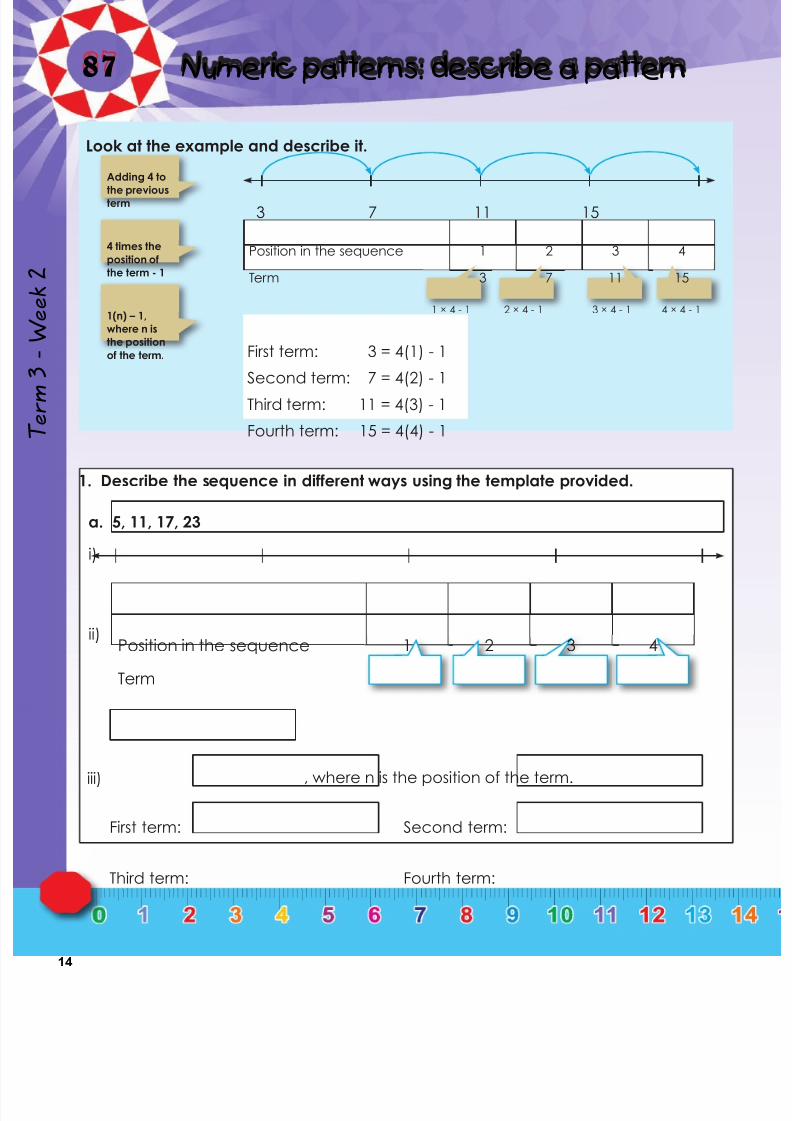
87 Numeric patterns: describe a pattern
Term3
Week2
1. Describe the sequence in different ways using the template provided.
Look at the example and describe it.
Position in the sequence 1 2 3 4
Term 3 7 11 15
Adding 4 to
the previousterm
4 times the
position of
the term - 1
1(n) – 1,
where n is
the position
of the term. First term: 3 = 4(1) - 1
Second term: 7 = 4(2) - 1Third term: 11 = 4(3) - 1
Fourth term: 15 = 4(4) - 1
3 7 11 15
1 × 4 - 1 2 × 4 - 1 3 × 4 - 1 4 × 4 - 1
a. 5, 11, 17, 23
i)
ii)Position in the sequence 1 2 3 4
Term
iii) , where n is the position of the term.
First term:
Third term:
Second term:
Fourth term:

7/21/2019 Numeracy Gr 7
http://slidepdf.com/reader/full/numeracy-gr-7 17/166
15
continued☛
b. 5, 7, 9, 11 ...
i)
ii)Position in the sequence 1 2 3 4
Term
iii) , where n is the position of the term.
First term:
Third term:
Second term:
Fourth term:
c. 10, 19, 28, 37, ...
i)
ii)Position in the sequence 1 2 3 4
Term
iii) , where n is the position of the term.
First term:
Third term:
Second term:
Fourth term:
7/21/2019 Numeracy Gr 7
http://slidepdf.com/reader/full/numeracy-gr-7 18/166
16
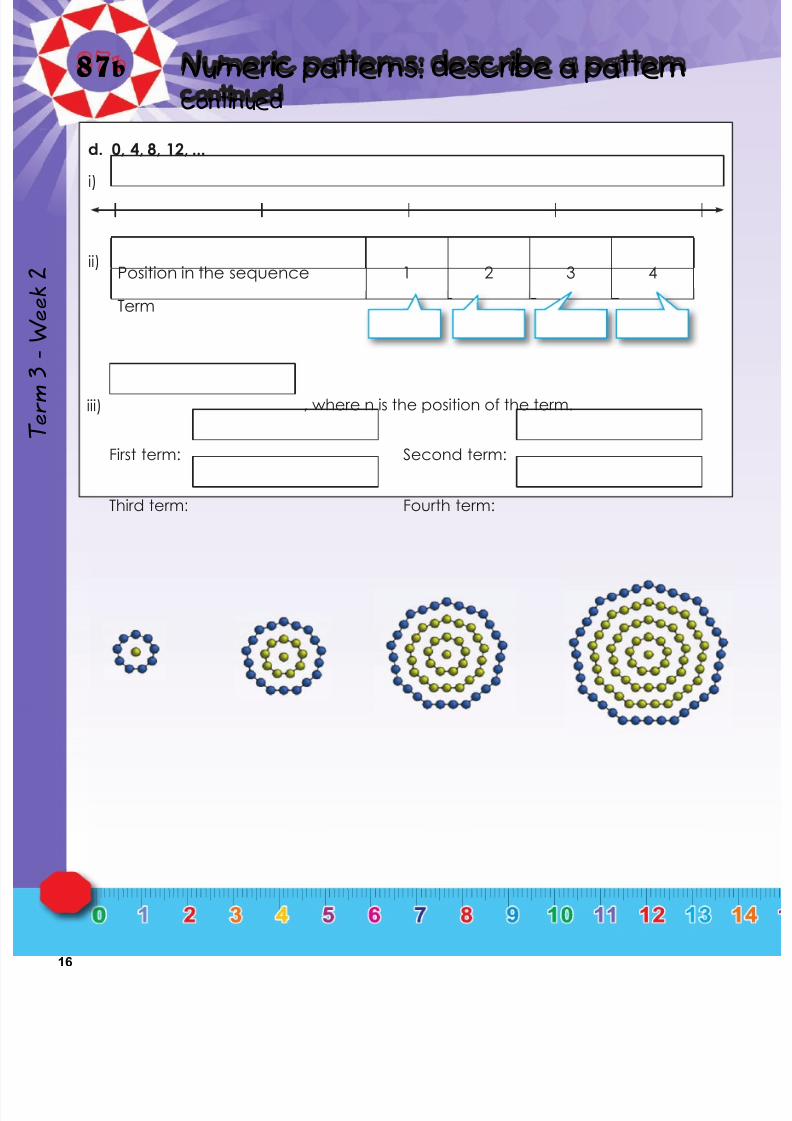
87b Numeric patterns: describe a patterncontinued
Term3
Week2
d. 0, 4, 8, 12, ...
i)
ii)Position in the sequence 1 2 3 4
Term
iii) , where n is the position of the term.
First term:
Third term:
Second term:
Fourth term:
7/21/2019 Numeracy Gr 7
http://slidepdf.com/reader/full/numeracy-gr-7 19/166
17
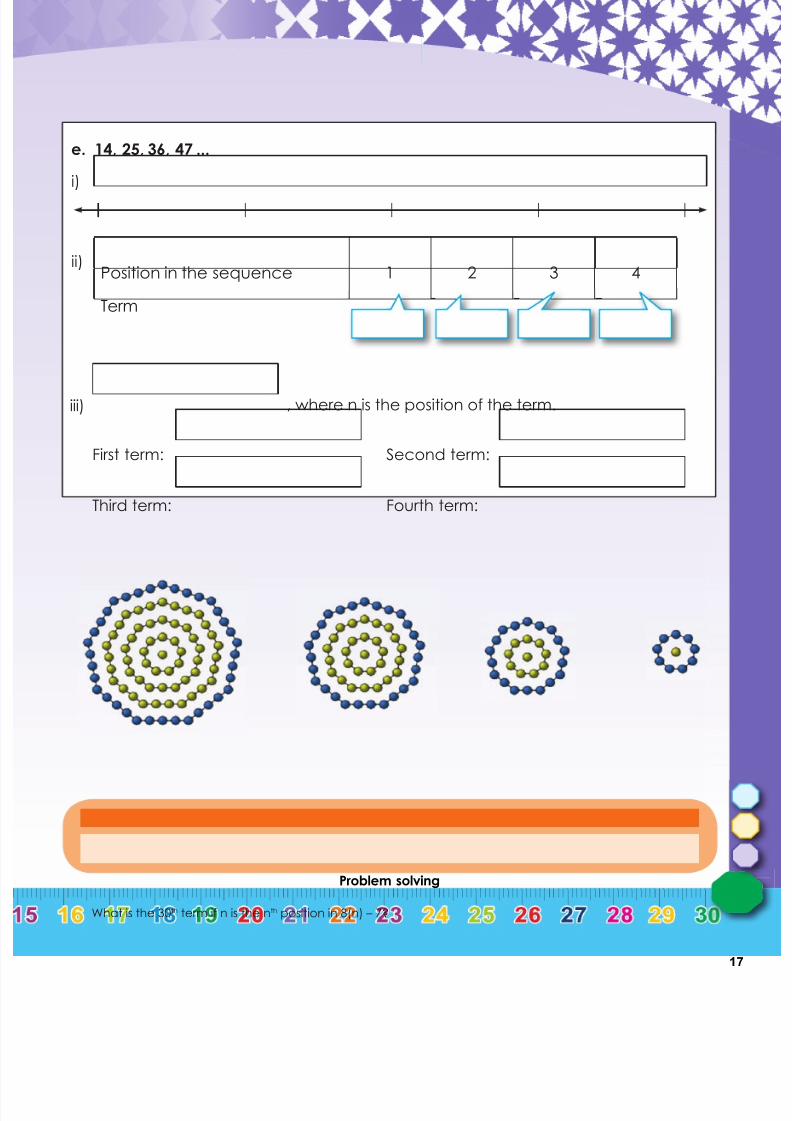
e. 14, 25, 36, 47 ...
i)
ii)Position in the sequence 1 2 3 4
Term
iii) , where n is the position of the term.
First term:
Third term:
Second term:
Fourth term:
Problem solving
What is the 30th term if n is the nth position in 8(n) – 7?

7/21/2019 Numeracy Gr 7
http://slidepdf.com/reader/full/numeracy-gr-7 20/166
18
88 Input and output values
Term3-Week2
Example:
a.
a b = a × 4
• 3 × 4 = 12
• 2 × 4 = 8
• 5 × 4 = 20
• 7 × 4 = 28
• 4 × 4 = 16
What does input and output mean? Make a drawing to show a real life example.
Input Process Output
1. Complete the flow diagrams.
× 6
1
5
7
9
12
b.
× 4
3
6
8
4
5
c.
× 8
12
11
9
6
5
d.
× 9
3
10
12
9
8
b = a × 4
3
2
5
7
4
b
a. b.
b = a × 10
2
12
10
11
15
b = a × 6
4
5
6
2
3
a b a b
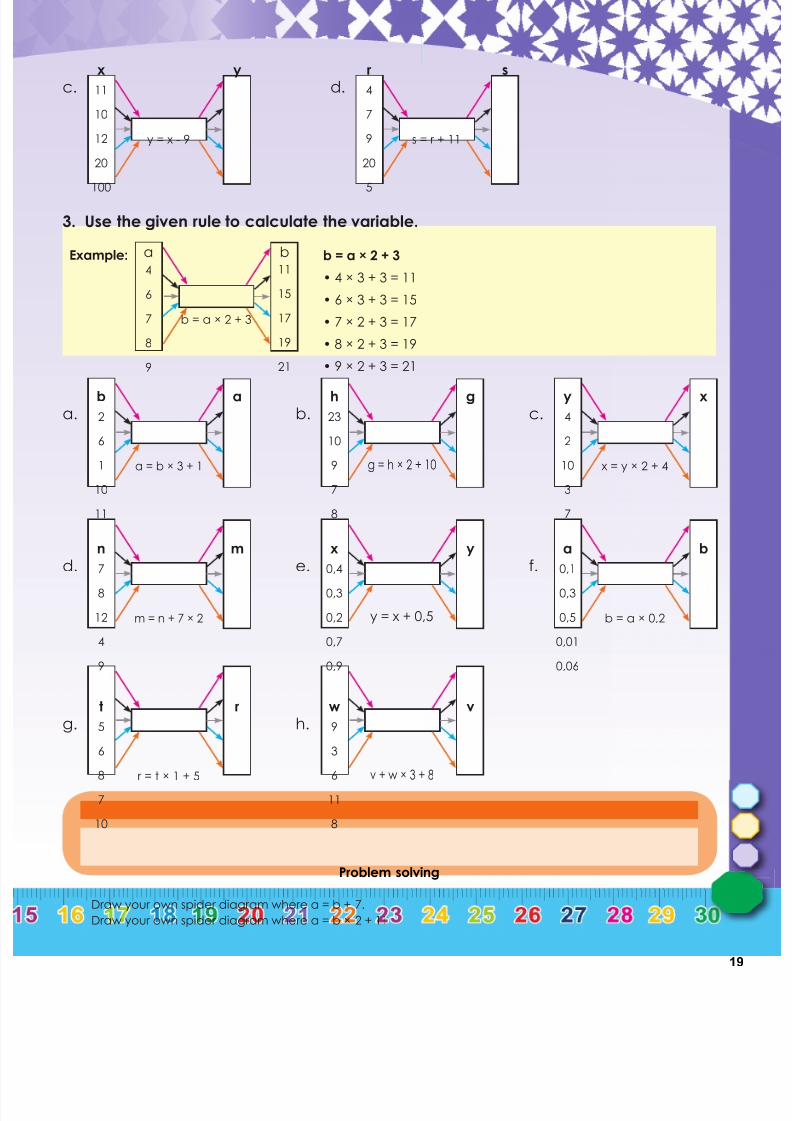
2. Use the given rule to calculate the value of b.
7/21/2019 Numeracy Gr 7
http://slidepdf.com/reader/full/numeracy-gr-7 21/166
19
c. d.
s = r + 11
4
7
9
20
5
y = x - 9
11
10
12
20
100
x y r s
Example: a b = a × 2 + 3
• 4 × 3 + 3 = 11
• 6 × 3 + 3 = 15
• 7 × 2 + 3 = 17
• 8 × 2 + 3 = 19
• 9 × 2 + 3 = 21
a.
a = b × 3 + 1
2
6
1
10
11
b a
b.
g = h × 2 + 10
23
10
9
7
8
h g
3. Use the given rule to calculate the variable.
b = a × 2 + 3
4
6
7
8
9
b11
15
17
19
21
c.
x = y × 2 + 4
4
2
10
3
7
y x
d.
m = n + 7 × 2
7
8
12
4
9
n m
e.
y = x + 0,5
0,4
0,3
0,2
0,7
0,9
x y
f.
b = a × 0,2
0,1
0,3
0,5
0,01
0,06
a b
g.
r = t × 1 + 5
5
6
8
7
10
t r
h.
v + w × 3 + 8
9
3
6
11
8
w v
Problem solving
Draw your own spider diagram where a = b + 7.
Draw your own spider diagram where a = b × 2 + 11

7/21/2019 Numeracy Gr 7
http://slidepdf.com/reader/full/numeracy-gr-7 22/166
20
89 Functions and relationships
Term3
Week2
Discuss this:
The rule is y = x + 5
x 1 2 3 10 100
y 6 7 8 15 105
y = 1 + 5= 6
y = 2 + 5= 7
y = 3 + 5= 8
y = 10 + 5= 15
y = 100 + 5= 105
1. Complete the table below
a. x = y + 2
Example: See introduction
b. a = b + 7
x 2 4 6 8 10 20
y
b 1 2 3 4 5 10
a
c. m = n + 4 d. x = z × 2
n3 4 5 6 7 10 100
m
z2 3 4 5 6 7
x
e. y = 2 y - 2 f. m = 3n + 2
x 1 2 3 4 5 6 7
y
n 1 5 10 20 25 100
m
1. What is the value of m and n?
Example:x 1 2 3 4 18 m 51
y 8 9 10 11 25 39 n
y = x + 7
y = 51 + 7
y = 58
n = 58
y = x + 7
39 = x + 7
39 - 7 = x + 7 - 7
32 = x
m = 32
Rule: the given
term plus 7
n = 58 and m = 32

7/21/2019 Numeracy Gr 7
http://slidepdf.com/reader/full/numeracy-gr-7 23/166
21
a.x 1 2 3 4 25 m 51
y 10 11 11 13 n 39 60
m n
b.x 1 2 3 4 m 30 60
y 2 4 6 8 22 n 120
m n
c.x 1 2 3 4 10 15 m
y 5 10 15 20 50 n 90
m n
d.x 1 2 3 4 7 m 46
y 13 14 15 16 19 24 n
m n
e.x 1 2 3 4 6 10 m
y 3 6 9 12 18 n 60
m n
Problem solving
• What is the tenth pattern? (3 × 7, 4 × 7, 5 × 7, …)
• If (x = 2 y + 9 and y = 2, 3, 4, 5, 6), draw a table to show it.

7/21/2019 Numeracy Gr 7
http://slidepdf.com/reader/full/numeracy-gr-7 24/166
22
What is on the left-handside of the equal sign?
5 + 4
90 Algebraic expressions andequations
T e r m 3 - W e e k 2
Compare the two examples. What do you
notice?
5 + 4 = 9
What is on theright-hand side?
The left-hand side is anexpression, 5 + 4, that isequal to the value on the
right-hand side, 9.
5 + 4 = 9 is called anequation. The left-handside of an equation is
equal to the right-handside.
An equation isa mathematical
sentence that usesthe equal sign (=)to show that two
expressions areequal.
1. Say if it is an expression or an equation.
a. 4 + 8 b. 9 + 7 = 16 c. 7 + 6 =
Example: 8 + 3 (It is an expression)
8 + 3 = 11 (It is an equation)
d. 3 + 5 = 8 e. 11 + 2 = f. 9 + 7 =
2. Describe the following.
a. 9 + 1 = 10 b. 3 + 5 = 8 c. 9 = 5 + 4
Example: 6 + 2 = 8
This is an expression, 6 + 2, that is equal to the value on the right-hand side, 8.
6 + 2 = 8 is called an equation. The left-hand side of an equation equals the right-hand side.
7/21/2019 Numeracy Gr 7
http://slidepdf.com/reader/full/numeracy-gr-7 25/166
23
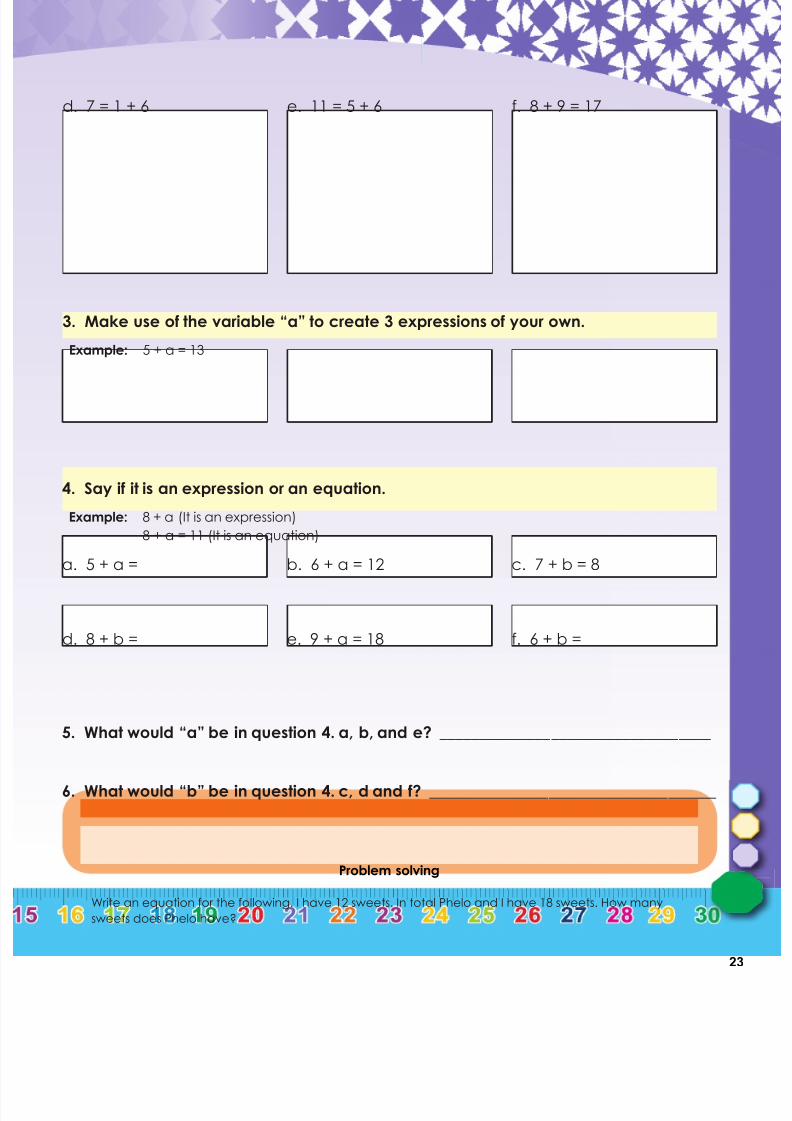
d. 7 = 1 + 6 e. 11 = 5 + 6 f. 8 + 9 = 17
3. Make use of the variable “a” to create 3 expressions of your own.
Example: 5 + a = 13
4. Say if it is an expression or an equation.
a. 5 + a = b. 6 + a = 12 c. 7 + b = 8
Example: 8 + a (It is an expression)
8 + a = 11 (It is an equation)
d. 8 + b = e. 9 + a = 18 f. 6 + b =
5. What would “a” be in question 4. a, b, and e? __________________________________
6. What would “b” be in question 4. c, d and f? ____________________________________
Problem solving
Write an equation for the following. I have 12 sweets. In total Phelo and I have 18 sweets. How many
sweets does Phelo have?

7/21/2019 Numeracy Gr 7
http://slidepdf.com/reader/full/numeracy-gr-7 26/166
24
91 Algebraic expressions
Term3
Week3
a. 3; 6; 9; 12; ... b. 10; 20; 30; 40; ... c. 7; 14; 21; 28; ...
1. Describe the following in words.
1, 3, 5, 7, 9 …
Describe the rule of this number sequence in words.
What does the rule 2n - 1 mean for the number sequence 1, 3, 5, 7, 9, …?
Example: 4, 8, 12, 16, 20, …
Adding 4 to the previous pattern
Adding 2 to the
previous term.
Position in sequence 1 2 3 4 5 n
Term 1 3 5 7 9
What is the rule as
an expression?
1st term:
2(1) - 1
2nd term:
2(2) - 1
3rd term:
2(3) - 1
4th term:
2(4) - 1
5th term:
2(5) - 1
nth term:
2(n) - 1
2(n) - 1
d. 6; 12; 18; 24; ... e. 8; 16; 24; 32; ... f. 5; 10; 15; 20; ...
2. Describe the following sequence using an expression.
Example: 4, 8, 12, 16, 20, …
Position in sequence 1 2 3 4 5 n
Term 4 8 12 16 20
First term: 3(1) + 1
a. 6; 11; 16; 21; ...
Position in sequence 1 2 3 4 5 n
Term
7/21/2019 Numeracy Gr 7
http://slidepdf.com/reader/full/numeracy-gr-7 27/166
25
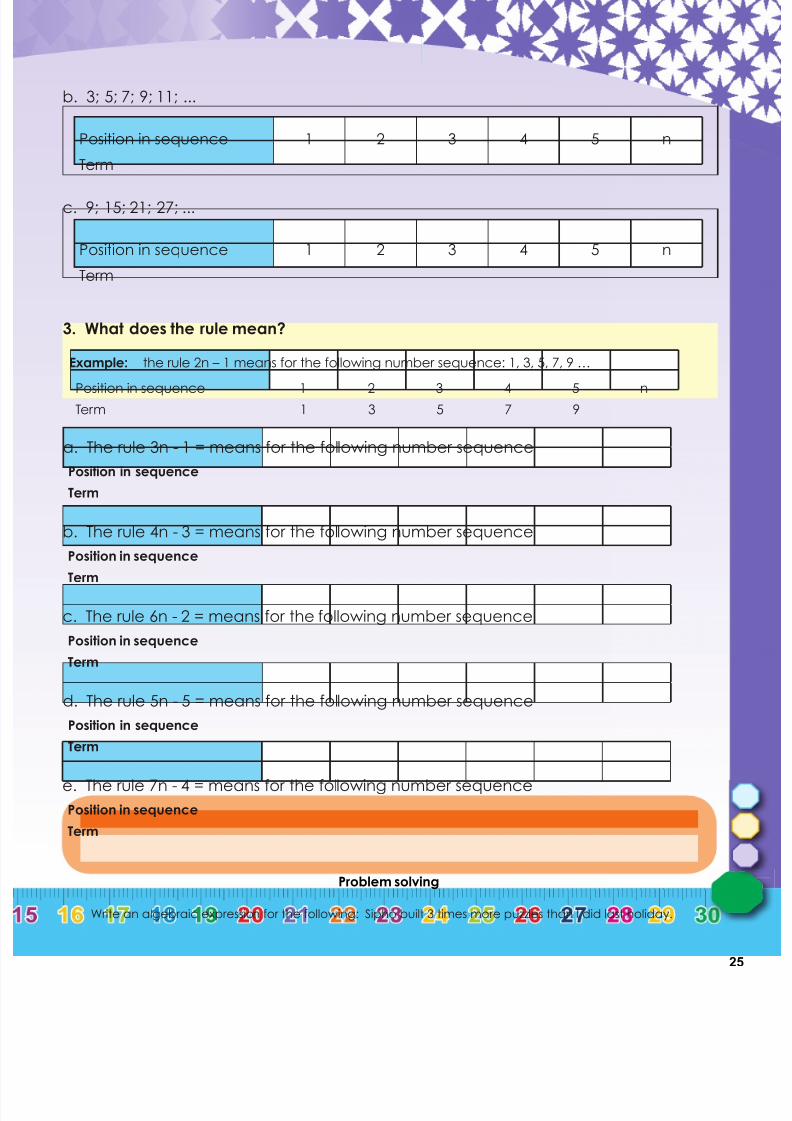
b. 3; 5; 7; 9; 11; ...
Position in sequence 1 2 3 4 5 n
Term
c. 9; 15; 21; 27; ...
Position in sequence 1 2 3 4 5 n
Term
3. What does the rule mean?
Example: the rule 2n – 1 means for the following number sequence: 1, 3, 5, 7, 9 …
Position in sequence 1 2 3 4 5 n
Term 1 3 5 7 9
Position in sequence
Term
a. The rule 3n - 1 = means for the following number sequence
Position in sequence
Term
b. The rule 4n - 3 = means for the following number sequence
Position in sequence
Term
c. The rule 6n - 2 = means for the following number sequence
Position in sequence
Term
d. The rule 5n - 5 = means for the following number sequence
Position in sequence
Term
e. The rule 7n - 4 = means for the following number sequence
Problem solving
Write an algebraic expression for the following: Sipho built 3 times more puzzles than I did last holiday.

7/21/2019 Numeracy Gr 7
http://slidepdf.com/reader/full/numeracy-gr-7 28/166
26
92 More algebraic expressions
Term3
Week3
Describe the ruleof this number
sequence inwords.
What does the rule4n + 1 mean for thenumber sequence
5, 9, 13, 17, 21, …
First term: 4(1) + 1
Second term: 4(2) + 1
Third term: 4(3) + 1
Fourth term: 4(4) + 1
Fifth term: 4(5) + 1
nth term: 4(n) + 1
The rule as anexpression
Adding 2 to theprevious term.5, 9, 13, 17, 21, …
a. 3; 5; 7; 9; … b. 5; 10; 15; 20; … c. 21; 18; 15; 12; …
1. Describe the following in words.
Example: 2, 6 10, 14, 18, …
Adding 4 to the previous number.
d. 99; 98; 97; 96; … e. 4; 8; 12; 16; … f. 7; 14; 21; 28; …
a. 2; 4; 5; 6; 10; … b. 3; 5; 7; 9; 11; …
2. Describe the following sequence using an expression.
Example: 2, 6, 10, 14, 18,…
First term: 4(1) - 2
c. 8; 16; 24; 32; … d. 5; 10; 15; 20; …
7/21/2019 Numeracy Gr 7
http://slidepdf.com/reader/full/numeracy-gr-7 29/166
27
Problem solving
Expand the following and prove your answer by factorising. 2( p3 + 8 p2 - 5 p)
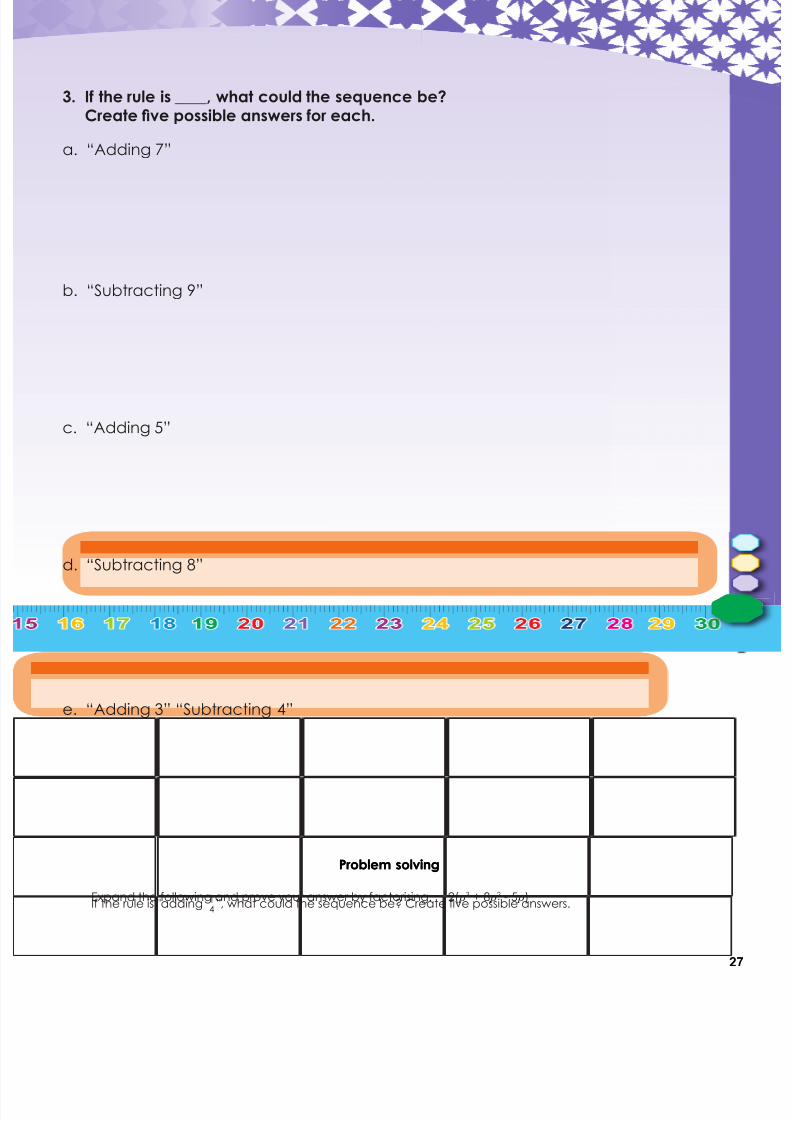
Problem solving
If the rule is "adding 14
", what could the sequence be? Create five possible answers.
3. If the rule is ____, what could the sequence be? Create five possible answers for each.
a. “Adding 7”
b. “Subtracting 9”
c. “Adding 5”
d. “Subtracting 8”
e. “Adding 3” “Subtracting 4”
7/21/2019 Numeracy Gr 7
http://slidepdf.com/reader/full/numeracy-gr-7 30/166
28
93 More algebraic expressions
Term3
Week3
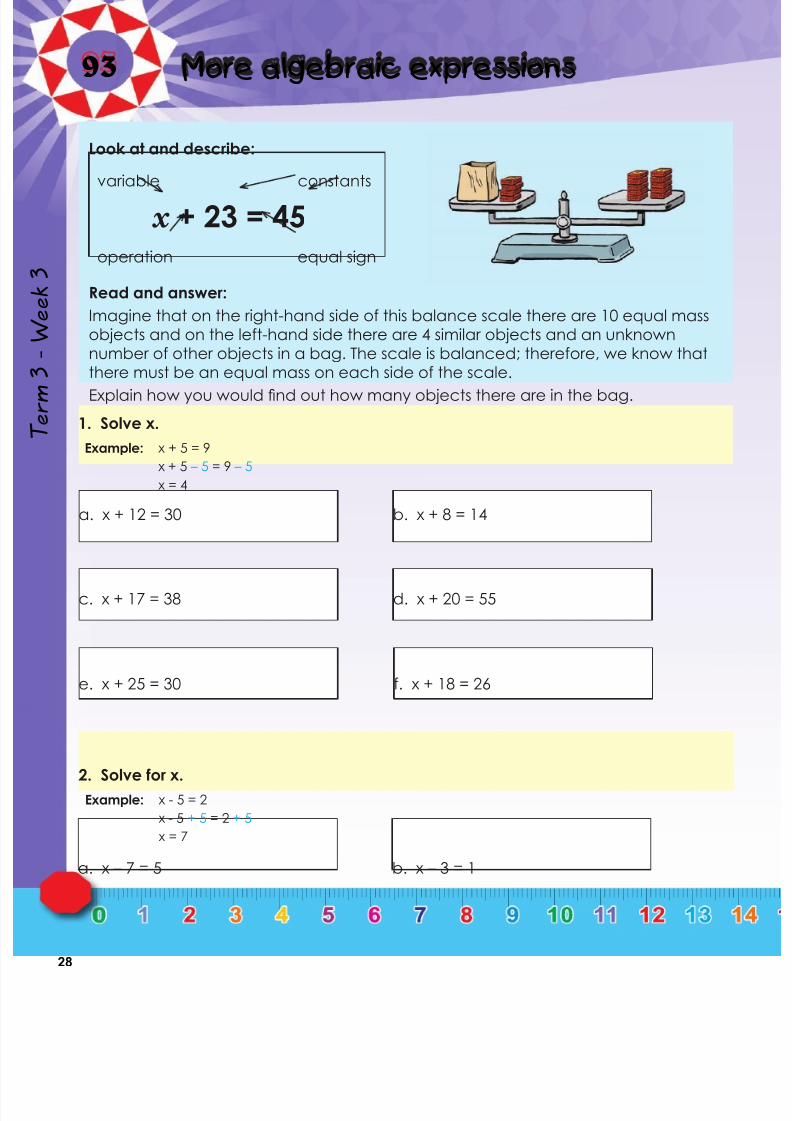
Look at and describe:
Read and answer:
Imagine that on the right-hand side of this balance scale there are 10 equal massobjects and on the left-hand side there are 4 similar objects and an unknownnumber of other objects in a bag. The scale is balanced; therefore, we know thatthere must be an equal mass on each side of the scale.
Explain how you would find out how many objects there are in the bag.
a. x + 12 = 30 b. x + 8 = 14
1. Solve x.
Example: x + 5 = 9
x + 5 – 5 = 9 – 5
x = 4
variable constants
operation equal sign
x + 23 = 45
c. x + 17 = 38 d. x + 20 = 55
e. x + 25 = 30 f. x + 18 = 26
a. x – 7 = 5 b. x – 3 = 1
2. Solve for x.
Example: x - 5 = 2
x - 5 + 5 = 2 + 5
x = 7

7/21/2019 Numeracy Gr 7
http://slidepdf.com/reader/full/numeracy-gr-7 31/166
29
Problem Solving
Jason read 7 books and Gugu read 11 books. How many books did they read altogether?
Rebecca and her friend read 29 books altogether. Rebecca read 14 books. How many books did her
friend read?
Bongani buys 12 new CDs and Sizwe buys 14. How many CDs did they buy together.
Write an equation for the following and solve it.
c. x – 15 = 12 d. x – 17 = 15
e. x – 23 = 20 f. x – 28 = 13
a. x + 3 = -15 b. x + 7 = -12
3. Solve for x.
Example: x + 4 = -7
x + 4 - 4 = - 7 - 4
x = -11
c. x + 2 = -5 d. x + 5 = -15
e. x + 12 = -20 f. x + 10 = -25
7/21/2019 Numeracy Gr 7
http://slidepdf.com/reader/full/numeracy-gr-7 32/166
30
94 More algebraic equations
Term3
Week3
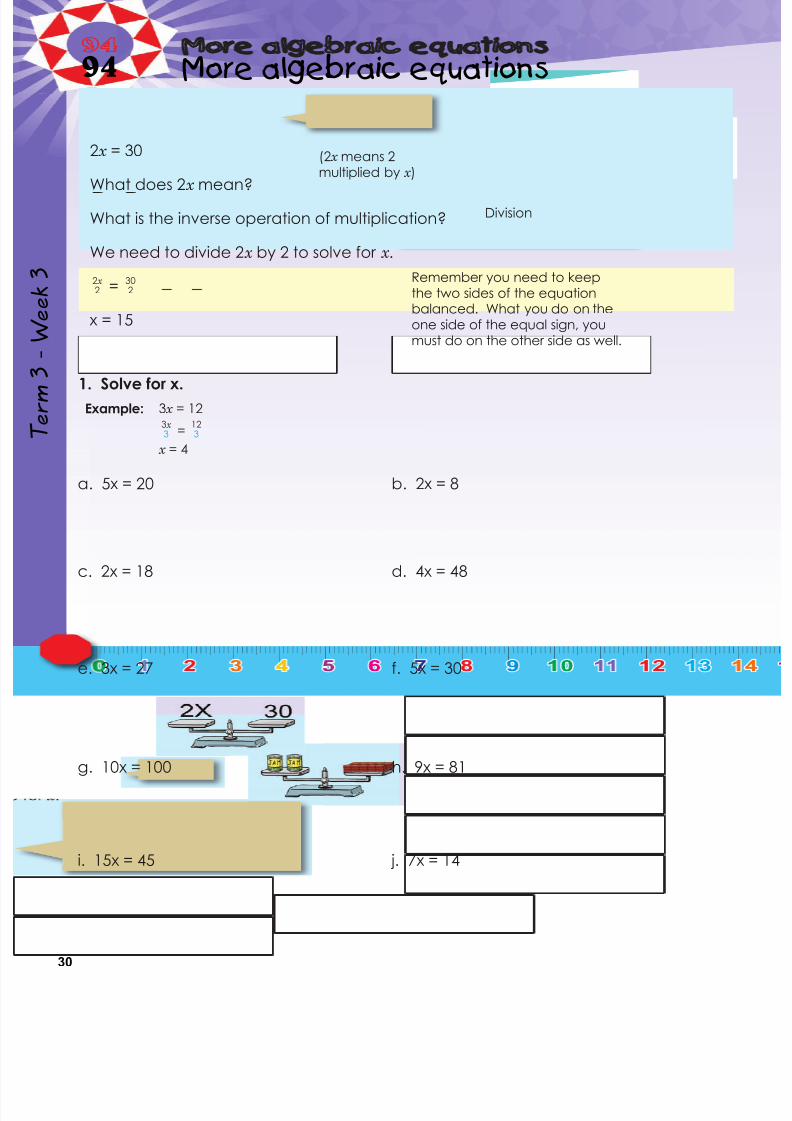
2x = 30
What does 2x
mean?
What is the inverse operation of multiplication?
We need to divide 2x by 2 to solve for x .
2x
2 =302
x = 15
a. 5x = 20 b. 2x = 8
1. Solve for x.Example: 3x = 12
3x
3 =123
x = 4
(2x means 2multiplied by x )
Remember you need to keepthe two sides of the equationbalanced. What you do on theone side of the equal sign, youmust do on the other side as well.
Division
c. 2x = 18 d. 4x = 48
e. 3x = 27 f. 5x = 30
g. 10x = 100 h. 9x = 81
i. 15x = 45 j. 7x = 14

7/21/2019 Numeracy Gr 7
http://slidepdf.com/reader/full/numeracy-gr-7 33/166
31
Problem Solving
Two times y equalssixteen.
a. 7x - 2 = 12 b. 4x - 4 = 12
2. Solve for x.
Example: 3x - 2 = 10
3x - 2 + 2 = 10 + 2
3x
3 =123
x = 4
c. 3x – 1 = 2 d. 2x – 1 = 7
e. 5x – 3 = 17 f. 5x – 7 = 13
g. 6x – 5 = 25 h. 9x – 8 = 82
i. 8x – 7 = 49 j. 3x – 2 = 16
Create an equation and solve it. How fast can you do it?
Sixteen times bequals four.
Nine times q equalseighty one.
Five times c equals
sixty three.
Eight times t equals
eighty.
Five times y equals
hundred.
Eight times x equals
sixteen.
Three times d
equals thirty nine.
Seven times aequals twenty one.

7/21/2019 Numeracy Gr 7
http://slidepdf.com/reader/full/numeracy-gr-7 34/166
32
95 Algebraic equations in context
Term3
Week3
What do the following equations mean?
a. y = x 2 + 2; x = 4 b. y = b2 + 10; b = 1
1. Solve for x.
Example: If y = x 2 + 2, calculate y when x = 4
y = 42 + 2
y = 16 + 2
y = 18
The perimeter ofa square is 4 timesthe length.
c. y = a2 + 4; a = 4 d. y = r2 + 3; r = 5
e. y = p2 + 7; p = 6 f. y = c2 + 7; c = 7
P = 4l P = 2l + 2b A = l2 A = l × b
The perimeter of arectangle is 2 timesthe length plus 2times the breadth.
The area of asquare is the lengthsquared.
The area of arectangle is lengthtimes breadth.
Note that you did perimeterand area in the previous terms
2. Calculate the following:
Example: What is the perimeter of a rectangle if the length is 2cm and the breath is 1,5cm?
P = 2l + 2b
P = 2(2cm) + 2(1,5 cm)
P = 4cm + 3cm
P = 7cm
7/21/2019 Numeracy Gr 7
http://slidepdf.com/reader/full/numeracy-gr-7 35/166
33
Problem Solving
What is the perimeter of the swimming pool if the breadth is 12 m and the length is 16 m.
Work out the area of a square if the one side is equal to 5,2 cm.
What is the perimeter of a rectangle if the length is 5,1cm and the breadth is 4,9cm.
Write an equation and then solve it for each of these.
Establish the area of your bedroom floor for new tiles the length is 4,5 m and the breadth is 2,8 m.
a. The perimeter of a rectanglewhere the breadth equals 2,2 cmand the length equals 2,5 cm
b. The area of a squareif the breadth equals3,5 cm.
c. The perimeter of a square if thebreadth equals 4,2 cm.
d. The area of a rectangle if the length is3,5 cm and breadth is 2,5 cm
e. The area of a square if the length is
5 cm.
f. The perimeter of a rectangle if the
breadth is 4,3 cm and length is 8,2 cm.
g. The perimeter of a square if thelength is 2,6 cm.
h. The perimeter of a rectangle if thebreadth is 8,5 cm and the length is12,4. cm.
i. The area of a rectangle if the breadthis 10,5 cm and length is 15,5 cm.
h. The perimeter of a rectangle if thebreadth is 3.5 cm and the length is6,7 cm

7/21/2019 Numeracy Gr 7
http://slidepdf.com/reader/full/numeracy-gr-7 36/166
34
96 Interpreting graphs: temperature andtime graphs
Term3
Week4
Look at the graph and talk about it.
Would you make
any changes oradd anything to
the graph?
Temperature for our town
Cricket chirps per minute
Title
y-axis x-axis
1. Thebogo heard that nature lovers use the chirping of crickets to estimate thetemperature. The last time he went camping he brought a thermometer so hecould collect the data on the number of cricket chirps per minute for various
temperatures. The first thing Thebogo did was make the graph below.
16 18 20 22 24 26 28 30 32 34
240
260
220
200
180
160
140
280
120
100
C h i r p s p e r m i n u t
e
Temperature (ºC)
7/21/2019 Numeracy Gr 7
http://slidepdf.com/reader/full/numeracy-gr-7 37/166
35
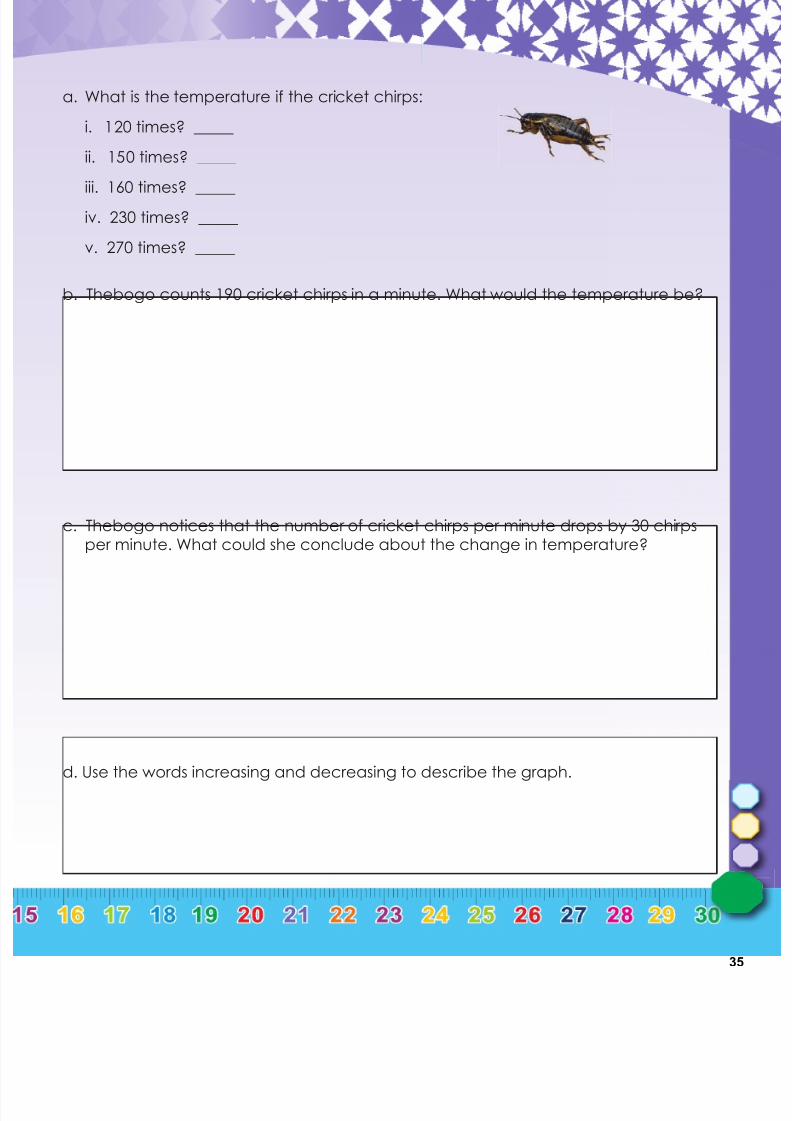
a. What is the temperature if the cricket chirps:
i. 120 times? _____
ii. 150 times? _____
iii. 160 times? _____
iv. 230 times? _____
v. 270 times? _____
b. Thebogo counts 190 cricket chirps in a minute. What would the temperature be?
c. Thebogo notices that the number of cricket chirps per minute drops by 30 chirpsper minute. What could she conclude about the change in temperature?
d. Use the words increasing and decreasing to describe the graph.
7/21/2019 Numeracy Gr 7
http://slidepdf.com/reader/full/numeracy-gr-7 38/166
36
96b Interpreting graphs: temperature andtime graphs continued
Term3
Week4
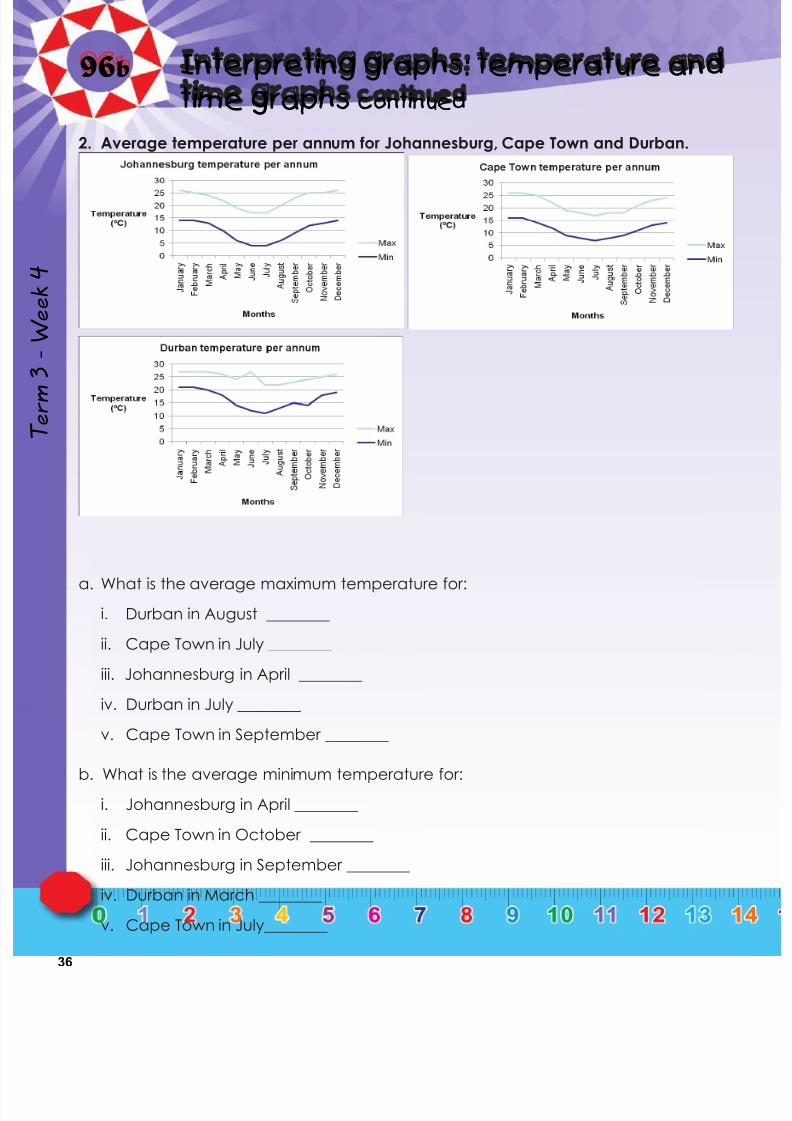
2. Average temperature per annum for Johannesburg, Cape Town and Durban.
a. What is the average maximum temperature for:
i. Durban in August ________
ii. Cape Town in July ________
iii. Johannesburg in April ________
iv. Durban in July ________
v. Cape Town in September ________
b. What is the average minimum temperature for:
i. Johannesburg in April ________
ii. Cape Town in October ________
iii. Johannesburg in September ________
iv. Durban in March ________
v. Cape Town in July________
7/21/2019 Numeracy Gr 7
http://slidepdf.com/reader/full/numeracy-gr-7 39/166
37
c. What is the difference in maximum temperature between:
i. Durban and Johannesburg in April ________
ii. Cape Town and Durban in October ________
iii. Johannesburg and Cape Town in May ________ iv. Durban and Johannesburg in September ________
v. Cape Town and Johannesburg in April ________
Problem solving
Expand the following and prove your answer by factorising. 2( p3 + 8 p2 - 5 p)
Problem solving
What is the difference between the minimum and maximum temperatures of Durban, Cape Town andJohannesburg in December? Which province would you most like to visit in December. Why?
d. Describe the graphs using the words increasing and decreasing.
7/21/2019 Numeracy Gr 7
http://slidepdf.com/reader/full/numeracy-gr-7 40/166
38
97 Interpreting graphs: rainfall and timegraphs
Term3
Week4
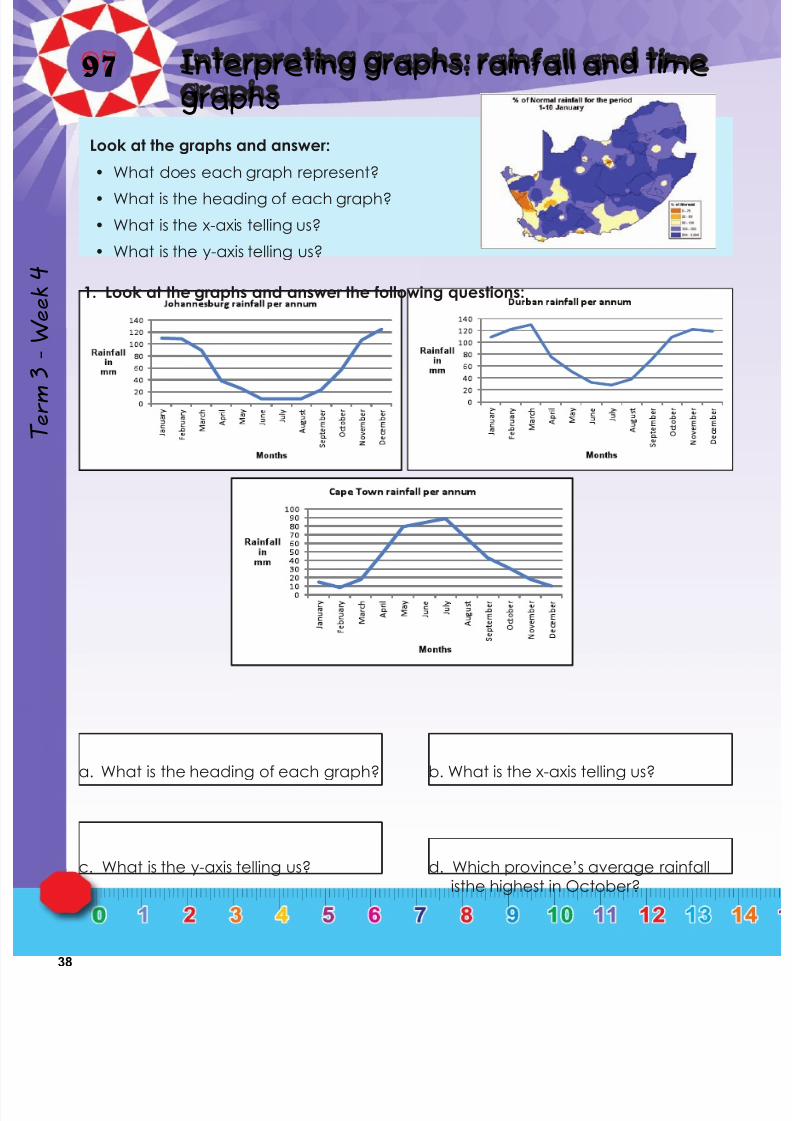
Look at the graphs and answer:
• What does each graph represent?
• What is the heading of each graph?
• What is the x-axis telling us?
• What is the y-axis telling us?
1. Look at the graphs and answer the following questions:
a. What is the heading of each graph?
c. What is the y-axis telling us?
b. What is the x-axis telling us?
d. Which province’s average rainfall
isthe highest in October?

7/21/2019 Numeracy Gr 7
http://slidepdf.com/reader/full/numeracy-gr-7 41/166
39
2. Use the graphs to complete the following tables.
e. Which province’s average rainfall isthe lowest in April?
g. Which province will you not visit inDecember? Why?
i. Which province(s) have a summer rainy
season? Why do you say so?
f. Which province will you visit inDecember? Why?
h. Which province(s) have a winter rainyseason? Why do you say so?
j. Use the words increasing and
decreasing to describe each graph.
Problem solving
Expand the following and prove your answer by factorising. 2( p3 + 8 p2 - 5 p)
What is our weather?
What is the highest rainfall per year for your town? Which month? Keep a record during a rainy monthand draw a graph.
Months Average rainfall
Johannesburg Durban Cape Town

7/21/2019 Numeracy Gr 7
http://slidepdf.com/reader/full/numeracy-gr-7 42/166
40
98 Drawing graphs
Term3
Week4
Sam kept this record of plants growing. Discuss.
Would you make
any changes oradd anything to
the graph?
Is this graph:decreasing orincreasing?
Plant group
Amount of light per day (hours)
A v e r a g e g r o w t h i n o n e w e e k ( c m )
an group
1 2 3 4 5 6 7 8 9 10
8
9
7
6
5
4
3
10
2
1
1 2 3 4 5 6 7 8 9 10
160
180
140
120
100
80
60
200
40
20
0
b. How far will a snail move in four hours?
How did you use the graph to workthis out?
a. How far will a snail move in eighthours?
c. How far will a snail move in six hours?How did you use the graph to work
this out?
d. How far will a snail move in two hours?
How did you use the graph to workthis out?
f. Why is this a linear graph?g. Is this graph increasing or decreasing?
e. How far will a snail move in 9 hours?How did you use the graph to work
this out? Plot this on the graph.
Time (hours)
Movement of a snail
D i s t a n c e ( c
m )
1. Answer the following questions on the movement of a snail.
Linear equation:The graph from alinear equation isa straight line.
7/21/2019 Numeracy Gr 7
http://slidepdf.com/reader/full/numeracy-gr-7 43/166
41
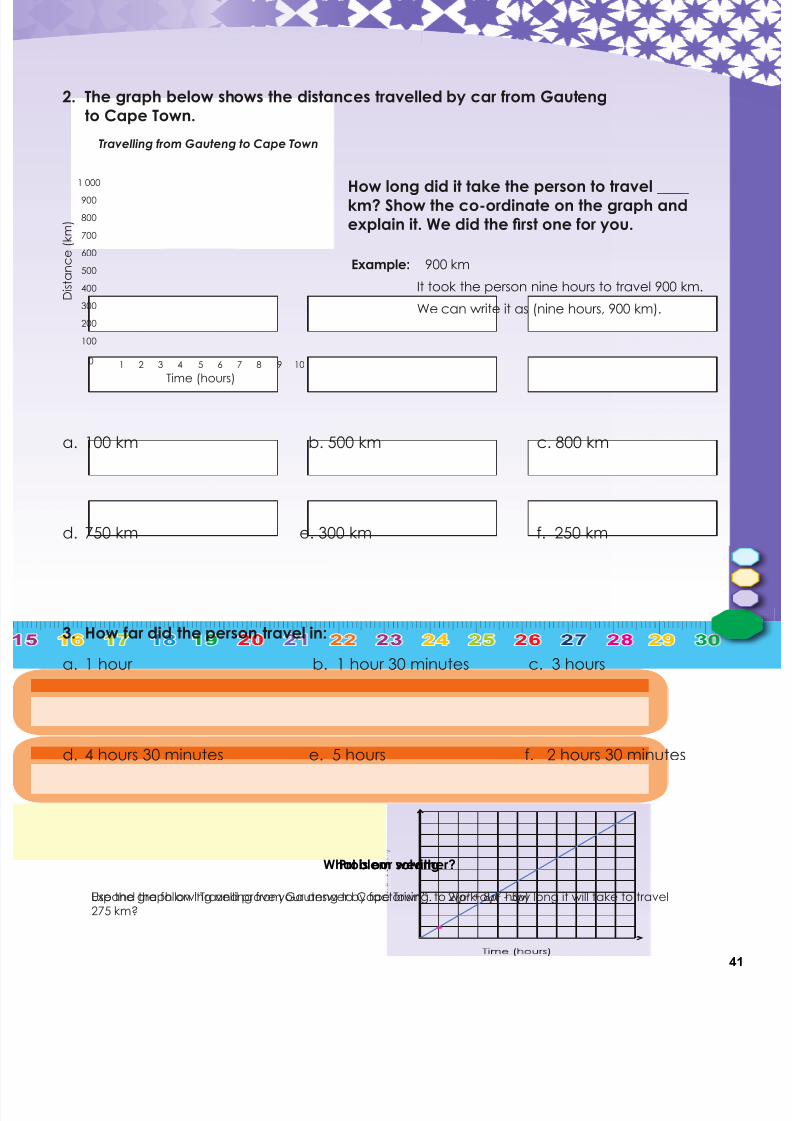
a. 100 km b. 500 km c. 800 km
d. 750 km e. 300 km f. 250 km
a. 1 hour b. 1 hour 30 minutes c. 3 hours
d. 4 hours 30 minutes e. 5 hours f. 2 hours 30 minutes
2. The graph below shows the distances travelled by car from Gautengto Cape Town.
3. How far did the person travel in:
How long did it take the person to travel ____km? Show the co-ordinate on the graph andexplain it. We did the first one for you.
Time (hours)
Travelling from Gauteng to Cape Town
D i s t a n c e ( k m )
1 2 3 4 5 6 7 8 9 10
800
900
700
600
500
400
300
1 000
200
100
0
Problem solving
Expand the following and prove your answer by factorising. 2( p3 + 8 p2 - 5 p)
What is our weather?
Use the graph on “Travelling from Gauteng to Cape Town” to work out how long it will take to travel275 km?
Example: 900 km
It took the person nine hours to travel 900 km.
We can write it as (nine hours, 900 km).

7/21/2019 Numeracy Gr 7
http://slidepdf.com/reader/full/numeracy-gr-7 44/166
42
99 Drawing graphs
Term3
Week4
You kept this record but forgot to plot the minimum temperature. Plot it using the
information from your notes.Average maximum temperature for our town
Months
T e m p
e r a t u r e ( º C )
J F M A M J A S O N
30
25
20
15
10
5
J D
Average minimum temperature for our town
Months
T e m p e r a t u r e ( º C )
Ja n u a r
y :
20 ¡C
F e b r u a r y : 1 9 ¡ C
March: 15¡C
A u g u s t : 6 ¡ C
September:9¡C
No ve m be r : 1 5
¡ C
December: 18¡C
October:12¡C
July: 4¡C
A p r i l : 1 2 ¡ C Ma y: 10 ¡C
J u n e : 5 ¡ C
1. Answer the questions on the graph.
0
2
4
6
8
1012
14
16
18
20
22
24
J F M A M J J A S O N D

7/21/2019 Numeracy Gr 7
http://slidepdf.com/reader/full/numeracy-gr-7 45/166
43
a. What is the heading of the graph?
b. What is the scale on the x-axis?
c. What is the scale on the y-axis?
d. What is the x-axis telling us?
e. What is the y-axis telling us?
f. What are the points or dots telling us?
continued☛

7/21/2019 Numeracy Gr 7
http://slidepdf.com/reader/full/numeracy-gr-7 46/166
44
99b Drawing graphs continued
Term3
Week4
2. Use the grid paper on the next page to draw a graph for this table.
Month Maximum Minimum
J 30 16
F 29 17
M 28 14
A 26 12
M 24 8
J 21 6
J 21 5
A 22 6
S 24 8
O 25 12
N 26 13
D 28 15
Use the entiresheet to drawyour graph.
You shoulddetermine your
intervals carefully.
a. What will be written on your x-axis?
c. What will the scale of the y-axis be?
e. What will your graph show ?
b. Will be written on your y-axis?
d. What will the heading of your
graph be?
f. Describe the graph using thefollowing words: increasing,
decreasing, linear and non-linear.
7/21/2019 Numeracy Gr 7
http://slidepdf.com/reader/full/numeracy-gr-7 47/166
45
Problem solving
Expand the following and prove your answer by factorising. 2( p3 + 8 p2 - 5 p)
Research
Draw a graph showing the maximum and minimum temperatures annually for any other country thanSouth Africa.
7/21/2019 Numeracy Gr 7
http://slidepdf.com/reader/full/numeracy-gr-7 48/166
46
100 Drawing graphs
Term3
Week4
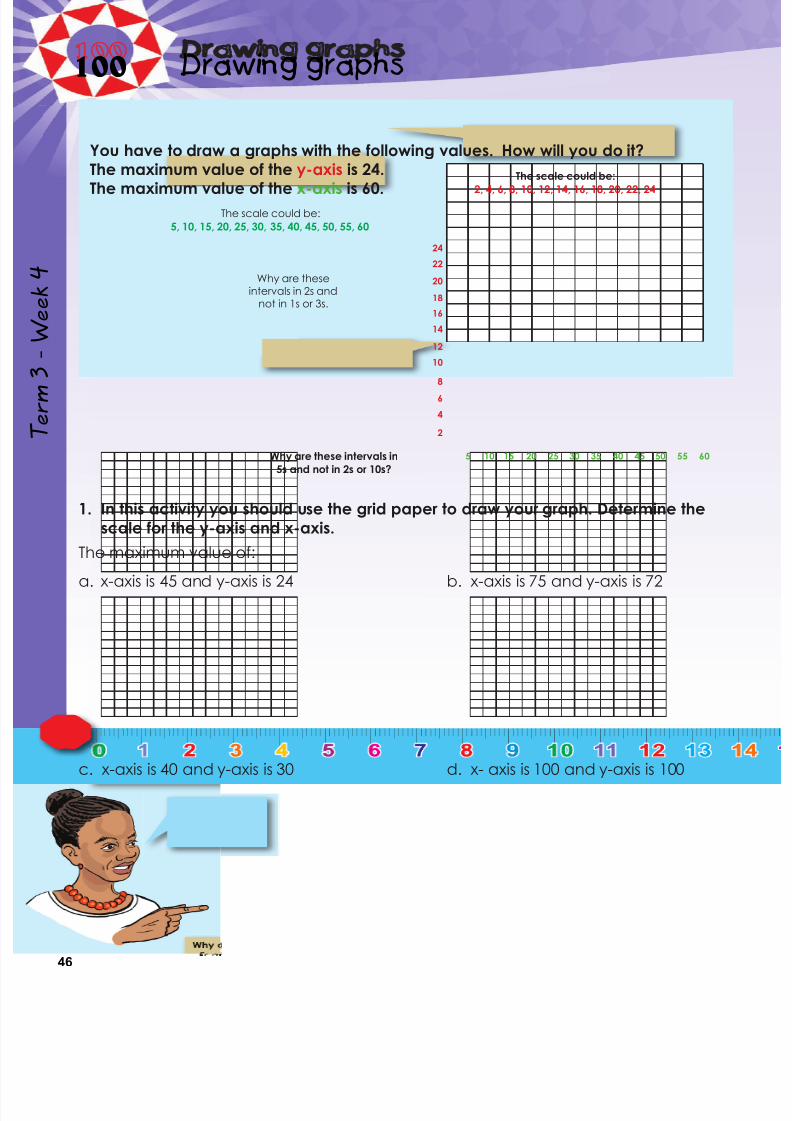
You have to draw a graphs with the following values. How will you do it?The maximum value of the y-axis is 24.
The maximum value of the x-axis is 60.
2
5 10 2015 25 30 35 40 45 50 55 60
4
6
8
18
16
14
12
10
20
22
24
Why are these intervals in
5s and not in 2s or 10s?
The scale could be:
5, 10, 15, 20, 25, 30, 35, 40, 45, 50, 55, 60
The scale could be:
2, 4, 6, 8, 10, 12, 14, 16, 18, 20, 22, 24
Why are these
intervals in 2s and
not in 1s or 3s.
1. In this activity you should use the grid paper to draw your graph. Determine the
scale for the y-axis and x-axis.
The maximum value of:
a. x-axis is 45 and y-axis is 24
c. x-axis is 40 and y-axis is 30
b. x-axis is 75 and y-axis is 72
d. x- axis is 100 and y-axis is 100

7/21/2019 Numeracy Gr 7
http://slidepdf.com/reader/full/numeracy-gr-7 49/166
47
2. Draw the scales for the following graphs.
3. Cut and paste a graph from a newspaper. Describe the intervals.
a. x-axis: 0, 3, 6, 9, 12, 15 and
y-axis: 0, 5, 10, 15, 20, 25, 30
c. x-axis: 0, 5, 10, 15, 20, 25, 30, 35, 40 and
y-axis: 0, 20, 40, 60, 80, 100
b. x-axis: 0, 4, 8, 12 and
y-axis: 0, 10, 20, 30, 40, 50, 60
d. x-axis: 36, 48, 60, 72, 84 and
y-axis: 2, 4, 6, 8, 10, 12, 14, 16, 18, 20
Problem solving
Expand the following and prove your answer by factorising. 2( p3 + 8 p2 - 5 p)
Drawing graphs
Draw a graph with 10 intervals on the x-axis and 12 intervals on the y-axis. You can use any multiple tolabel it.

7/21/2019 Numeracy Gr 7
http://slidepdf.com/reader/full/numeracy-gr-7 50/166
48
101 Drawing graphs
Term3
Week5
1. Draw graphs from the following tables. Describe each graph using the wordsincreasing, decreasing, constant, linear and non-linear.
a. Thabo’s brisk walking results.
The time walked wasrecorded after 2, 4, 6, 8 and
10 km.
Look at the graphs. Explain them.
Increasing Decreasing Constant Linear Non-linear
Km Minutes
2 20
4 40
6 60
8 80
10 100
Can you get a non-linear increasing
graph?
Can you get a non-linear decreasing
graph?
7/21/2019 Numeracy Gr 7
http://slidepdf.com/reader/full/numeracy-gr-7 51/166
49
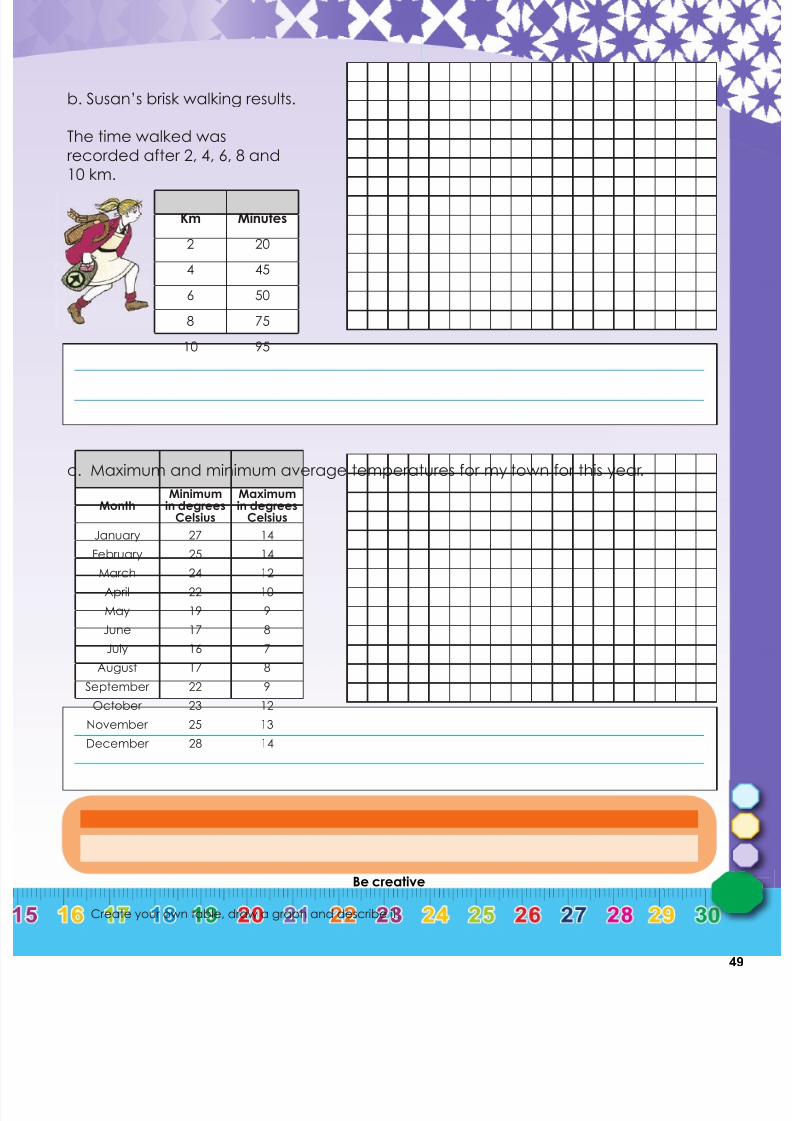
Be creative
Create your own table, draw a graph and describe it.
b. Susan’s brisk walking results.
c. Maximum and minimum average temperatures for my town for this year.
The time walked was
recorded after 2, 4, 6, 8 and10 km.
Km Minutes
2 20
4 45
6 50
8 75
10 95
MonthMinimum
in degreesCelsius
Maximumin degrees
Celsius
January 27 14
February 25 14
March 24 12April 22 10
May 19 9
June 17 8
July 16 7
August 17 8
September 22 9
October 23 12
November 25 13
December 28 14

7/21/2019 Numeracy Gr 7
http://slidepdf.com/reader/full/numeracy-gr-7 52/166
50
102 Transformations
Term3
Week5
a. b. b.
Explain each transformation
a.
b.
1. Tell how each figure was moved. Write translation, rotation, or reflection.
2. Label each shape as a translation, reflection or rotation.
Example:
Can you still
remember?
Translation Reflection Rotation
Rotation Translation Reflection

7/21/2019 Numeracy Gr 7
http://slidepdf.com/reader/full/numeracy-gr-7 53/166
51
Problem solving
Expand the following and prove your answer by factorising. 2( p3 + 8 p2 - 5 p)
Problem solving
Create a diagram using reflection, rotation and translation.
3. Create diagrams to show:
a. Rotation
b. Reflection
c. Translation
A rotation is atransformation that
moves points so that
they stay the same
distance from a fixed
point (the the centre
of rotation).
A translation is the
movement of an object
to a new position without
changing its shape, size or
orientation. When a shape
is transformed by sliding it
to a new position, without
turning, it is said to have
been translated.
A reflection is a
transformation that
has the same effect
as a mirror.
7/21/2019 Numeracy Gr 7
http://slidepdf.com/reader/full/numeracy-gr-7 54/166
52
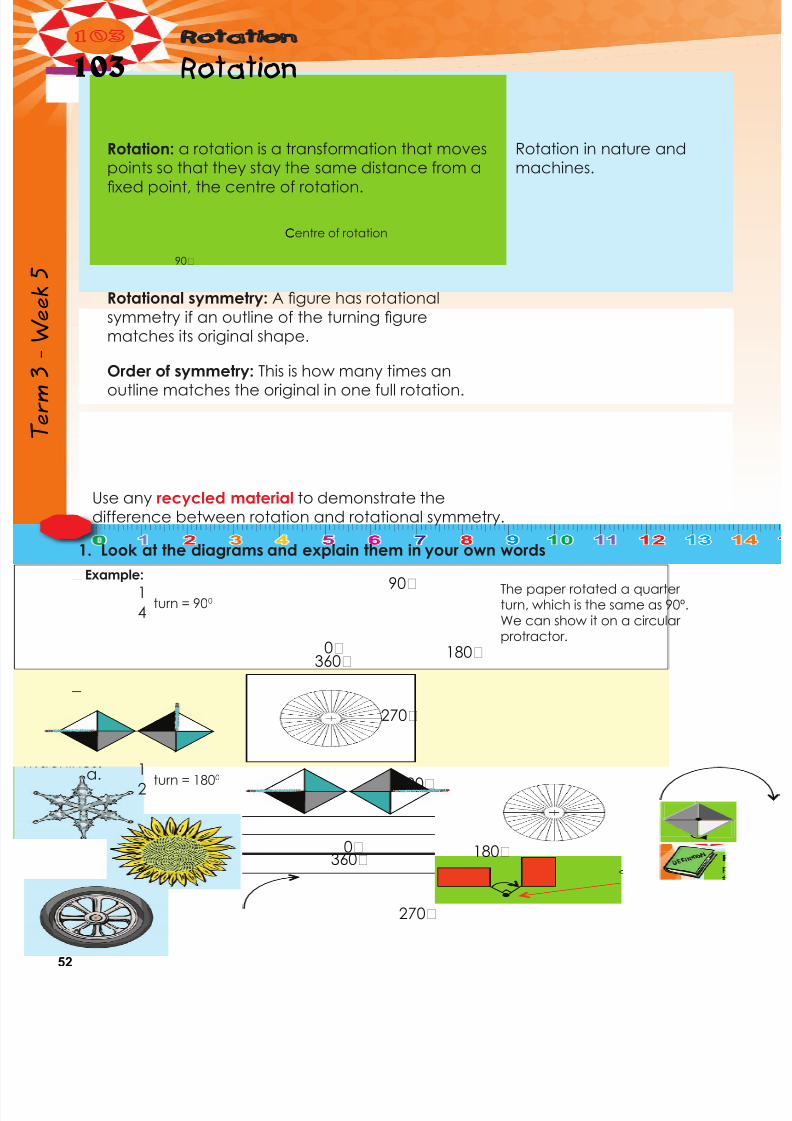
103 Rotation
Term3
Week5
Rotation: a rotation is a transformation that moves
points so that they stay the same distance from a
fixed point, the centre of rotation.
Rotation in nature and
machines.
Rotational symmetry: A figure has rotational
symmetry if an outline of the turning figurematches its original shape.
Order of symmetry: This is how many times an
outline matches the original in one full rotation.
Use any recycled material to demonstrate the
difference between rotation and rotational symmetry.
Centre of rotationC
90¡
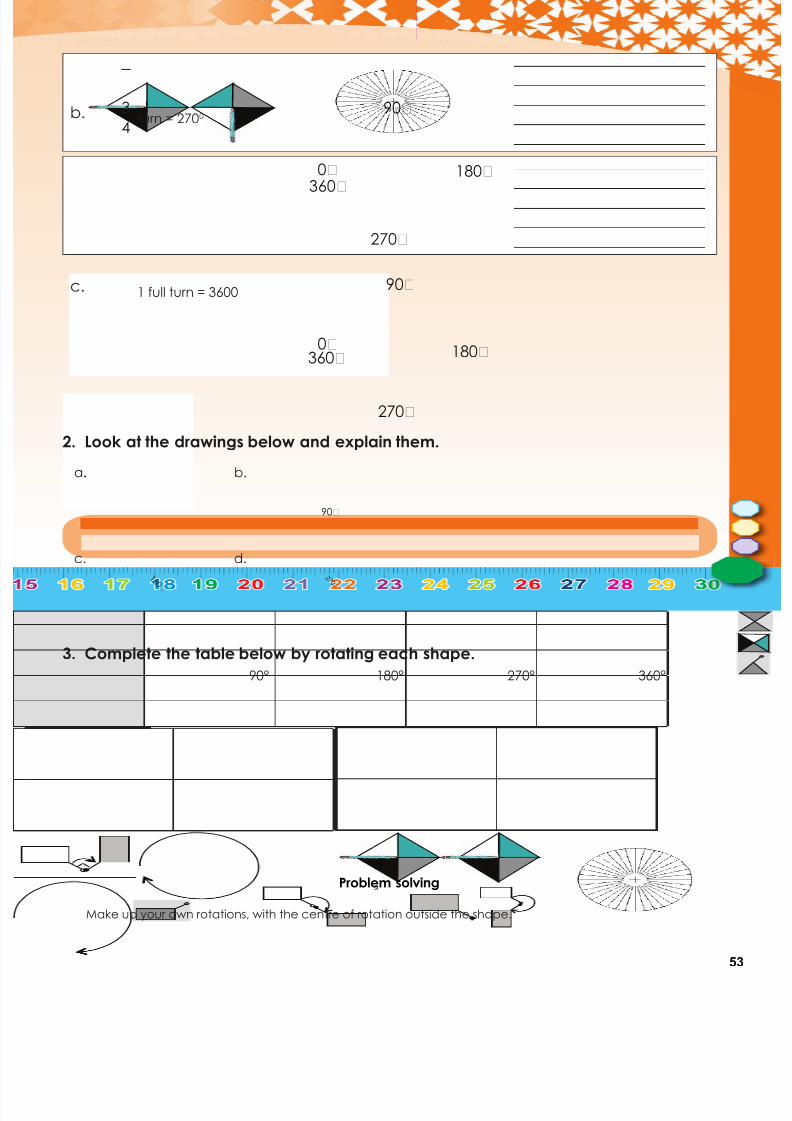
1. Look at the diagrams and explain them in your own words
Example:
turn = 900
turn = 1800
The paper rotated a quarter
turn, which is the same as 90º.We can show it on a circularprotractor.
1
4
12
0¡
90¡
180¡
270¡
360¡
a.
0¡
90¡
180¡
270¡
360¡
7/21/2019 Numeracy Gr 7
http://slidepdf.com/reader/full/numeracy-gr-7 55/166
53
Problem solving
Make up your own rotations, with the centre of rotation outside the shape.
2. Look at the drawings below and explain them.
3. Complete the table below by rotating each shape.
turn = 2700
1 full turn = 3600
3
4b.
c.
0¡
90¡
180¡
270¡
360¡
0¡
90¡
180¡
270¡
360¡
a. b.
c. d.
90° 180° 270° 360°
.
90¡
1 8 0 ¡
2 7 0 ¡
7/21/2019 Numeracy Gr 7
http://slidepdf.com/reader/full/numeracy-gr-7 56/166
54
104 Translation
Term3
Week5
a. b.
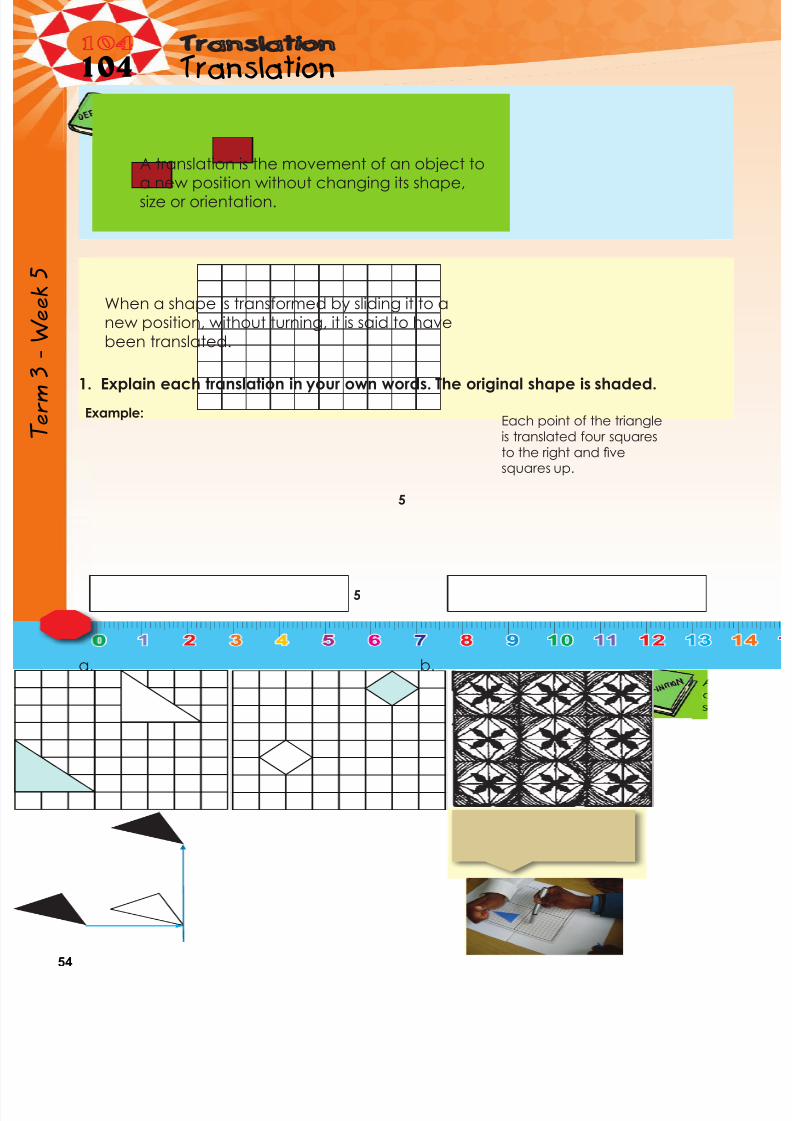
1. Explain each translation in your own words. The original shape is shaded.
Example:
A translation is the movement of an object toa new position without changing its shape,size or orientation.
When a shape is transformed by sliding it to anew position, without turning, it is said to have
been translated.
Each point of the triangleis translated four squaresto the right and fivesquares up.
5
5

7/21/2019 Numeracy Gr 7
http://slidepdf.com/reader/full/numeracy-gr-7 57/166
55
Problem solving
2. Show the following translations on a grid board.
3. In mathematics, the translation of an object is called its image. Describe the
translation below.
Find a translated pattern in nature and explain it in words.
image
object
4 cm
A B
C
DE
F
A B
C
DE
F
c. d.
a. Each point of the triangle istranslated four squares to theright and five squares up.
b. Each point of the rectangle istranslated three squares to theleft and three squares up.
c. Each point of the triangle is
translated five squares to theright and two squares down.
d. Each point of the square is
translated two squares to theright and seven squares up.
7/21/2019 Numeracy Gr 7
http://slidepdf.com/reader/full/numeracy-gr-7 58/166
56
105 Reflection and reflective symmetry
Term3
Week5
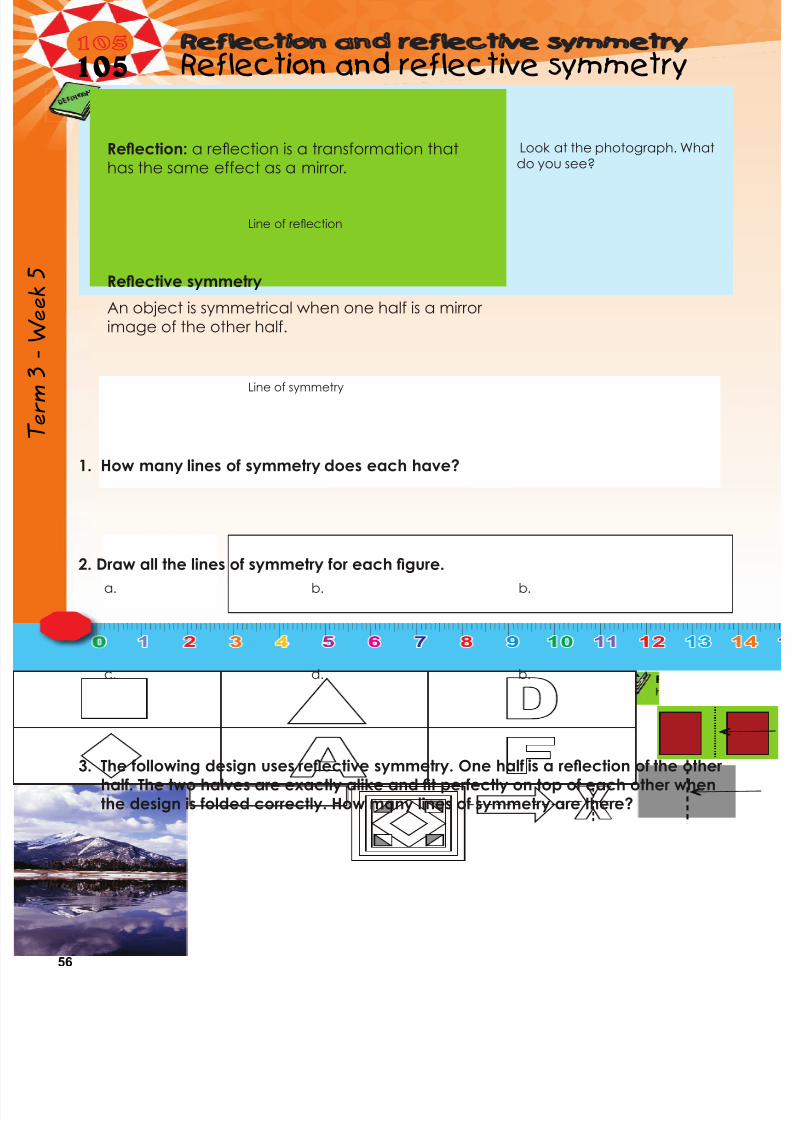
1. How many lines of symmetry does each have?
2. Draw all the lines of symmetry for each figure.
3. The following design uses reflective symmetry. One half is a reflection of the otherhalf. The two halves are exactly alike and fit perfectly on top of each other whenthe design is folded correctly. How many lines of symmetry are there?
Reflection: a reflection is a transformation that
has the same effect as a mirror.
Look at the photograph. Whatdo you see?
Reflective symmetry
An object is symmetrical when one half is a mirrorimage of the other half.
Line of reflection
Line of symmetry
a. b. b.
c. d. b.
7/21/2019 Numeracy Gr 7
http://slidepdf.com/reader/full/numeracy-gr-7 59/166
57
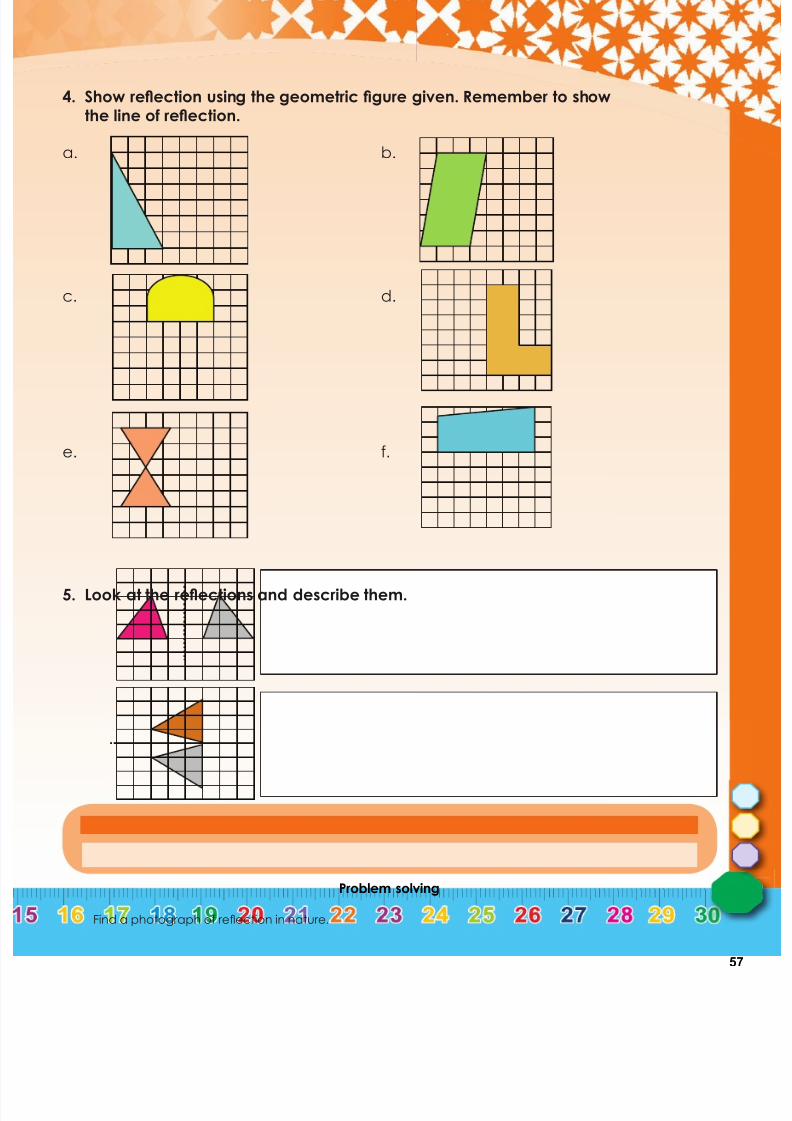
4. Show reflection using the geometric figure given. Remember to showthe line of reflection.
a.
c.
e.
b.
d.
f.
5. Look at the reflections and describe them.
Problem solving
Find a photograph of reflection in nature.

7/21/2019 Numeracy Gr 7
http://slidepdf.com/reader/full/numeracy-gr-7 60/166
58
106 Transformations
Term3
Week6
Copy each transformation on grid paper and then explain it in words.
Turn
Flip
Slide
Rotation
Reflection
Translation
Turning around a centre. The
distance from the centre to anypoint on the shape stays thesame. Every point makes a circlearound the centre (rotation).
It is a flip over a line. Every pointis the same distance from thecentre line. It has the same size as the original image. The shapestays the same (reflection).
It means moving without rotating,flipping or resizing. Every pointof the shape must move thesame distance and in the same direction (translation).
When a shape is reflectedin a mirror line, the reflection is thesame distance from the line ofreflection as the original shape.
1. Describe each diagram. Make use of words such as mirror, shape, original shape,line of reflection and vertical.
Reflection
a.
a.
b. c.
b.
c.
7/21/2019 Numeracy Gr 7
http://slidepdf.com/reader/full/numeracy-gr-7 61/166
59
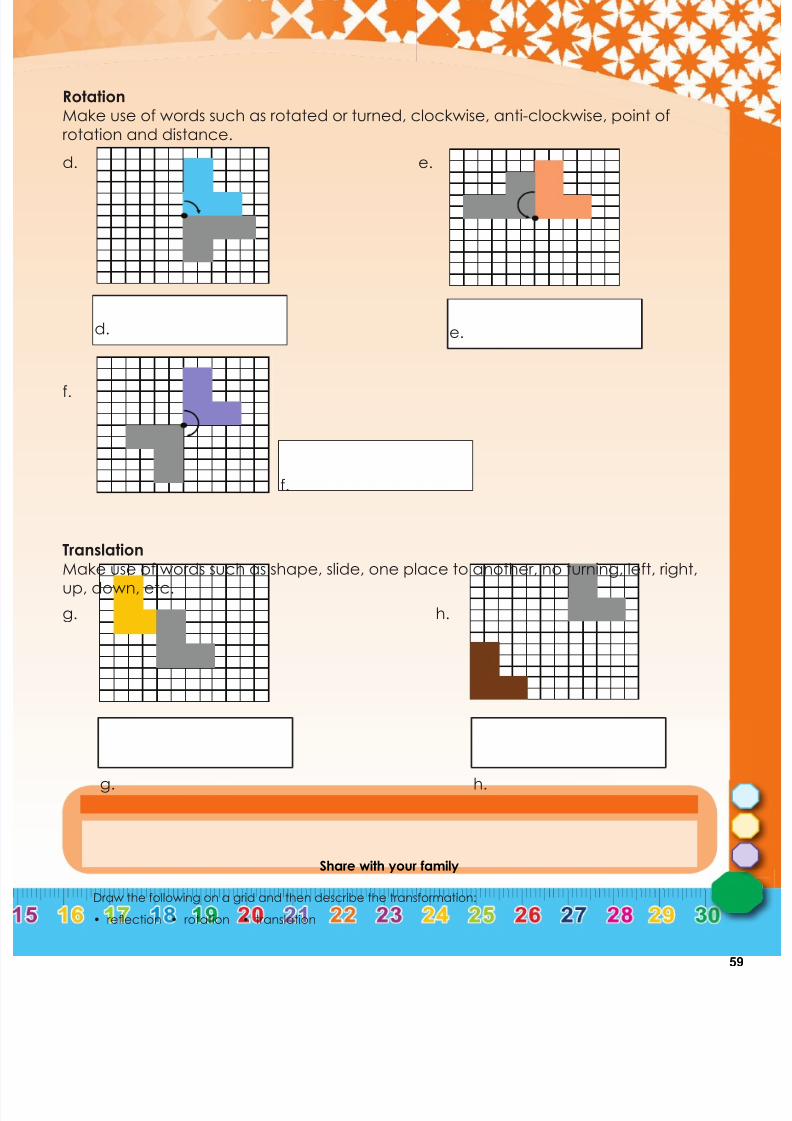
Rotation
Make use of words such as rotated or turned, clockwise, anti-clockwise, point ofrotation and distance.
Translation
Make use of words such as shape, slide, one place to another, no turning, left, right,up, down, etc.
f.
g. h.
e.d.
Share with your family
Draw the following on a grid and then describe the transformation:
• reflection • rotation • translation
d.
f.
g. h.
e.
7/21/2019 Numeracy Gr 7
http://slidepdf.com/reader/full/numeracy-gr-7 62/166
60
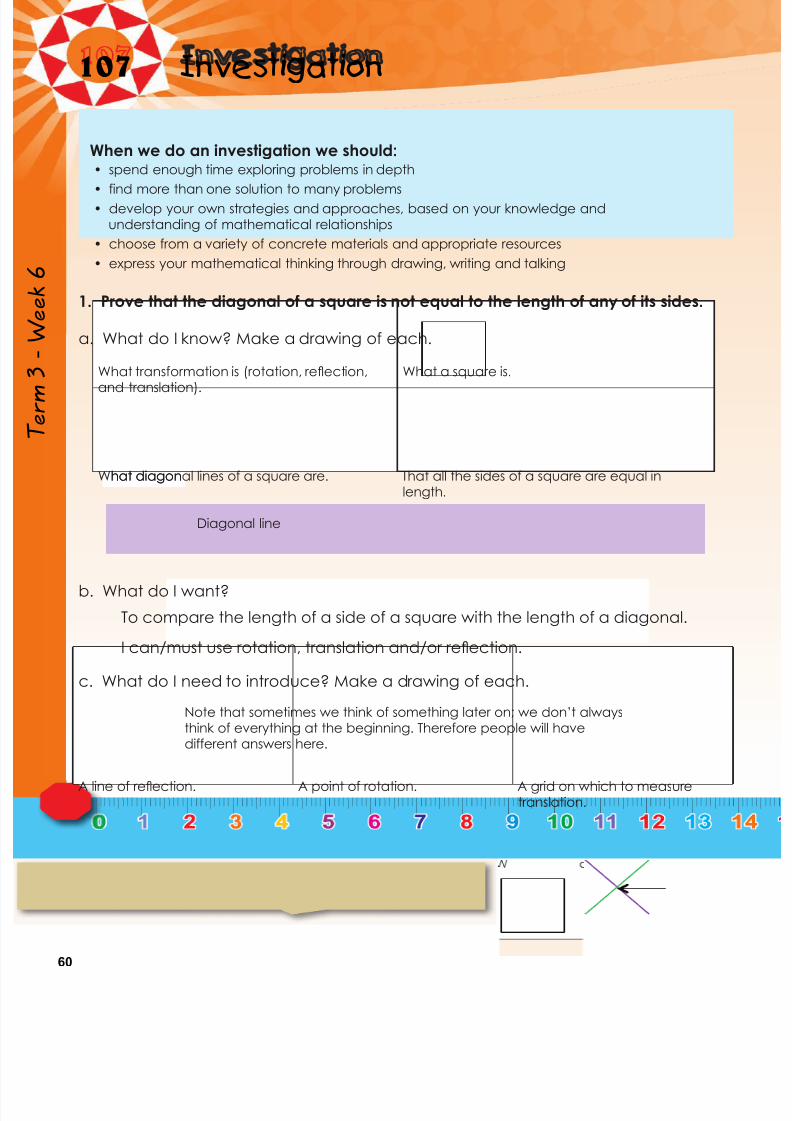
107 Investigation
Term3
Week6
a. What do I know? Make a drawing of each.
b. What do I want?
c. What do I need to introduce? Make a drawing of each.
To compare the length of a side of a square with the length of a diagonal.
I can/must use rotation, translation and/or reflection.
When we do an investigation we should:• spend enough time exploring problems in depth
• find more than one solution to many problems• develop your own strategies and approaches, based on your knowledge and
understanding of mathematical relationships
• choose from a variety of concrete materials and appropriate resources
• express your mathematical thinking through drawing, writing and talking
1. Prove that the diagonal of a square is not equal to the length of any of its sides.
What transformation is (rotation, reflection,
and translation).
What a square is.
What diagonal lines of a square are. That all the sides of a square are equal inlength.
A line of reflection. A point of rotation. A grid on which to measuretranslation.
hat diagon`````
`````
`````
````
Diagonal line
Note that sometimes we think of something later on; we don’t alwaysthink of everything at the beginning. Therefore people will havedifferent answers here.
7/21/2019 Numeracy Gr 7
http://slidepdf.com/reader/full/numeracy-gr-7 63/166
61
d. Attack
You often get “stuck” and are tempted to give up. However, this is the exact pointat which it is critical for you to use the time and space to get through the pointof frustration and look for alternative ideas. This is the phase in which you make
conjectures, collect data, discover patterns and try to convince or justify your
answers.
e. ReviewCheck your conclusions or resolutions, reflect on what you did – the key ideas and
key moments.
Problem solving
Expand the following and prove your answer by factorising. 2( p3 + 8 p2 - 5 p)
Family time
Share this investigation with a family member.
Remember to use theinformation in a, b and c.

7/21/2019 Numeracy Gr 7
http://slidepdf.com/reader/full/numeracy-gr-7 64/166
62
108 Enlargement and reduction
Term3
Week6
Look at this diagram and discuss.
The length of the blue rectangle is two times/twice the length of the orange rectangle.
The width of the blue rectangle is two times/twice the width of the orange rectangle.
The orange rectangle is two times/twice enlarged.
Orange rectangle
The length = 5 The width = 3
Blue rectangle
The length = 10 The width = 6
1. Use the diagrams to answer the questions.
b. The length of the red square is _____ times the length of the blue square.
The width of the red square is _____ times the width of the blue square.
The red square is enlarged _____ times.
a.
c. The length of the green square is ___ times the length of the red square rectangle.
The width of the green square is ___ times the width of the red square.
The green square is enlarged ____ times.
d. The length of the green square is ___ times the length of the blue square.
The width of the green square is ___ times the width of the blue square.
The blue square is reduced ___ times.
Blue square
Length = ___
Width = ___
Red square
Length = ___
Width = ___
Green square
Length = ___
Width = ___

7/21/2019 Numeracy Gr 7
http://slidepdf.com/reader/full/numeracy-gr-7 65/166
63
Compared to the:
a. Red rectangle, the blue rectangle is reduced ___ times.
b. Green rectangle, the blue rectangle is reduced ___ times.
c. Blue rectangle, the red rectangle is enlarged ___ times.
d. Green rectangle, the red rectangle is enlarged ___ times.
e. Blue rectangle, the green rectangle is enlarged ___ times.
f. Red rectangle, the green rectangle is enlarged ___ times.
2. Use the diagrams to answer the questions.
3. Draw a 1 cm by 2 cm rectangle. Enlarge it twice and then enlarge the secondrectangle six times. Make a drawing to show your answer.
Problem solving
What will the perimeter of a 20 mm by 40 mm rectangle be if you enlarge it by 3?
Blue rectangle:
The length = ___
The width = ___
Green rectangle:
The length = ___
The width = ___
Red rectangle:
The length = ___
The width = ___
3 cm
24 cm
6 cm
1 c m
8 c m
2 c m

7/21/2019 Numeracy Gr 7
http://slidepdf.com/reader/full/numeracy-gr-7 66/166
64
109 Drawing graphs
Term3
Week6
How do you know this figure is enlarged by 3?
The scale factor from small to large is 3.The scale factor from large to small is 3.
We say thescale factoris 3.
1. By what is this shape enlarged? Write down all the steps.
2. Enlarge the rectangle by:
a. scale factor 4 b.

7/21/2019 Numeracy Gr 7
http://slidepdf.com/reader/full/numeracy-gr-7 67/166
65
3. Complete the table. Start with the original geometric figure every time.
Problem solving
Enlarge a 1,5 cm by 5 cm geometric figure by scale factor 3.
Geometric figure Enlarge by scalefactor 2.
Enlarge by scalefactor 5.
Enlarge by scalefactor 10.
a. 2 cm x 3 cm
= 6 cm2
2 cm x 2 x 3 cm x 2
= 24 cm2
2 cm x 5 x 3 cm x 5
= 150 cm2
2 cm x 10 x 3 cm x 10
= 6 cm2
b. 5 cm x 1 cm
c. 4 cm x 2 cm
d. 8 cm x 3 cm
e. 1,5 cm x 2 cm
2 cm 4 cm 10 cm 20 cm
3 cm 6 cm 15 cm 30 cm
7/21/2019 Numeracy Gr 7
http://slidepdf.com/reader/full/numeracy-gr-7 68/166
66
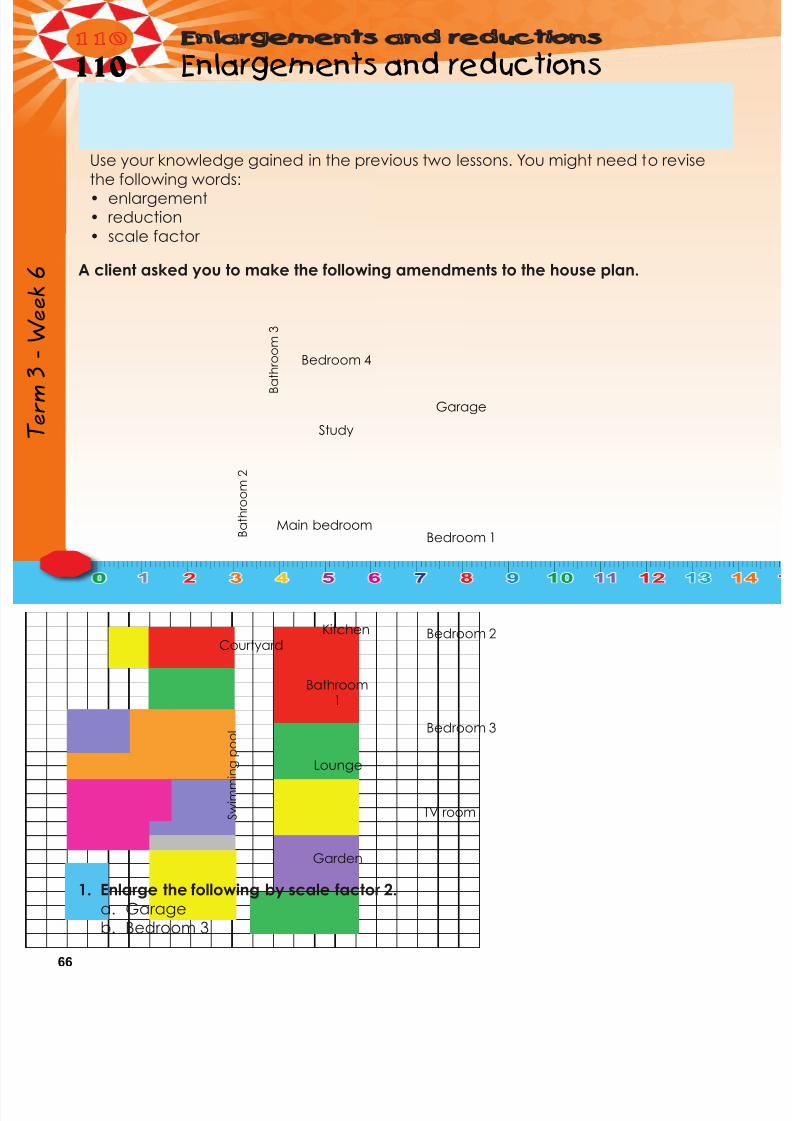
110 Enlargements and reductions
Term3
Week6
Use your knowledge gained in the previous two lessons. You might need to revise
the following words:• enlargement• reduction
• scale factor
A client asked you to make the following amendments to the house plan.
1. Enlarge the following by scale factor 2.
a. Garage b. Bedroom 3
Bedroom 4
Study
Main bedroom
Courtyard
Lounge
Bathroom1
Garage
Bedroom 1
Bedroom 2
Bedroom 3
TV room
B a
t h r o o m 3
S w i m m i n g
p o o l
B a t h r o o m 2
Kitchen
Garden
7/21/2019 Numeracy Gr 7
http://slidepdf.com/reader/full/numeracy-gr-7 69/166
67
Problem solving
Design your dream house. Enlarge it by scale factor 2.
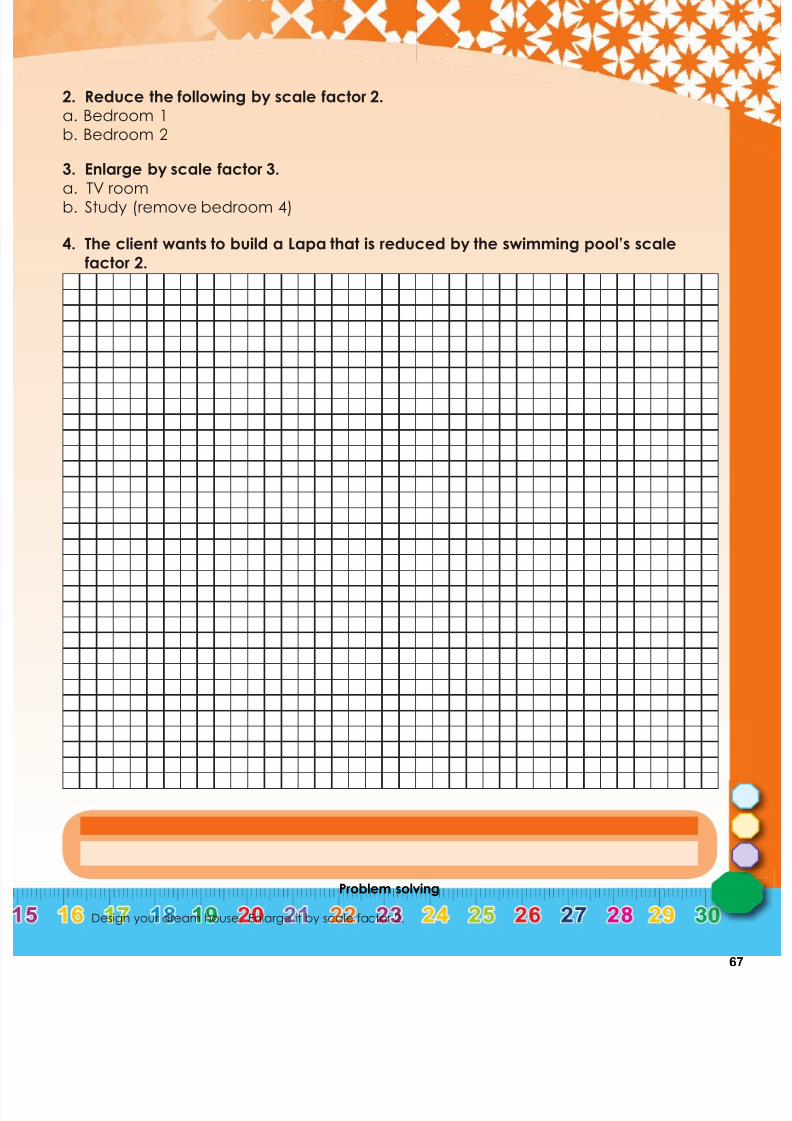
2. Reduce the following by scale factor 2.a. Bedroom 1b. Bedroom 2
3. Enlarge by scale factor 3.
a. TV roomb. Study (remove bedroom 4)
4. The client wants to build a Lapa that is reduced by the swimming pool’s scale
factor 2.

7/21/2019 Numeracy Gr 7
http://slidepdf.com/reader/full/numeracy-gr-7 70/166
68
111 Prisms and pyramids
Term3
Week7
1. Make the following geometric objects using the nets below. Enlarge the nets bya scale factor of 2. You will need some grid paper, ruler, sticky tape and a pair of
scissors.
Why kinds of prisms
are these?
Why kind of pyramids
are these?
a.
d. e.
c.b.

7/21/2019 Numeracy Gr 7
http://slidepdf.com/reader/full/numeracy-gr-7 71/166
69
2. Identify and name all the geometric solids (3-D objects) in these diagrams.
4. Compare prisms and pyramids.
3. Identify, name and label as many pyramids and prisms as you can.
Problem solving
Name five pairs of a pyramid and a prism that will exactly fit on top of each other, and say why.
a.
a. b. c.
c.b.
Prisms Pyramids
7/21/2019 Numeracy Gr 7
http://slidepdf.com/reader/full/numeracy-gr-7 72/166
70
112 3-D objects
Term3
Week7
a. Circle the tetrahedron in blue.
b. Circle the hexahedron in red.
a.
b.
c.
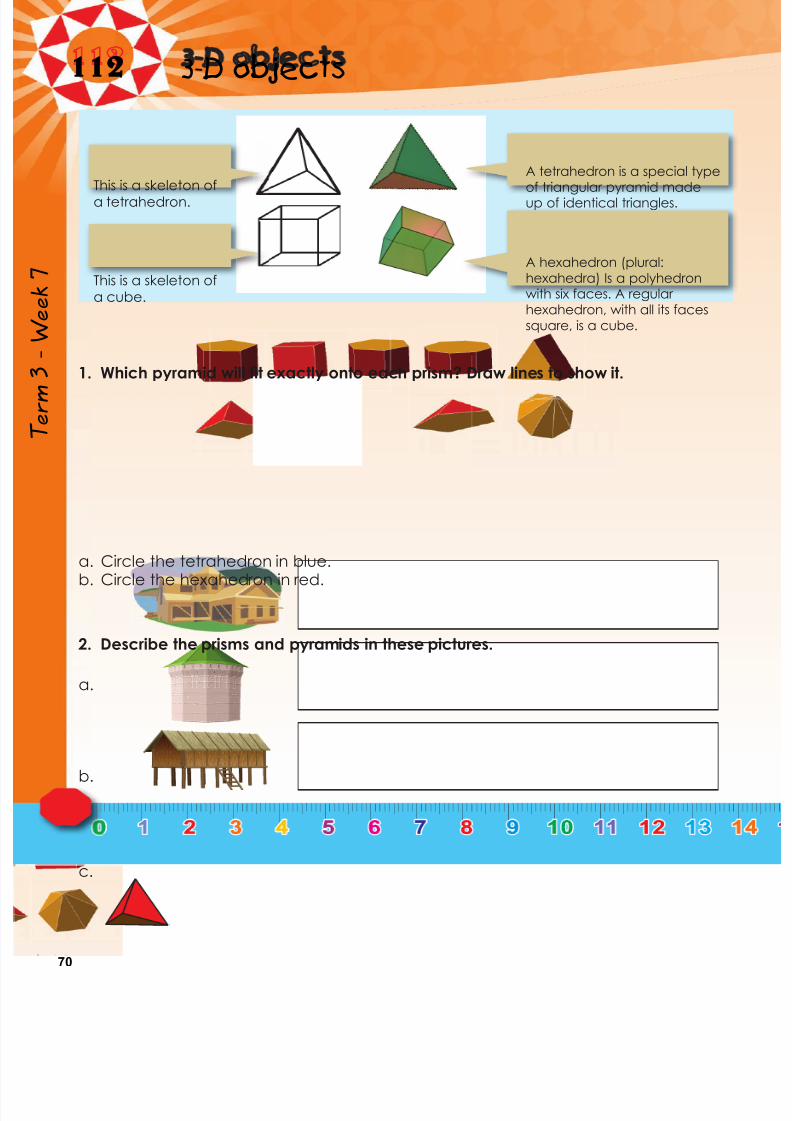
1. Which pyramid will fit exactly onto each prism? Draw lines to show it.
2. Describe the prisms and pyramids in these pictures.
A tetrahedron is a special type
of triangular pyramid madeup of identical triangles.This is a skeleton ofa tetrahedron.
This is a skeleton ofa cube.
A hexahedron (plural:hexahedra) Is a polyhedronwith six faces. A regularhexahedron, with all its facessquare, is a cube.

7/21/2019 Numeracy Gr 7
http://slidepdf.com/reader/full/numeracy-gr-7 73/166
71
Problem solving
Expand the following and prove your answer by factorising. 2( p3 + 8 p2 - 5 p)
Problem solving
How many tetrahedrons do you need to
complete the big tetrahedron?
How would you use the word hexahedron
to describe this Rubic cube?
3. Your friend made this drawing of a building she saw. Identify and namethe solids.
4. Draw the nets for the following:
Tetrahedron
Hexahedron

7/21/2019 Numeracy Gr 7
http://slidepdf.com/reader/full/numeracy-gr-7 74/166
72
113 Building 3-D models
Term3
Week7
Geometric solidGeometric figures
2 hexagons
6 rectangles
1. Which geometric solid can be made with these geometric figures?
2. Identify all the geometric figures in these solids and make a drawing of all theshapes.
a. b.
3. a. Make various geometric solids using geometric figures using waste products. – prisms (triangular prism, cube, rectangular, pentagonal, hexagonal and
octagonal) – pyramids (triangular ,tetrahedron, rectangular, pentagonal, hexagonal and
octagonal)
b. Use the geometric solids to create “buildings of the future”.
gons
ng es
A 2-D shape is a“geometric figure”and a 3-D object is a“geometric solid”.
This is what we get
if we trace aroundeach face of the
hexagonal prism.
a. b. c.
7/21/2019 Numeracy Gr 7
http://slidepdf.com/reader/full/numeracy-gr-7 75/166
73
Problem solving
Fit two geometric solids on top of each other. Where they touch the faces should be the same. The twogeometric solids cannot be prisms or pyramids.
4. a. Write down how you created each polyhedron, focusing on the shapes of thefaces and how you joined them. You may include drawings.
b. Write a description of how you have put the geometric solids together to createyour “buildings of the future”. Give reasons why you have used certain solids for
certain buildings.
c. Present your work to the class.
Presentation Tips
When presenting you should:
- Make eye contact with different people throughout the presentation;- Start by explaining what the content of presentation is about;- Use natural hand gestures to demonstrate;
- Stand up straight with both feet firmly on the ground;- Demonstrate a strong positive feeling about the topic during the entire
presentation;
- Stay within the required time frame;- Use visual aids to enhance the presentation;- Explain all points thoroughly;- Organise your presentation well and maintain the interest level of the
audience.

7/21/2019 Numeracy Gr 7
http://slidepdf.com/reader/full/numeracy-gr-7 76/166
74
114 Visualising 3-D objects/play a game
Term3
Week7
1. Ask your friend to close his or her eyes. Then ask him or her the followingquestions:
a. Name and describe the new solid.
Do the following in pairs. Alternate the questions amongst yourselves.
What geometric solid is it?All the faces areflat.
Imagine youhave a cube.
Imagine you are lookingat a large cardboard box
that looks like a cube.
Can you stand so thatyou can see only one
square?
Can you stand so thatyou can see 2 or 3
squares?
Imagine you now havetwo identical cubes.
Place them together.
I count fivefaces.
Two are trianglesand three are
rectangles.
After imagining the object, draw, name and describe it.
b. Name and describe the solid from different views.
Draw:
Seeing one square Seeing two squares Seeing three squares
Draw: Describe:
7/21/2019 Numeracy Gr 7
http://slidepdf.com/reader/full/numeracy-gr-7 77/166
75
Problem solving
Describe a geometric solid to your family and ask them to imagine it.
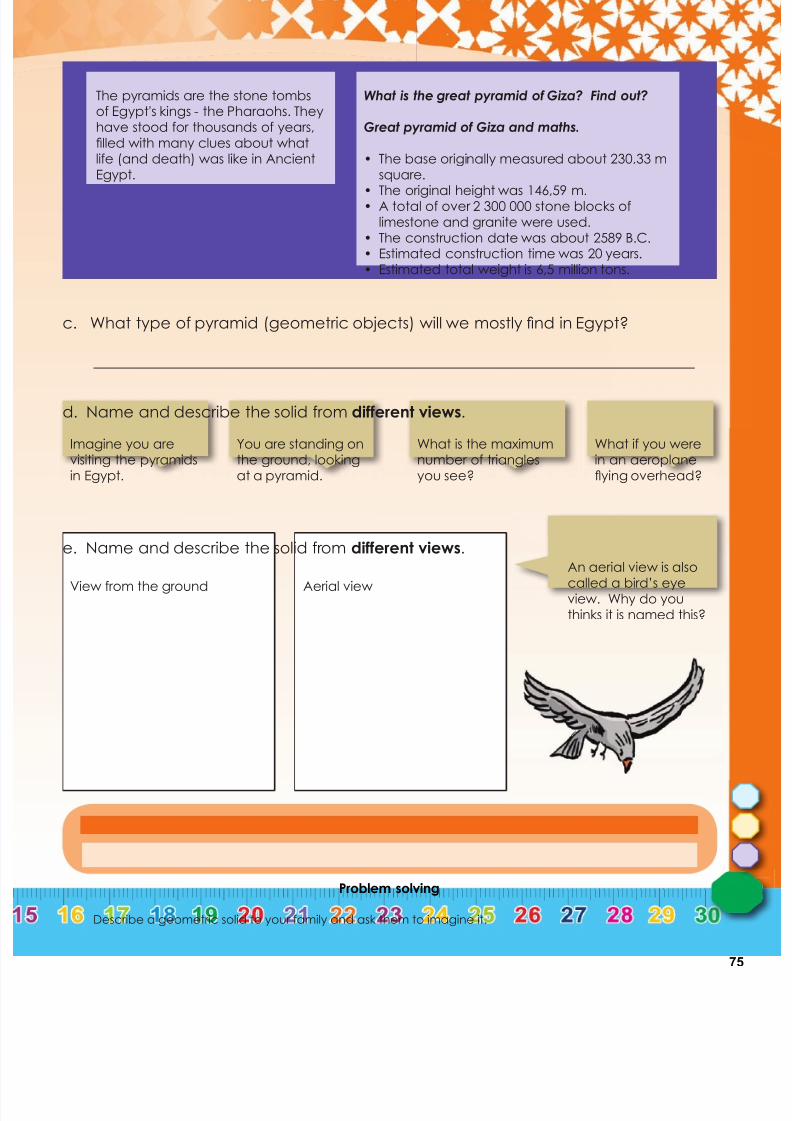
c. What type of pyramid (geometric objects) will we mostly find in Egypt?
____________________________________________________________________________
d. Name and describe the solid from different views.
The pyramids are the stone tombsof Egypt's kings - the Pharaohs. Theyhave stood for thousands of years,filled with many clues about whatlife (and death) was like in AncientEgypt.
What is the great pyramid of Giza? Find out?
Great pyramid of Giza and maths.
• The base originally measured about 230,33 msquare.
• The original height was 146,59 m.• A total of over 2 300 000 stone blocks of
limestone and granite were used.• The construction date was about 2589 B.C.• Estimated construction time was 20 years.• Estimated total weight is 6,5 million tons.
Imagine you arevisiting the pyramidsin Egypt.
You are standing onthe ground, lookingat a pyramid.
What is the maximumnumber of trianglesyou see?
What if you werein an aeroplaneflying overhead?
An aerial view is alsocalled a bird’s eyeview. Why do youthinks it is named this?
e. Name and describe the solid from different views.
View from the ground Aerial view
7/21/2019 Numeracy Gr 7
http://slidepdf.com/reader/full/numeracy-gr-7 78/166
76
115 Surfaces, vertices and edges
Term3
Week7
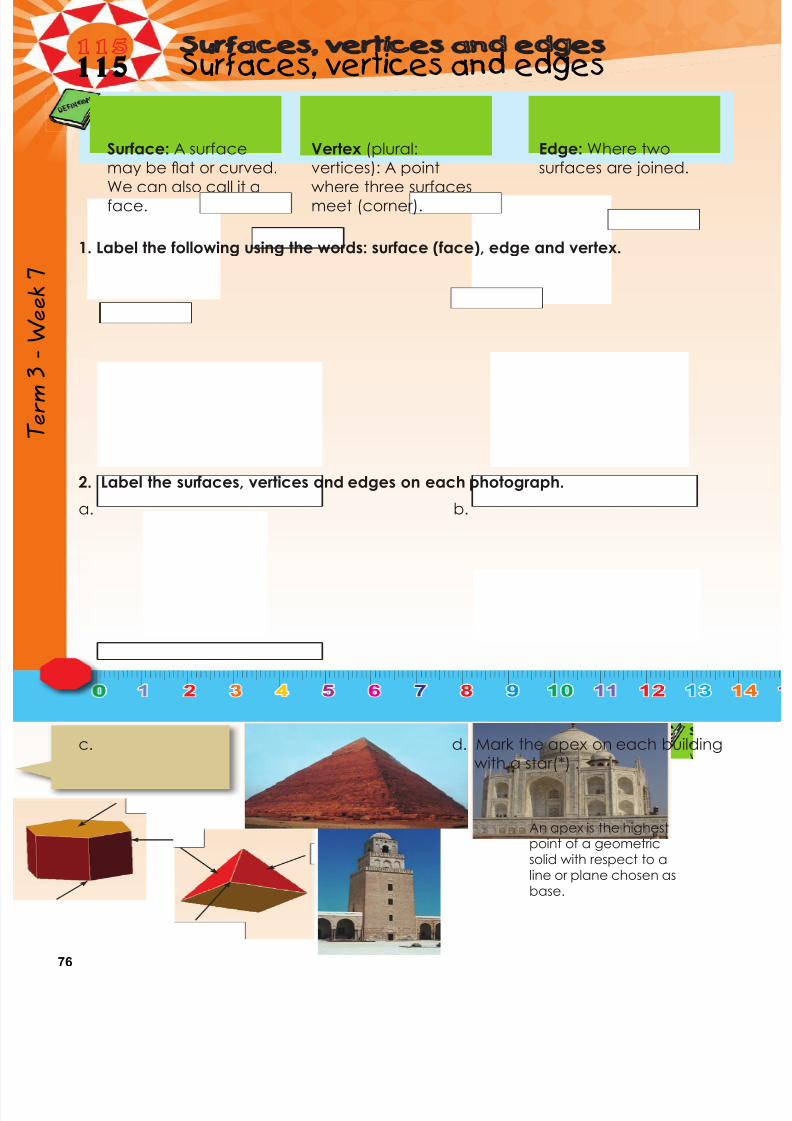
1. Label the following using the words: surface (face), edge and vertex.
2. Label the surfaces, vertices and edges on each photograph.
a.
c. d. Mark the apex on each building
with a star(*) .
b.
Surface: A surfacemay be flat or curved.
We can also call it aface.
Vertex (plural:vertices): A point
where three surfacesmeet (corner).
Edge: Where twosurfaces are joined.
An apex is the highestpoint of a geometricsolid with respect to aline or plane chosen asbase.

7/21/2019 Numeracy Gr 7
http://slidepdf.com/reader/full/numeracy-gr-7 79/166
77
5. Look at these skeletons. Say how many vertices and edges you see in eachstructure
3. What do all these objects have in common? When closed, they all have:
4. Label the following using the words: surface (face), edge and vertex. Also saywhich geometric object each one will form.
d.
a.
a.
a.
b.
b.
c.
c.
d.
d.
e.
b.
f.
c.
___ vertices ___ edges
___ vertices ___ edges
• ___ faces• ___ edges• ___ vertices
Geometric object: __________________ • ___ edges
• ___ vertices• ___ faces
Geometric object: __________________ • ___ edges
• ___ vertices• ___ faces
Geometric object: __________________ • ___ edges
• ___ vertices• ___ faces
Geometric object: __________________ • ___ edges
• ___ vertices• ___ faces
• ___ faces• ___ edges• ___ vertices
• ___ faces• ___ edges• ___ vertices
• ___ faces• ___ edges• ___ vertices
___ vertices ___ edges
___ vertices ___ edges
___ vertices ___ edges
___ vertices ___ edges
Problem solving
• Can a prism have an odd number of vertices? Give an example.
• Can a pyramid have an odd number of vertices?
• How many more faces does an octagonal pyramid have than a heptagonal pyramid?

7/21/2019 Numeracy Gr 7
http://slidepdf.com/reader/full/numeracy-gr-7 80/166
78
116 More surfaces, vertices and edges
Term3
Week8
Think!!! Look at these nets of geometric solids. How many surfaces, vertices andedges does each solid have?
1. Write labels with arrows pointing to the geometrical figures which you can see ineach object, and write how many of each there are.
2 triangles
3 rectangles
Identify all the geometric figures in thisgeometric solid. We provide you with fourviews of the geometric solid to help you.

7/21/2019 Numeracy Gr 7
http://slidepdf.com/reader/full/numeracy-gr-7 81/166
79
a. Look at the table above and compare a triangular pyramid and a square
pyramid. Describe the similarities and differences between them.
b. Describe the differences between a hexagonal prism and an octagonal prism.
c. Describe the differences between a hexagonal pyramid and an octagonal
pyramid.
d. What should you do to the geometric solid on the left to change it to the
geometric solid on the right?
2.
i.
ii.
Solve this with a family member.
Describe the geometric solid using the words surfaces (faces), vertices and edges.
We give you the unfoldings to help you to solve this.
Name ofsolid
Shapesmade of
No. ofedges
No. ofvertices
No. ofsurfaces

7/21/2019 Numeracy Gr 7
http://slidepdf.com/reader/full/numeracy-gr-7 82/166
80
117 Even more surfaces, edges and vertices
Term3
Week8
a.
d.
b.
e.
c.
f.
2. Visualise how many vertices a pentagonal prism has. ___ a. How many edges does it have? _____
b. How many faces? ____
c. What about a heptagonal prism? ____
d. Heptagonal pyramid? ____
Revise the following:• surfaces (faces)
• vertices• edges
Identify the surfaces,vertices and edgesin this photograph.
surfaces
edgesvertices
1. Look at the different polyhedra.Identify the surfaces (faces), vertices and edges.
s
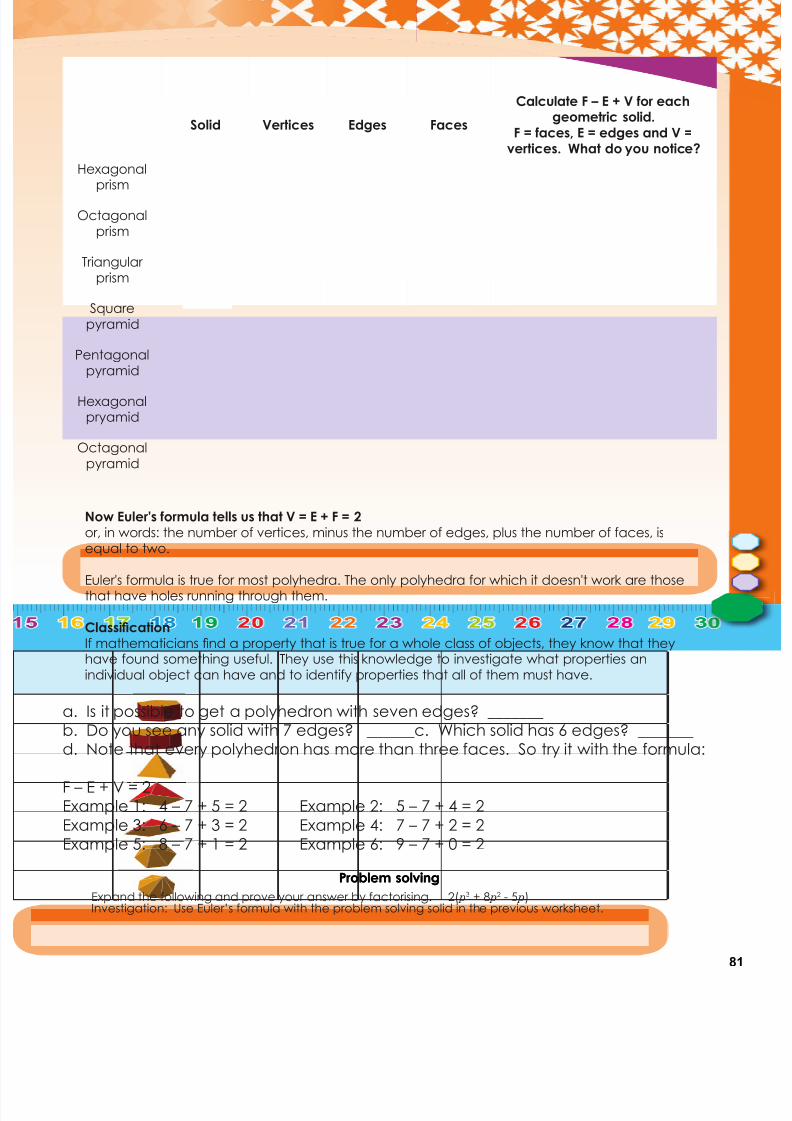
Solid Vertices Edges Faces
Calculate F – E + V for each
geometric solid.F = faces, E = edges and V =
vertices. What do you notice?
Triangularprism
Rectangularprism
Pentagonalprism
3. Complete the table
7/21/2019 Numeracy Gr 7
http://slidepdf.com/reader/full/numeracy-gr-7 83/166
81
a. Is it possible to get a polyhedron with seven edges? _______ b. Do you see any solid with 7 edges? ______c. Which solid has 6 edges? _______ d. Note that every polyhedron has more than three faces. So try it with the formula:
F – E + V = 2Example 1: 4 – 7 + 5 = 2 Example 2: 5 – 7 + 4 = 2
Example 3: 6 – 7 + 3 = 2 Example 4: 7 – 7 + 2 = 2Example 5: 8 – 7 + 1 = 2 Example 6: 9 – 7 + 0 = 2
Now Euler's formula tells us that V = E + F = 2
or, in words: the number of vertices, minus the number of edges, plus the number of faces, isequal to two.
Euler's formula is true for most polyhedra. The only polyhedra for which it doesn't work are thosethat have holes running through them.
ClassificationIf mathematicians find a property that is true for a whole class of objects, they know that theyhave found something useful. They use this knowledge to investigate what properties anindividual object can have and to identify properties that all of them must have.
Problem solving
Expand the following and prove your answer by factorising. 2( p3 + 8 p2 - 5 p)
Problem solving
Investigation: Use Euler’s formula with the problem solving solid in the previous worksheet.
Solid Vertices Edges Faces
Calculate F – E + V for eachgeometric solid.
F = faces, E = edges and V =vertices. What do you notice?
Hexagonal
prism
Octagonalprism
Triangularprism
Squarepyramid
Pentagonalpyramid
Hexagonalpryamid
Octagonalpyramid
7/21/2019 Numeracy Gr 7
http://slidepdf.com/reader/full/numeracy-gr-7 84/166
82
Step 1 Step 2
Step 3 Step 4
118 Views
Term3
Week8
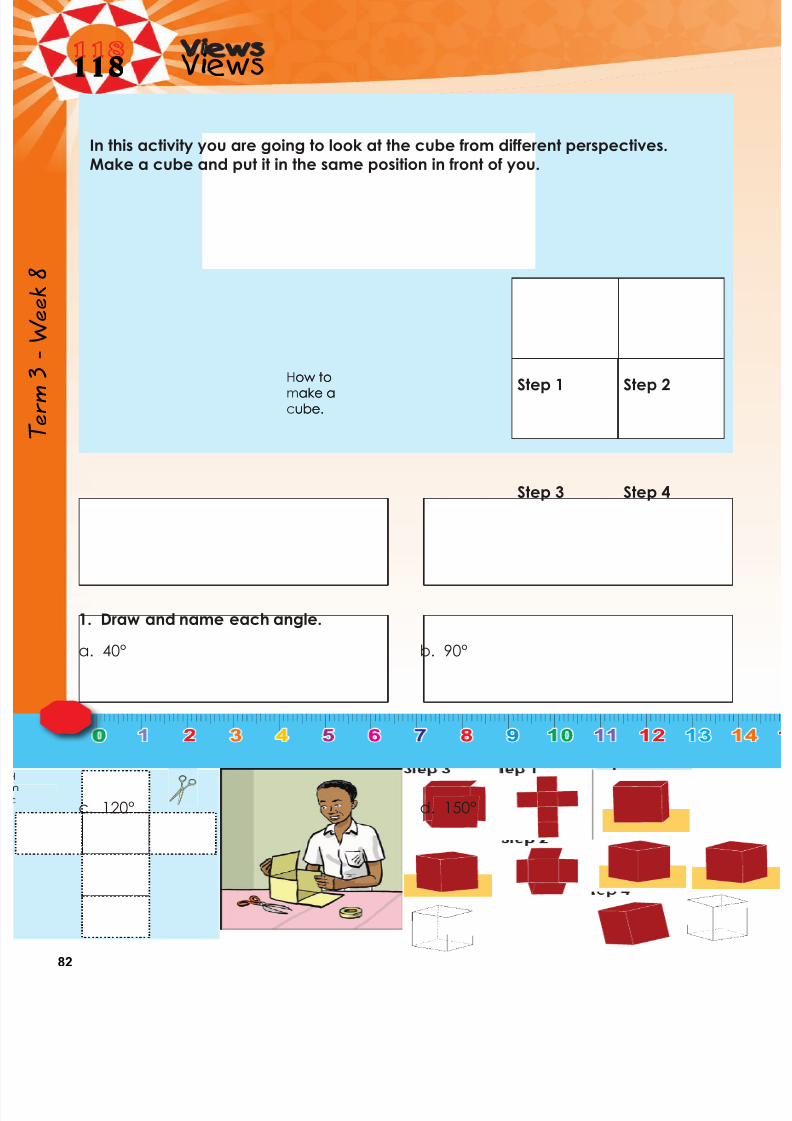
In this activity you are going to look at the cube from different perspectives.Make a cube and put it in the same position in front of you.
How to
make a
cube.
a. 40°
c. 120°
b. 90°
d. 150°
1. Draw and name each angle.
ow to
ake a
ube.

7/21/2019 Numeracy Gr 7
http://slidepdf.com/reader/full/numeracy-gr-7 85/166
83
2. How will you draw an angle bigger than 180°?
3. Draw and name each angle.
a. 190°
c. 300°
b. 280°
d. 275°
continued☛
7/21/2019 Numeracy Gr 7
http://slidepdf.com/reader/full/numeracy-gr-7 86/166
84
Step 1 Step 2
118b Views continued
Term3
Week8
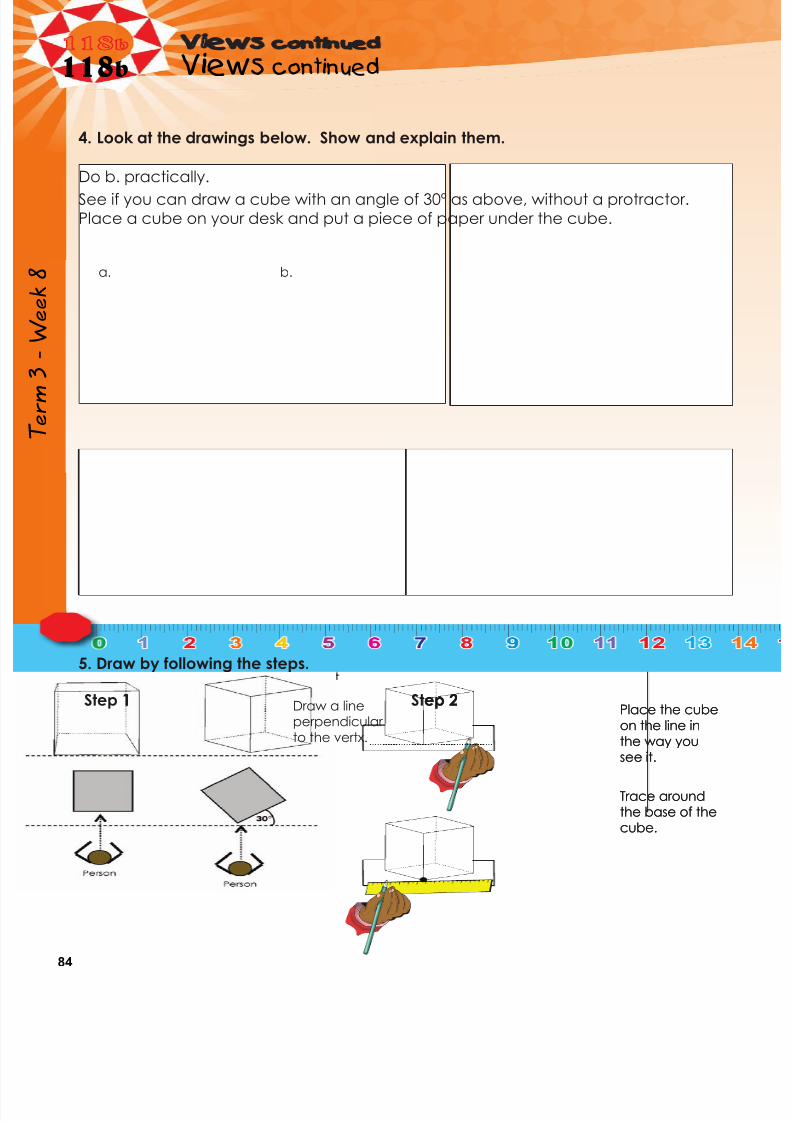
4. Look at the drawings below. Show and explain them.
Do b. practically.
See if you can draw a cube with an angle of 30º as above, without a protractor.
Place a cube on your desk and put a piece of paper under the cube.
5. Draw by following the steps.
Place the cubeon the line inthe way yousee it.
Trace aroundthe base of the
cube.
1 ep 2Place the cubeon the line inthe way yousee it.
Trace aroundthe base of the
cube.
a. b.
Draw a lineperpendicularto the vertx.
7/21/2019 Numeracy Gr 7
http://slidepdf.com/reader/full/numeracy-gr-7 87/166
85
Problem solving
Sit at your desk, look at the sketches in your book and then place the geometric solid in the same
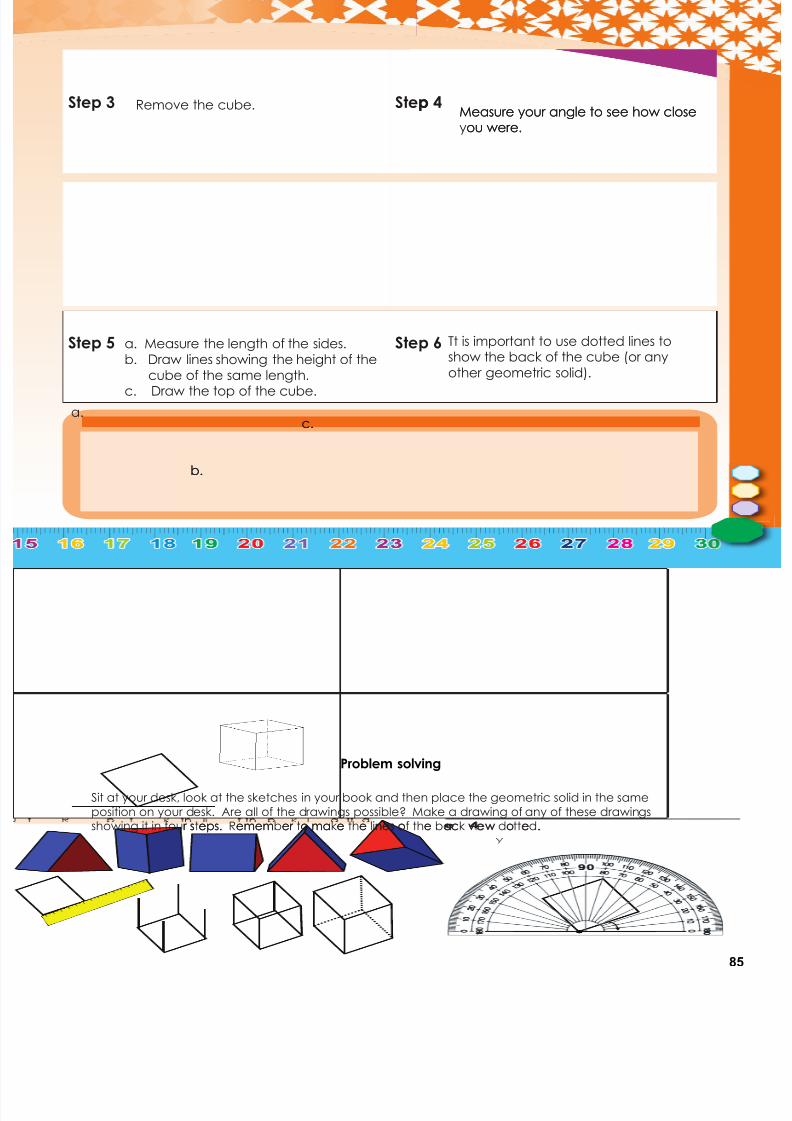
position on your desk. Are all of the drawings possible? Make a drawing of any of these drawingsshowing it in four steps. Remember to make the lines of the back view dotted. r s eps. emem er o ma e e nes o e ac vew o e .
Step 3 Step 4
Step 5 Step 6
Measure your angle to see how closeyou were.
Tt is important to use dotted lines toshow the back of the cube (or anyother geometric solid).
Remove the cube.
a. Measure the length of the sides.b. Draw lines showing the height of the
cube of the same length.c. Draw the top of the cube.
pMeasure your angle to see how closeou were.
a.
b.
c.
b.
c.

7/21/2019 Numeracy Gr 7
http://slidepdf.com/reader/full/numeracy-gr-7 88/166
86
119 Constructing a pyramid net
Term3
Week8
1. Construct the net for a tetrahedron.
What is a pyramid? Look at the pictures and describe a pyramid.
Will we only find pyramids in Egypt?
Where do we find real pyramids?
Step 1:
Construct an equilateral triangle. Label it ABC.Step 2:
Construct another equilateral triangle with one base
joined to base AB of the first triangle.
Step 3:
Construct another triangle using BD as a base.Step 4:
Construct another triangle using AD as a base.
7/21/2019 Numeracy Gr 7
http://slidepdf.com/reader/full/numeracy-gr-7 89/166
87
Problem solving
Look at this gift box and make it yourself.
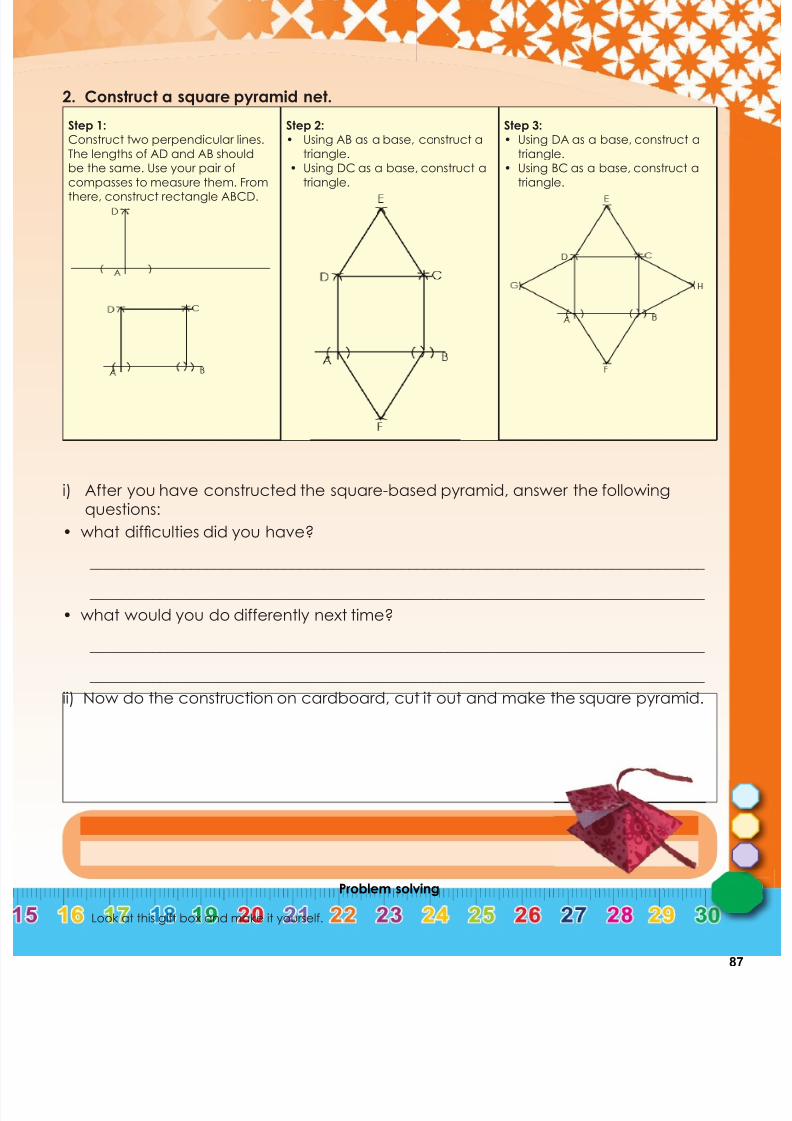
2. Construct a square pyramid net.
Step 1:Construct two perpendicular lines.
The lengths of AD and AB shouldbe the same. Use your pair of
compasses to measure them. Fromthere, construct rectangle ABCD.
Step 2:• Using AB as a base, construct a
triangle. • Using DC as a base, construct a
triangle.
Step 3:• Using DA as a base, construct a
triangle.• Using BC as a base, construct a
triangle.
i) After you have constructed the square-based pyramid, answer the followingquestions:
• what difficulties did you have?
_______________________________________________________________________________
_______________________________________________________________________________
• what would you do differently next time?
_______________________________________________________________________________
_______________________________________________________________________________
ii) Now do the construction on cardboard, cut it out and make the square pyramid.

7/21/2019 Numeracy Gr 7
http://slidepdf.com/reader/full/numeracy-gr-7 90/166
88
120 Construct a net of a prism
Term3
Week8
Step 1:
Construct two
perpendicular lines. The
lengths of AD and AB
could be the same or one
longer to form a rectangle.
Use your pair of compasses
to measure them). From
there, construct rectangle
ABCD.
Step 2:
• Using DC as a base,
construct a square (or
rectangle).
• Using AB as a base,
construct another square
(or rectangle).
Step 3:
• Using DA as a base,
construct a triangle.
• Using BC as a base,
construct a triangle.
1. Construct the net of a triangular prism.
What is a prism? Look at the pictures and describe a prism Sometimes
people think
a prism only
takes on thisshape. How
will you find
out if this is
true?

7/21/2019 Numeracy Gr 7
http://slidepdf.com/reader/full/numeracy-gr-7 91/166
89
Problem solving
What is this prism showing us?
Step 1:
Construct two
perpendicular lines. The
length between A and B
should be longer than that
between D and A. Use your
compass to measure them.
From there, construct
rectangle ABCD.
Step 2:
• Use DC as base to
construct another
rectangle above.
• Use AB as base to
construct another
rectangle below. Label
the new points G and H.
• Use GH as base to
construct another
rectangle.
Step 3:
• Use DA as base to
construct a square.
• Use CB as base to
construct a square.
2. Rectangular prism construction.

7/21/2019 Numeracy Gr 7
http://slidepdf.com/reader/full/numeracy-gr-7 92/166
90
121 Integers
Term4
Week1
“What is the temperature on a hot, sunny day?”
Point out the degrees on this thermometer. What does it mean for the
temperature to be two degrees below zero? Show where this is on thethermometer.
Where is the five degrees below zero on the thermometer? Is this hotter orcolder than two degrees below zero?
If you turn the thermometer sideways it becomes like a number line and showsthat the negative numbers are to the left of zero and positive numbers are to
the right of zero, with zero being neither positive nor negative.
You would use a negative sign to write
this number since it is below zero. -2
1. Write the appropriate temperature for the given weather condition.
a. What would the temperature be on a hot and sunny day? _______________________
b. What would the temperature be on a cool spring day? __________________________
c. What would the temperature be on a frosty winter morning? _____________________
d. Write the temperature of eight below zero. ______________________________________
e. Which is colder, eight below zero or 10 below zero? Why? ________________________
f. Draw a thermometer and label where 10 below zero would be.
Statement Positive Negative
a. Peter won R100 in the draw.
b. The weather report said that in Sutherland it is going to be sevendegrees below zero.
c. Sindy lost her purse with R20 in it.
2. Write where the money in each statement will go, in the negative or positive
column.

7/21/2019 Numeracy Gr 7
http://slidepdf.com/reader/full/numeracy-gr-7 93/166
91
Problem solving
Take a newspaper and find five negative numbers in it.
a. Explain what each number tells us.
b. Write down the opposite numbers for the five numbers
3. Complete the questions below after completing the table in Question 2.
a. Circle the key word in each sentence that helped you to make the decision.
b. What characteristics are found in the positive column? __________________________
__________________________________________________________________________________
c. What characteristics are found in the negative column? _________________________
__________________________________________________________________________________
d. Write down all the characteristics of integers. ___________________________________
__________________________________________________________________________________
e. Where are integers used in everyday life? Give examples of your own or cutexamples from a newspaper.
d. David sold his cell phone for R200.
e. I bought airtime for R50 with some of my savings.
f. We raised R500 during the course of the day
g. We used R100 from the money raised to buy snacks for the party.
h. My older brother earned R120 for the work he had done
i. We made R300 profit.
j. We made a R200 loss.
4. Complete these number lines.a.
-1 0 1b.
-10 5 0 5
c.0 2 4
d.-1 0 1
e.-1 0 1
f.-3 0 3
5. Complete the following
a. {3, 2, 1, 0, ____, _____, ____} b. {–10, –9, –8, ____, ____, ____}
c. {8, 6, 4, 2, ____, ____, _____, _____} d. {–9, –6, –3, ____, ____, ____}
e. {12, 8, 4, ____, ____, ____}

7/21/2019 Numeracy Gr 7
http://slidepdf.com/reader/full/numeracy-gr-7 94/166
92
122 More integers
Term4
Week1
• What do we call the units to the right of the zero?
• What do we call the units to the left of the zero?
• What will five units left from 3 be?
• What will five units right from 3 be?
• What is the opposite of –4?
• What is the opposite of 4?
• What is three below zero?
(positive numbers or integers)
-5 -4 -3 -2 -1 0 1 2 3 4 5
(negative numbers or integers)
1. Write an integer to represent each description.
a. Five units to the left of 4 on a number line. ___________________
b. 20 below zero. ___________________
c. The opposite of 271. ___________________
d. Eight units to the left of –3 on a number line. ___________________
e. Eight units to the right of –3 on a number line. ___________________
f. 16 above zero. ___________________
g. 14 units to the right of –2 on a number line. ___________________
h. Seven units to the left of –8 on a number line. ___________________
i. The opposite of –108. ___________________
j. 15 below zero. ___________________
2. Order these integers from smallest to biggest.
a. -5, -51, 21, -61, 42, -66, 5, 39, -31, -71, 31, 66
__________________________________________________________________________________
b. 42, 21, 48, 72, -64, -20
__________________________________________________________________________________
c. 15, -30, -14, -3, 9, 31, 21, 26, 4, -31, -24, 44
__________________________________________________________________________________

7/21/2019 Numeracy Gr 7
http://slidepdf.com/reader/full/numeracy-gr-7 95/166
93
Problem solving
Make your own word problem using a negative and a positive number
d. -41, 54, -31, -79, 57
__________________________________________________________________________________
e. -26, 32, 23, 10, -31, 12, 31, 26
__________________________________________________________________________________
f. 43, -54, 44, -55, -37, 22, 52, -39, -43, -56, 18
__________________________________________________________________________________
g. -41, -23, -31, 40, -21, 2
__________________________________________________________________________________
h. 4, -10, 15, 7, 10, -2, -13, -6, -12, 9, 12
__________________________________________________________________________________
i. -7, -15, -25, -24, -12, -13, 22, 6, 11, 2
__________________________________________________________________________________
j. 73, -24, -20, 21, -44, 5, -2, 41, 55
__________________________________________________________________________________
3. Fill in <, > or =
a. -2 2 b. -10 10 c. -5 0
d. -4 -3 e. -9 -6 f. -20 -16
Smaller Bigger
4. Give five numbers smaller than and bigger than:
a. -2 b. -99 c. 1
Smaller Bigger Smaller Bigger
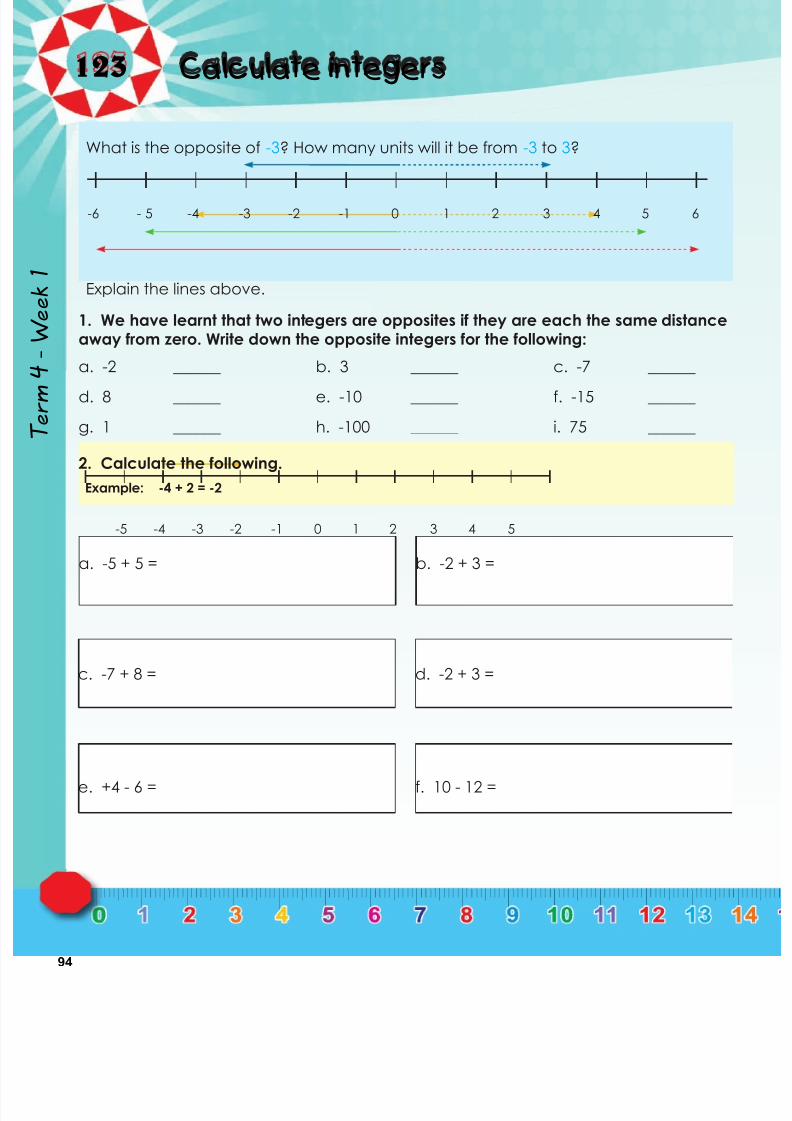
7/21/2019 Numeracy Gr 7
http://slidepdf.com/reader/full/numeracy-gr-7 96/166
94
123 Calculate integers
Term4
Week1
What is the opposite of -3? How many units will it be from -3 to 3?
-6 - 5 -4 -3 -2 -1 0 1 2 3 4 5 6
Explain the lines above.
1. We have learnt that two integers are opposites if they are each the same distanceaway from zero. Write down the opposite integers for the following:
a. -2 ______ b. 3 ______ c. -7 ______
d. 8 ______ e. -10 ______ f. -15 ______
g. 1 ______ h. -100 ______ i. 75 ______
2. Calculate the following.
Example: -4 + 2 = -2
-5 -4 -3 -2 -1 0 1 2 3 4 5
a. -5 + 5 = b. -2 + 3 =
c. -7 + 8 = d. -2 + 3 =
e. +4 - 6 = f. 10 - 12 =

7/21/2019 Numeracy Gr 7
http://slidepdf.com/reader/full/numeracy-gr-7 97/166
95
Problem solving
The sum of 10 and 8, and the sum of -9 and -8?
3. Calculate the following.
Example: -2 + 3 - 5 = -4
-5 -4 -3 -2 -1 0 1 2 3 4 5
a. -3 + 2 - 5 = b. 2 - 6 + 10 =
c. -6 + 8 - 7 = d. -3 + 10 - 11 =
e. 9 - 11 + 2 = f. 2 - 8 + 7 =
4. Complete the following.
Example:Subtract 7 from -2. Count backwards: -2, -3, -4, -5, -6, -7, -8, -9
Add 2 to -5. Count forwards: -5, -4, -3
a. Subtract 4 from -3 ________ b. Subtract 6 from - 8 ________
c. Subtract 5 from 3 ________ d. Subtract 9 from 7 ________
e. Subtract 3 from -2 ________
The sum of 101 and 85, and the sum of -98 and -104?
The sum of 19 and -8, and the sum of -19 and 8?
The sum of -7 and -14, and the sum of -4 and 20?
The sum of 100 and -50, and the sum of -100 and 50?
What is:

7/21/2019 Numeracy Gr 7
http://slidepdf.com/reader/full/numeracy-gr-7 98/166
96
Integer operations
Term4
Week1
Discuss the following
Add integers with the same sign
Find –5 + (–2).
Method 1: Use a number line.
• Start at zero.
• Move 5 units left.
• From there, move 2 units left.
-1 0 1 2-4 -3 -2-7 -6 -5 -1 0 1 2-4 -3 -2-7 -6 -5
Method 2: Draw a diagram.
-5 + (-2) -5 + (-2) = - 7
Add integers with different signs
Find 5 + (–7).
Method 1: Use a number line.
• Start at zero.
• Move 5 units right.
• From there, move 7 units left.
Method 2: Draw a diagram.
5 + (–7)
73 4 5 60 1 2-3 -2 -1
+5
-7
73 4 5 60 1 2-3 -2 -1
+5
-7
5 – 7 = - 2
1. Complete the following. • Number line method
• Drawing a diagrama. Find – 8 + (–3) b. Find –12 + (-8)
c. Find –4 + (-5) d. Find –7 + (–9)
e. Find –18 + (-7) f. Find 6 + (-8)
124
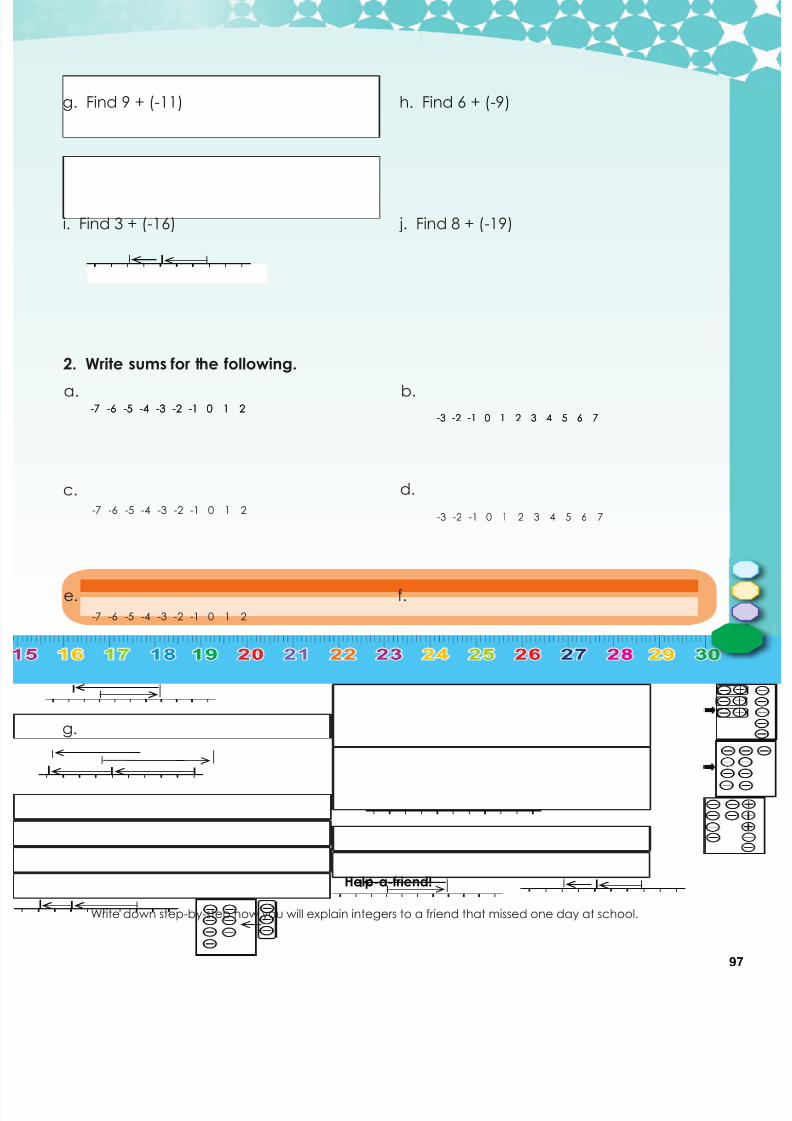
7/21/2019 Numeracy Gr 7
http://slidepdf.com/reader/full/numeracy-gr-7 99/166
97
Help-a-friend!
Write down step-by-step how you will explain integers to a friend that missed one day at school.
g. Find 9 + (-11) h. Find 6 + (-9)
i. Find 3 + (-16) j. Find 8 + (-19)
2. Write sums for the following.
a. b.-4 -3 -2-7 -6 -5 -1 0 1 2-4 -3 -2-7 -6 -5 -1 0 1 2
73 4 5 60 1 2-3 -2 -1 73 4 5 60 1 2-3 -2 -1
c. d.
-4 -3 -2-7 -6 -5 -1 0 1 273 4 5 60 1 2-3 -2 -1
e.
-4 -3 -2-7 -6 -5 -1 0 1 2
f.
g.

7/21/2019 Numeracy Gr 7
http://slidepdf.com/reader/full/numeracy-gr-7 100/166
98
125 Adding and subtracting integers
Term4
Week1
Adding a negative number is just like subtracting a positive number: 2+ - 3 = 2 – 3
If you are adding a positive number , move your finger to the right as many places
as the value of that number. For example, if you are adding 3, move your fingerthree places to the right: 2 + 3 = 5
2 3 4 5-5 -4 -3 -2 -1 0 1 2 3 4 5-5 -4 -3 -2 -1 0 1
If you are subtracting a negative number , move your finger to the right as manyplaces as the value of that number. For example, if you are subtracting -3, move
your finger three places to the right: 2 - -3 = 5
Subtracting a negative number is just like adding a positive number. The twonegatives cancel each other out. 2 + 3 = 2 - -3
If you are adding a negative number , move your finger to the left as many placesas the value of that number. For example, if you are adding -3, move your finger
three places to the left: 2 + - 3 = -1
If you are subtracting a positive number , move your finger to the left as manyplaces as the value of that number. For example, if you are subtracting 3, move
your finger three places to the left: 2 - 3 = -1
2 3 4 5-5 -4 -3 -2 -1 0 1 2 3 4 5-5 -4 -3 -2 -1 0 1
1. Calculate the following, make use of the number lines.
a. 4 + –5 =
b. 5 + –7 =
c. 5 + –7 =
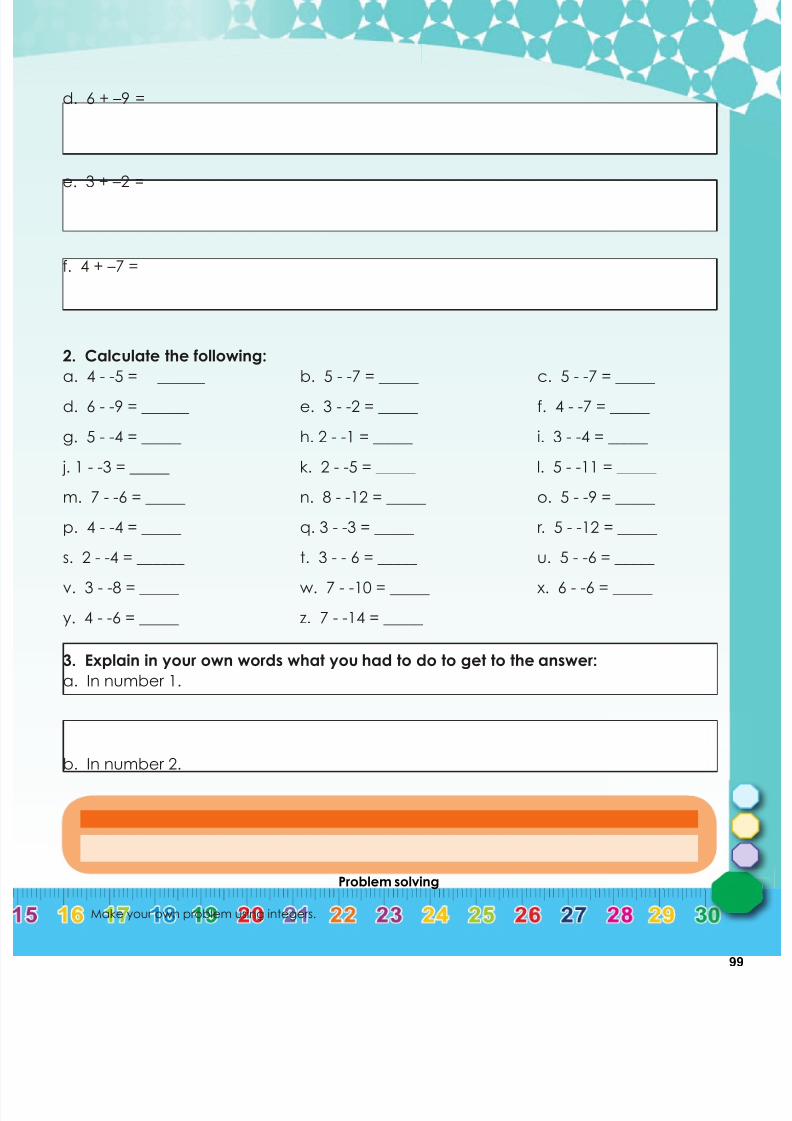
7/21/2019 Numeracy Gr 7
http://slidepdf.com/reader/full/numeracy-gr-7 101/166
99
Problem solving
Make your own problem using integers.
d. 6 + –9 =
e. 3 + –2 =
f. 4 + –7 =
2. Calculate the following:
a. 4 - -5 = ______ b. 5 - -7 = _____ c. 5 - -7 = _____ d. 6 - -9 = ______ e. 3 - -2 = _____ f. 4 - -7 = _____
g. 5 - -4 = _____ h. 2 - -1 = _____ i. 3 - -4 = _____
j. 1 - -3 = _____ k. 2 - -5 = _____ l. 5 - -11 = _____
m. 7 - -6 = _____ n. 8 - -12 = _____ o. 5 - -9 = _____
p. 4 - -4 = _____ q. 3 - -3 = _____ r. 5 - -12 = _____
s. 2 - -4 = ______ t. 3 - - 6 = _____ u. 5 - -6 = _____
v. 3 - -8 = _____ w. 7 - -10 = _____ x. 6 - -6 = _____
y. 4 - -6 = _____ z. 7 - -14 = _____
3. Explain in your own words what you had to do to get to the answer:
a. In number 1.
b. In number 2.
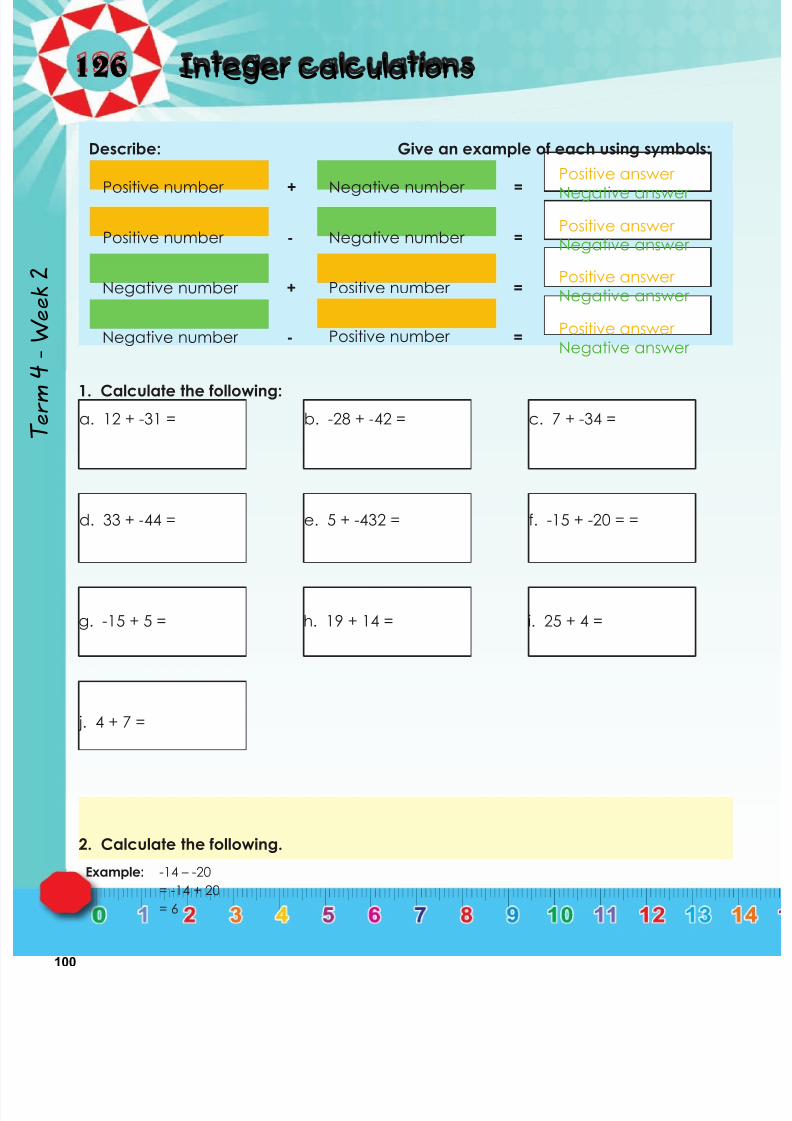
7/21/2019 Numeracy Gr 7
http://slidepdf.com/reader/full/numeracy-gr-7 102/166
100
126 Integer calculations
Term4
Week2
Positive number
Describe: Give an example of each using symbols:
Positive number
Negative number
Negative number
+
-
+
-
Negative number
Negative number
Positive number
Positive number
=
=
=
=
Positive answer
Negative answer
Positive answer Negative answer
Positive answer Negative answer
Positive answer
Negative answer
1. Calculate the following:
a. 12 + -31 = b. -28 + -42 = c. 7 + -34 =
d. 33 + -44 = e. 5 + -432 = f. -15 + -20 = =
g. -15 + 5 = h. 19 + 14 = i. 25 + 4 =
j. 4 + 7 =
2. Calculate the following.
Example: -14 – -20
= -14 + 20
= 6

7/21/2019 Numeracy Gr 7
http://slidepdf.com/reader/full/numeracy-gr-7 103/166
101
Problem solving
Give three integers of which the sum is -9. Use two positive integers and one negative integer
a. 7 - -31 = b. 35 - 31 = c. -17 - 8 =
d. 47 - -46 = e. -41 - 17 = f. 28 - -46 =
g. -47 - -7 = h. -28 - 15 = i. -15 - 3 =
j. 5 - 31 =
3. Calculate the following:
a. _____ + 44 = 42 b. _____+ -18 = -32 c. _____ + -21 = -30
d. -3 + _____ = 33 e. 14 + _____ = 16 f. 14 + _____ = 63
g. 42 + _____ = 65 h. _____ + -10 = -12 i. 38 + _____ = 65
j. -46 + _____ = -72 k. _____ + -43 = -41 l. _____ + -16 = 30
m. _____ + -44 = -81 n. _____ + -31 = 6 o. _____ + -28 = -32
p. 11 + _____ = -19 q. _____ + 24 = 6 r. 45 + _____ = 73
s. _____ + -29 = 1 t. 12 + _____ = -32 u. -44 + _____ = -15
v. _____ + 24 = -11 w. _____ + 10 = 33 x. _____ + 49 = 18
y. _____ + 4 = 26 z. 41 + _____ = 60
Give three integers of which the sum is -4. Use two negative integers and one positive integer.
Give four integers of which the sum is -11. Use two negative integers and two positive integers.

7/21/2019 Numeracy Gr 7
http://slidepdf.com/reader/full/numeracy-gr-7 104/166
102
127 commutative property integers
Term4
Week2
8 + 4 = 4 + 8
The commutative
property of number
says that you can
swap numbers aroundand still get the same
answer.This is when you
add or multiply.
In this worksheetwe will work withintegers.
5 × 4 = 4 × 5
1. Use the commutative property to make the equation equal. Calculate it.
Example: 8 + (-3) = (-3) + 8 = 5
(-8) + 3 = 3 + (-8) = -5
a. 4 + (-5) b. (-10) + 7 c. 3 + (-9)
d. 8 + (-11) e. (-4) + 8 f. 9 + (-2)
2. Substitute and calculate.
Example: a = -2 and b = 3
a + b = b + a
(-2) + 3 = 3 + (-2)
1 = 1
a. a + b = b + a if a + 4; b = -1 b. a + b = b + a if a + -2; b = 7

7/21/2019 Numeracy Gr 7
http://slidepdf.com/reader/full/numeracy-gr-7 105/166
103
Problem solving
Use the commutative property to make your own equation and prove that it is equal using the numbers –8 and 21.
c. a + b = b + a if a = -2; b = 7 d. x + y = y + x if x = -1; y = 13
e. x + y = y + x if x + -5; y = 9 f. d + e = e + d if e = -12; d = 7
g. t + s = s + t if t = -4; s = 10 h. a + b = b + a if a = -10; b = 7
i. y + z = z + y if z = -8; y = 2 j. k + m = m + k if k = -13; m = 20
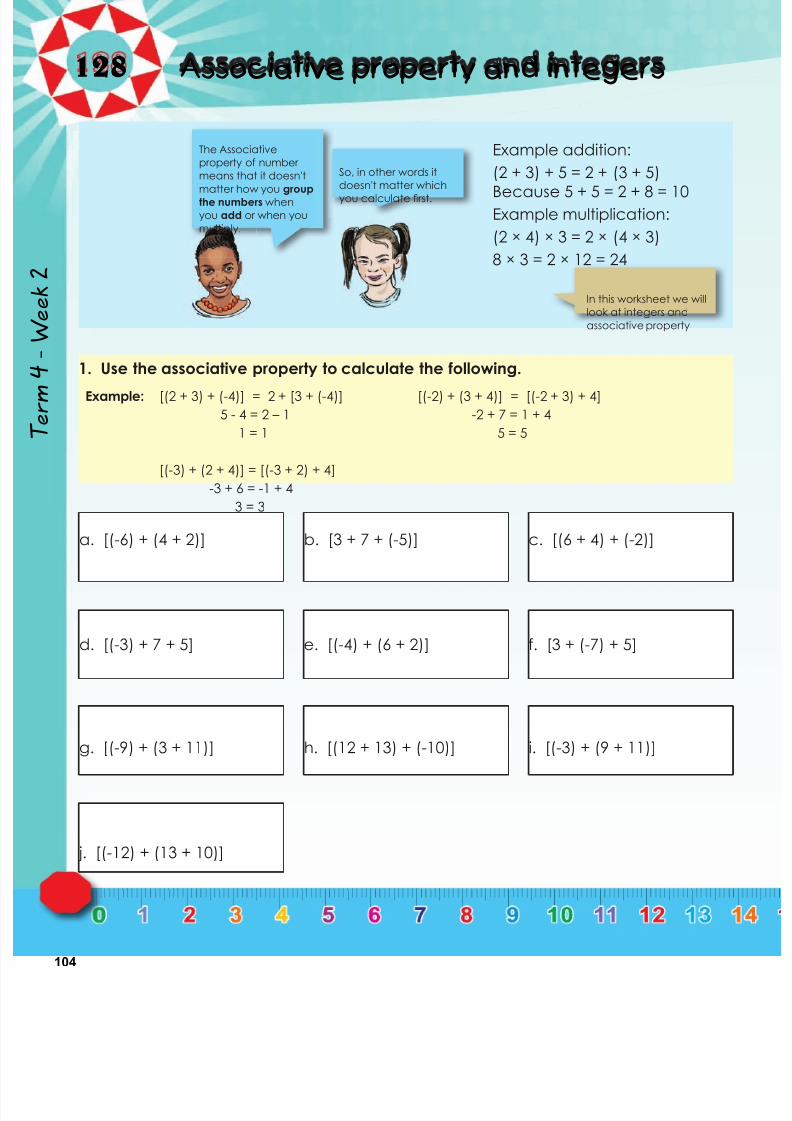
7/21/2019 Numeracy Gr 7
http://slidepdf.com/reader/full/numeracy-gr-7 106/166
104
128 Associative property and integers
Term4
Week2
The Associative
property of number
means that it doesn't
matter how you groupthe numbers when
you add or when you
multiply.
Example addition:
(2 + 3) + 5 = 2 + (3 + 5)
Because 5 + 5 = 2 + 8 = 10Example multiplication:
(2 × 4) × 3 = 2 × (4 × 3)
8 × 3 = 2 × 12 = 24
So, in other words it
doesn't matter which
you calculate first.
In this worksheet we will
look at integers and
associative property
1. Use the associative property to calculate the following.
Example: [(2 + 3) + (-4)] = 2 + [3 + (-4)] [(-2) + (3 + 4)] = [(-2 + 3) + 4]
5 - 4 = 2 – 1 -2 + 7 = 1 + 4
1 = 1 5 = 5
[(-3) + (2 + 4)] = [(-3 + 2) + 4]
-3 + 6 = -1 + 4
3 = 3
a. [(-6) + (4 + 2)] b. [3 + 7 + (-5)] c. [(6 + 4) + (-2)]
d. [(-3) + 7 + 5] e. [(-4) + (6 + 2)] f. [3 + (-7) + 5]
g. [(-9) + (3 + 11)] h. [(12 + 13) + (-10)] i. [(-3) + (9 + 11)]
j. [(-12) + (13 + 10)]

7/21/2019 Numeracy Gr 7
http://slidepdf.com/reader/full/numeracy-gr-7 107/166
105
Problem solving
Use the associative property to make your own equation and prove that it is equal using the numbers-5, 17 and 12.
2. Substitute and calculate.
Example: a = -7, b = 1, c = 2
(a + b) + c = a + (b + c)
[(-7) + 1] + 2 = (-7 ) + (1 + 2)
-6 + 2 = -7 + 3 -4 = -4
a. (a + b) + c = a + (b + c) If: a = 4 b = -5 c = 3
b. (a + b) + c = a + (b + c) If: a = 2 b = 9 c = -4
c. a + (b + c) = (a + b) + c If: a = -8 b = 1
c = 2
d. a + (b + c) = (a + b) + c If: a = -2 b = 11 c = 12
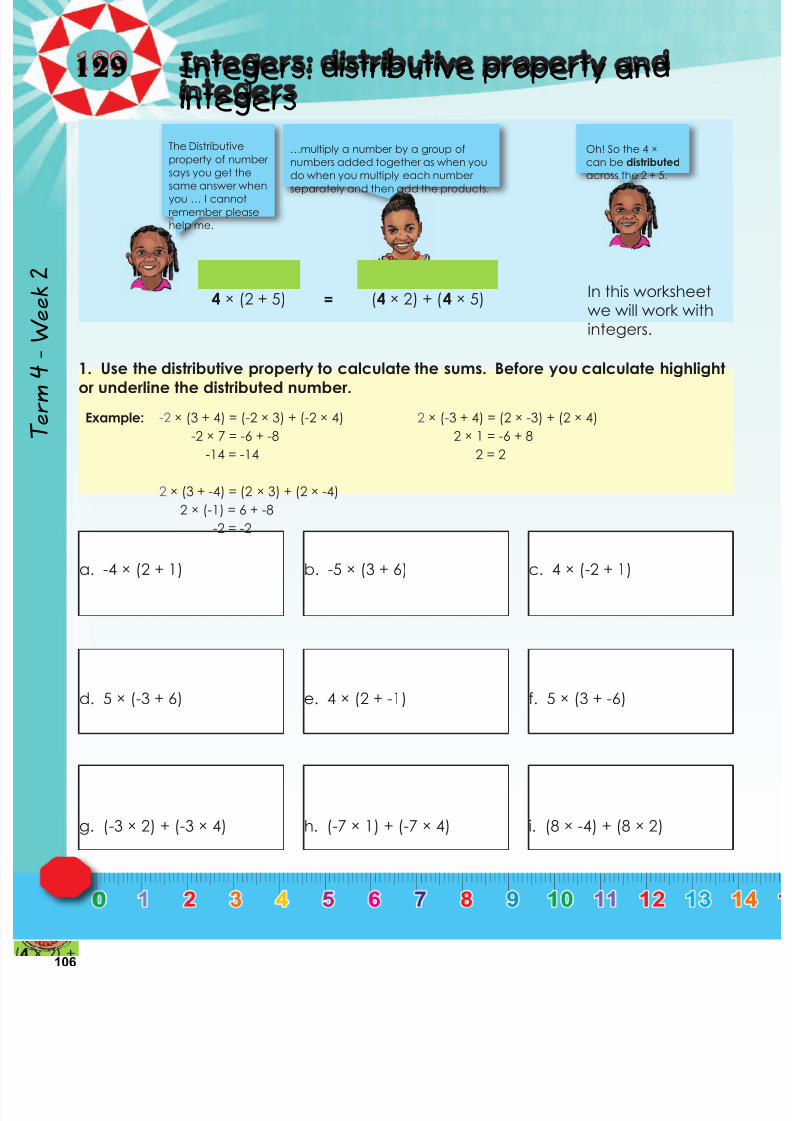
7/21/2019 Numeracy Gr 7
http://slidepdf.com/reader/full/numeracy-gr-7 108/166
106
129 Integers: distributive property andintegers
Term4
Week2
The Distributive
property of number
says you get the
same answer when
you … I cannot
remember please
help me.
…multiply a number by a group of
numbers added together as when you
do when you multiply each number
separately and then add the products.
1. Use the distributive property to calculate the sums. Before you calculate highlight
or underline the distributed number.
Example: -2 × (3 + 4) = (-2 × 3) + (-2 × 4) 2 × (-3 + 4) = (2 × -3) + (2 × 4)
-2 × 7 = -6 + -8 2 × 1 = -6 + 8
-14 = -14 2 = 2
2 × (3 + -4) = (2 × 3) + (2 × -4)
2 × (-1) = 6 + -8
-2 = -2
a. -4 × (2 + 1) b. -5 × (3 + 6) c. 4 × (-2 + 1)
d. 5 × (-3 + 6) e. 4 × (2 + -1) f. 5 × (3 + -6)
g. (-3 × 2) + (-3 × 4) h. (-7 × 1) + (-7 × 4) i. (8 × -4) + (8 × 2)
4 × (2 + 5) In this worksheetwe will work withintegers.
Oh! So the 4 ×
can be distributed
across the 2 + 5.
(4 × 2) + (4 × 5)=
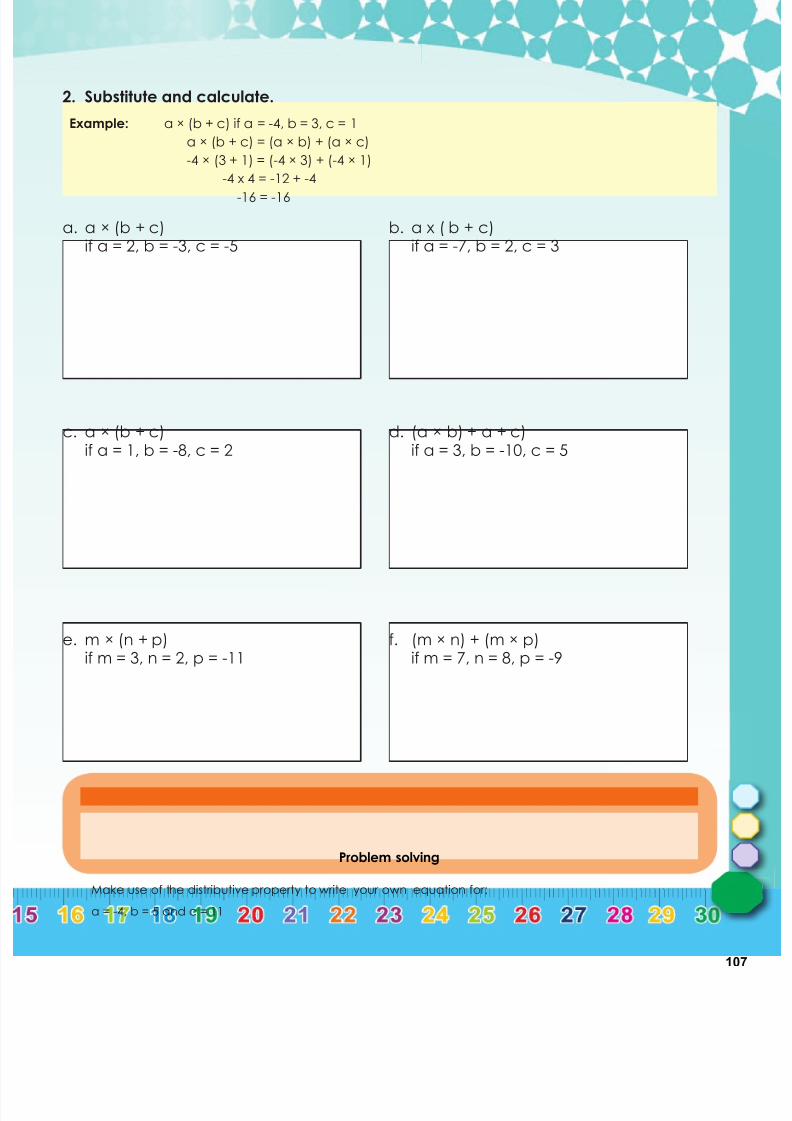
7/21/2019 Numeracy Gr 7
http://slidepdf.com/reader/full/numeracy-gr-7 109/166
107
Problem solving
Make use of the distributive property to write your own equation for:
a = -4, b = 5 and c = 11
2. Substitute and calculate.
Example: a × (b + c) if a = -4, b = 3, c = 1
a × (b + c) = (a × b) + (a × c)
-4 × (3 + 1) = (-4 × 3) + (-4 × 1)
-4 x 4 = -12 + -4
-16 = -16
a. a × (b + c) if a = 2, b = -3, c = -5
b. a x ( b + c) if a = -7, b = 2, c = 3
c. a × (b + c) if a = 1, b = -8, c = 2
d. (a × b) + a + c) if a = 3, b = -10, c = 5
e. m × (n + p) if m = 3, n = 2, p = -11
f. (m × n) + (m × p) if m = 7, n = 8, p = -9
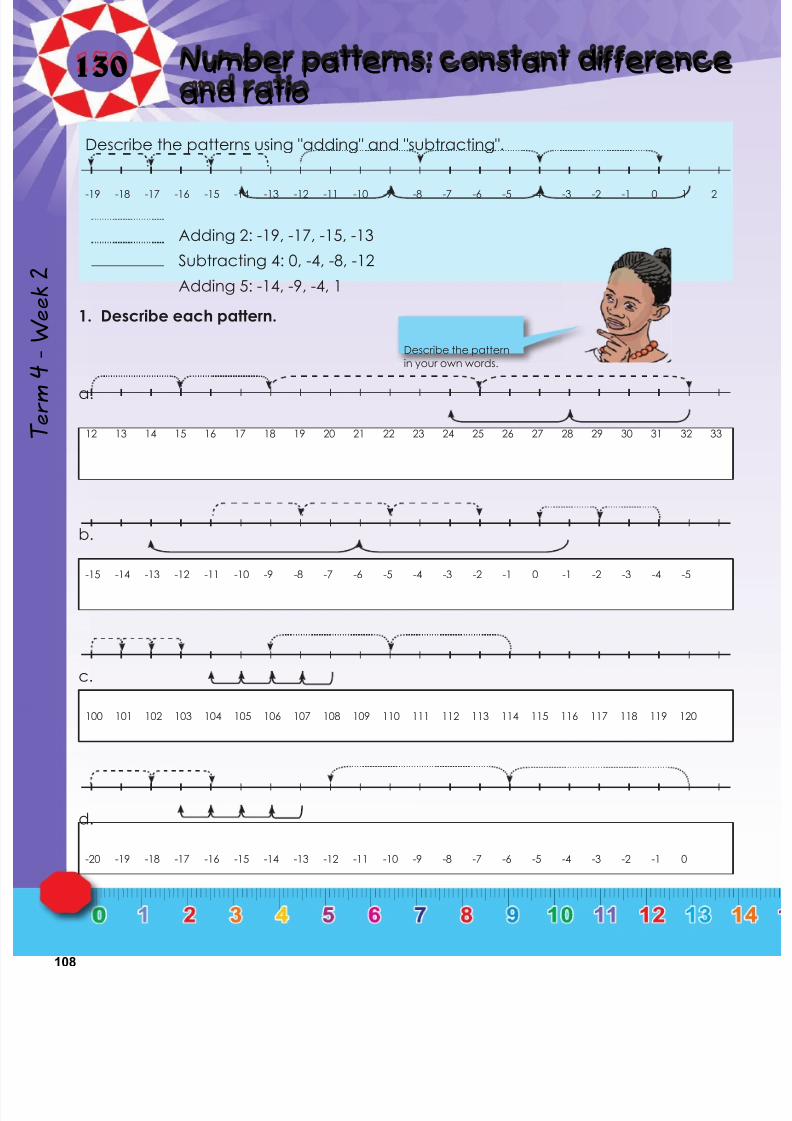
7/21/2019 Numeracy Gr 7
http://slidepdf.com/reader/full/numeracy-gr-7 110/166
108
130 Number patterns: constant differenceand ratio
Term4
Week2
1. Describe each pattern.
a.
Describe the patterns using "adding" and "subtracting".
-19 -18 -17 -16 -15 -14 -13 -12 -11 -10 -9 -8 -7 -6 -5 -4 -3 -2 -1 0 1 2
Adding 2: -19, -17, -15, -13
Subtracting 4: 0, -4, -8, -12
Adding 5: -14, -9, -4, 1
12 13 14 15 16 17 18 19 20 21 22 23 24 25 26 27 28 29 30 31 32 33
b.
-15 -14 -13 -12 -11 -10 -9 -8 -7 -6 -5 -4 -3 -2 -1 0 -1 -2 -3 -4 -5
c.
100 101 102 103 104 105 106 107 108 109 110 111 112 113 114 115 116 117 118 119 120
d.
-20 -19 -18 -17 -16 -15 -14 -13 -12 -11 -10 -9 -8 -7 -6 -5 -4 -3 -2 -1 0
Describe the pattern
in your own words.
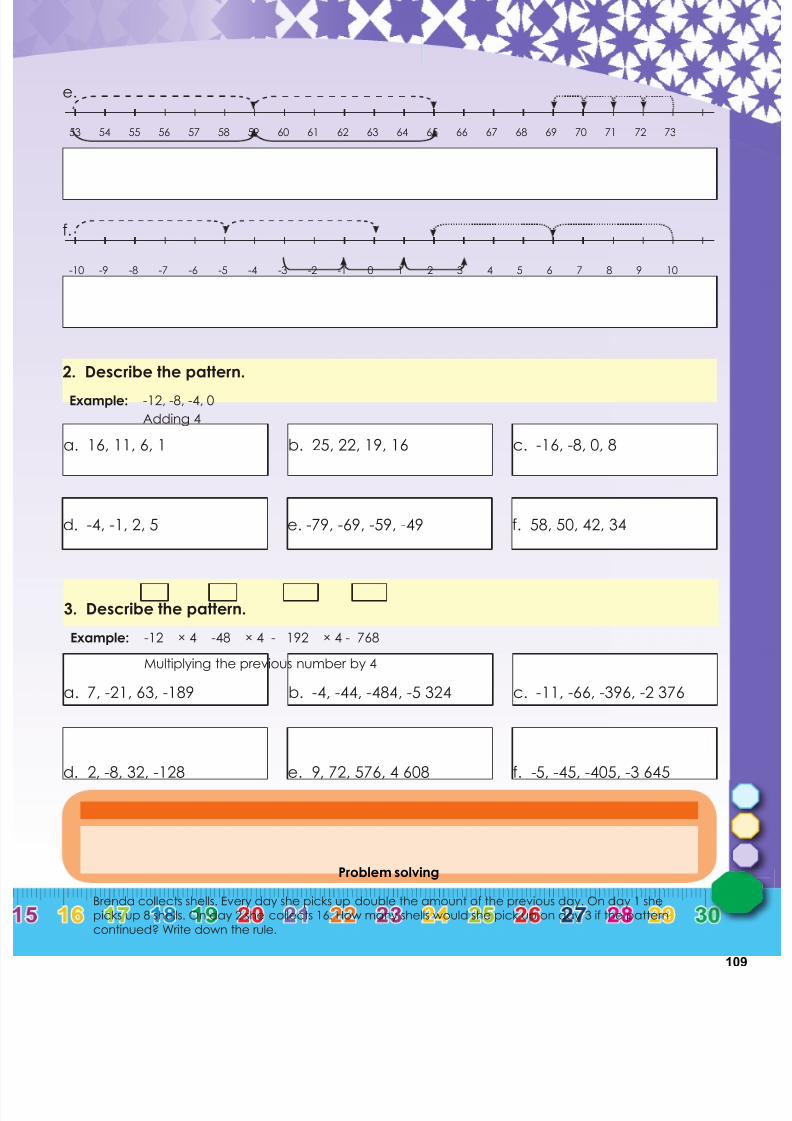
7/21/2019 Numeracy Gr 7
http://slidepdf.com/reader/full/numeracy-gr-7 111/166
109
Problem solving
Brenda collects shells. Every day she picks up double the amount of the previous day. On day 1 shepicks up 8 shells. On day 2 she collects 16. How many shells would she pick up on day 3 if the pattern
continued? Write down the rule.
e.
53 54 55 56 57 58 59 60 61 62 63 64 65 66 67 68 69 70 71 72 73
f.
-10 -9 -8 -7 -6 -5 -4 -3 -2 -1 0 1 2 3 4 5 6 7 8 9 10
2. Describe the pattern.
Example: -12, -8, -4, 0
Adding 4
a. 16, 11, 6, 1 b. 25, 22, 19, 16 c. -16, -8, 0, 8
d. -4, -1, 2, 5 e. -79, -69, -59, -49 f. 58, 50, 42, 34
3. Describe the pattern.
Example: -12 × 4 -48 × 4 - 192 × 4 - 768
Multiplying the previous number by 4
a. 7, -21, 63, -189 b. -4, -44, -484, -5 324 c. -11, -66, -396, -2 376
d. 2, -8, 32, -128 e. 9, 72, 576, 4 608 f. -5, -45, -405, -3 645

7/21/2019 Numeracy Gr 7
http://slidepdf.com/reader/full/numeracy-gr-7 112/166
110
131 Number patterns: neither a constantdifference nor a constant ratio
Term4
Week2
Describe the following: -1, -2, -4, -7, -11, -16, …
What will the next three terms be, using the identified rule?
This pattern has neither a constant difference nor a constant ratio. It can bedescribed in your own words as “increasing the difference between consecutive
terms by 1 each time” or “subtracting 1 more than what was subtracted to get theprevious term”. Using this rule, the next three terms will be -22, -29, -37.
Take your time to describe
the pattern in words.
1. Describe the pattern and make a drawing to show each term.
Example: 15, 22, 16, 21, 17
15 + 7 22 - 6 16 +5 21 -4 17
a. -4, 1, 5, 8, 10 b. 8, 10, 13, 17, 22
Each number of the number
pattern is called a term.
c. 2, -2, -8, -16, -26 d. -11, -12, -10, -13, -9
e. -7, -1, 11, 29, 53 f. 5, -3, -10, -16, -21
2. What will the tenth pattern be?
Example: 12, 24, 36, 48
Position of the term × 12
Position in the sequence 1 2 3 4 10
Term 12 24 36 48 120
a.Position in the sequence 1 2 3 4 10Term -5 -10 -15 -20
b. Position in the sequence 1 2 3 4 10
Term 8 16 24 32
c. Position in the sequence 1 2 3 4 10
Term -12 -24 -36 -48

7/21/2019 Numeracy Gr 7
http://slidepdf.com/reader/full/numeracy-gr-7 113/166
111
Problem solving
Thabo builds a brick wall around the perimeter ofhis house. On the first day he uses 75 bricks, on the
second day he uses 125 and on the third day he uses175. How many bricks will he need on the fourth day?
Write a rule for the pattern.
d. Position in the sequence 1 2 3 4 10
Term 7 14 21 28
e. Position in the sequence 1 2 3 4 10
Term -11 -22 -33 -44
3. What will the term be?
Example: 1, 4, 9, 16
Position of the term squared
Position in the sequence 1 2 3 4 15
Term 1 4 9 16 225
a. Position in the sequence 1 2 3 4 20
Term 25 50 75 100
b. Position in the sequence 1 2 3 4 104
Term -4 -8 -12 -16
c. Position in the sequence 1 2 3 4 59
Term 1 8 27 64
d. Position in the sequence 1 2 3 4 36
Term 13 26 39 52
e. Position in the sequence 1 2 3 4 29
Term 21 42 63 84
Ravi draws 2 figures on the first page, 4figures on the second page, 8 figures on
the third page, and 16 figures on the fourthpage. If this pattern continued, how many
figures would Ravi draw on the fifth page?
Lisa read 56 pages on Sunday, 66 pages
on Monday, 76 pages on Tuesday, and86 pages on Wednesday. If this pattern
continued, how many pages would Lisaread on Thursday?
Thandi cut 1 rose from the first plant, 3 roses
from the second plant, 7 roses from the thirdplant, and 13 roses from the fourth plant.
If this pattern continued, how many rosewould Thandi cut from the fifth plant?
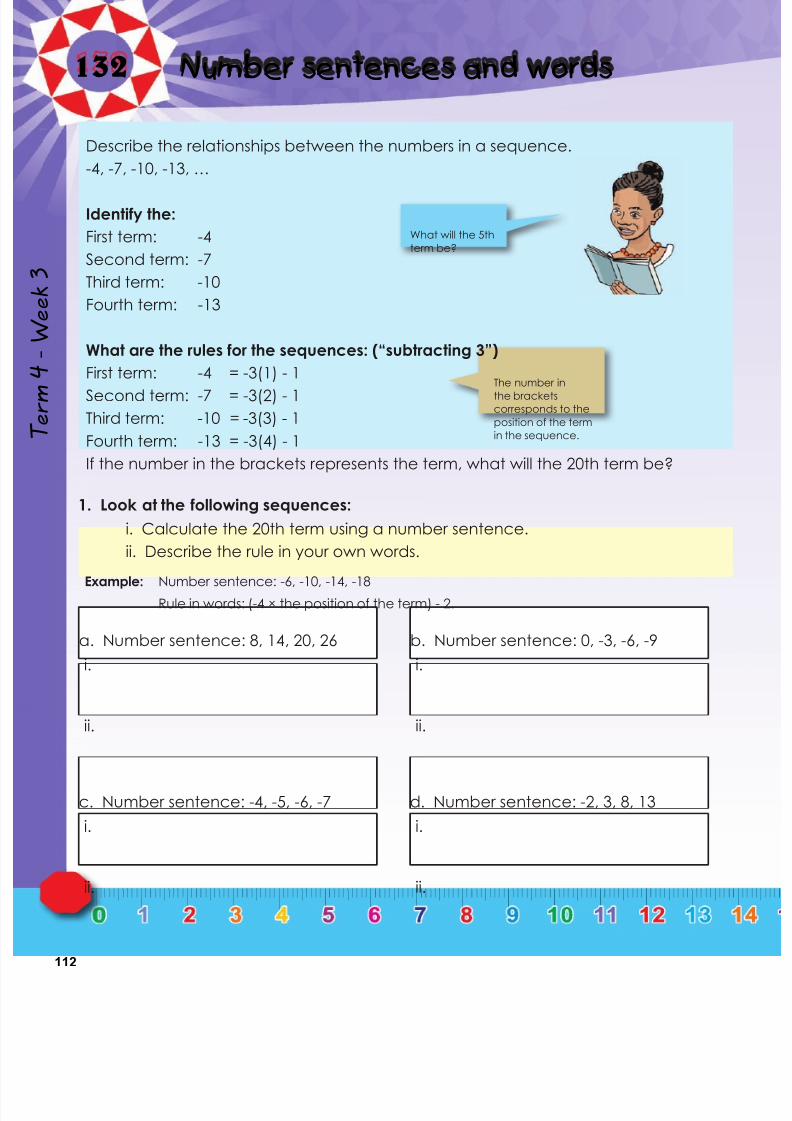
7/21/2019 Numeracy Gr 7
http://slidepdf.com/reader/full/numeracy-gr-7 114/166
112
132 Number sentences and words
Term4
Week3
1. Look at the following sequences:
i. Calculate the 20th term using a number sentence.
ii. Describe the rule in your own words.
Describe the relationships between the numbers in a sequence.
-4, -7, -10, -13, …
Identify the:
First term: -4
Second term: -7
Third term: -10
Fourth term: -13
What are the rules for the sequences: (“subtracting 3”)
First term: -4 = -3(1) - 1
Second term: -7 = -3(2) - 1
Third term: -10 = -3(3) - 1
Fourth term: -13 = -3(4) - 1
If the number in the brackets represents the term, what will the 20th term be?
The number inthe brackets
corresponds to the
position of the term
in the sequence.
Example: Number sentence: -6, -10, -14, -18
Rule in words: (-4 × the position of the term) - 2.
What will the 5th
term be?
a. Number sentence: 8, 14, 20, 26 b. Number sentence: 0, -3, -6, -9
i.
ii.
i.
ii.
c. Number sentence: -4, -5, -6, -7 d. Number sentence: -2, 3, 8, 13
i.
ii.
i.
ii.
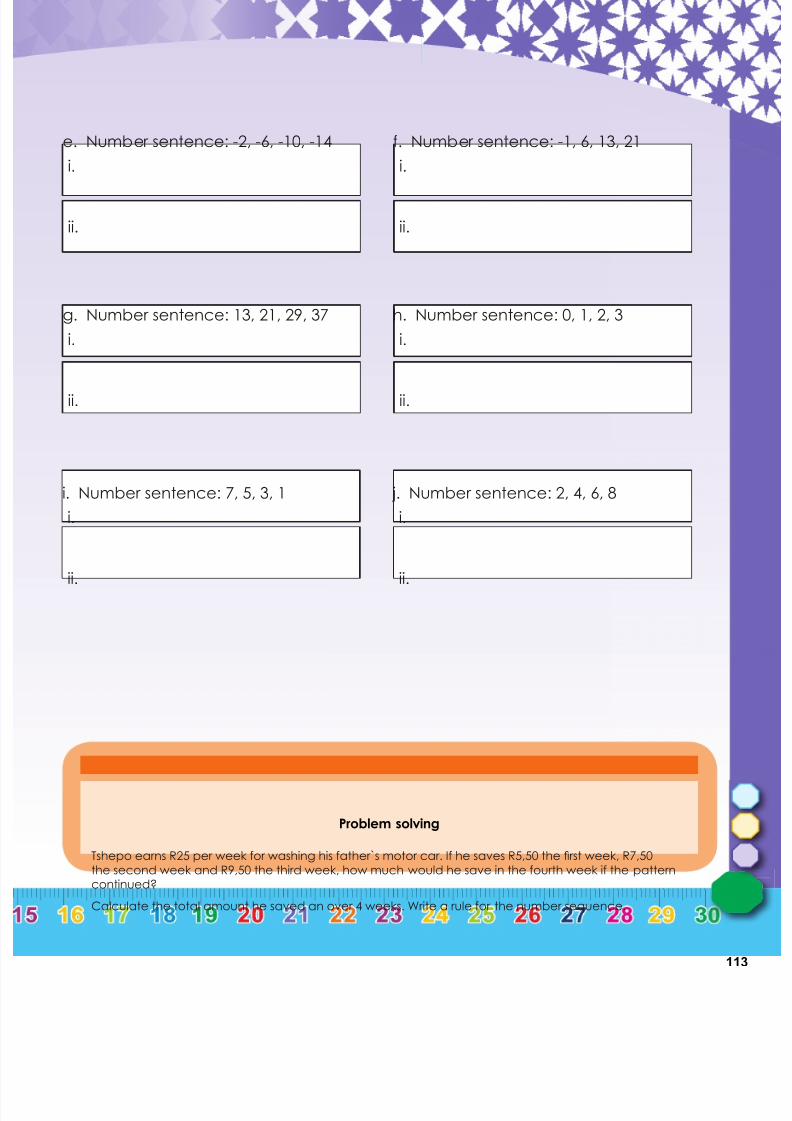
7/21/2019 Numeracy Gr 7
http://slidepdf.com/reader/full/numeracy-gr-7 115/166
113
Problem solving
Tshepo earns R25 per week for washing his father`s motor car. If he saves R5,50 the first week, R7,50the second week and R9,50 the third week, how much would he save in the fourth week if the patterncontinued?
Calculate the total amount he saved an over 4 weeks. Write a rule for the number sequence.
e. Number sentence: -2, -6, -10, -14 f. Number sentence: -1, 6, 13, 21
i.
ii.
i.
ii.
g. Number sentence: 13, 21, 29, 37 h. Number sentence: 0, 1, 2, 3
i.
ii.
i.
ii.
i. Number sentence: 7, 5, 3, 1 j. Number sentence: 2, 4, 6, 8
i.
ii.
i.
ii.
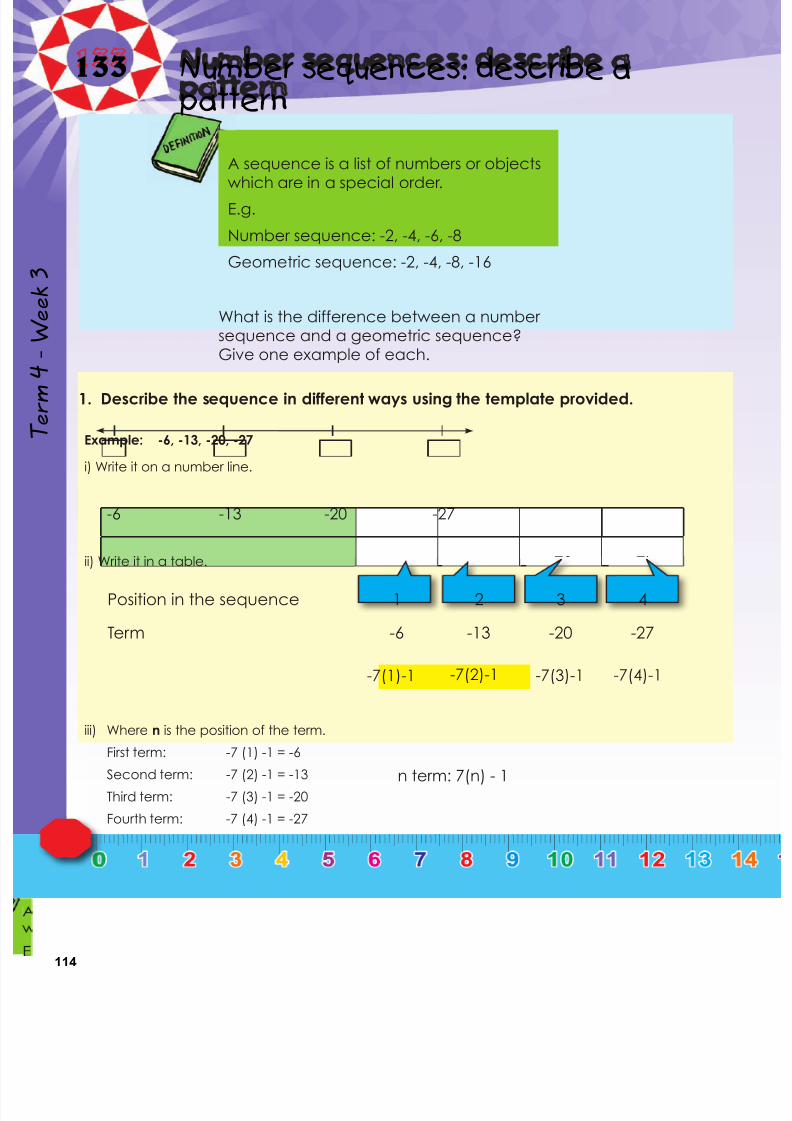
7/21/2019 Numeracy Gr 7
http://slidepdf.com/reader/full/numeracy-gr-7 116/166
114
133 Number sequences: describe apattern
Term4
Week3
A sequence is a list of numbers or objectswhich are in a special order.
E.g.
Number sequence: -2, -4, -6, -8
Geometric sequence: -2, -4, -8, -16
What is the difference between a numbersequence and a geometric sequence?Give one example of each.
1. Describe the sequence in different ways using the template provided.
Example: -6, -13, -20, -27
i) Write it on a number line.
-6 -13 -20 -27
Position in the sequence 1 2 3 4
Term -6 -13 -20 -27
ii) Write it in a table.
-7(1)-1 -7(2)-1 -7(3)-1 -7(4)-1
iii) Where n is the position of the term.
First term: -7 (1) -1 = -6
Second term: -7 (2) -1 = -13
Third term: -7 (3) -1 = -20
Fourth term: -7 (4) -1 = -27
n term: 7(n) - 1

7/21/2019 Numeracy Gr 7
http://slidepdf.com/reader/full/numeracy-gr-7 117/166
115
a. -1, 2, 5, 8
i)
ii)Position in the sequence 1 2 3 4
Term
First term:
Second term:
iii) Where n is the position of the term.
Third term:
Fourth term:
n term:
b. 3, 5, 7, 9
i)
ii)Position in the sequence 1 2 3 4
Term
First term:
Second term:
iii) Where n is the position of the term.
Third term:
Fourth term:
n term:
continued☛

7/21/2019 Numeracy Gr 7
http://slidepdf.com/reader/full/numeracy-gr-7 118/166
116
133b Number sequences: describe apattern continued
Term4
Week3
c. -11, -19, -27, -35
i)
ii)Position in the sequence 1 2 3 4
Term
First term:
Second term:
iii) Where n is the position of the term.
Third term:
Fourth term:
n term:
d. 16, 22, 28, 34
i)
ii)Position in the sequence 1 2 3 4
Term
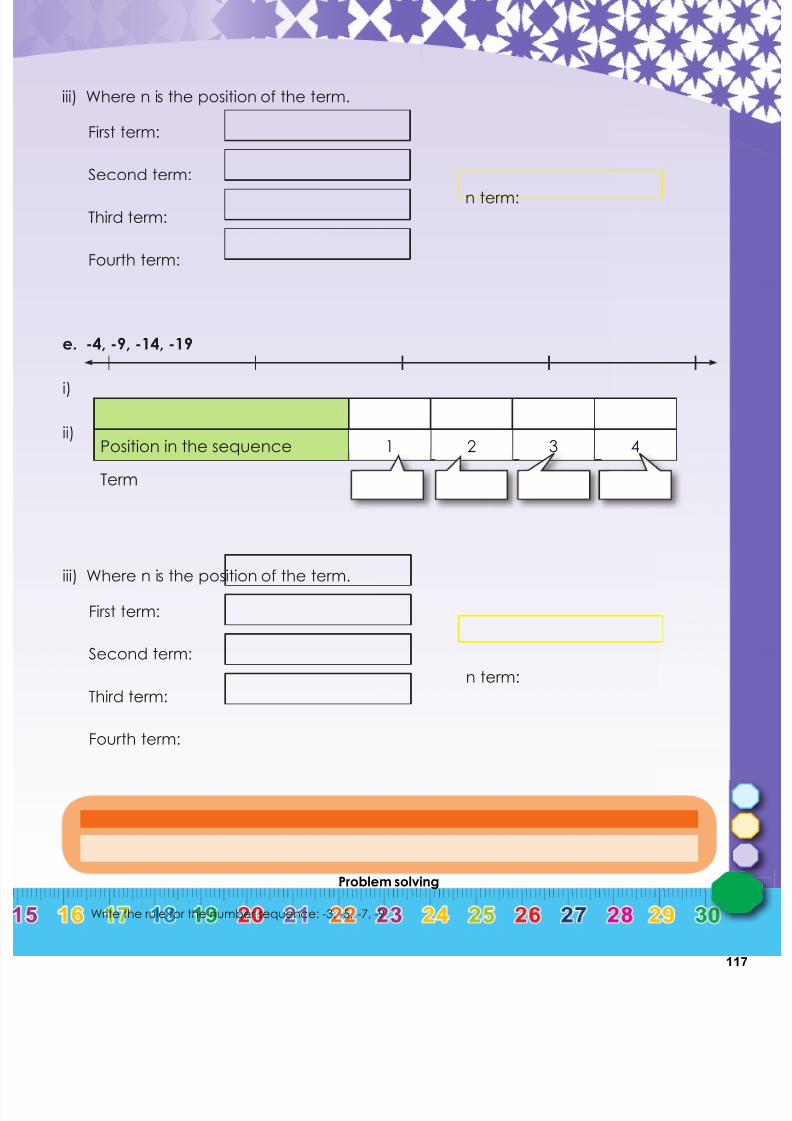
7/21/2019 Numeracy Gr 7
http://slidepdf.com/reader/full/numeracy-gr-7 119/166
117
Problem solving
Write the rule for the number sequence: -3, -5, -7, -9
First term:
Second term:
iii) Where n is the position of the term.
Third term:
Fourth term:
n term:
e. -4, -9, -14, -19
i)
ii)Position in the sequence 1 2 3 4
Term
First term:
Second term:
iii) Where n is the position of the term.
Third term:
Fourth term:
n term:

7/21/2019 Numeracy Gr 7
http://slidepdf.com/reader/full/numeracy-gr-7 120/166
118
134 Input and output values
Term4
Week3
Look and discuss.
b = -a × 9
1
9
11
25
8
a b
-9
-81
-99
-225
-72
b = -a × 9The rule is:
b = -a × 9. Look at the flow diagram.
Which numbers can replace a?
• b = -1 × 9 = -9
• b = -9 × 9 = -81
• b = -11 × 9 = -99
• b = -25 × 9 = -225
• b = -8 × 9 = -72
t = -p × 5 + 6
2
8
6
5
3
p tCalculate:
• t = -2 x 5 + 6 = -16
• t = -8 x 5 + 6 = -46
• t = -6 x 5 + 6 = -36
• t = -5 x 5 + 6 = -31
• t = -3 x 5 + 6 = -21
a. b.
t = -p × -3
23
16
28
34
15
t = p × (-6)
1
17
12
9
36
p t p t
1. Revision: complete the flow diagrams.

7/21/2019 Numeracy Gr 7
http://slidepdf.com/reader/full/numeracy-gr-7 121/166
119
continued☛
c. d.
t = -p × 2 + 7
30
9
-27
-8
15
t = p × -7
19
2
11
8
17
p t p t
Example: a b = a × 4
• -3 x 4 = -12
• -2 x 4 = -8
• -5 x 4 = -20
• -7 x 4 = -28
• -4 x 4 = -16
2. Use the given rule to calculate the value of b.
b = -a × 4
3
2
5
7
4
b
a. b.
b = a × 15
2
8
12
20
29
b = -a × 6
6
15
8
2
17
a b a b
c. d.
s = r + 11
15
18
20
31
16
y = -x + 9
2
1
3
11
25
x y r s

7/21/2019 Numeracy Gr 7
http://slidepdf.com/reader/full/numeracy-gr-7 122/166
120
134b Input and output values continued
Term4
Week3
Example: a
3. Use the given rule to calculate the variable.
b = -a × 2 + 3
4
6
7
8
9
b
a. b.
g = h × 2 +15
17
2
8
14
29
a = b × 3 + 10
39
16
13
25
10
b a h h
c. d.
m = n + 8 × 2
5
10
12
33
7
x = y × 2 + 4
12
8
24
10
18
y x n m
11
15
17
19
21

7/21/2019 Numeracy Gr 7
http://slidepdf.com/reader/full/numeracy-gr-7 123/166
121
Problem solving
• Draw your own spider diagram where a = -c - 9.
• Draw your own spider diagram where a = c x 3 -7
e. f. 40
64
88
112
136
c = b × -2 + 6
31
28
16
9
14
b c q p
4. Prepare one flow diagram to present to the class.
p = q × 12 +16

7/21/2019 Numeracy Gr 7
http://slidepdf.com/reader/full/numeracy-gr-7 124/166
122
135 More input and output values
Term4
Week3
x 1 2 3 4 12 n
y 5 7 9 11 m 93
1. Solve for m and n
a. x = 3 y - 1 b. x = -2y + 6
y 2 4 6 n 10 20
x 23 m
y 1 2 3 5 n
x m -174
c. y = -4x - 2 d. y = x + 2
x 3 4 5 6 n 10 100
y -30 m
x 2 n 4 5 16 17
y 5 m
e. t = -8s + 2 f. p = 7q - 7
s 1 2 3 n 5 6 7
t 30 m
f 1 5 10 20 n 100
q m 168
1. What is the value ofm and n?
Example: y = -7x + 2
x 1 2 3 4 15 m 60
y -5 -12 -19 -26 -103 18 n
27
45Why is n = 45
and m = 27?
To find m and n, you have to substitute the
corresponding values for x or y into the
rule and solve the equation by inspection.The rule y = 2x + 3 describes the
relationship between the given
x and y values in the table. But in tables such as this one, more than one rule
might be possible to describe the relationship
between x and y values.
Multiple rules are acceptable if they match the given
input values to the corresponding output values
Now try andfind anotherrule
Rule: the given term x – 7 + 2
n = -418 and m = -2
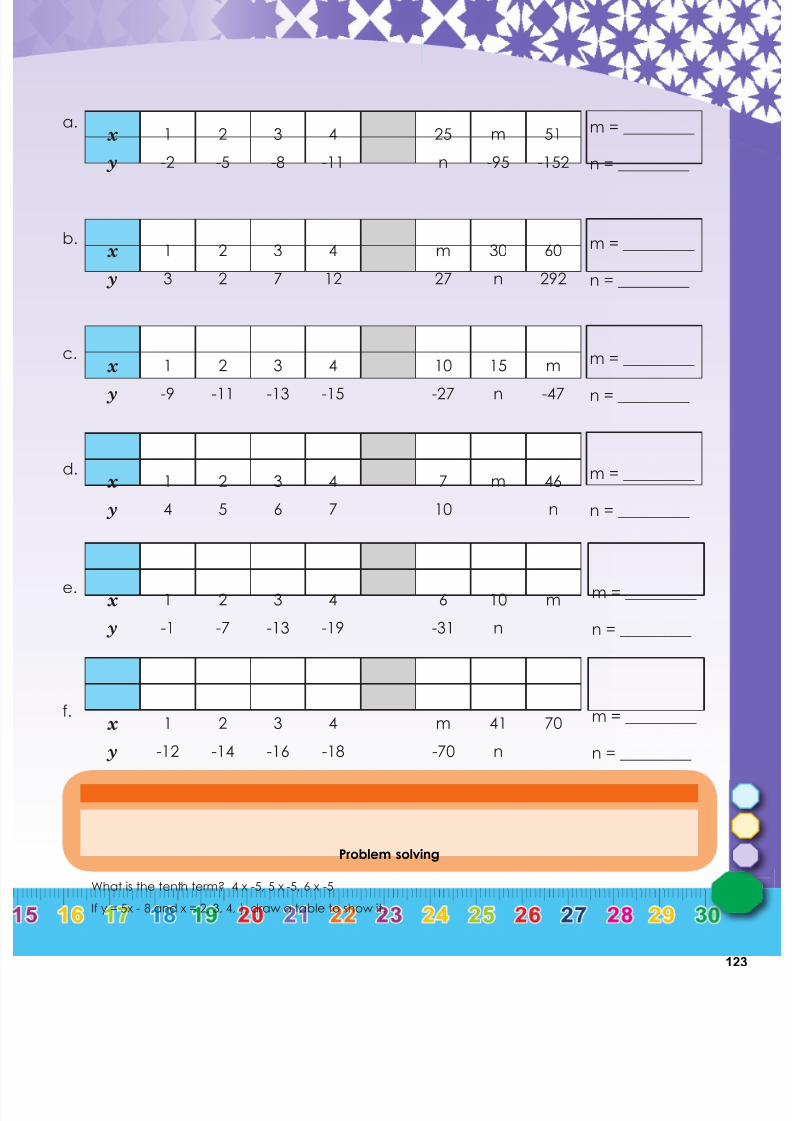
7/21/2019 Numeracy Gr 7
http://slidepdf.com/reader/full/numeracy-gr-7 125/166
123
a.x 1 2 3 4 25 m 51
y -2 -5 -8 -11 n -95 -152
b.x 1 2 3 4 m 30 60
y 3 2 7 12 27 n 292
c.x 1 2 3 4 10 15 m
y -9 -11 -13 -15 -27 n -47
d.x 1 2 3 4 7 m 46
y 4 5 6 7 10 n
e.x 1 2 3 4 6 10 m
y -1 -7 -13 -19 -31 n
f.x 1 2 3 4 m 41 70
y -12 -14 -16 -18 -70 n
Problem solving
What is the tenth term? 4 x -5, 5 x -5, 6 x -5
If y = 5x - 8 and x = 2, 3, 4, ), draw a table to show it.
m = _________
n = _________
m = _________
n = _________
m = _________
n = _________
m = _________
n = _________
m = _________
n = _________
m = _________
n = _________
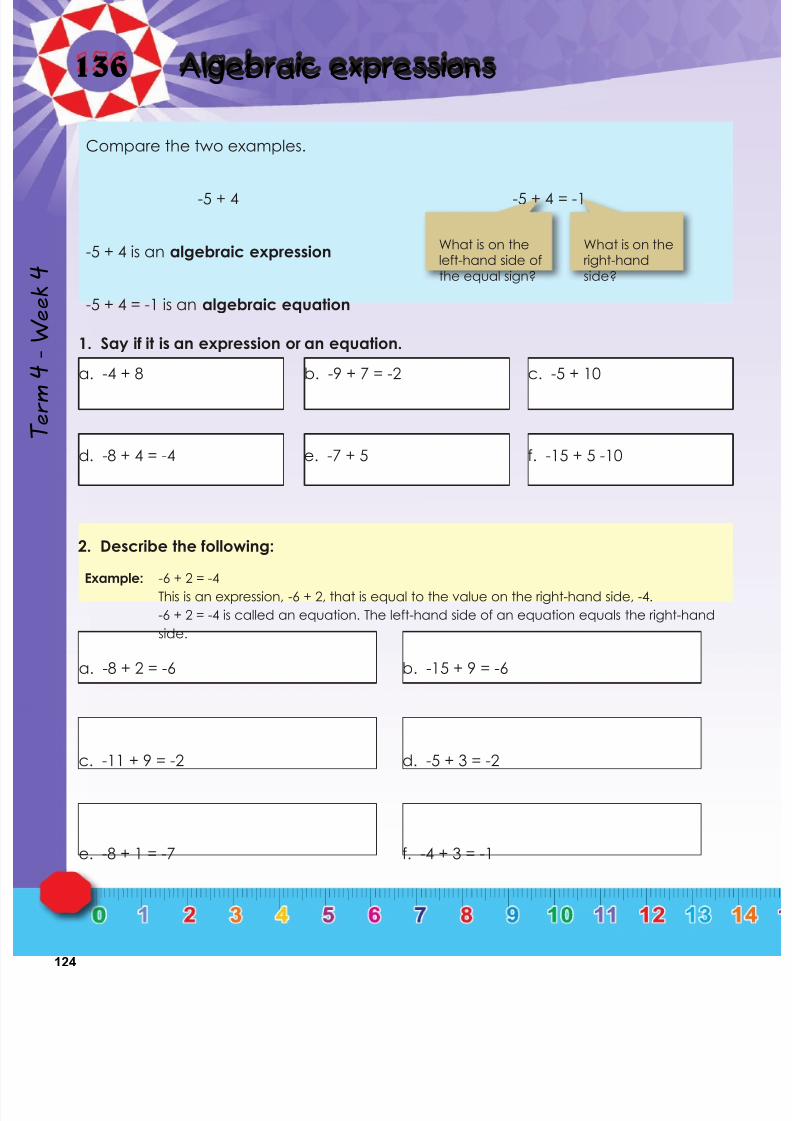
7/21/2019 Numeracy Gr 7
http://slidepdf.com/reader/full/numeracy-gr-7 126/166
124
136 Algebraic expressions
Term4
Week4
Compare the two examples.
-5 + 4 -5 + 4 = -1
-5 + 4 is an algebraic expression
-5 + 4 = -1 is an algebraic equation
a. -4 + 8 b. -9 + 7 = -2 c. -5 + 10
1. Say if it is an expression or an equation.
Example: -6 + 2 = -4 This is an expression, -6 + 2, that is equal to the value on the right-hand side, -4.
-6 + 2 = -4 is called an equation. The left-hand side of an equation equals the right-hand
side.
What is on theleft-hand side ofthe equal sign?
What is on theright-handside?
d. -8 + 4 = -4 e. -7 + 5 f. -15 + 5 -10
2. Describe the following:
a. -8 + 2 = -6 b. -15 + 9 = -6
c. -11 + 9 = -2 d. -5 + 3 = -2
e. -8 + 1 = -7 f. -4 + 3 = -1
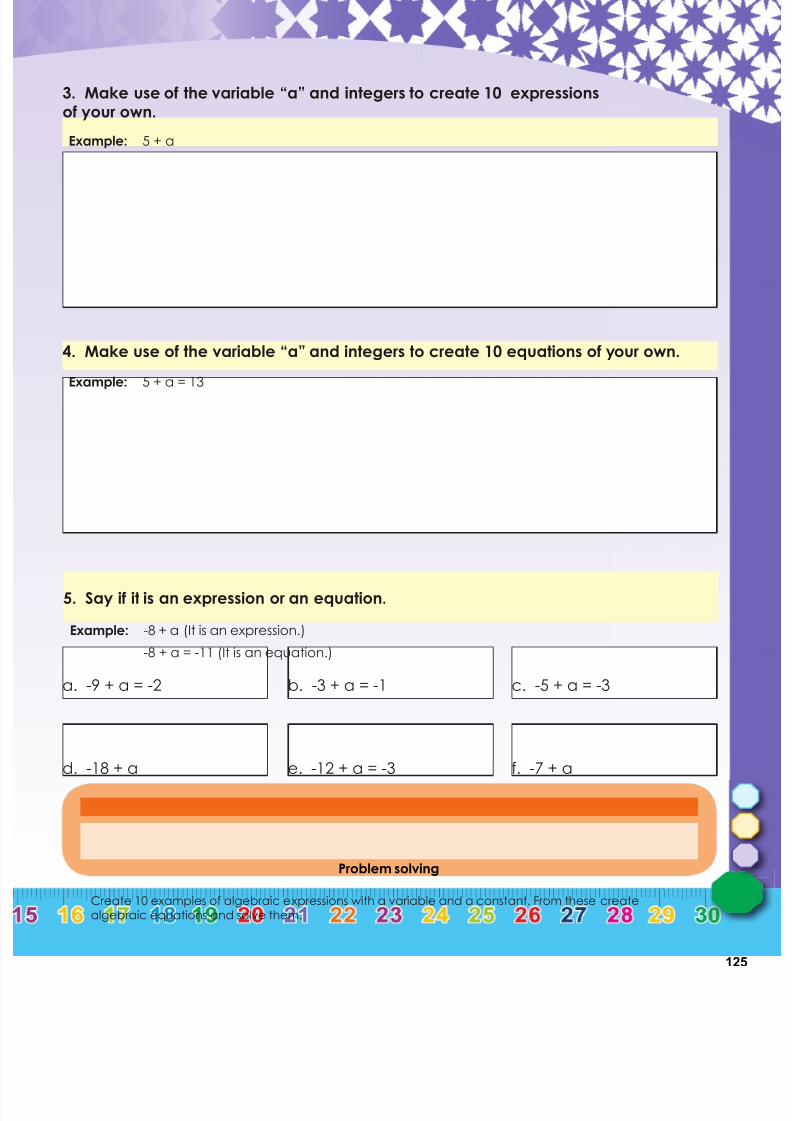
7/21/2019 Numeracy Gr 7
http://slidepdf.com/reader/full/numeracy-gr-7 127/166
125
Problem solving
Create 10 examples of algebraic expressions with a variable and a constant. From these create
algebraic equations and solve them.
Example: 5 + a
3. Make use of the variable “a” and integers to create 10 expressionsof your own.
Example: 5 + a = 13
4. Make use of the variable “a” and integers to create 10 equations of your own.
Example: -8 + a (It is an expression.)
-8 + a = -11 (It is an equation.)
5. Say if it is an expression or an equation.
a. -9 + a = -2 b. -3 + a = -1 c. -5 + a = -3
d. -18 + a e. -12 + a = -3 f. -7 + a
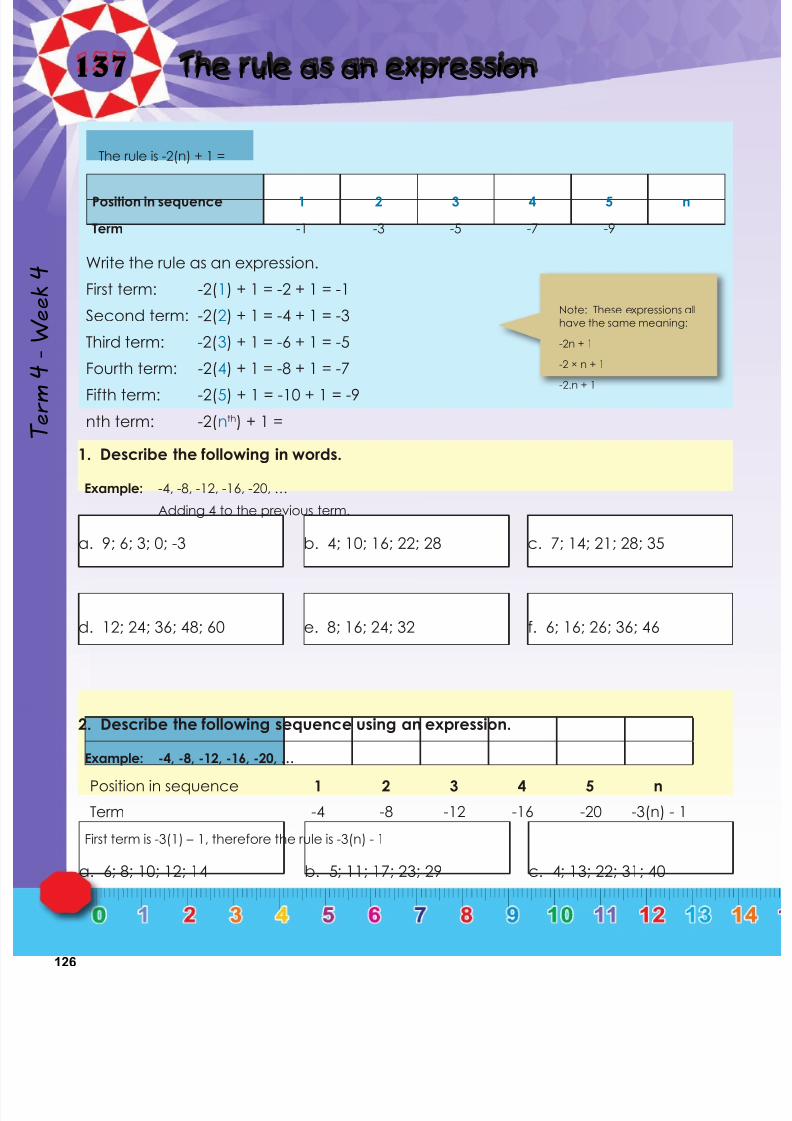
7/21/2019 Numeracy Gr 7
http://slidepdf.com/reader/full/numeracy-gr-7 128/166
126
137 The rule as an expression
Term4
Week4 Write the rule as an expression.
First term: -2(1) + 1 = -2 + 1 = -1
Second term: -2(2) + 1 = -4 + 1 = -3
Third term: -2(3) + 1 = -6 + 1 = -5
Fourth term: -2(4) + 1 = -8 + 1 = -7
Fifth term: -2(5) + 1 = -10 + 1 = -9
nth term: -2(nth) + 1 =
Note: These expressions all
have the same meaning:
-2n + 1
-2 × n + 1
-2.n + 1
The rule is -2(n) + 1 =
Position in sequence 1 2 3 4 5 n
Term -1 -3 -5 -7 -9
a. 9; 6; 3; 0; -3 b. 4; 10; 16; 22; 28 c. 7; 14; 21; 28; 35
1. Describe the following in words.
Example: -4, -8, -12, -16, -20, …
Adding 4 to the previous term.
d. 12; 24; 36; 48; 60 e. 8; 16; 24; 32 f. 6; 16; 26; 36; 46
2. Describe the following sequence using an expression.
Example: -4, -8, -12, -16, -20, …
Position in sequence 1 2 3 4 5 n
Term -4 -8 -12 -16 -20 -3(n) - 1
First term is -3(1) – 1, therefore the rule is -3(n) - 1
a. 6; 8; 10; 12; 14 b. 5; 11; 17; 23; 29 c. 4; 13; 22; 31; 40

7/21/2019 Numeracy Gr 7
http://slidepdf.com/reader/full/numeracy-gr-7 129/166
127
d. 8; 16; 24; 32; 40 e. 15; 25; 35; 45; 55 f. 4; 7; 10; 13; 16
3. What does the rule mean?
Example: the rule -2n – 1 means for the following number sequence:
Position in sequence 1 2 3 4 5 n
Term -3 -5 -7 -9 -11 -2n - 1
(- 3 is the first term, - 5 is the second term, - 7 is the third term, etc.)
Position insequence
1 2 3 4 5 n
Term 7 13 16 19 23
a.Position in
sequence
1 2 3 4 5 n
Term 2 10 18 26 34
b.
Position insequence
1 2 3 4 5 n
Term 7n - 5
c.Position insequence
1 2 3 4 5 n
Term 2n - 3
d.
Position insequence
1 2 3 4 5 n
Term 8 17 26 35 44
e.Position insequence
1 2 3 4 5 n
Term 24 37 50 63 86
f.
Problem Solving
On the first day I spend R15, on the second day I spend R30, on the third day I spend R45. How muchmoney would I spend on the tenth if this pattern continued?
Write a rule for:
I save R15 in January, R30 in February R45 in March. How much money must I save in September if the
pattern continues.
Thabo sells one chocolate on Monday, three chocolates on Tuesday and five on Wednesday. How manychocolates will he sell on Friday if the pattern continues.
A farmer plants two rows of maize on the first day 6 rows on the second day and 11 rows on the third day.
How many rows must he plant on the 12th day if the pattern continues.
Bongi spends twenty minutes on the computer on day one. thirty minutes a on day two and forty minuteson day three. How much time will she spend on the computer on day nine if the pattern continues?

7/21/2019 Numeracy Gr 7
http://slidepdf.com/reader/full/numeracy-gr-7 130/166
128
138 Sequences and algebraic expressions
Term4
Week4
-5, -9, -13, -17, -21 …
Describe the rule of this number sequence in words.
What does the rule -4n + 1 means for the number sequence -3, -7, -11, -15, -19, …mean?
Write the rule as an expression.
First term: -4(1) + 1 = -3
Second term: -4(2) + 1 = -7
Third term: -4(3) + 1 = -11
Fourth term: -4(4) + 1 = -15
Fifth term: -4(5) + 1 = -19nth term: -4(n) + 1
Subtracting 2 from
the previous term.
a. -3; -12; -21; -30; -39 b. -6; -13; -20; -27; -34
1. Describe the following in words.
Example: -2, -6 -10, -14, -18, …
Subtracting 4 from the previous pattern
c. -3; -5; -7; -9; -11 d. 4; -4; -14; -24; -34
e. -7; -8; -9; -10; -11 f. -8; -12; -16; -20; -24
g. -14; -17; -20; -23; -26 h. -19; -21; -23; -25; -27
i. 9; -2; -13; -24; -35 j. -1; -6; -11; -16; -21
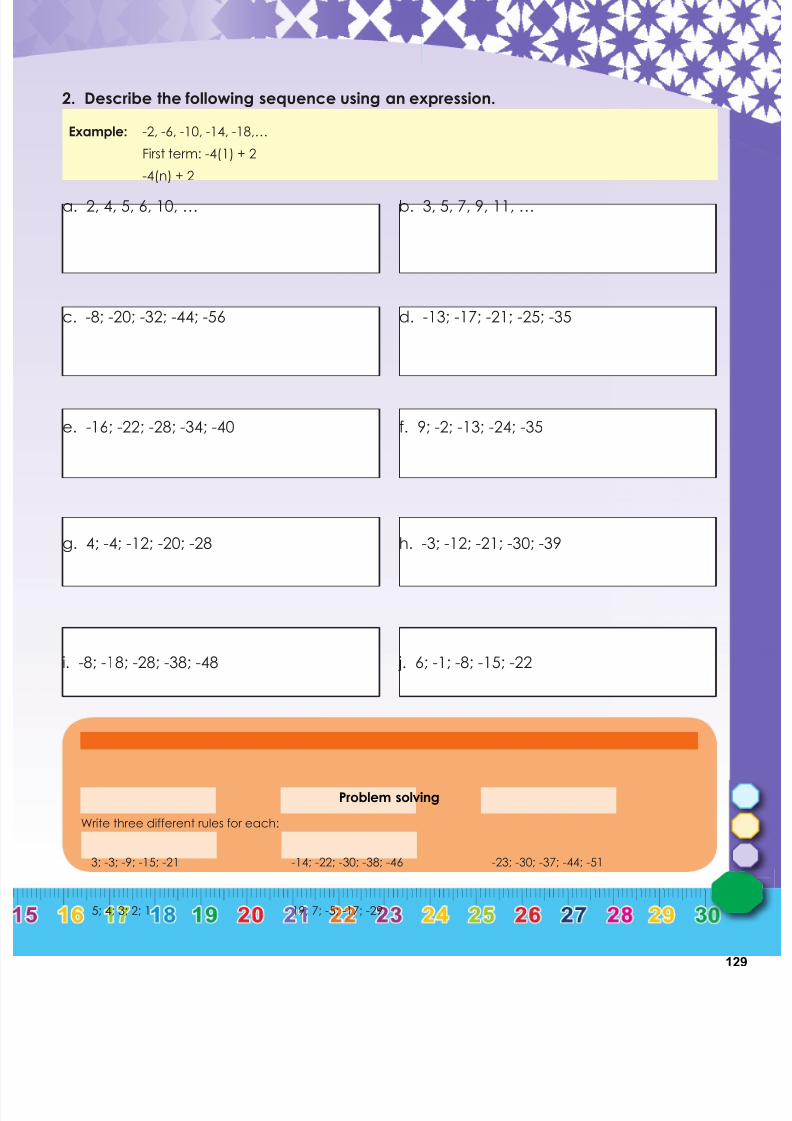
7/21/2019 Numeracy Gr 7
http://slidepdf.com/reader/full/numeracy-gr-7 131/166
129
Problem solving
3; -3; -9; -15; -21
a. 2, 4, 5, 6, 10, … b. 3, 5, 7, 9, 11, …
2. Describe the following sequence using an expression.
Example: -2, -6, -10, -14, -18,…
First term: -4(1) + 2
-4(n) + 2
c. -8; -20; -32; -44; -56 d. -13; -17; -21; -25; -35
e. -16; -22; -28; -34; -40 f. 9; -2; -13; -24; -35
g. 4; -4; -12; -20; -28 h. -3; -12; -21; -30; -39
i. -8; -18; -28; -38; -48 j. 6; -1; -8; -15; -22
-14; -22; -30; -38; -46 -23; -30; -37; -44; -51
5; 4; 3; 2; 1 19; 7; -5; -17; -29
Write three different rules for each:
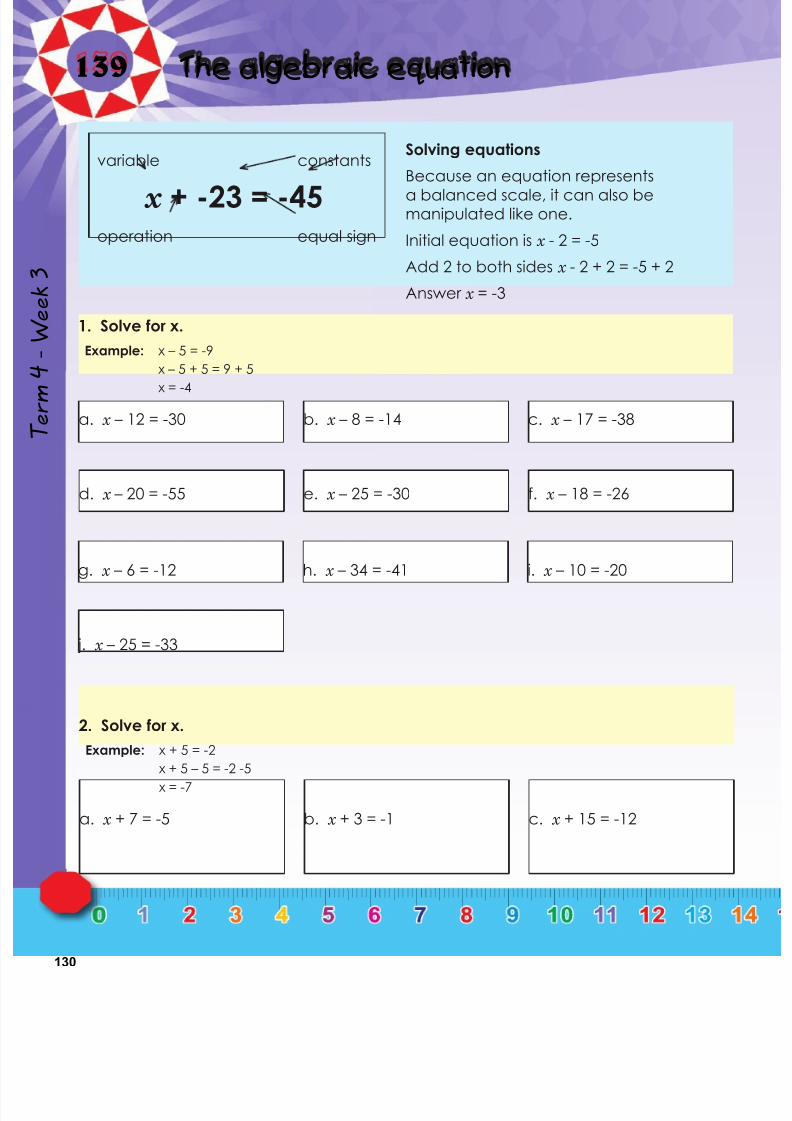
7/21/2019 Numeracy Gr 7
http://slidepdf.com/reader/full/numeracy-gr-7 132/166
130
139 The algebraic equation
Term4
Week3
Solving equations
Because an equation represents
a balanced scale, it can also bemanipulated like one.
Initial equation is x - 2 = -5
Add 2 to both sides x - 2 + 2 = -5 + 2
Answer x = -3
1. Solve for x.
Example: x – 5 = -9
x – 5 + 5 = 9 + 5
x = -4
variable constants
operation equal sign
x + -23 = -45
a. x – 12 = -30 b. x – 8 = -14 c. x – 17 = -38
d. x – 20 = -55 e. x – 25 = -30 f. x – 18 = -26
g. x – 6 = -12 h. x – 34 = -41 i. x – 10 = -20
j. x – 25 = -33
2. Solve for x.
Example: x + 5 = -2
x + 5 – 5 = -2 -5 x = -7
a. x + 7 = -5 b. x + 3 = -1 c. x + 15 = -12
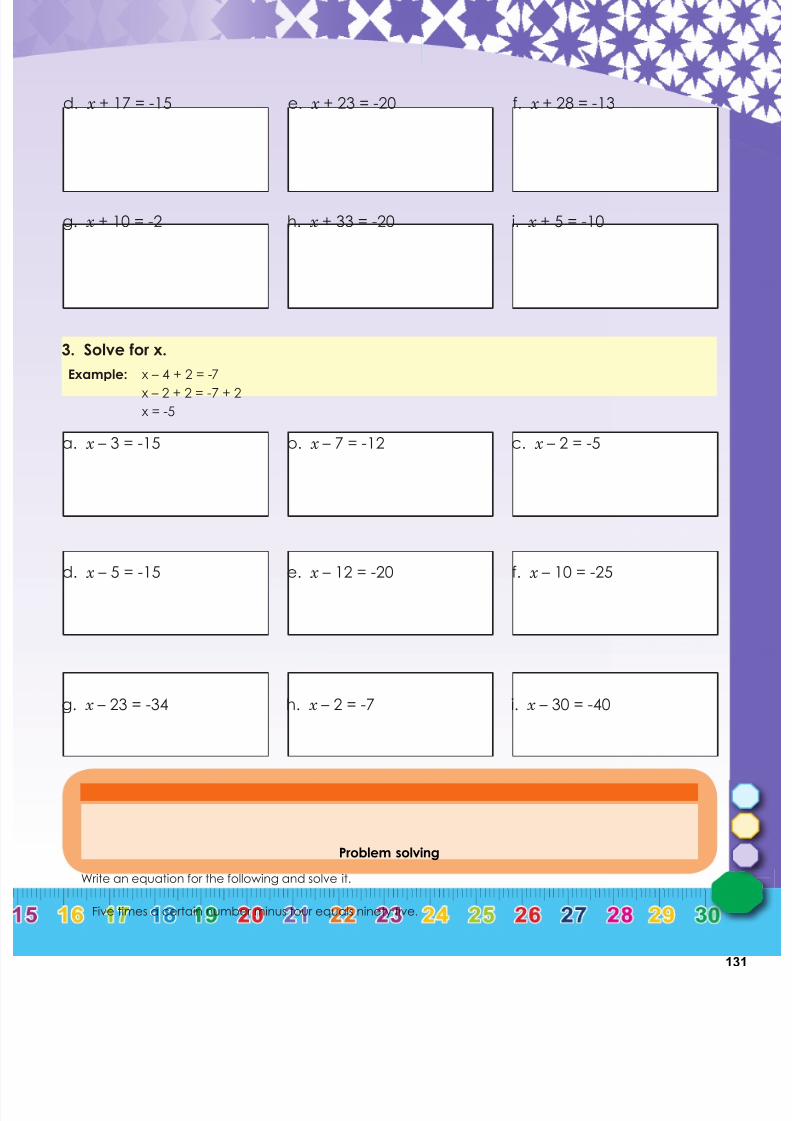
7/21/2019 Numeracy Gr 7
http://slidepdf.com/reader/full/numeracy-gr-7 133/166
131
d. x + 17 = -15 e. x + 23 = -20 f. x + 28 = -13
g. x + 10 = -2 h. x + 33 = -20 i. x + 5 = -10
3. Solve for x.
Example: x – 4 + 2 = -7
x – 2 + 2 = -7 + 2
x = -5
a. x – 3 = -15 b. x – 7 = -12 c. x – 2 = -5
d. x – 5 = -15 e. x – 12 = -20 f. x – 10 = -25
g. x – 23 = -34 h. x – 2 = -7 i. x – 30 = -40
Problem solving
Five times a certain number minus four equals ninety five.
Write an equation for the following and solve it.
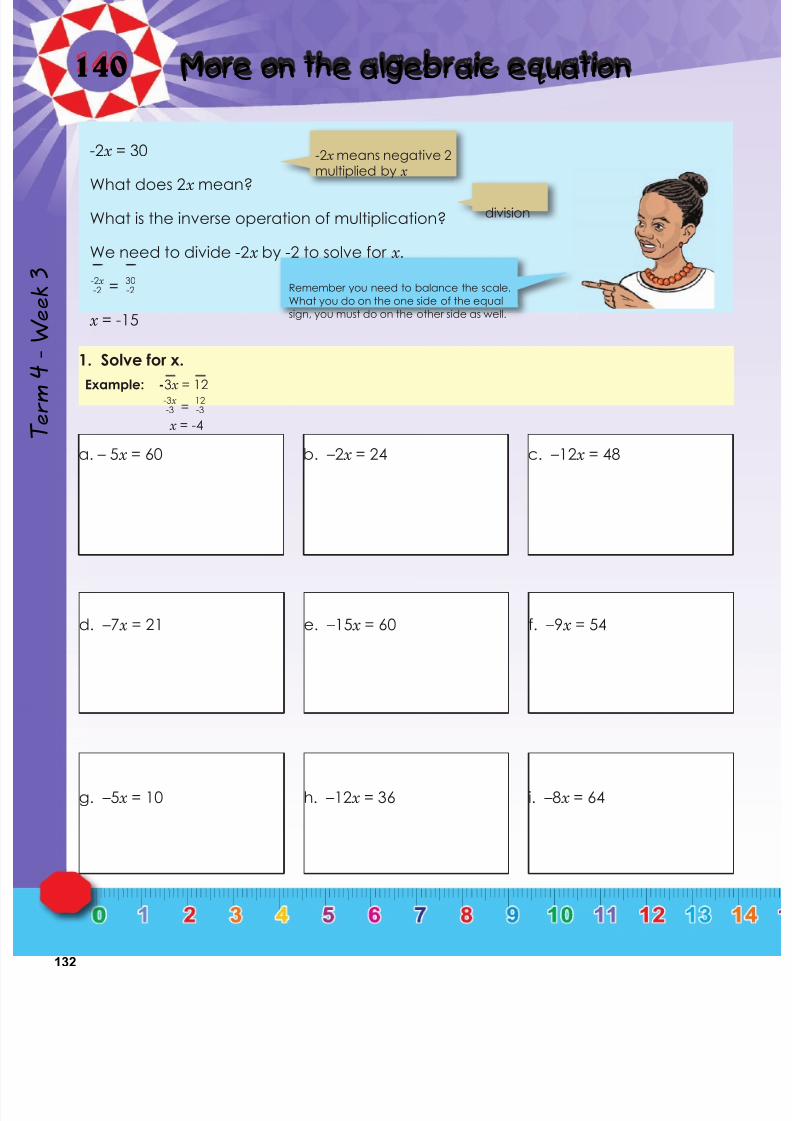
7/21/2019 Numeracy Gr 7
http://slidepdf.com/reader/full/numeracy-gr-7 134/166
132
140 More on the algebraic equation
Term4
Week3
-2x = 30
What does 2x mean?
What is the inverse operation of multiplication?
We need to divide -2x by -2 to solve for x .
-2x
-2 =30
-2
x = -15
-2x means negative 2multiplied by x
division
Remember you need to balance the scale.
What you do on the one side of the equal
sign, you must do on the other side as well.
1. Solve for x.
Example: -3x = 12
-3x
-3 =12-3
x = -4
a. – 5x = 60 b. –2x = 24 c. –12x = 48
d. –7x = 21 e. –15x = 60 f. –9x = 54
g. –5x = 10 h. –12x = 36 i. –8x = 64

7/21/2019 Numeracy Gr 7
http://slidepdf.com/reader/full/numeracy-gr-7 135/166
133
2. Solve for x.
Example: -3x - 2 = 10
-3x - 2 + 2 = 10 + 2
-3x
-3 =-12-3
x = -4
a. – 2x – 5 = 15 b. – 9x – 4 = 32 c. – 3x – 3 = 18
d. – 3x – 2 = 22 e. – 8x – 4 = 12 f. – 20x – 5 = 95
g. – 12x – 5 = 55 h. – 7x – 3 = 25 i. – 2x – 2 = 18
Problem solving
Write an equation and solve it.
• Negative two times y equals negative twelve.• Negative three times a equals negative ninety nine.
• Negative five times b equals negative sixty.
• Negative four times d equals to forty four.
• Negative three times x equals to thirty.
• Negative two times y equals to sixty four.
• Negative nine times m equal one hundred and eight.
• Negative six times a equals sixty six.
• Negative five times b equals fifteen.
• Negative eight times c equals forty
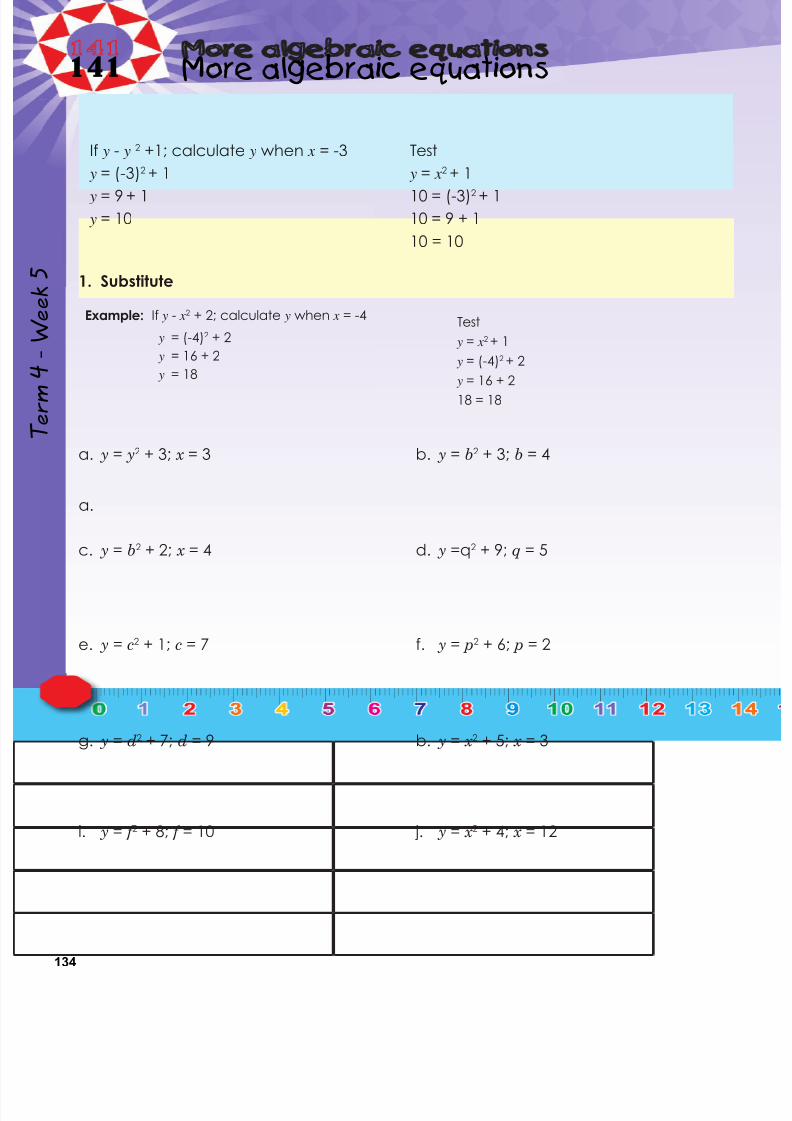
7/21/2019 Numeracy Gr 7
http://slidepdf.com/reader/full/numeracy-gr-7 136/166
134
141 More algebraic equations
Term4
Week5
1. Substitute
a.
If y - y 2 +1; calculate y when x = -3
y = (-3)2 + 1
y = 9 + 1
y = 10
Test
y = x2 + 1
10 = (-3)2 + 1
10 = 9 + 1
10 = 10
Example: If y - x2 + 2; calculate y when x = -4
y = (-4)2 + 2
y = 16 + 2
y = 18
a. y = y2 + 3; x = 3
c. y = b2 + 2; x = 4
e. y = c2 + 1; c = 7
g. y = d2 + 7; d = 9
i. y = f 2 + 8; f = 10
b. y = b2 + 3; b = 4
d. y =q2 + 9; q = 5
f. y = p2 + 6; p = 2
b. y = x 2 + 5; x = 3
j. y = x 2 + 4; x = 12
Test
y = x2 + 1
y = (-4)2 + 2
y = 16 + 218 = 18
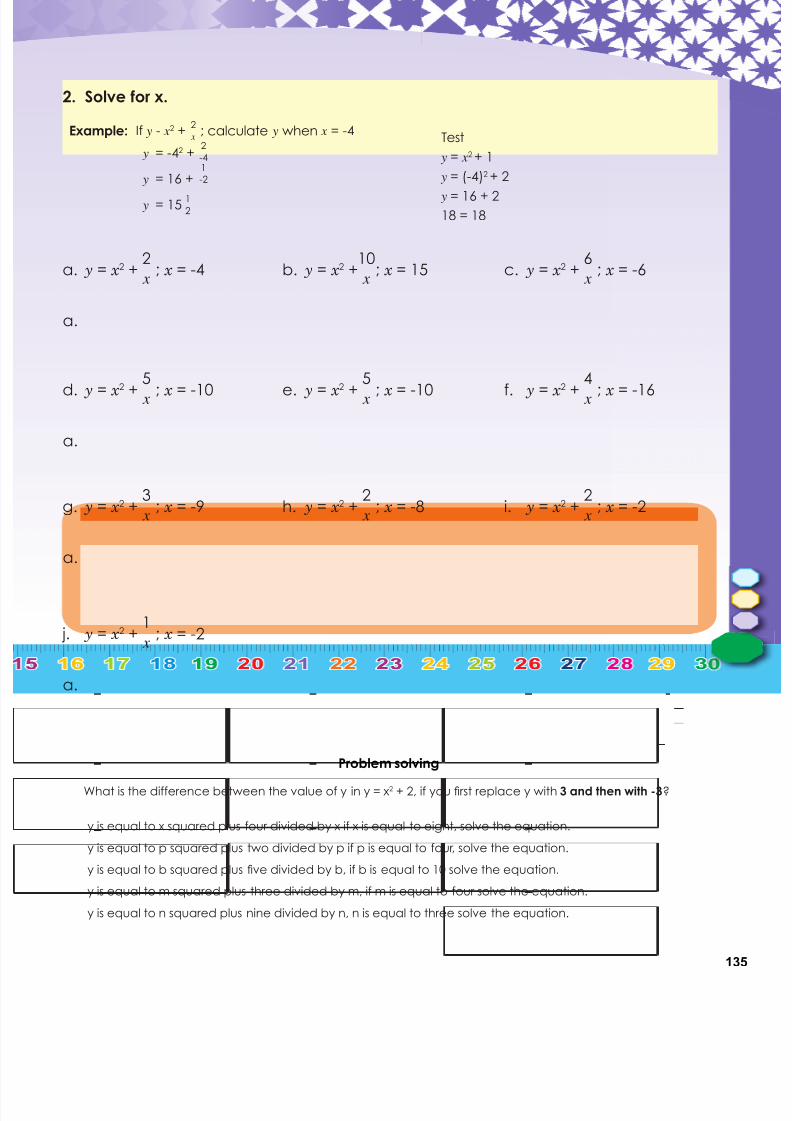
7/21/2019 Numeracy Gr 7
http://slidepdf.com/reader/full/numeracy-gr-7 137/166
135
Problem solving
What is the difference between the value of y in y = x2 + 2, if you first replace y with 3 and then with -3?
y is equal to x squared plus four divided by x if x is equal to eight, solve the equation.
y is equal to p squared plus two divided by p if p is equal to four, solve the equation.
y is equal to b squared plus five divided by b, if b is equal to 10 solve the equation.
y is equal to m squared plus three divided by m, if m is equal to four solve the equation.
y is equal to n squared plus nine divided by n, n is equal to three solve the equation.
2. Solve for x.
a.
a.
a.
a.
Example: If y - x2 + ; calculate y when x = -4
y = -42 +
y = 16 +
y = 15
a. y = x 2 + ; x = -4
d. y = x 2 + ; x = -10
g. y = x 2 + ; x = -9
j. y = x 2 + ; x = -2
b. y = x 2 + ; x = 15
e. y = x 2 + ; x = -10
h. y = x 2 + ; x = -8
c. y = x 2 + ; x = -6
f. y = x 2 + ; x = -16
i. y = x 2 + ; x = -2
Test
y = x2 + 1
y = (-4)2 + 2
y = 16 + 2
18 = 18
2
x
2
-41
-2
1
2
2
x
5 x
3
x
1
x
10
x
5 x
2
x
6
x
4 x
2
x
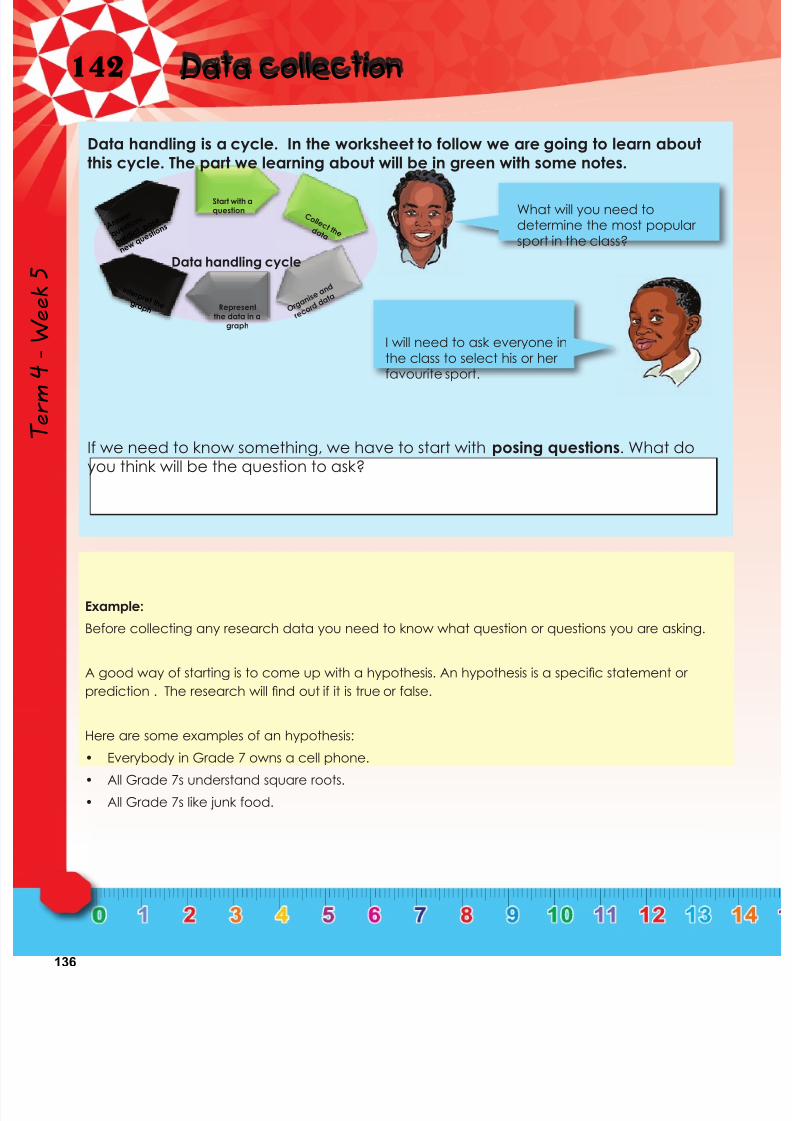
7/21/2019 Numeracy Gr 7
http://slidepdf.com/reader/full/numeracy-gr-7 138/166
136
142 Data collection
Term4
Week5
Data handling is a cycle. In the worksheet to follow we are going to learn aboutthis cycle. The part we learning about will be in green with some notes.
If we need to know something, we have to start with posing questions. What doyou think will be the question to ask?
What will you need todetermine the most popularsport in the class?
I will need to ask everyone inthe class to select his or herfavourite sport.
Data handling cycle
A n s w
e r
q u e s t i o n
s,
p r e d i c
t, p o s e
n e w q
u e s t i o
n s
Representthe data in a
graph
C o l l e c t t h e d a t a
O r g a n i s e
a n d
r e c o r d
d a t a
Start with aquestion
I n t e r p r e t t h e g r a p h
Example:
Before collecting any research data you need to know what question or questions you are asking.
A good way of starting is to come up with a hypothesis. An hypothesis is a specific statement or
prediction . The research will find out if it is true or false.
Here are some examples of an hypothesis:
• Everybody in Grade 7 owns a cell phone.
• All Grade 7s understand square roots.
• All Grade 7s like junk food.

7/21/2019 Numeracy Gr 7
http://slidepdf.com/reader/full/numeracy-gr-7 139/166
137
1. Where would you look to find data to give you answers to these questions?
2. Is it always possible to collect data directly from the original source?
a. What is the population of the world? b. Which learner drinks the most water?
c. What is the rate of population growth in South
Africa?
d. What is the population density in this town?
e. What languages are spoken in this area? f. What is South Africa’s most popular food?
g. What is the age structure of the country? h. What is life expectancy in South Africa?
i. Which country has the youngest population? j. What are the most popular foods in this
school ?
Primary research Secondary research
when we collect thedata ourselves
when we use datacollected andanalysed by otherpeople
continued☛
7/21/2019 Numeracy Gr 7
http://slidepdf.com/reader/full/numeracy-gr-7 140/166
138
142b Data collection continued
Term4
Week5
3. In order to collect the data of Question 1, would you do primary or secondary
research or both?
4. Let’s say you want to know the favourite colours of people at your school, but don't
have the time to ask everyone, how will you go about finding the information?

7/21/2019 Numeracy Gr 7
http://slidepdf.com/reader/full/numeracy-gr-7 141/166
139
Problem solving
How much water do learners in the school drink?
a. Write a hypothesis. .
b. How will you find the data to prove or disprove the hypothesis? Will this be primary or secondary
data?
c. Find any secondary research data on this topic.
d. Who should we ask?
e. What will the data tell us? (What questions will you pose about the data?)
f. Do you think the data can help us to answer the research question?
g. Develop some appropriate questions.
h. Design a simple questionnaire that allows for both both Yes/No type responses and multiple-choiceresponses.
6. How would you design a questionnaire?
5. How can we make sure that the result is not biased?
A common method of collecting primary data is to use a survey questionnaire.
Questionnaires come in many forms and are carried out using a variety of methods.
The four main methods of conducting a survey using a questionnaire are:
There are different ways of designing the questionnaire. You can use:
• Yes/No questions
• Tick boxes for multiple choice questions
• Word responses
• Questions that require a sentence to be written.
Face to face By post By phone By internet
If you only ask people who look friendly, youwill know what friendly people think!
If you went to the swimming pool and askedpeople “Can you swim?”, you will get abiased answer… probably 100% will say “Yes.”
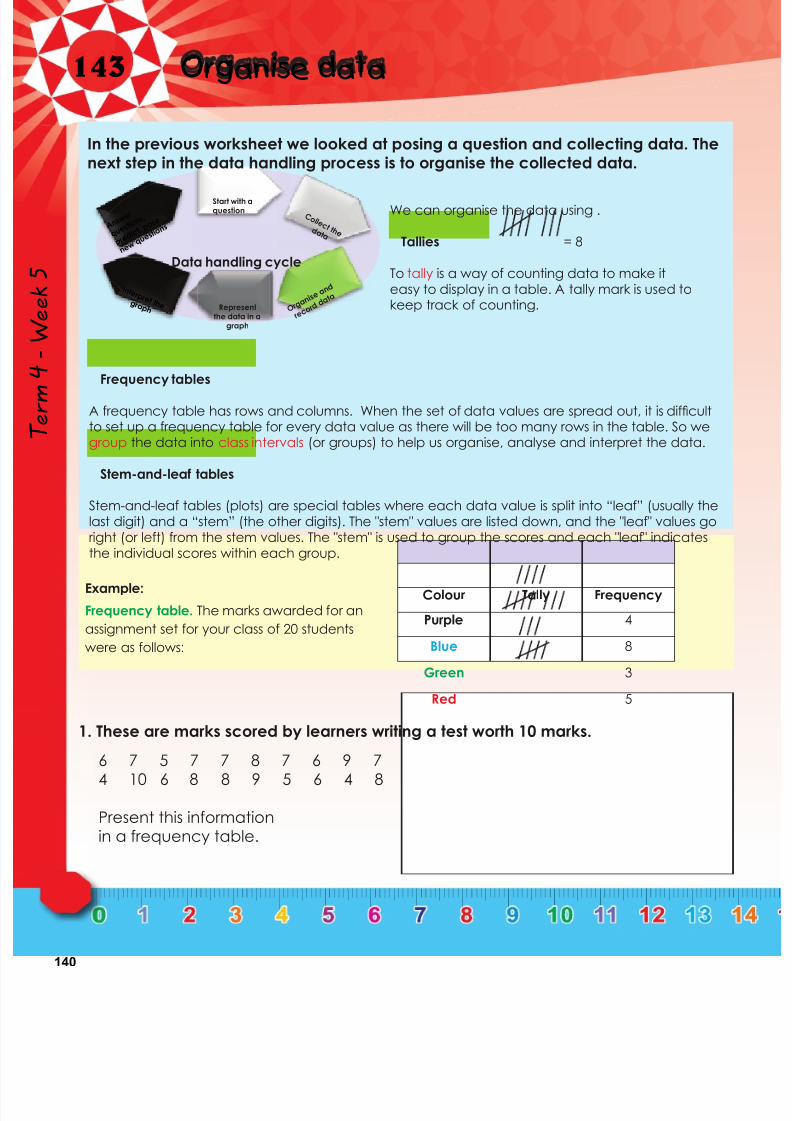
7/21/2019 Numeracy Gr 7
http://slidepdf.com/reader/full/numeracy-gr-7 142/166
140
143 Organise data
Term4
Week5
1. These are marks scored by learners writing a test worth 10 marks.
6 7 5 7 7 8 7 6 9 74 10 6 8 8 9 5 6 4 8
Present this informationin a frequency table.
In the previous worksheet we looked at posing a question and collecting data. Thenext step in the data handling process is to organise the collected data.
We can organise the data using .
Tallies = 8
To tally is a way of counting data to make iteasy to display in a table. A tally mark is used tokeep track of counting.
Frequency tables
A frequency table has rows and columns. When the set of data values are spread out, it is difficult
to set up a frequency table for every data value as there will be too many rows in the table. So wegroup the data into class intervals (or groups) to help us organise, analyse and interpret the data.
Stem-and-leaf tables
Stem-and-leaf tables (plots) are special tables where each data value is split into “leaf” (usually thelast digit) and a “stem” (the other digits). The "stem" values are listed down, and the "leaf" values goright (or left) from the stem values. The "stem" is used to group the scores and each "leaf" indicatesthe individual scores within each group.
Data handling cycle
A n s w
e r
q u e s t i o n
s,
p r e d i c
t, p o s e
n e w q
u e s t i o
n s
Representthe data in a
graph
C o l l e c t t h e d a t a
O r g a n i s e
a n d
r e c o r d
d a t a
Start with aquestion
I n t e r p r e t t h e g r a p h
Example:
Frequency table. The marks awarded for an
assignment set for your class of 20 students
were as follows:
Colour Tally Frequency
Purple 4
Blue 8
Green 3
Red 5
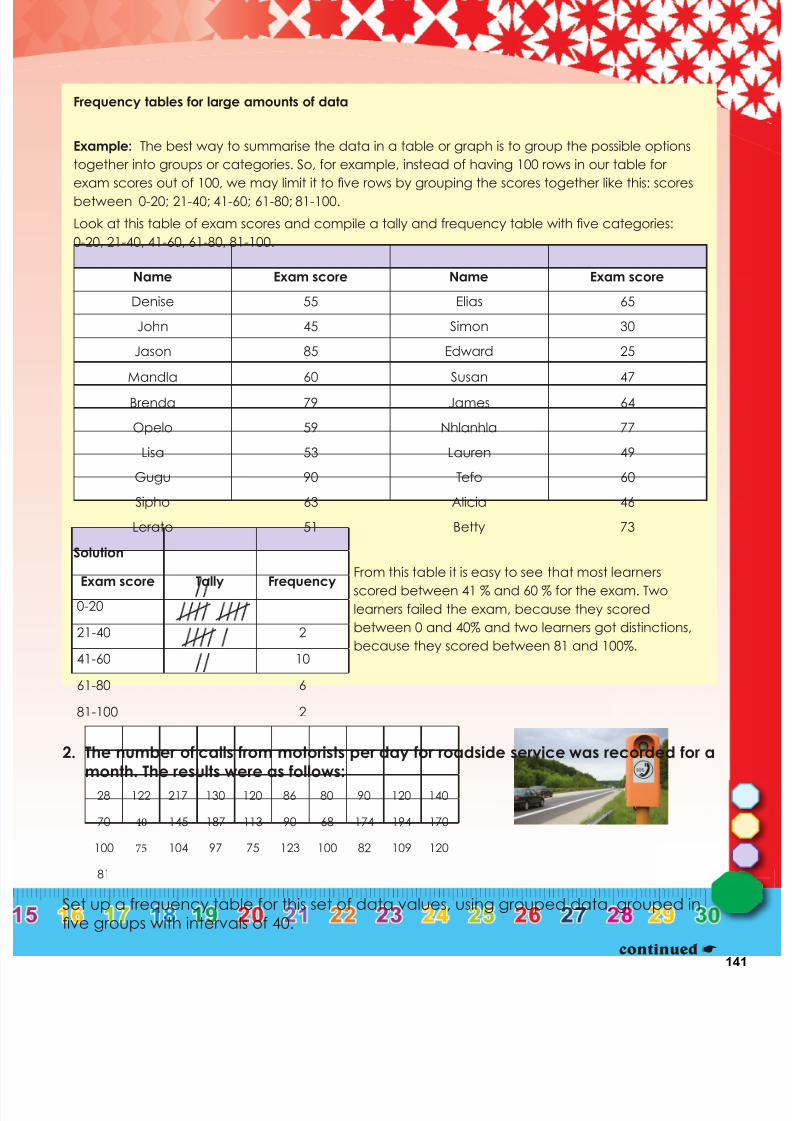
7/21/2019 Numeracy Gr 7
http://slidepdf.com/reader/full/numeracy-gr-7 143/166
141
2. The number of calls from motorists per day for roadside service was recorded for a
month. The results were as follows:
Set up a frequency table for this set of data values, using grouped data, grouped infive groups with intervals of 40.
Frequency tables for large amounts of data
Example: The best way to summarise the data in a table or graph is to group the possible options
together into groups or categories. So, for example, instead of having 100 rows in our table for
exam scores out of 100, we may limit it to five rows by grouping the scores together like this: scores
between 0-20; 21-40; 41-60; 61-80; 81-100.
Look at this table of exam scores and compile a tally and frequency table with five categories:
0-20, 21-40, 41-60, 61-80, 81-100.
From this table it is easy to see that most learnersscored between 41 % and 60 % for the exam. Two
learners failed the exam, because they scored
between 0 and 40% and two learners got distinctions,
because they scored between 81 and 100%.
Solution
Name Exam score Name Exam score
Denise 55 Elias 65
John 45 Simon 30
Jason 85 Edward 25
Mandla 60 Susan 47Brenda 79 James 64
Opelo 59 Nhlanhla 77
Lisa 53 Lauren 49
Gugu 90 Tefo 60
Sipho 63 Alicia 46
Lerato 51 Betty 73
Exam score Tally Frequency
0-20
21-40 2
41-60 10
61-80 6
81-100 2
28 122 217 130 120 86 80 90 120 140
70 40 145 187 113 90 68 174 194 170
100 75 104 97 75 123 100 82 109 120
81
continued☛
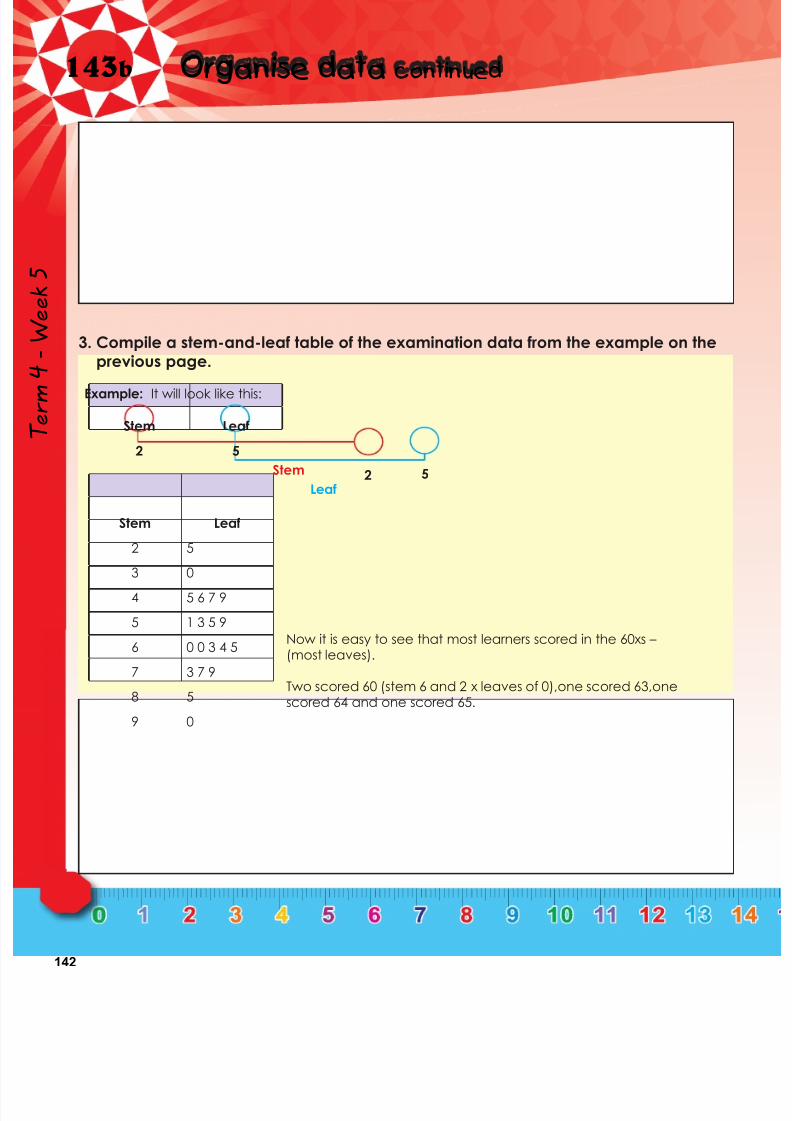
7/21/2019 Numeracy Gr 7
http://slidepdf.com/reader/full/numeracy-gr-7 144/166
142
143b Organise data continued
Term4
Week5
3. Compile a stem-and-leaf table of the examination data from the example on theprevious page.
Example: It will look like this:
Stem Leaf
2 5
Stem Leaf
2 5
3 0
4 5 6 7 9
5 1 3 5 9
6 0 0 3 4 5
7 3 7 9
8 5
9 0
2 5Stem
Leaf
Now it is easy to see that most learners scored in the 60xs –
(most leaves).
Two scored 60 (stem 6 and 2 x leaves of 0),one scored 63,onescored 64 and one scored 65.
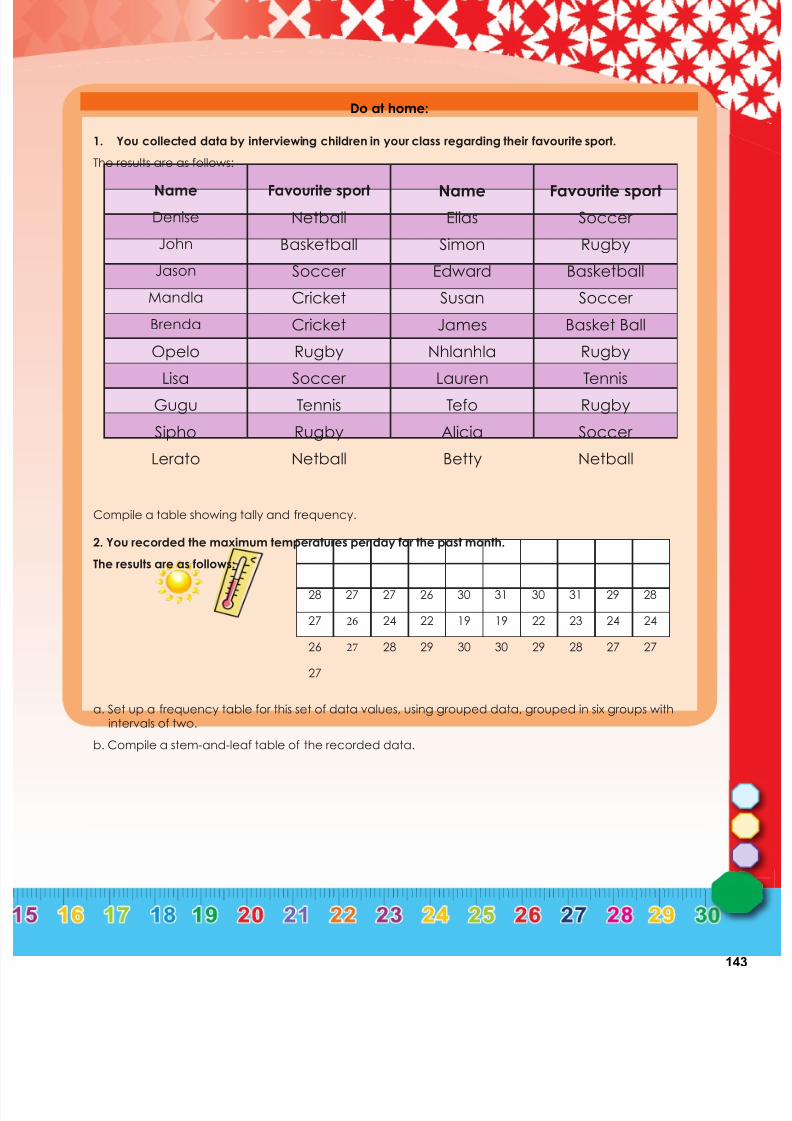
7/21/2019 Numeracy Gr 7
http://slidepdf.com/reader/full/numeracy-gr-7 145/166
143
Do at home:
1. You collected data by interviewing children in your class regarding their favourite sport.
The results are as follows:
Compile a table showing tally and frequency.
a. Set up a frequency table for this set of data values, using grouped data, grouped in six groups withintervals of two.
b. Compile a stem-and-leaf table of the recorded data.
2. You recorded the maximum temperatures per day for the past month.
The results are as follows:
Name Favourite sport Name Favourite sportDenise Netball Elias Soccer
John Basketball Simon Rugby
Jason Soccer Edward Basketball
Mandla Cricket Susan Soccer
Brenda Cricket James Basket Ball
Opelo Rugby Nhlanhla Rugby
Lisa Soccer Lauren TennisGugu Tennis Tefo Rugby
Sipho Rugby Alicia Soccer
Lerato Netball Betty Netball
28 27 27 26 30 31 30 31 29 28
27 26 24 22 19 19 22 23 24 24
26 27 28 29 30 30 29 28 27 27
27

7/21/2019 Numeracy Gr 7
http://slidepdf.com/reader/full/numeracy-gr-7 146/166
144
144 Summarise data
Term4
Week5
There are three different types of averagegenerally used to understand data.:
The range is the difference between the biggestand the smallest number.
The mean is the total of the numbers divided byhow many numbers there are.
The median is the middle value.
The mode is the value that appears the mostoften.
Data handling cycle
A n s w e r
q u e s t i o n
s,
p r e d i c
t, p o s e
n e w q
u e s t i o
n s
Representthe data in a
graph
C o l l e c t t h e d a t a
O r g a
n i s e a
n d
r e c o r d
d a t a
Start with a
question
I n t e r p r e t t h e g r a p h
Example:
First we need to establish the range of the data. The range is the difference between the
biggest and the smallest number.
From the data and the frequency table we can establish that the height of the learners ranges
from 135 cm to 165 cm. We also know that 21 learners took part in the survey and that most learners
fall into the 146 cm to 150 cm group.
From this data we can also calculate the mean, median and mode.
Biggest number = 165
Smallest number = 135
Difference = highest number – smallest number
= 165 – 135
= 30
Height of learners Tally Frequency
135-140 3
141-145 4
146-150 6
151-155 4
156-160 2
161-165 2
So the range of this set ofnumbers is 30.
If we want the width of each classinterval to be 5, then the numberof groups will be: Range ÷ width ofeach class = 30 ÷ 5 = 6
So we must divide this setof datainto six class intervals (or groups).
How can wegroup thedata into classintervals (orgroups)?
Height of learners in cm
150 152 143 146 135 145 151 139 141 161
158 148 144 146 155 159 165 149 139 153
146

7/21/2019 Numeracy Gr 7
http://slidepdf.com/reader/full/numeracy-gr-7 147/166
145
Mean
The mean is the total of the numbers divided by how many numbers there are.
This is the most common average that we normally refer to and which we use to calculate our
report cards.
If we add up all 21 numbers in our data range, we will get 3 125.
3 125 ÷ 21 = 148,8
Therefore the mean for this data range is 148,8.
Median
The median is the middle value.
In our data range we have 21 records. To work out the median (middle value) we arrange the
data from small to big and then count until the middle value.
The median or middle value in our data range will be the 11th number.
Therefore the median for this data range is 148.
Mode
The mode is the value that appears the most.
Let us arrange the data from small to big:
The value that appears the most is 146.
Therefore the mode for this data range is 146.
Note: the meanaverage is notalways a wholenumber.
135 139 139 141 143 144 145 146 146 146 148 149 150 151 152 153 155 158 159 161 165
135 139 139 141 143 144 145 146 146 146 148 149 150 151 152 153 155 158 159 161 165
135 139 139 141 143 144 145 146 146 146 148 149 150 151 152 153 155 158 159 161 165
11th number10 10
continued☛

7/21/2019 Numeracy Gr 7
http://slidepdf.com/reader/full/numeracy-gr-7 148/166
146
144b Summarise data continued
Term4
Week5
1. Use the data set below and calculate:
2. Sipho wrote seven maths tests and got scores of 68, 71, 71, 84, 53, 62 and 67. Whatwas the median and mode of his scores?
3. What is the mean of these numbers: 18, 12, 10, 10, 25?
4. The mean of three numbers is 8. Two of the numbers are 11 and 7. What is the thirdnumber?
5. The temperature in degrees Celsius over four days in July was 21, 21, 19 and 19.
What was the mean temperature?
6. What is the mode of these numbers: 75, 78, 75, 71, 78, 25, 75, 29?
3, 13, 7, 5, 21, 23, 39, 23, 40, 23, 14, 12, 56, 23, 29
a. The range b. The mean
c. The median d. The mode
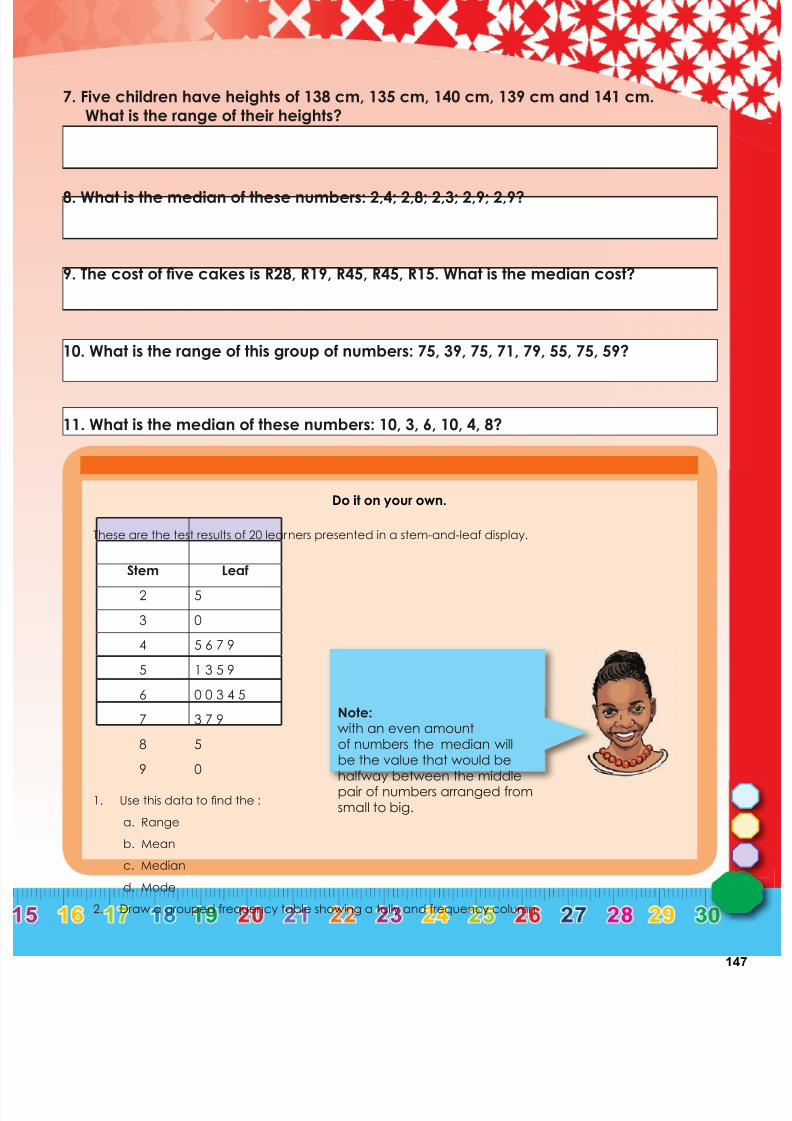
7/21/2019 Numeracy Gr 7
http://slidepdf.com/reader/full/numeracy-gr-7 149/166
147
Do it on your own.
These are the test results of 20 learners presented in a stem-and-leaf display.
1. Use this data to find the :
a. Range
b. Mean
c. Median
d. Mode
2. Draw a grouped frequency table showing a tally and frequency column
Stem Leaf2 5
3 0
4 5 6 7 9
5 1 3 5 9
6 0 0 3 4 5
7 3 7 9
8 5
9 0
Note:with an even amountof numbers the median will
be the value that would behalfway between the middlepair of numbers arranged fromsmall to big.
7. Five children have heights of 138 cm, 135 cm, 140 cm, 139 cm and 141 cm.What is the range of their heights?
8. What is the median of these numbers: 2,4; 2,8; 2,3; 2,9; 2,9?
9. The cost of five cakes is R28, R19, R45, R45, R15. What is the median cost?
10. What is the range of this group of numbers: 75, 39, 75, 71, 79, 55, 75, 59?
11. What is the median of these numbers: 10, 3, 6, 10, 4, 8?

7/21/2019 Numeracy Gr 7
http://slidepdf.com/reader/full/numeracy-gr-7 150/166
148
145 Bar graphs
Term4
Week5
1. Use the frequency table below to draw a bar graph. Use your bar graph and writethree observations regarding the data represented in the graph.
To record data one can use a bar graph. Bar graphA bar graph is a visualdisplay used to comparethe frequency ofoccurrence of differentcharacteristics of data.
This type of display allows us to:• compare groups of data• make quick generalisations about the
data.
Data handling cycle
A n s w
e r
q u e s t i o n
s,
p r e d i c
t, p o s e
n e w q
u e s t i o
n s
Representthe data in a
graph
C o l l e c t t h e d a t a
I n t e r p r e t t h e g r a p h O r g a
n i s e a
n d
r e c o r d
d a t a
Start with aquestion
Favourite fruit Tally Frequency
Apples 3
Oranges 4
Grapes 6
Bananas 4
Kiwi 2
Strawberries 2
Steps to draw a bar graph
1. To draw a bar graph you have to start with your frequency table.
2. From the frequency table, decide on the range and scale of the frequency data axis (vertical
axis) and the grouped data axis (horizontal axis).
3. Draw the vertical and horizontal axes and label them.
4. Write the graph title at the top.
5. Mark the data on the graph for each data group and draw the bar.
6. Add the colour or shading of the bar to the legend (key).
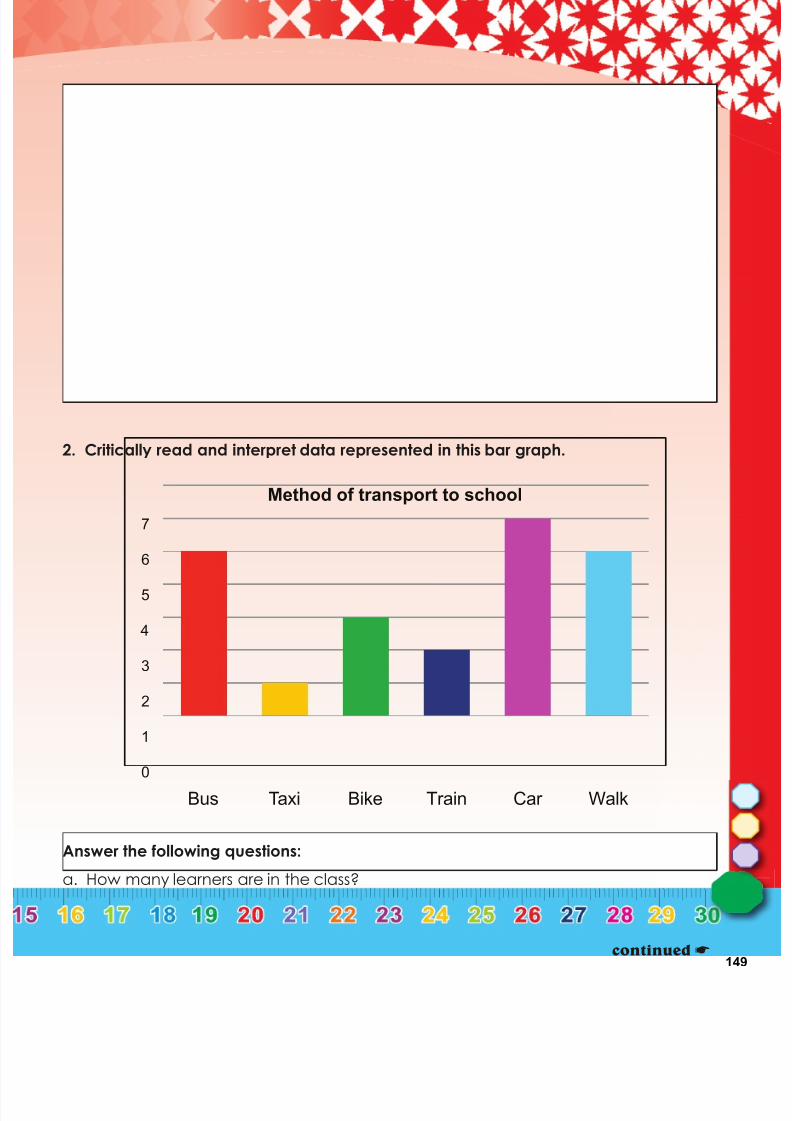
7/21/2019 Numeracy Gr 7
http://slidepdf.com/reader/full/numeracy-gr-7 151/166
149
2. Critically read and interpret data represented in this bar graph.
Answer the following questions:
a. How many learners are in the class?
continued☛
0
1
2
3
4
5
6
7
Bus Taxi Bike Train Car Walk
Method of transport to school

7/21/2019 Numeracy Gr 7
http://slidepdf.com/reader/full/numeracy-gr-7 152/166
150
145b Bar graphs continued
Term4
Week5
b. Which method of transport is the most popular?
c. Which method is the least popular?
d. How many more learners use the bus than the taxi?
e. Why do you think more learners use the bus than the taxi?
f. Do you think most learners live far from or close to the school?
g. What percentage of the learners use public transport?

7/21/2019 Numeracy Gr 7
http://slidepdf.com/reader/full/numeracy-gr-7 153/166
151
Now try it by yourself
Use the data collected during a survey regarding learners’ favourite subjects.
a. Compile a frequency table using tallies.
b. Draw a bar graph using your frequency table.
c. Interpret your graph and write at least five conclusions.
Name Favourite subject
Peter Maths
John Arts
Mandla History
Bongani Sciences
Nandi Sciences
David Maths
Gugu History
Susan Arts
Sipho Maths
Lebo Maths
Ann History
Ben Maths
Zander Sciences
Betty History
Lauren Arts
Alice Maths
Veronica Language
Jacob Maths
Alicia History
Thabo Language
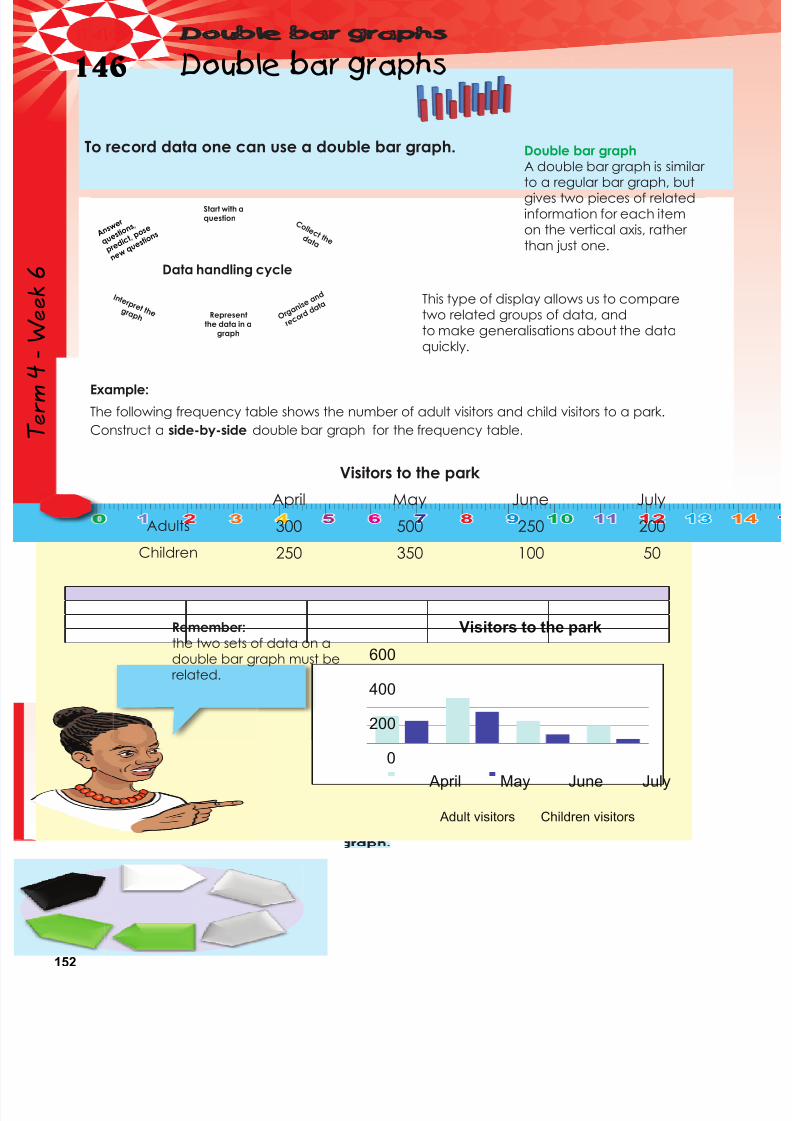
7/21/2019 Numeracy Gr 7
http://slidepdf.com/reader/full/numeracy-gr-7 154/166
152
146 Double bar graphs
Term4
Week6
To record data one can use a double bar graph. Double bar graphA double bar graph is similarto a regular bar graph, butgives two pieces of relatedinformation for each itemon the vertical axis, ratherthan just one.
This type of display allows us to comparetwo related groups of data, andto make generalisations about the dataquickly.
Data handling cycle
A n s w
e r
q u e s t i o n
s,
p r e d i c
t, p o s e
n e w q
u e s t i o
n s
Representthe data in a
graph
C o l l e c t t h e d a t a
I n t e r p r e t t h e g r a p h O r g a n i s e
a n d
r e c o r d
d a t a
Start with aquestion
Example:
The following frequency table shows the number of adult visitors and child visitors to a park.
Construct a side-by-side double bar graph for the frequency table.
Visitors to the park
April May June July
Adults 300 500 250 200
Children 250 350 100 50
0
200
400
600
April May June July
Visitors to the park
Adult visitors Children visitors
Remember:the two sets of data on adouble bar graph must berelated.

7/21/2019 Numeracy Gr 7
http://slidepdf.com/reader/full/numeracy-gr-7 155/166
153
Name Practical Exam Name Practical Exam
Denise 60 65 Elias 55 45
John 63 60 Simon 30 75
Jason 50 50 Edward 65 59
Mathapelo 80 75 Susan 65 75
Beatrix 46 64 Philip 72 75
Opelo 63 53 Ben 46 72
Lisa 51 59 Lauren 31 41
Gugu 67 76 Tefo 75 65
Sipho 81 80 Alicia 63 58Lorato 78 81 Masa 51 53
1. The results of exam and practical work by a class is shown in the table
below.
a. Compile a frequency table using tallies.
continued☛
7/21/2019 Numeracy Gr 7
http://slidepdf.com/reader/full/numeracy-gr-7 156/166
154
b. Draw a double bar graph comparing the learners’ practical marks with their exammarks.
146b Double bar graphs continued
Term4
Week6
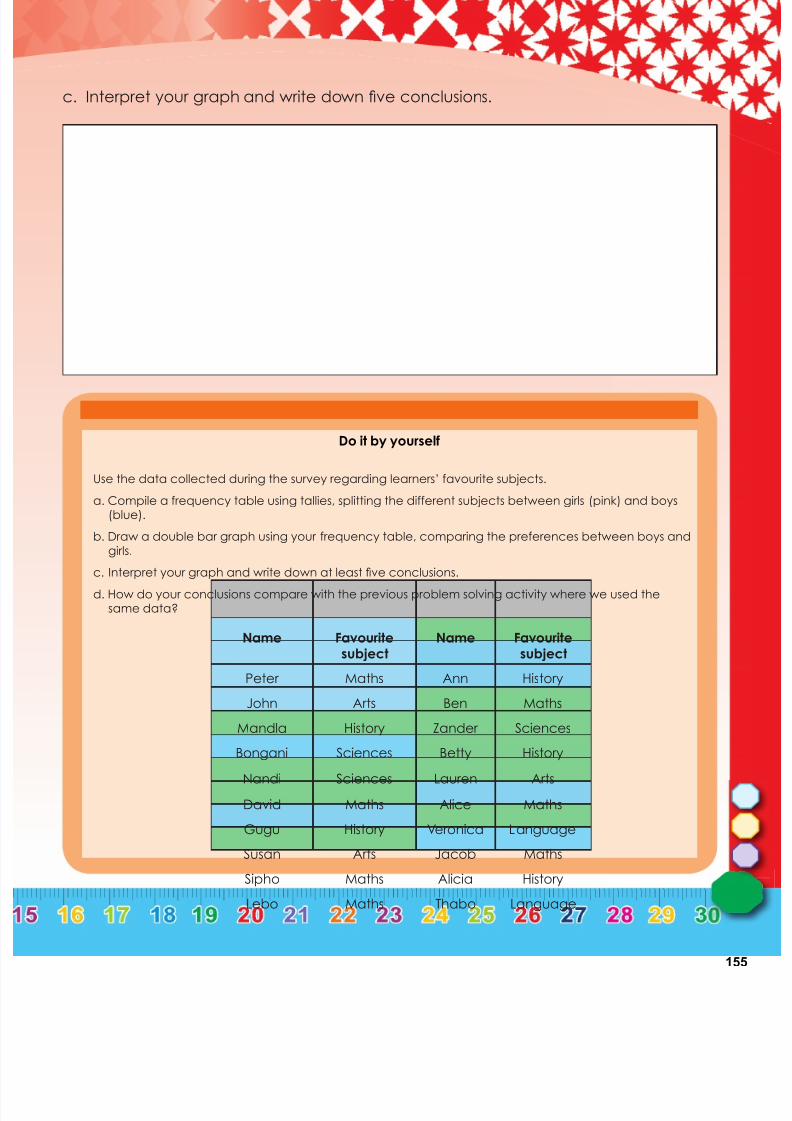
7/21/2019 Numeracy Gr 7
http://slidepdf.com/reader/full/numeracy-gr-7 157/166
155
c. Interpret your graph and write down five conclusions.
Do it by yourself
Use the data collected during the survey regarding learners’ favourite subjects.
a. Compile a frequency table using tallies, splitting the different subjects between girls (pink) and boys(blue).
b. Draw a double bar graph using your frequency table, comparing the preferences between boys and
girls.
c. Interpret your graph and write down at least five conclusions.d. How do your conclusions compare with the previous problem solving activity where we used the
same data?
Name Favouritesubject
Name Favouritesubject
Peter Maths Ann History
John Arts Ben Maths
Mandla History Zander Sciences
Bongani Sciences Betty History
Nandi Sciences Lauren Arts
David Maths Alice Maths
Gugu History Veronica Language
Susan Arts Jacob Maths
Sipho Maths Alicia History
Lebo Maths Thabo Language

7/21/2019 Numeracy Gr 7
http://slidepdf.com/reader/full/numeracy-gr-7 158/166
156
147 Histograms
Term4
Week6
To record data one can use a histogram. HistogramA histogram is a particularkind of bar graph thatsummarises data pointsfalling in various ranges.
The main difference between a normal bar graphand a histogram is that a bar graph shows you thefrequency of each element in a set of data, while ahistogram shows you the frequencies of a range ofdata.
In a histogram the bars must touch, because the dataelements we are recording are numbers that are grouped,and form a continuous range from left to right.
isda
histmen
hanfre
Data handling cycle
A n s w
e r
q u e s t i o n
s,
p r e d i c
t, p o s e
n e w q
u e s t i o
n s
Representthe data in a
graph
C o l l e c t t h e d a t a
I n t e r p r e t t h e g r a p h O r g a n i s e
a n d
r e c o r d
d a t a
Start with aquestion
Examples of an ordinary bar graph and a histogram
Table A Table B
Favourite colour Tally Frequency
Blue 3
Red 4
Green 6
Yellow 4
Pink 2
Purple 2
Height of learners Tally Frequency
135-140 3
141-145 4
146-150 6
151-155 4
156-160 2
161-165 2
What is the differencebetween the twofrequency tables?
In Table A, thefrequency coversindividual items (Blue,Red, Green, Yellow,Pink and Purple)
In Table B the frequency covers arange (135 to 165 – divided intosmaller groups i.e. 135-140, 141-145, 146-150, 141-155, 156-160and 161-165)
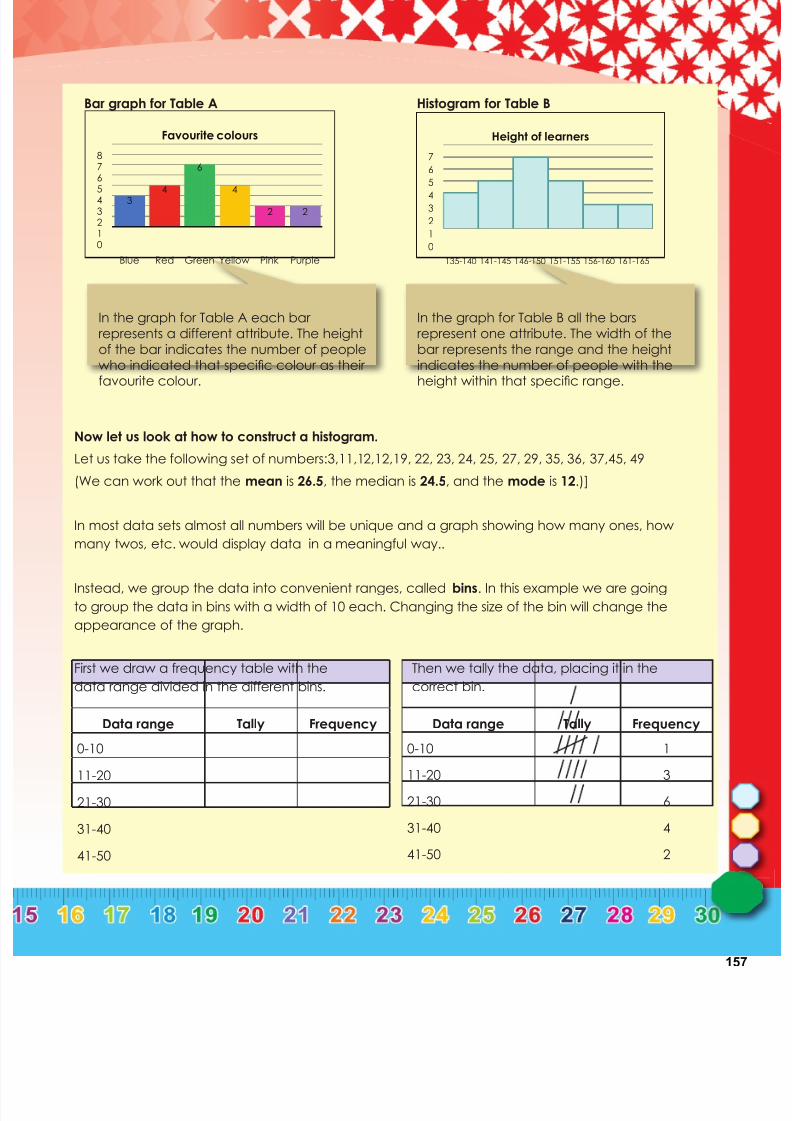
7/21/2019 Numeracy Gr 7
http://slidepdf.com/reader/full/numeracy-gr-7 159/166
157
Now let us look at how to construct a histogram.
Let us take the following set of numbers:3,11,12,12,19, 22, 23, 24, 25, 27, 29, 35, 36, 37,45, 49
(We can work out that the mean is 26.5, the median is 24.5, and the mode is 12.)]
In most data sets almost all numbers will be unique and a graph showing how many ones, how
many twos, etc. would display data in a meaningful way..
Instead, we group the data into convenient ranges, called bins. In this example we are going
to group the data in bins with a width of 10 each. Changing the size of the bin will change the
appearance of the graph.
First we draw a frequency table with the
data range divided in the different bins.
Then we tally the data, placing it in the
correct bin.
Bar graph for Table A Histogram for Table B
Data range Tally Frequency
0-10
11-20
21-30
31-40
41-50
Data range Tally Frequency
0-10 1
11-20 3
21-30 6
31-40 4
41-50 2
In the graph for Table A each barrepresents a different attribute. The heightof the bar indicates the number of peoplewho indicated that specific colour as their
favourite colour.
In the graph for Table B all the barsrepresent one attribute. The width of thebar represents the range and the heightindicates the number of people with the
height within that specific range.
34
6
4
2 2
012345
678
Blue Red Green Yellow Pink Purple
Favourite colours
0
1
2
3
4
5
6
7
135-140 141-145 146-150 151-155 156-160 161-165
Height of learners

7/21/2019 Numeracy Gr 7
http://slidepdf.com/reader/full/numeracy-gr-7 160/166
158
Finally we can draw the histogram by placing the bins on the horizontal axes and the frequency
on the vertical axes.
Remember we use histograms to summarise large data sets graphically. A histogram helps you to
see where most of the measurements are located and how spread out they are.
In our example above we can see that most data falls within the 21-30 bin and that there is very
little deviation from the mean of 26,5 and the median of 24,5.
0
2
4
6
8
0-10 11-20 21-30 31-40 41-50
Frequency
147b Histograms continued
Term4
Week6
1. Use the following data to draw a histogram.
30, 32, 11, 14, 40, 37, 16, 26, 12, 33, 13, 19, 38, 12, 28, 15, 39, 11, 37, 17, 27, 14, 36
a. What is the mean, median and mode?

7/21/2019 Numeracy Gr 7
http://slidepdf.com/reader/full/numeracy-gr-7 161/166
159
c. Complete the frequency table. Make the bins 5 in size ranging from11 to 40.
d. Draw the histogram.
Problem solving
You surveyed the number of times your classmates have travelled to another province. The data you
gathered is:
21, 0, 0, 7, 0, 1, 2, 12, 2, 3, 3, 4,4,6, 9,10, 25,18,11, 20, 3, 0, 0, 1, 5, 6, 7,15,18, 21, 25
Compile a frequency table and then draw a histogram using this data set. Make the bins 3 in size.
What can you tell us about your survey by looking at the histogram?

7/21/2019 Numeracy Gr 7
http://slidepdf.com/reader/full/numeracy-gr-7 162/166
160
Part of the power of histograms is that they allow us to analyse extremely large sets of data byreducing them to a single graph that can show the main peaks in the data, as well as give a visualrepresentation of the significance of the statistics represented by those peaks.
This graph represents data with a well-definedpeak that is close to the median and themean. While there are "outliers," they are ofrelatively low frequency. Thus it can be said
that deviations in this data group from themean are of low frequency.
148 More about histograms
Term4
Week6
0
1
2
3
4
5
6
7
0-10 11-20 21-30 31-40 41-50
Frequency
1. These two histograms were made in an attempt to determine if WilliamShakespeare’s plays were really written by Sir Francis Bacon. A researcherdecided to count the lengths of the words in Shakespeare’s and Bacon’s writings.If the plays were written by Bacon the lengths of words used should correspond
closely.
a. What percentage of all Shakespeare’s words are four letters long?

7/21/2019 Numeracy Gr 7
http://slidepdf.com/reader/full/numeracy-gr-7 163/166
161
b. What percentage of all Bacon’s words are four letters long?
c. What percentage of all Shakespeare’s words are more than five letters long?
d. What percentage of all Bacon’s words are more than five letters long?
e. Based on these histograms, do you think that William Shakespeare was really just apseudonym for Sir Francis Bacon? Explain.

7/21/2019 Numeracy Gr 7
http://slidepdf.com/reader/full/numeracy-gr-7 164/166
162
2. The two histograms show the sleeping habits of the teens at two different highschools. Maizeland High School is a small rural school with 100 learners andUrbandale High School is a large city school with 3 500 learners.
a. About what percentage of the students at Wheatland get at least eight hours ofsleep per night?
b. About what percentage of the students at Urbandale get at least eight hours ofsleep per night?
c. Which high school has more students who sleep between nine and ten hours per
night?
148b More about histograms continued
Term4
Week6

7/21/2019 Numeracy Gr 7
http://slidepdf.com/reader/full/numeracy-gr-7 165/166
163
Problem solving
The table below shows the ages of the actresses and actors who won the Oscar for best actress or actor
during the first 30 years of the Academy Awards. Use the data from the table to make two histograms(one for winning actresses’ ages and one for winning actors’ ages). Use bin widths of ten years (0-9; 10-
19; 20-29 etc.)
Write a short paragraph discussing what your two histograms reveal.
Year Age of
winning
actress
Age of
winning
actor
1928 22 42
1929 36 40
1930 28 62
1931 62 53
1932 32 35
1933 24 34
1934 29 33
1935 27 52
1936 27 41
1937 28 37
1938 30 38
1939 26 34
1940 29 32
1941 24 40
1942 34 43
Year Age of
winning
actress
Age of
winning
actor
1943 24 49
1944 29 41
1945 37 40
1946 30 49
1947 34 56
1948 34 41
1949 33 38
1950 28 38
1951 38 52
1952 45 51
1953 24 35
1954 26 30
1955 47 38
1956 41 41
1957 27 43
d. Which high school has a higher median sleep time?
e. Wheatland’s percentage of students who sleep between eight and nine hours pernight is ________ % more than that of Urbandale.
7/21/2019 Numeracy Gr 7
http://slidepdf.com/reader/full/numeracy-gr-7 166/166
Notes