nullarbor cave slime: looking at life in the dark
TRANSCRIPT

1
Nullarbor Cave Slime:
Looking at life in the dark

2
Location of sampled caves

3
Beneath the Nullarbor…
Entrance to Warbla cave, Western Australia- photo Liz Rogers

4
Cave passage flooded with saline water
Photo - Liz Rogers

5
Sampling procedure
Photo - Steve Trewavas
6
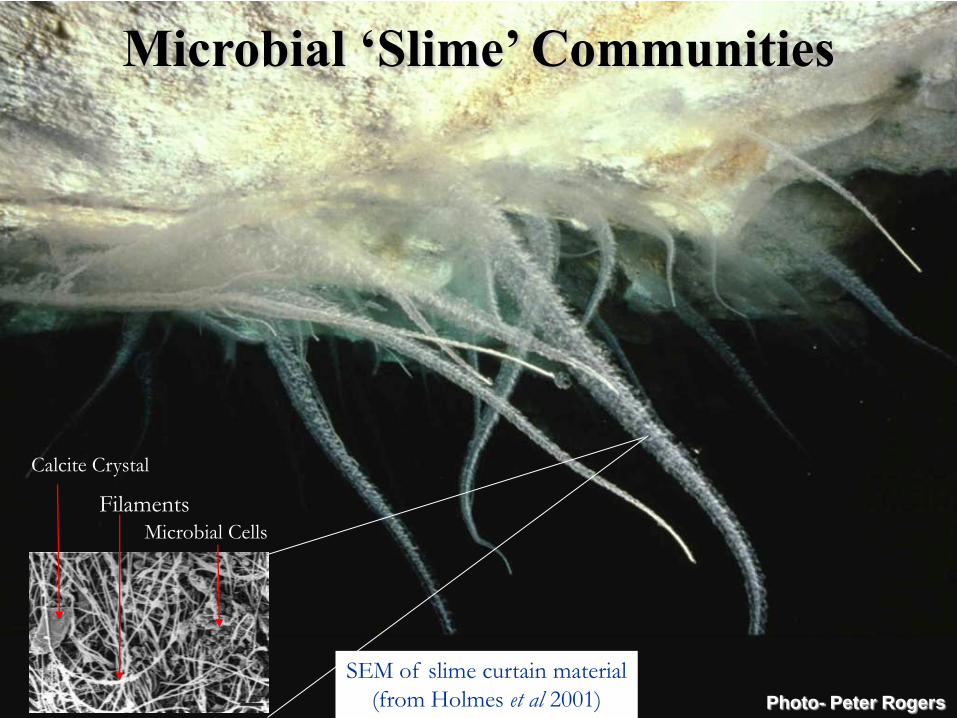
Microbial ‘Slime’ Communities
SEM of slime curtain material
(from Holmes et al 2001)
Calcite Crystal
Filaments Microbial Cells
Photo- Peter Rogers

7
0 10000 20000 30000 40000 50000 60000 70000
0
10
20
30
40
50
60
70
80
90
100
Contig Size vs Coverage
Contig Size
Cont
ig C
ove
rage
(nu
mber
of re
ads)
Metagenome sequencing of Weebubbie cave
community
• Environmental DNA from Weebubbie cave was sequenced
with 454 GS-FLX (Ramaciotti centre)
• Obtained 548 365 reads, average length 581bp
• 279 393 (~51%) assembled into contigs

8
Inferred taxonomic composition

9
Nitrosopumilus
maritimus SCM1
Weebubbie
Metagenomic Contigs
Alignment of Weebubbie contigs and Nitrosopumilus
maritimus SCM1 genome
Almost all large contigs showed significant similarity to the
Nitrosopumilus maritimus SCM1 genome

10
Nitrosopumilus
maritimus SCM1
Weebubbie
Metagenomic Contigs
Alignment of Weebubbie contigs and Nitrosopumilus
maritimus SCM1 genome
Nitrosopumilus
maritimus SCM1
Weebubbie
Metagenomic Contigs

11
Phylogenetic tree- Weebubbie archaeal 16S rRNA
gene T
hau
march
aeo
ta
Cren
arch
aeo
ta
Eu
ryarch
aeo
ta

12
Functional comparison of Weebubbie metagenome
with other aquatic metagenomes
Weebubbie Cave Metagenome ♦
Chesapeake Bay Estuary, U.S.A. ■
South Australia Groundwater Aquifer ●
Coastal Caribbean Sea ■
Isabella Island Mangroves, Galapagos Island ■
Deep Marmara Sea (1000 m) ■
Cell Division and Cell Cycle
Nitrogen Metabolism
Potassium Metabolism Photosynthesis
Iron Acquisition and Metabolism
1 2 3 4 5 6 7 8 9 10 11 12 13 14 15 16 17 18 19 20 21 22 23 24 25 26 27 28

13
Ammonia
Hydroxylamine
Nitric Oxide Dinitrogen
Oxide Nitrogen
Nitrate
Nitrite
Bacteria Archaea
Ammonia
Monooxygenase
(108) EC 1.13.12.-
Hydroxylamine
Oxidase (8)
EC 1.7.3.4
Nitrate Reductase
NADH (42)
EC 1.7.1.1
Nitrite Reductase
NAD(P)H (42)
EC 1.7.1.4
Ferredoxin Nitrite
Reductase
(74) EC 1.7.7.1
Nitric Oxide
Reductase (10)
EC 1.7.2.5
Nitrous Oxide
Reductase (28)
EC 1.7.2.4
Nitrate
Reductase (314)
EC 1.7.2.1
Nitrite Reductase
NO Forming (218)
EC 1.7.2.1
Nitrate
Oxidoreductase
(79)
Bacterial and archaeal abundances for key
nitrogen metabolism enzymes

14
Nitrite oxidation
~75% Bacteria
Ammonia oxidation
~85% Archaea
Microbial ‘slime’ may represent novel
chemolithotrophic communities
Ammonia
(NH3)
Nitrite
(N02-)
Nitrate
(N03-)
• No detectable organic carbon in cave water around communities
• Communities thought to be lithotrophic – supported by ammonia and nitrite
oxidation, carried out by archaea and bacteria
• Found genes for 3-hydroxypropionate/4-hydrobutyrate pathway used for
carbon assimilation in Nitrosopumilus maritimus
Ammonia
monooxygenase
(AMO)
Nitrite oxidase
Hydroxyl-
amine
(NH2OH)

15
SEM images from Weebubbie slime community
Microscopy results
16
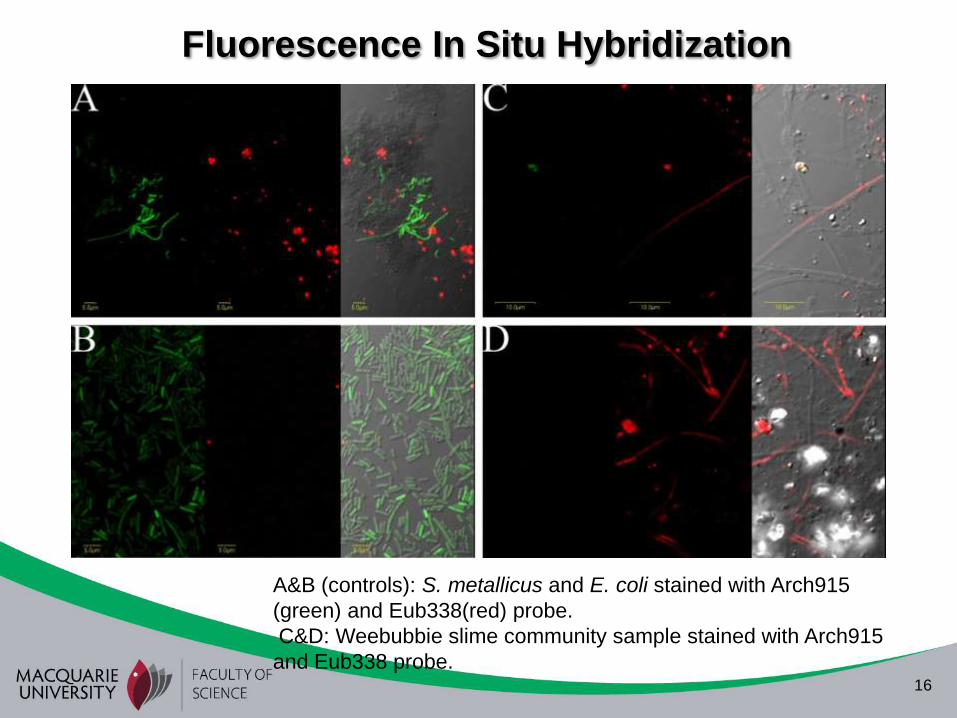
A&B (controls): S. metallicus and E. coli stained with Arch915
(green) and Eub338(red) probe.
C&D: Weebubbie slime community sample stained with Arch915
and Eub338 probe.
Fluorescence In Situ Hybridization

17
Comparative 16S survey- Weebubbie and Warbla
Weebubbie original (metagenome)
Weebubbie 3
Weebubbie 2
Weebubbie 1
Warbla 4
Warbla 3
Warbla 2
Warbla 1

18
More weird Australian microbial communities

19
Acknowledgements
Samples and pictures
Cave divers responsible for
sample collection (most
pictures from Liz Rogers)
Cave community analyses
Katy Breakwell, Jan
Rieckmann, Liam Elbourne,
Andrew Holmes, Michael
Gillings, Ian Paulsen