nucleic acids research, 2005, vol. 33, no. 7 … · 17086/39800 pairs have dali outputs, we take...
TRANSCRIPT

TM-align: a protein structure alignment algorithmbased on the TM-scoreYang Zhang and Jeffrey Skolnick*
Center of Excellence in Bioinformatics, University at Buffalo, 901 Washington Street, Buffalo, NY 14203, USA
Received March 5, 2005; Revised and Accepted April 1, 2005
ABSTRACT
We have developed TM-align, a new algorithmto identify the best structural alignment betweenprotein pairs that combines the TM-score rotationmatrix and Dynamic Programming (DP). The algo-rithm is �4 times faster than CE and 20 times fasterthan DALI and SAL. On average, the resulting struc-ture alignments have higher accuracy and coveragethan those provided by these most often-used meth-ods. TM-align is applied to an all-against-all structurecomparison of 10 515 representative protein chainsfrom the Protein Data Bank (PDB) with a sequenceidentity cutoff ,95%: 1996 distinct folds are foundwhen a TM-score threshold of 0.5 is used. We alsouse TM-align to match the models predicted byTASSER for solved non-homologous proteins inPDB. For both folded and misfolded models, TM-align can almost always find close structural analogs,with an average root mean square deviation, RMSD, of3 A and 87% alignment coverage. Nevertheless, thereexists a significant correlation between the correct-ness of the predicted structure and the structural sim-ilarity of the model to the other proteins in the PDB.This correlation could be used to assist in modelselection in blind protein structure predictions.The TM-align program is freely downloadable athttp://bioinformatics.buffalo.edu/TM-align.
INTRODUCTION
Protein structure comparisons are employed in almost allbranches of contemporary structural biology, ranging fromprotein fold classification (1,2), protein structure modeling(3) to structure-based protein function annotation (4,5).With the rapid increase in the number of solved proteinstructures in the Protein Data Bank (PDB) (6) and the progresson proteome-scale protein structure modeling (7–9) and
functional annotation (10), the need for fast and accurate struc-ture comparison algorithms has become more and more cru-cial. In general, there are two types of comparisons for proteintertiary structures. The first is to compare protein structures/models with an a priori specified equivalence between pairs ofresidues (such an equivalence can be provided by sequence orthreading algorithms, for example). The most commonly usedmetric in this category is the root-mean-square deviation,RMSD, in which the root-mean-square distance betweencorresponding residues is calculated after an optimal rotationof one structure to another (11). Since the RMSD weights thedistances between all residue pairs equally, a small number oflocal structural deviations could result in a high RMSD, evenwhen the global topologies of the compared structures aresimilar. Furthermore, the average RMSD of randomly relatedproteins depends on the length of compared structures, whichrenders the absolute magnitude of RMSD meaningless (12).The recently proposed TM-score (13) overcomes these prob-lems by exploiting a variation of Levitt–Gerstein (LG) weightfactor (14) that weights the residue pairs at smaller distancesrelatively stronger than those at larger distances. Therefore,the TM-score is more sensitive to the global topology thanto the local structural variations. Moreover, the value of theTM-score is normalized in a way that the score magnituderelative to random structures is not dependent on the protein’ssize, with a value of 0.17 for an average pair of randomlyrelated structures (13).
The second type of structure comparison compares a pair ofstructures where the alignment between equivalent residues isnot a priori given. Therefore, an optimal alignment needs to beidentified, which is in principle an NP-hard problem with noexact solution (15). A variety of different structure alignmentapproaches have been proposed to search for the best structurealignment. These differ mainly in the score matrix used toassess the alignments and the search algorithm employed toidentify the defined best alignment. For example, in DALI (16),the equivalency score is defined as the difference betweenthe intra-structural residue–residue distances in the comparedstructures, and a Monte Carlo procedure is exploited to searchfor the minimum in the cumulative equivalency score. In CE(17), the score is measured by the intra-structural distance of
*To whom correspondence should be addressed. Tel: +1 716 849 6712; Fax: +1 716 849 6747; Email: [email protected]
ª The Author 2005. Published by Oxford University Press. All rights reserved.
The online version of this article has been published under an open access model. Users are entitled to use, reproduce, disseminate, or display the open accessversion of this article for non-commercial purposes provided that: the original authorship is properly and fully attributed; the Journal and Oxford University Pressare attributed as the original place of publication with the correct citation details given; if an article is subsequently reproduced or disseminated not in its entirety butonly in part or as a derivative work this must be clearly indicated. For commercial re-use, please contact [email protected]
2302–2309 Nucleic Acids Research, 2005, Vol. 33, No. 7doi:10.1093/nar/gki524
Published online April 22, 2005

eight-residue fragments, and the alignment is built by gradu-ally adding new eight-residue fragments to the existingalignment path. In STRUCTAL (14) and SAL (18), the authorsused the inter-structural residue–residue distance based LG-score matrix and maximized the cumulative LG-score (14) orrelative RMSD (12) by a heuristic iteration of Needleman–Wunsch dynamic program (19). However, since the LG-scoreis calculated based on the Kabsch rotation matrix (11) that wasdefined for minimizing the RMSD rather than maximizing theLG-score, this mismatch in the alignment optimization canslow down the convergence of the iteration procedure andreduce the efficiency of these algorithms.
In this work, we will extend the approaches of Levitt andGerstein (14) and Kihara and Skolnick (18), but use theTM-score rotation matrix to speed up the process of identify-ing the best structure alignments. We at first test the developedalgorithm on a small set of 200 non-homologous proteins andcompare the results to existing methods. Then, we will applythe algorithm for large-scale native-to-native and model-to-native structure comparisons.
METHODS
TM-align only employs the backbone Ca coordinates of thegiven protein structures; however, the methodology is readilygeneralized to any type of atom.
Initial structural alignment
Three kinds of quickly identified initial alignments areexploited. The first type of initial alignment is obtained byaligning the secondary structures (SSs) of two proteins usingdynamic programming (DP) (19). The element of the scorematrix is assigned to be 1 or 0 depending on whether or not theSS elements of aligned residues are identical. Here, a penaltyof �1 for gap-opening works the best. For a given residue,an SS state (a, b or coil) is assigned based on the Ca coordin-ates of five neighboring residues, i.e. ith residue is assigned asa(b) when
jdj‚ jþk � la bð Þk j < da bð Þ
‚ j ¼ i � 2‚ i � 1‚ i; k ¼ 2‚3‚4ð Þ 1
is satisfied for all dj,j+k that denotes the Ca distance betweenthe jth and (j + k)th residues; otherwise, it is assigned to be acoil. The final assignment is further smoothed by merging andremoving singlet SS states. We note that the set of eightparameters are optimized based on 100 non-homologous train-ing proteins by maximizing the SS assignment similarity to theDSSP definition (20), which defines protein SS elementson the basis of hydrogen bond patterns and requires the fullset of backbone atomic coordinates. The optimized parametersare la2 ¼ 5:45 A
�, la3 ¼ 5:18 A
�, la4 ¼ 6:37 A
�, da = 2.1 s,
lb2 ¼ 6:1 A�, lb3 ¼ 10:4 A
�, lb4 ¼ 13 A
�, db = 1.42 s. Using
Equation 1, we achieve an average Q3 accuracy of 85%with respect to the DSSP assignment for the representative1489 non-homologous test protein set used in Ref. (8).
The second type of initial alignment is based on the gaplessmatching of two structures. As in SAL (18), for the smaller ofthe two compared proteins, we perform gapless threadingagainst the larger structure, but rather than use RMSD asthe comparison metric as was done in SAL, now the alignmentwith the best TM-score is selected.
The third initial alignment is also obtained by DP using agap-opening penalty of �1, but the score matrix is a half/halfcombination of the SS score matrix and the distance scorematrix selected in the second initial alignment.
Heuristic iteration
The above-obtained initial alignments are submitted to a heur-istic iterative algorithm, which has been extensively usedin refining NP-hard structure-based alignments (14,18,21).In this procedure, we first rotate the structures by the TM-score rotation matrix (13) based on the aligned residues in theinitial alignments. The score similarity matrix is defined as
S i‚ jð Þ ¼ 1
1 þ d2ij=d0 L minð Þ2
‚ 2
where dij is the distance of the ith residue in structure 1 and thejth residue in structure 2 under the TM-score superposition;d0 L minð Þ ¼ 1:24
ffiffiffiffiffiffiffiffiffiffiffiffiffiffiffiffiffiffiL min�153
p�1:8 with Lmin being the length
of the smaller protein. A new alignment can be obtained byimplementing DP on the matrix S(i, j) with an optimal gap-opening penalty of �0.6. We then again superimpose thestructures by the TM-score rotation matrix according to thenew alignment and obtain a newer alignment by implementingDP with the new score matrix. The procedure is repeated untilthe alignment becomes stable and the alignment with thehighest TM-score is returned. Because of the consistency ofthe TM-score based rotation matrix and the DP similarityscore, the alignments usually converge very fast, and typically2–3 iterations are enough for the identification of the bestalignment.
Here, in both the initial alignment identification andthe heuristic iterations, we only exploit gap penalties forgap opening but not for gap extension. Another option is toeliminate the gap penalties entirely and consider a localcooperativity term to avoid overfragmentation within helicesand strands.
RESULTS
Benchmark test
To test the performance of the algorithm, we collect a set of200 non-homologous protein chains from the PDB, whichrange in size from 46 to 1058 residues and whose pairwisesequence identity is <30%. A list of the proteins as well as thefull-atom structures is available at http://www.bioinformatics.buffalo.edu/TM-align/benchmark.
In Table 1, we present a summary of the structuralalignments of 200 · 199 non-homologous protein pairs byTM-align, compared with three other most often-used struc-tural alignment tools, i.e. CE (17), DALI (DaliLite 2.3) (16)and SAL (18). Here, for some algorithms (e.g. DALI),changing the order of the compared structures can result indifferent alignments. Moreover, the definition of TM-score(see Equation 3 below) depends on the target we select fornormalization. We therefore count all comparisons withrespect to both partners in Table 1.
We at first take averages for CE, SAL and TM-align over allthe 39 800 structure pairs (upper half of the table). Since DALIonly reports those alignments of significant Z-score and
Nucleic Acids Research, 2005, Vol. 33, No. 7 2303

17 086/39 800 pairs have DALI outputs, we take averages forall four methods over these 17 086 structural pairs in the lowerpart of Table 1.
Columns 2–4 list the alignment accuracy and the coverage(fraction of aligned residues within the target protein). Ingeneral, algorithms with larger coverage tend to have loweraccuracy. For example, DALI has the largest coverage of53.5%, but the average RMSD of the corresponding alignedresidues is 14.25 s. CE has a higher accuracy than both DALIand SAL, but the alignment coverage is the lowest. TM-alignhas the highest accuracy and rank three coverage in the table.To have a single scoring function that can reasonably assessthe alignment quality and balance the coverage and accuracy,we use the TM-score, which is defined as (13)
TM-score ¼ Max1
LTarget
XLali
i
1
1 þ di
d0 LTargetð Þ
� �2
26664
37775: 3
Here, LTarget is the length of target protein that other PDBstructures are aligned to; Lali is the number of aligned residues;di is the distance between the ith pair of aligned residues.d0 LTarget
� �¼ 1:24
ffiffiffiffiffiffiffiffiffiffiffiffiffiffiffiffiffiffiffiffiffiLTarget�153
p�1:8 is a distance parameter
that normalizes the distance so that the average TM-scoreis not dependent on the protein size for random structurepairs and can be thought of as the average distance betweenan aligned pair of residues in a randomly related pair of struc-tures whose target structure is length LTarget.
Based on the average TM-score, TM-align is ranked best,followed by SAL, DALI and CE. Certainly, the rank of per-formance of the algorithms could be different when differentevaluation criteria are used. For example, if one simply con-siders alignment coverage, DALI and SAL will rank betterthan TM-align. In fact, a variety of different evaluation meth-ods have been considered in the literature (22). For example,many authors use SCOP (1) or CATH (2) as the gold standardand assess the structural alignments based on the fold classi-fications in these databases (23–25). Because the CATH andSCOP classifications are discrete, a drawback of this kind ofevaluation is that the detailed alignment quality is not takeninto account. Moreover, the creators of some databases suchas CATH use information from other structural alignment
algorithms. Recent studies (18,26) have shown that significantstructural similarity exists in the proteins belonging to differ-ent fold families in the CATH and SCOP classifications.Here, the criteria we adopt is purely geometric; i.e. for thesame set of proteins, the winners are those who find themore matched residues (coverage) with higher accuracy(low RMSD), where the TM-score represents an appropriatecombined quality measure (13). It has been demonstrated else-where (13) that the TM-score has the strongest correlation withthe foldability of alignments by the generally used modelingtool, MODELLER (27), in comparison with other similarityscores. Moreover, the rank of CASP5 models by TM-scoreis highly consistent with that of human-expert visual evalu-ations (28). Here, we do not include the alignment gap penaltyin the TM-score evaluation because there is no obviouscorrelation between the gap density and the foldability of agiven alignment (13).
While the data in columns 2–5 are the average over allstructure pairs where the majority of them have differentfolds and low TM-score, a more practical question is tocheck the method’s abilities to fish out the most significantstructural match to a given target structure. In columns 6–9,we choose the match of the highest TM-score for each targetprotein and do the average for all 200 target proteins (or 198,when considering those proteins with DALI outputs). On thebasis of either coverage or accuracy, TM-align is rankedsecond in this average. The average TM-score of TM-alignagain ranks the best.
In the last column of Table 1, we list the average CPU timeper structure pair, where all the alignments are done on a1.26 GHz Pentium III processor. The average CPU time perpair by TM-align is �0.5 s, which is �4 times faster than CE,�20 times faster than DALI and SAL.
In Figure 1, we show a typical example of a structuralcomparison between 1atzA and 1auoA, which have a sequenceidentity of 16% and share a similar aba-sandwich fold. While1atzA has five b-strands and three a-helices on each side,1auoA has seven b-strands in the middle and two a-helicesin the left and four a-helices in the right side. The latter hasalso a unique long b-turn on the right side. An ideal structurealignment, therefore, should match two a-helices on the left,five b-strands in the middle and three a-helices on the rightside of the two structures.
Table 1. Structural alignments by different algorithms for 200 non-homologous PDB proteins
Average over all pairsa Average over pairs with TMMb htic
hRi hLi hcovi hTMi hRMi hLMi hcovMi hTMMi
Test set of all 39 800 structure pairsCE 6.52 64.3 34.7% 0.169 3.95 128.8 61.4% 0.441 2.25SAL 7.33 95.3 47.3% 0.229 5.84 164.8 72.8% 0.474 10.00TM-align 4.99 87.4 42.0% 0.253 4.45 166.2 73.1% 0.510 0.51
Test set of 17 086 pairs where DALI has an outputCE 6.36 73.0 34.7% 0.185 3.95 129.2 61.2% 0.440 2.28DALI 14.25 123.2 53.5% 0.223 9.40 175.2 76.8% 0.471 12.22SAL 7.53 108.4 47.5% 0.241 5.83 164.4 71.7% 0.471 10.13TM-align 5.18 101.9 43.4% 0.271 4.44 165.8 71.9% 0.506 0.52
aResults are averaged over all structure pairs. R, L, cov and TM denote, respectively, the RMSD (in the unit of A), number of aligned residues, coverage of alignedregions over the target sequence and TM-score as defined in Equation 3.bFor each protein, only the pair with the maximum TM-score is considered, on which the averages are taken.cAverage CPU time (in the unit of second) per structure alignment on a 1.26 GHz PIII processor.
2304 Nucleic Acids Research, 2005, Vol. 33, No. 7
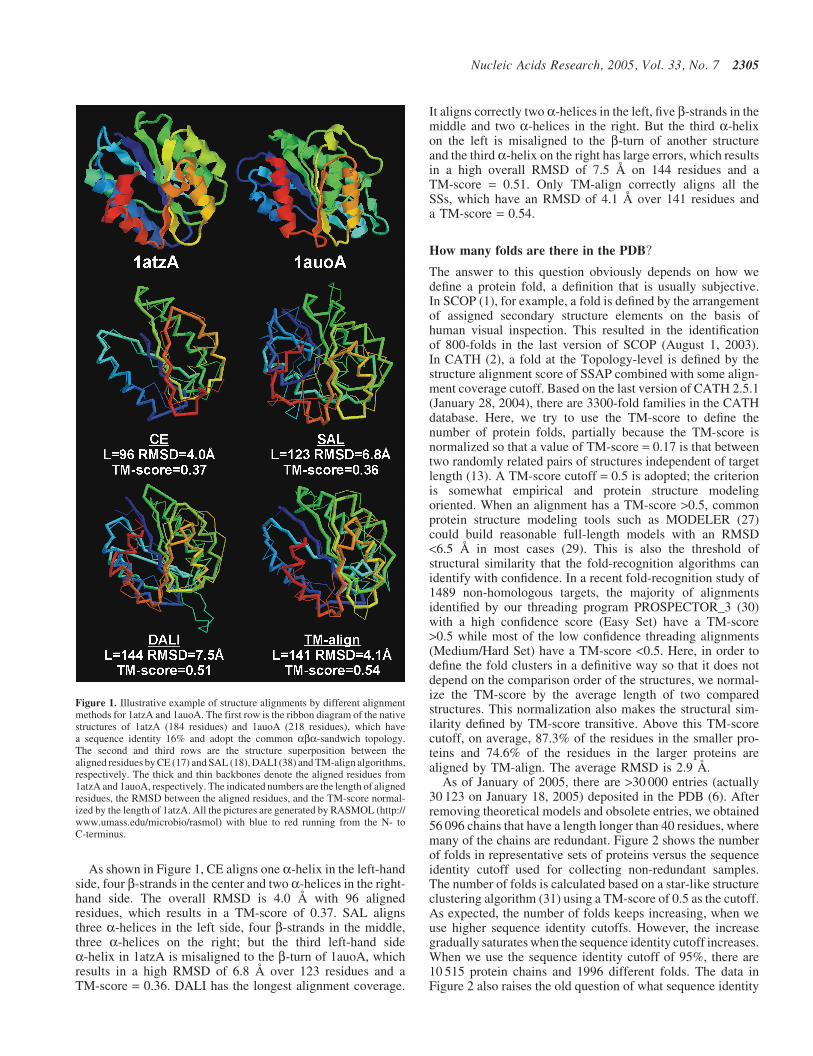
As shown in Figure 1, CE aligns one a-helix in the left-handside, four b-strands in the center and two a-helices in the right-hand side. The overall RMSD is 4.0 s with 96 alignedresidues, which results in a TM-score of 0.37. SAL alignsthree a-helices in the left side, four b-strands in the middle,three a-helices on the right; but the third left-hand sidea-helix in 1atzA is misaligned to the b-turn of 1auoA, whichresults in a high RMSD of 6.8 s over 123 residues and aTM-score = 0.36. DALI has the longest alignment coverage.
It aligns correctly two a-helices in the left, five b-strands in themiddle and two a-helices in the right. But the third a-helixon the left is misaligned to the b-turn of another structureand the third a-helix on the right has large errors, which resultsin a high overall RMSD of 7.5 s on 144 residues and aTM-score = 0.51. Only TM-align correctly aligns all theSSs, which have an RMSD of 4.1 s over 141 residues anda TM-score = 0.54.
How many folds are there in the PDB?
The answer to this question obviously depends on how wedefine a protein fold, a definition that is usually subjective.In SCOP (1), for example, a fold is defined by the arrangementof assigned secondary structure elements on the basis ofhuman visual inspection. This resulted in the identificationof 800-folds in the last version of SCOP (August 1, 2003).In CATH (2), a fold at the Topology-level is defined by thestructure alignment score of SSAP combined with some align-ment coverage cutoff. Based on the last version of CATH 2.5.1(January 28, 2004), there are 3300-fold families in the CATHdatabase. Here, we try to use the TM-score to define thenumber of protein folds, partially because the TM-score isnormalized so that a value of TM-score = 0.17 is that betweentwo randomly related pairs of structures independent of targetlength (13). A TM-score cutoff = 0.5 is adopted; the criterionis somewhat empirical and protein structure modelingoriented. When an alignment has a TM-score >0.5, commonprotein structure modeling tools such as MODELER (27)could build reasonable full-length models with an RMSD<6.5 s in most cases (29). This is also the threshold ofstructural similarity that the fold-recognition algorithms canidentify with confidence. In a recent fold-recognition study of1489 non-homologous targets, the majority of alignmentsidentified by our threading program PROSPECTOR_3 (30)with a high confidence score (Easy Set) have a TM-score>0.5 while most of the low confidence threading alignments(Medium/Hard Set) have a TM-score <0.5. Here, in order todefine the fold clusters in a definitive way so that it does notdepend on the comparison order of the structures, we normal-ize the TM-score by the average length of two comparedstructures. This normalization also makes the structural sim-ilarity defined by TM-score transitive. Above this TM-scorecutoff, on average, 87.3% of the residues in the smaller pro-teins and 74.6% of the residues in the larger proteins arealigned by TM-align. The average RMSD is 2.9 s.
As of January of 2005, there are >30 000 entries (actually30 123 on January 18, 2005) deposited in the PDB (6). Afterremoving theoretical models and obsolete entries, we obtained56 096 chains that have a length longer than 40 residues, wheremany of the chains are redundant. Figure 2 shows the numberof folds in representative sets of proteins versus the sequenceidentity cutoff used for collecting non-redundant samples.The number of folds is calculated based on a star-like structureclustering algorithm (31) using a TM-score of 0.5 as the cutoff.As expected, the number of folds keeps increasing, when weuse higher sequence identity cutoffs. However, the increasegradually saturates when the sequence identity cutoff increases.When we use the sequence identity cutoff of 95%, there are10 515 protein chains and 1996 different folds. The data inFigure 2 also raises the old question of what sequence identity
Figure 1. Illustrative example of structure alignments by different alignmentmethods for 1atzA and 1auoA. The first row is the ribbon diagram of the nativestructures of 1atzA (184 residues) and 1auoA (218 residues), which havea sequence identity 16% and adopt the common aba-sandwich topology.The second and third rows are the structure superposition between thealigned residues by CE (17) and SAL (18), DALI (38) and TM-align algorithms,respectively. The thick and thin backbones denote the aligned residues from1atzA and 1auoA, respectively. The indicated numbers are the length of alignedresidues, the RMSD between the aligned residues, and the TM-score normal-ized by the length of 1atzA. All the pictures are generated by RASMOL (http://www.umass.edu/microbio/rasmol) with blue to red running from the N- toC-terminus.
Nucleic Acids Research, 2005, Vol. 33, No. 7 2305

cutoff should be used when we construct a template library forthe fold-recognition programs. Based on Figure 2, if a 30%sequence identity cutoff is used, we include only 77% of theprotein folds in the PDB. Even if we use a 40% sequenceidentity cutoff, 7% of the folds will still be missed in thefold library. A similar dependence of the number of foldson the sequence identity cutoff can also be obtained if weuse, e.g. SCOP or DALI. However, the absolute value offold numbers in SCOP definition is lower than that shownin Figure 2. Based on our data, a similar number of foldscan be obtained if we use a Z-score cutoff of �7.3 in DALI.
The data in Figure 2 demonstrate that highly homologousproteins can adopt very different folds. In the set of 10 515protein chains, TM-align found 52 protein pairs that havesequence identities >70% but have a TM-score <0.4. Morecases should be found if we consider the whole set of 56 096protein chains in the PDB. Most of these cases are NMRstructures, except for four pairs that were solved by X-raydiffraction. One reason for the structurally divergent homo-logies is that the mutations of a few key residues couldsometimes induce shifts of the minimum of the free-energylandscape and therefore trigger dramatic conformationchanges (32). Structure differences can also be caused bychanges in solvent conditions and ligand binding (33). Twotypical examples are shown in Figure 3 where 1hngB, 1a64Aand 1g4yB are X-ray structures and 1kkdA from NMR.
Comparison of misfolded proteins to PDB structures
For a given sequence, structure prediction algorithms generatea variety of structure decoys, which often include both correctand wrong (i.e. a structure different from that actually adoptedby the sequence of interest) folds (34). An interesting questionis how different are these structural decoys from the nativestructures of other proteins in the PDB library. Since theaccessible conformational space of a medium size protein isastronomical (35), while the number of folds of solved proteins
in the PDB (or even the folds existing in nature) is limited, it isconceivable that the possibility of a misfolded structure beingclose to any native structures should be low. On the other hand,as demonstrated in Figure 2 and by other authors (1,2,18,26),the space of solved protein structures is very dense, and thecorrectly folded decoys should be relatively easier to findsimilar folds in PDB. Therefore, it is tempting to considerthe distance of models to the closest solved protein as anindicator of the correctness of the predicted structure. Havingthe developed structure alignment method, we can systemat-ically check this possibility.
We first collect a set of 300 non-homologous proteins whoselength ranges from 41 to 300 residues, including 250 singledomain proteins and 50 multi-domain proteins. To make thebenchmark representative, the 300 target proteins are equallytaken from three categories of Easy, Medium, Hard sets,defined according to the score significance of template align-ments by our fold-recognition program PROSPECTOR_3 (30)and approximately reflecting the difficulties of structure mod-eling of the targets. TASSER (36) is exploited to assemblefull-length models using continuous threading template frag-ments by Monte Carlo simulations. The five lowest free-energy models are selected by SPICKER clustering (31).
We then search for the closest structural analogues of thesefive models by TM-align that are found in the PDB library (6).To guarantee that our exercise does not exploit homologousinformation, we exclude the proteins >30% sequence identityto the target structures from the PDB library. In Figure 4A(C),we show the TM-score (RMSD) of the closest templates iden-tified by TM-align to native versus the TM-score (RMSD) ofthe TASSER models to native. As expected, there is a verystrong correlation between the distances of the template tonative and the model to native, although the models haveon average a higher TM-score to native. The average RMSDof the template to native (8.5 s) is slightly lower than that ofthe models (8.9 s), which is partially because only a part of thetotal number of residues counted in the RMSD calculation for
Figure 2. Number of folds included in the representative protein sets collected from the PDB library on January 28, 2005 using different sequence identity cutoffs.A fold is defined using a TM-score threshold of 0.5.
2306 Nucleic Acids Research, 2005, Vol. 33, No. 7

the templates (on average, 87% residues are aligned). It isnoticeable that some points at the bottom of Figure 4C indicatea significant RMSD difference between the models and tem-plates. A closer check shows that these TASSER models havesome errors in the tail and loop regions while the TM-alignautomatically aligns only the core regions in the template.Figure 5 shows a typical example of this situation for 1c0fS,where the TASSER model has two tails and one loop incor-rectly predicted. This results in an overall RMSD of 10.5 s
although the core region of the model is correct. In contrast,TM-align matches the core region of the model to 1kcqA withan RMSD = 1.9 s over 76% of the residues (it is noted that1kcqA was not used as the input template in the TASSERmodeling of 1c0fS). However, the TM-score of the templateis still slightly smaller than the model because of the missedregions (see Figure 5). This example also highlights the insens-itivity of RMSD to the global topology of protein structures.
In Figure 4B and D, using the TM-score and RMSD, res-pectively, we plot the structure distances between TM-alignselected templates and TASSER models versus the distance
between TASSER models and native structures. First of all, foralmost all the models including both folded and misfoldedones, TM-align can find fairly close structure alignments inthe PDB library, which is consistent with our earlier conclu-sion that the current PDB library is nearly a complete fold set(18,29). For example, even for models that have an RMSDfrom native of >20 s, TM-align still finds alignments to otherPDB structures <5 s with >75% of the residues aligned in themajority of cases (Figure 4D). Because by design, structuralalignments explore a large set of compact, protein-like struc-tures, the number of which increases exponentially with pro-tein size, the library of solved PDB structures might provide anessentially complete source of compact, protein-like structuresdetectable by structure alignment algorithms. In practice, thisappears to be the case where even non-native decoys almostalways have a reasonably close representative in the PDB.
Despite the fact all decoys are ‘protein-like’, it is interestingto note that there still exists a strong correlation (with correla-tion coefficient = 0.87) between the TM-score of the modeland template, and that of model and native. This seems tosuggest that the distance of models to the closest PDB struc-tures may be considered as an indicator of model quality (37).To examine this idea, we list in Table 2 a quantitative com-parison of the first models selected using different rankingmethods. The rank based on the distance of TM-align struc-tural alignment to the closest PDB structure is obviously betterthan random, which is consistent with the correlation datashown in Figure 4C. However, the rank of structural alignmentstill does not work as well as that by the free energy as shownin column 2. If we combine both ranks from the free energyand the TM-align structural alignments, we can obtain somegain in ranking the best model although it is quite marginal.
DISCUSSION
We have developed a protein structural alignment approach,called TM-align, which is an extension of ideas used inSTRUCTAL by Levitt and Gerstein (14) and SAL by Kiharaand Skolnick (18). The main difference between the TM-alignalgorithm and these previous methods is that the TM-scorerotation matrix instead of Kabsch RMSD rotation matrixhas been exploited in both heuristic DP iterations and finalalignment selection. Because of the inherent consistency of theTM-score rotation matrix and the structural similarity scoringfunction, convergence is much faster. This also helps thealgorithm identify more accurate alignments since the
Figure 3. Two examples of protein pairs that have high sequence identitiesbut adopt entirely different folds. In both examples, the upper parts show thesequence alignments of the proteins and ‘:’ denotes the residues with identicalamino acids; the lower parts are the cartoon structures of the proteins with blueto red running from N- to C-terminus. The proteins in the first example are from1a64A (32) and the N-terminal domain of 1hngB (39). The deletion mutation oftwo key residues (K44 and M45) induces a domain swapping of two proteins.The proteins in the second example are from the calmodulin binding domain(CaMBD), where 1g4yB is the crystal structure from Ca2+-loaded CaMBD incomplex with calmodulin (40) and 1kkdA is the NMR structure from Ca2+-freeCaMBD in complex with calmodulin (33). Ca2+-binding is responsible for theconformational changes of the two structures.
Table 2. Comparison of the first model selected by different ranking methods
Free-energya TM-alignb Randomc Combinationd
hTM-scorei 0.551 0.544 0.5042 0.559hRMSDi (A) 8.89 9.19 10.13 8.71
aRanked by the cluster size from SPICKER (31).bThe models are ranked on the basis of their distances to the closest non-homologous PDB structures found by TM-align.cThe first model is randomly selected from the five largest size clusters.dCombined rank of free-energy and TM-align structural alignment. Here, foreach model, a target function is defined as C = Rank1 + Rank2/2, where Rank1
and Rank2 are the ranks of the considered model on the basis of free-energy andTM-align, respectively. The first model is selected as the one having thelowest C.
Nucleic Acids Research, 2005, Vol. 33, No. 7 2307

TM-score rotation matrix weights smaller inter-structuraldistances stronger than larger inter-structural distances andis therefore more sensitive to the global structure topologythan the RMSD rotation matrix. In a benchmark test of200 · 199 non-homologous protein pairs, TM-align is�20 times faster than SAL and yet generates more accuratealignments with comparable coverage. TM-align is also faster
than two other often-used algorithms, CE (17) and DALI (38),and yet provides structure alignments of higher TM-score(which is not surprising since maximization of the TM-score is the goal of the TM-align objective function).
Because of its advantage in both speed and accuracy,TM-align is conveniently exploited in large-scale, sequence-independent structure comparisons. As an example, we usedTM-align for an all-against-all structure alignment of 10 515non-redundant protein chains in the PDB with pairwisesequence identity <95%. Approximately 2000 folds is obtainedafter clustering all the structures based on the threshold cutoffof TM-score = 0.5.
We find that, on many occasions, highly homologous pro-teins adopt very different folds. Consistent with this observa-tion, the number of folds included by a representative set ofproteins collected by sequence comparisons is sensitive tothe sequence identity cutoff as shown in Figure 2. In general,there are always more or less lost folds when constructinga fold-recognition template library using a sequence identitythreshold [typically 35–40% (30)]. A simple strategy to dealwith this issue is to combine the sequence comparisonprocedure with a follow-up structural alignment search ofthe entire PDB to add missed folds.
We also used the TM-align algorithm to match the predic-ted structures to the solved non-homologous proteins inPDB. Consistent with the previous conclusion about thecompleteness of protein folds in PDB (18,29), both folded
Figure 4. Structure alignments of the computer models by TASSER (8) to non-homologous proteins in the PDB library (6). (A) TM-score between the closesttemplate to the native structure found by TM-align and the native structure versus the TM-score between the TASSER model and the native. (B) TM-score betweenthe TASSER model and the closest found (highest TM-score) template versus the TM-score between the TASSER model and the native. (C) RMSD between theclosest template to the native structure and the native structure versus RMSD between the model and the native. (D) RMSD between the model and the closesttemplate versus the RMSD between the model and the native. The stars denote the alignment coverage of the closest templates found by TM-align. The yellow solidcircles denote the average of the points fallen in the intervals of the horizontal axis in each picture. The black lines are to guide the eye.
Figure 5. A comparison of a computer model generated by TASSER (8) and theclosest PDB structure (template) found by TM-align. This is a typical examplewhere the model has a much larger RMSD than the template because of themisoriented tails and loops. The thick backbones are the model or template andthe thin ones the native structure of 1c0fS. The red residues are those residueswhere their distances are <5 s in the TM-score rotation matrix.
2308 Nucleic Acids Research, 2005, Vol. 33, No. 7

and misfolded decoys are found to have close structure analogswith an average RMSD = 3 s and 87% of the residues aligned.However, the correctly folded decoys tend to have a closermatch to non-homologous PDB structures than that of misfol-ded ones. This finding indicates that some signal about foldcorrectness is carried by similarity of the models to PDBstructures and the latter may be used as a complement to thefree energy for the model selection in blind protein structurepredictions. Presumably, this signal may be due to the fact thatthe models closer to PDB structures retain more protein-likepacking of elementary secondary structure pieces and turnswhich eventually determine the global topology of the models.
A web-based server version of TM-align, as well as a freelydownloadable program, is available at http://bioinformatics.buffalo.edu/TM-align.
ACKNOWLEDGEMENTS
We are grateful to Dr Andras Szilagyi for many stimulatingdiscussions and very helpful suggestions. This research wassupported in part by grant numbers GM-37408 and GM-48835of the Division of General Sciences of the National Institutesof Health (NIH). Funding to pay the Open Access publicationcharges for this article was provided by NIH.
Conflict of interest statement. None declared.
REFERENCES
1. Murzin,A.G., Brenner,S.E., Hubbard,T. and Chothia,C. (1995)SCOP: a structural classification of proteins database for the investigationof sequences and structures. J. Mol. Biol., 247, 536–540.
2. Orengo,C.A., Michie,A.D., Jones,S., Jones,D.T., Swindells,M.B. andThornton,J.M. (1997) CATH—a hierarchic classification of proteindomain structures. Structure, 5, 1093–1108.
3. Moult,J.,Fidelis,K.,Zemla,A. andHubbard,T. (2003) Critical assessmentof methods of protein structure prediction (CASP)-round V. Proteins,53, 334–339.
4. Skolnick,J., Fetrow,J.S. and Kolinski,A. (2000) Structural genomics andits importance for gene function analysis. Nat. Biotechnol., 18, 283–287.
5. Baker,D. and Sali,A. (2001) Protein structure prediction and structuralgenomics. Science, 294, 93–96.
6. Berman,H.M., Westbrook,J., Feng,Z., Gilliland,G., Bhat,T.N.,Weissig,H., Shindyalov,I.N. and Bourne,P.E. (2000) The Protein DataBank. Nucleic Acids Res., 28, 235–242.
7. Chance,M.R., Fiser,A., Sali,A., Pieper,U., Eswar,N., Xu,G., Fajardo,J.E.,Radhakannan,T. and Marinkovic,N. (2004) High-throughputcomputational and experimental techniques in structural genomics.Genome Res., 14, 2145–2154.
8. Zhang,Y. and Skolnick,J. (2004) Automated structure prediction ofweakly homologous proteins on a genomic scale. Proc. Natl Acad. Sci.USA, 101, 7594–7599.
9. Kihara,D., Zhang,Y., Lu,H., Kolinski,A. and Skolnick,J. (2002) Ab initioprotein structure prediction on a genomic scale: application to theMycoplasma genitalim genome. Proc. Natl Acad. Sci. USA, 99,5993–5998.
10. Arakaki,A.K., Zhang,Y. and Skolnick,J. (2004) Large-scale assessmentof the utility of low-resolution protein structures for biochemical functionassignment. Bioinformatics, 20, 1087–1096.
11. Kabsch,W. (1978) A discussion of the solution for the best rotation torelate two sets of vectors. Acta Crystallogr. A, 34, 827–828.
12. Betancourt,M.R. and Skolnick,J. (2001) Universal similarity measure forcomparing protein structures. Biopolymers, 59, 305–309.
13. Zhang,Y. and Skolnick,J. (2004) Scoring function for automatedassessment of protein structure template quality. Proteins, 57, 702–710.
14. Levitt,M. and Gerstein,M. (1998) A unified statistical framework forsequence comparison and structure comparison. Proc. Natl Acad. Sci.USA, 95, 5913–5920.
15. Lathrop,R.H. (1994) The protein threading problem with sequence aminoacid interaction preferences is NP-complete. Protein Eng., 7,1059–1068.
16. Holm,L. and Sander,C. (1993) Protein structure comparison by alignmentof distance matrices. J. Mol. Biol., 233, 123–138.
17. Shindyalov,I.N. and Bourne,P.E. (1998) Protein structure alignment byincremental combinatorial extension (CE) of the optimal path.Protein Eng., 11, 739–747.
18. Kihara,D. and Skolnick,J. (2003) The PDB is a covering set of smallprotein structures. J. Mol. Biol., 334, 793–802.
19. Needleman,S.B. and Wunsch,C.D. (1970) A general method applicableto the search for similarities in the amino acid sequence of two proteins.J. Mol. Biol., 48, 443–453.
20. Kabsch,W. and Sander,C. (1983) Dictionary of protein secondarystructure: pattern recognition of hydrogen-bonded and geometricalfeatures. Biopolymers, 22, 2577–2637.
21. Hubbard,T.J. (1999) RMS/coverage graphs: a qualitative method forcomparing three-dimensional protein structure predictions.Proteins, 37, (Suppl. 3), 15–21.
22. Kolodny,R., Koehl,P. and Levitt,M. (2005) Comprehensive evaluation ofprotein structure alignment methods: scoring by geometric measures.J. Mol. Biol., 346, 1173–1188.
23. Leplae,R. and Hubbard,T.J. (2002) MaxBench: evaluation of sequenceand structure comparison methods. Bioinformatics, 18, 494–495.
24. Sierk,M.L. and Pearson,W.R. (2004) Sensitivity and selectivity in proteinstructure comparison. Protein Sci., 13, 773–785.
25. Novotny,M., Madsen,D. and Kleywegt,G.J. (2004) Evaluation of proteinfold comparison servers. Proteins, 54, 260–270.
26. Yang,A.S. and Honig,B. (2000) An integrated approach to the analysisand modeling of protein sequences and structures. I. Protein structuralalignment and a quantitative measure for protein structural distance.J. Mol. Biol., 301, 665–678.
27. Sali,A. and Blundell,T.L. (1993) Comparative protein modelling bysatisfaction of spatial restraints. J. Mol. Biol., 234, 779–815.
28. Aloy,P., Stark,A., Hadley,C. and Russell,R.B. (2003) Predictions withouttemplates: new folds, secondary structure, and contacts in CASP5.Proteins, 53, 436–456.
29. Zhang,Y. and Skolnick,J. (2005) The protein structure predictionproblem could be solved using the current PDB library. Proc. Natl Acad.Sci. USA, 102, 1029–1034.
30. Skolnick,J., Kihara,D. and Zhang,Y. (2004) The protein structureprediction problem could be solved using the current PDB library.Proteins, 56, 502–518.
31. Zhang,Y. and Skolnick,J. (2004) SPICKER: a clustering approach toidentify near-native protein folds. J. Comput. Chem., 25, 865–871.
32. Murray,A.J., Head,J.G., Barker,J.J. and Brady,R.L. (1998) Engineeringan intertwined form of CD2 for stability and assembly. Nature Struct.Biol., 5, 778–782.
33. Wissmann,R., Bildl,W., Neumann,H., Rivard,A.F., Klocker,N.,Weitz,D., Schulte,U., Adelman,J.P., Bentrop,D. and Fakler,B. (2002)A helical region in the C terminus of small-conductance Ca2+-activatedK+ channels controls assembly with apo-calmodulin. J. Biol. Chem.,277, 4558–4564.
34. Zhang,Y., Kolinski,A. and Skolnick,J. (2003) TOUCHSTONE II:a new approach to ab initio protein structure prediction. Biophys. J.,85, 1145–1164.
35. Levinthal,C. (1969) How to fold graciously. In Debrunner,P., Tsibris,J.and Munck,E. (eds), Mossbauer Spectroscopy in Biological Systems.University of Illinois Press, Illinois, pp. 22–24.
36. Zhang,Y. and Skolnick,J. (2004) Tertiary structure predictions on acomprehensive benchmark of medium to large size proteins.Biophys. J., 87, 2647–2655.
37. Bradley,P., Chivian,D., Meiler,J., Misura,K.M., Rohl,C.A., Schief,W.R.,Wedemeyer,W.J., Schueler-Furman,O., Murphy,P., Schonbrun,J. et al.(2003) Rosetta predictions in CASP5: successes, failures, and prospectsfor complete automation. Proteins, 53, 457–468.
38. Holm,L. and Sander,C. (1995) Dali: a network tool for protein structurecomparison. Trends Biochem. Sci., 20, 478–480.
39. Jones,E.Y., Davis,S.J., Williams,A.F., Harlos,K. and Stuart,D.I. (1992)Crystal structure at 2.8s resolution of a soluble form of the cell adhesionmolecule CD2. Nature, 360, 232–239.
40. Schumacher,M.A., Rivard,A.F., Bachinger,H.P. and Adelman,J.P.(2001) Structure of the gating domain of a Ca2+-activated K+ channelcomplexed with Ca2+/calmodulin. Nature, 410, 1120–1124.
Nucleic Acids Research, 2005, Vol. 33, No. 7 2309