nuclear magnetic resonance measurement of ammonia .../67531/metadc693720/m2/1/high... · nuclear...
TRANSCRIPT

PNNL-11678 Rev. 1 UC-2030
8 I I 1 8
8 I
Nuclear Magnetic Resonance Measurement of Ammonia Diffusion in Dense Solid-Liquid Slurries
S . Bobroff(4 R. J. Phillips(@ A. Shekarriz
January 1998
Prepared for the U.S. Department of Energy under Contract DE-ACO6-76RLO 1830
Pacific Northwest National Laboratory Richland, Washington 99352
(a) Department of Chemical Engineering University of California at Davis

DISCLAIMER
This report was prepared as an account of work sponsored by an agenq of the tinited States Government. Neither the United States Government nor any agency thereof, nor any of their employees, make any wamnty, exp- or implied, or assumes any legal Liabiii- ty or respomiity for the accuracy, completeness, or usefulness of any information, appa- ratus, product, or process disdosed, or represents that its use would not infringe privately owwd rights. Reference herein to any @IC comnwscid praduct, pmce~, or service by trade oame, trademark, mmdadum, or otherwise does not m i y anrstitute or imply is endorsement, mummdab 'on, or favoring by the United States Government or any agency tfrweor. The views and opinions of authors expressed herein do not necessar- ily state or reflect those of the United States Government or any agency t b m f .

DISCLAIMER
Portions of this document may be illegible electronic image products. Images are produced from the best available original document.

Summary
The diffusion of ammonium ions in aqueous solutions was measured by nuclear magnetic resonance (NMR) using the pulsed field gradient (PFG) method. The ammonium ions were obtained from aqueous solutions of ammonium chloride, ammonium sulfate, ammonium bicarbonate, and ammonium hydroxide. The translational diffusion of the ammonium ions was determined by measuring the diffusion of nitrogen nuclei (14N and 15N) in solution. Our results showed that the ammonium diffusion coefficient can be measured in aqueous solutions with concentrations as low as 20 x 10-3 M. Typical values measured for the diffusion coefficient of the ammonium ion are 2 x 10⁻⁵ cm% (&lo%), similar to the values found for pure water. Due to the effect of the solution pH upon the NMR relaxation parameters for 14N, measurements are constrained to pH values below 8.5. However, 15N labeled ammonia is less sensitive to the solution pH, extending the measurement range to pH of 9.5.
Diffusion measurements were conducted with solutions of varying viscosity and porosity. The results show that the solution viscosity has a measurable impact on the diffusion coefficient. The diffusion coefficient is almost inversely proportional to the relative viscosity of the solution, irrespective of how the viscosity is increased. Further, a randomly-packed porous bed of 200 pm PMMA resulted in a reduction of -30% in the diffusion coefficient as a result of hindered diffusion.
iii

I I I I I 1 8 I

The authors wou ike to acknowledge the funding provicdd by the Retained Gas Sam€ Task in support of the Tank Waste Safety Program. The experiments were performed at the Nuclear Magnetic Resonance Facility on the campus of the University of California at Davis, Davis, California, with the assistance of Dr. Wanda Smith.
Acknowledgments
V
.er

R I I 8 1 8 I I t I 1 I I 1 I I I I I

Contents
Summary . . . . . . . . . . . . . . . . . . . . . . . . . . . . . . . . . . . . . . . . . . . . . . . . . . . . . . . . . iii
Acknowledgments . . . . . . . . . . . . . . . . . . . . . . . . . . . . . . . . . . . . . . . . . . . . . . . . . . v
1.0 Introduction . . . . . . . . . . . . . . . . . . . . . . . . . . . . . . . . . . . . . . . . . . . . . . . . . . . 1.1
2.0 Nuclear Magnetic Resonance: Principle of Operation ....................... 2.1
3.0 NMR in Aqueous Ammonia Solutions ................................. 3.1
3.1 1H Nucleus . . . . . . . . . . . . . . . . . . . . . . . . . . . . . . . . . . . . . . . . . . . . . 3.1 3.2 Nitrogen NMR . . . . . . . . . . . . . . . . . . . . . . . . . . . . . . . . . . . . . . . . . . . 3.2 3.3 The Radiofrequency Coil . . . . . . . . . . . . . . . . . . . . . . . . . . . . . . . . . . . . 3-2
4.0 Results and Discussion . . . . . . . . . . . . . . . . . . . . . . . . . . . . . . . . . . . . . . . . . . . 4.1
4.1 Signal-to-Noise Ratio ( S N R ) Versus Ammonia Concentration . . . . . . . . . . . 4.1 4.2 NMR Relaxation Times ..................................... 4.1 4.3 Limitations on Determination of Diffusion Coefficient . . . . . . . . . . . . . . . . . 4.1 4.4 Self-Diffusion Coefficient of 14N Ammonia in Aqueous Solutions . . . . . . . . 4.2
4.4.1 Effect of pH . . . . . . . . . . . . . . . . . . . . . . . . . . . . . . . . . . . . . . . 4.3 4.4.2 Effect of Ammonia Concentration . . . . . . . . . . . . . . . . . . . . . . . . . 4.4 4.4.3 Effect of Viscosity . . . . . . . . . . . . . . . . . . . . . . . . . . . . . . . . . . . 4.5
4.4.5 15N Labeled Ammonia Solutions ......................... 4.6 4.4.4 Apparent Diffusion Coefficient of Ammonia in Porous Media ...... 4.5
5.0 Conclusions and Recommendations . . . . . . . . . . . . . . . . . . . . . . . . . . . . . . . . . . . 5.1
6.0 References . . . . . . . . . . . . . . . . . . . . . . . . . . . . . . . . . . . . . . . . . . . . . . . . . . . 6.1
vii

Figures
2.1 Pulsed Field Gradient (PFG) Experiment . . . . . . . . . . . . . . . . . . . . . . . . . . . . . . . 2.1
2.2 Signal Attenuation for Water (PFG experiment) . . . . . . . . . . . . . . . . . . . . . . . . . . . 3.1 1H NMR Spectrum of Ammonium Chloride Aqueous Solution . . . . . . . . . . . . . . . .
2.2
3.1
3.2 Effect of the Rate of Chemical Exchange on the Line Shape . . . . . . . . . . . . . . . . . . . 3.3 Radiofrequency Coil Constructed for Diffusion Experiments at UC Davis . . . . . . . . .
3.2
3.3
4.1 Diffusion of 14N in Aqueous Solution of Ammonium Chloride . . . . . . . . . . . . . . . . 4.2 14N Relaxation Times Versus pH in Aqueous Solution of Ammonium Chloride . . . . . 4.3 Ammonium Diffusion Coefficient Versus pH in Ammonium Chloride Aqueous
4.4 14N Diffusion Coefficient and Relative Viscosity Versus pH in Ammonium Sulfate Aqueous Solution
4.5 14N Diffusion Coefficients for Ammonium Chloride in Bulk Solution and in a Saturated Porous Medium . . . . . . . . . . . . . . . . . . . . . . . . . . . . . . . . . . . . . . . . .
4.2
4.3
Solution . . . . . . . . . . . . . . . . . . . . . . . . . . . . . . . . . . . . . . . . . . . . . . . . . . . . . 4.4
. . . . . . . . . . . . . . . . . . . . . . . . . . . . . . . . . . . . . . . . . . . . . . 4.5
4.6
Tables
3.1 NMR'Properties of 'H, 14-15N . . . . . . . . .. . . . . . . . . . . . . . . . . . . . . . . . . . . . . 3.1
4.1 pH and Relaxation Times for 15N Ammonium Chloride Solutions . . . . . . . . . . . . . . 4.7
... Vlll

1 .O Introduction
The flammability and toxicity of ammonia released from the nuclear waste tanks at Hanford have been the subject of several recent studies (e.g., Palmer et al. 1996; Peurmng et al. 1997).(d These releases may occur episodically, such as the buoyant plume releases occurring in various double-shell tanks (DSTs); gradually through the surface of the waste; or from the partially saturated saltcakes in the single-shell tanks during salt-well pumping.
Scientists at Pacific Northwest National Laboratory have recently set up a one-dimensional convection-diffusion model to capture the gradual transport of ammonia in the DSTs.(a) Using several measured parameters such as the concentration of ammonia in the dome space and within the sludge layer, the model can predict the rate of diffusion of ammonia within the nonconvective solids (sludge) layer. Recent results (Terrones et al. 1997) reveal that the predicted effective diffusion coefficient of ammonia within the sludge layer is comparable to the rate of diffusion of ammonia in pure water. However, this value is nearly 20 times higher than the expected value of the diffusion coefficient of ammonia in a brine solution to be based on the Stokes-Einstein equation.
Inputs to this model are the ammonia concentrations in the dome space and within the waste obtained from the retained gas sampler (RGS) measurements (Shekarriz et al. 1997). Among other problems in measuring the ammonia concentration, the rate at which the ammonia concentration within the RGS extractor volume reaches an equilibrium level has been recognized to be a possible source of difficulty (Shekarriz et al. 1997). Although the waste slurry is agitated in the extractor during the gas extraction process, the flow induced by the mixer could potentially be at a very low Reynolds number, resulting in segregated mixing regimes around the mixing propellers. As a result, the ammonia transport from the slurry would be diffusion-limited and could potentially produce a higher uncertainty in the reported data
Results of the local RGS measurements for the first five tanks sampled (AW-101, A-101, AN-105, AN-104, and AN-103)@) show significant variability within the nonconvective layers of each tank, larger than the predicted uncertainty in the measurements (Shekarriz et al. 1997). Whether such variabilities are real or are the artifacts of the measurements depends on the local solubility and diffusion coefficient of ammonia in the nonconvective layers. The solubility of ammonia in high-concentration salt solutions has been measured previously (Norton and Pederson 1995). However, given that diffusion is a crucial parameter quantifying transport, there are currently no experimental data available for ammonia difisivity in such high-ionic strength high- pH, and densely loaded sludges.
The nuclear magnetic resonance (NMR) experiments conducted at UC Davis have allowed the diffusion of ammonia in solution to be characterized over a wide range of conditions. In particular, the dependence of the diffusion coefficient upon pH, ammonia concentration, and solution viscosity was investigated. This report summarizes the results, which demonstrate
(a) Terrones G, BJ Palmer, and J Cuta. 1997. Ammonia Concentration Modeling in Tank 241-A W-101. Letter Report TWSFG97.25, Pacific Northwest National Laboratory, Richland, Washington. (b) Hanford waste tanks are designated with the prefix 241-. In this report the prefix is omitted, as it is in common usage.
1.1

feasibility for measuring the diffusion of ammonia under conditions similar to those within the tank high pH, low concentration of ammonia, and solutions within porous media.
Section 2 contains a description of the principles of operation of the NMR diffusion measurement technique. The particular technique used for ammonia diffusivity measurements are presented in Section 3 and the results in Section 4. Section 5 contains the conclusions drawn from this research and Section 6 the cited references.
8 1 I I I I I I I I
1.2
I 8 t 8

2.0 Nuclear Magnetic Resonance: Principle of Operation
The most common way to measure diffusion by NMR is to use magnetic field gradient pulses to encode and decode the NMR signal, or the so-called PFG (pulsed field gradient) method. In its simplest version, a PFG experiment consists of applying a pair of field gradient pulses of duration 6 separated by a time A, as depicted in Figure 2.1.
The time A is the time in which the spins are allowed to diffuse and is often referred to as the “diffusion time.” The NMR signal is irreversibly attenuated due to the random translational motion of the liquid molecules (self-diffusion) during the period A. This attenuation can be written as (Callaghan 1991):
where y is the gyromagnetic ratio of the nucleus, g is the amplitude of the gradient, 6 is the dura- tion of the gradient g, D is the diffusion coefficient, and A is the gradient pulse spacing. Thus the signal attenuation can be obtained by varying g, 6, or A.
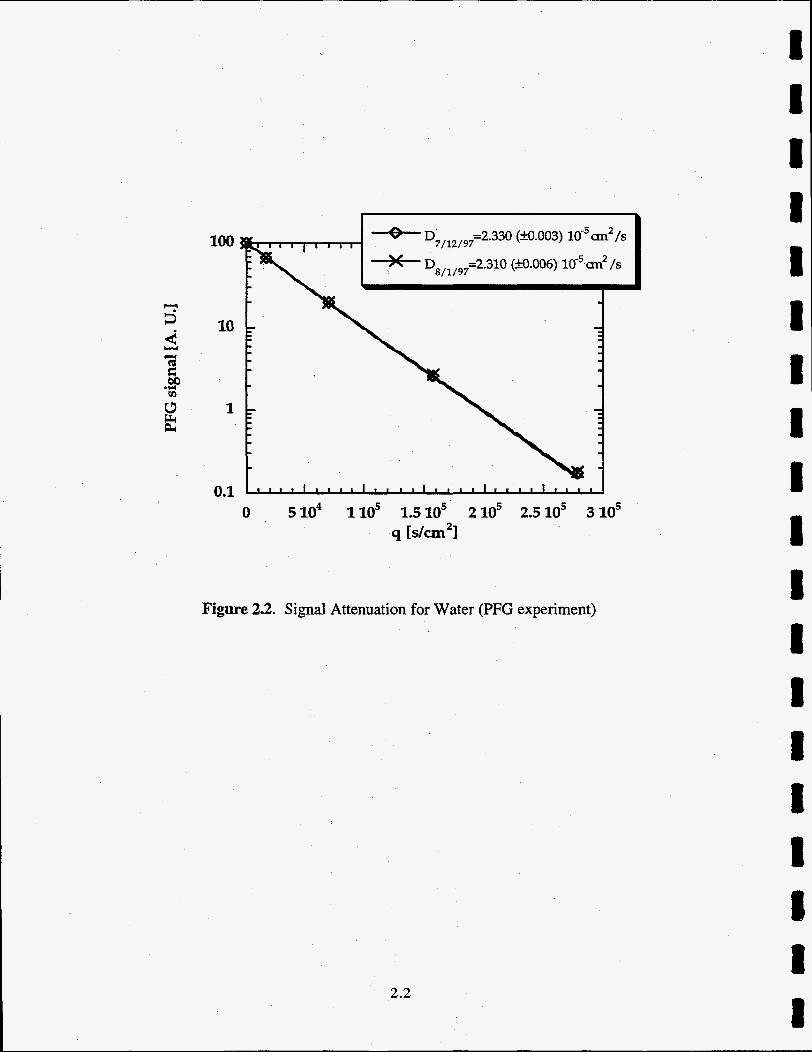
To verify the accuracy of the system in measuring the diffusion coefficient, two separate and independent measurements were performed. Figure 2.2 shows the NMR signal attenuation in a PFG experiment for pure water. These experiments were performed on the same sample within a 10-day interval and showed excellent reproducibility. The horizontal axis is the parameter q depicted in Equation (2.1). Note that the signal maintains its linearity over almost three decades on a log-log plot, which indicates that it obeys the exponential law presented in Equation (2. l), and the diffusion coefficient is constant throughout the whole range.
field gradient */-- pulses . . .* b + t i
4 b A “diffusion time”
time
Figure 2.1. Pulsed Field Gradient (PFG) Experiment
2.1
T 3 Y 4
100
10
1
0.1
* D8,1,97=2.310 (a.006) 10-5a2/s
Figure 2.2. Signal Attenuation for Water (PFG experiment)
2.2
I 1 I I I
I I I ! 8 1 I I 1
3.0 NMR in Aqueous Ammonia Solutions
3.1 1H Nucleus
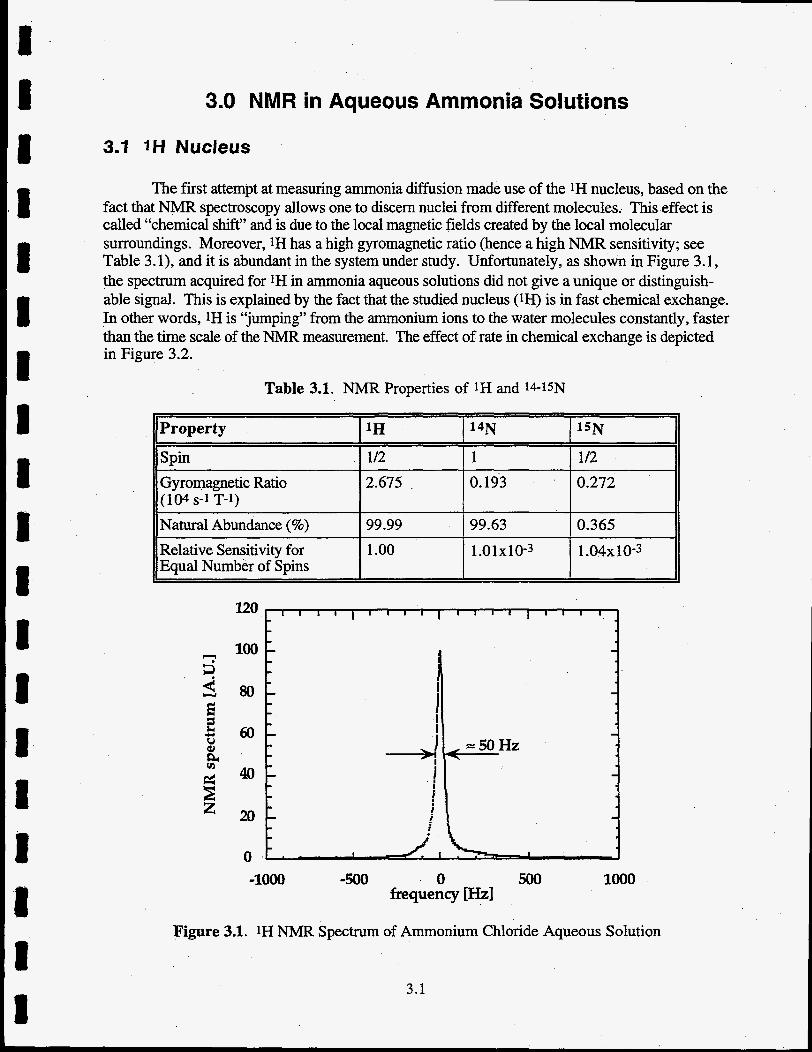
The first attempt at measuring ammonia diffusion made use of the 1H nucleus, based on the fact that NMR spectroscopy allows one to discern nuclei from different molecules. This effect is called “chemical shift” and is due to the local magnetic fields created by the local molecular surroundings. Moreover, 1H has a high gyromagnetic ratio (hence a high NMR sensitivity; see Table 3.1), and it is abundant in the system under study. Unfortunately, as shown in Figure 3.1, the spectrum acquired for 1H in ammonia aqueous solutions did not give a unique or distinguish- able signal. This is explained by the fact that the studied nucleus (1H) is in fast chemical exchange. In other words, 1H is ‘tjumping” from the ammonium ions to the water molecules constantly, faster than the time scale of the NMR measurement. The effect of rate in chemical exchange is depicted in Figure 3.2.
Table 3.1. NMR Properties of 1H and 14-15N
Property 1H 14N 5N
Spin 1/2 1 112
I 2-675 1 OJg3 I 0.272 Gyromagnetic Ratio (104 S-1 T-1) Natural Abundance (%) 99.99 99.63 0.365 Relative Sensitivity for 1 .oo 1 .o 1x10⁴ 1.04~ 10-3 Equal Number of Spins
0
Figure 3.1. 1H NMR Spectrum of Ammonium Chloride Aqueous Solution
3.1

Figure 3.2. Effect of the Rate of Chemical Exchange on the Line Shape
Several relatively recent techniques have been developed to investigate and characterize systems in fast exchange by NMR (Kniittel and Balaban 1991) but were not investigated for this report. Because of the problem of the chemical exchange rate, IH has been discarded as an NMR probe for the diffusion of ammonia in this study.
3.2 Nitrogen NMR
The only remaining possibility is to use nitrogen (14N or 15N) as the NMR probe for the study of ammonia solutions. One drawback of using these nuclei is that they have low gyro- magnetic ratios and thus generate a poor NMR signal-to-noise ratio. Different NMR characteristics of the relevant nuclei in this study are listed in Table 3.1. Nitrogen is rather an uncommon nucleus in NMR, and consequently a new radiofrequency coil needed to be designed and constructed for these experiments.
3.3 The Radiofrequency Coil
Different considerations must be given to constructing the specific transmitter-receiver radiofrequency coil for detecting nitrogen nuclei. It must meet all the hardware specifications to work at the 7 Tesla spectrometer of the NMR facility at UC Davis. These specifications are
All the parts must be made of non-magnetic material (e.g., plastic, copper, aluminum).
3.2

The components should fit into a 5 in. (12.7 cm) bore. The circuit must be impedance-matched at 50 a. The working resonances must be 21.7 MHz for 14N and 30.4 MHz for 15N. The coil must be optimized for the nature and geometry of the samples.
In this study, where sensitivity is our major concern, a solenoid shaped coil is the best choice (Hoult and Richards 1976). This geometry has been optimized to improve sensitivity, as suggested by Idziac and Haeberlen (1982). The coil constructed in the laboratory, as shown in Figure 3.3 (a), meets all the specifications cited above. Typical samples are shown in the picture and are 7-10 n L in volume (c). A second coil (b), tuned to work at the proton frequency of 300 MHz, was also constructed to help maintain the settings of the experiment @e., homogeneity of the main magnetic field, position of the sample).
Figure 3 3 . Image of the Radiofrequency Coil Constructed for Diffusion Experiments at UC Davis: a) 14-15N Coil, b) 1H Coil, and c) Representative Samples
3.3
4.0 Results and Discussion
4.1 Signal-to-Noise Ratio (SNR) Versus Ammonia Concentration
The upper limit of the ammonia concentration is governed by the solubility of the salt. For example, the maximum amount of ammonium sulfate that can be dissolved in water at 20°C is around 40 wt%, which corresponds to a solution of 7.4 M of ammonium ion (see, for example, CRC 1976). This value is about two orders of magnitude higher than the ammonia concentration found in the Hanford waste tanks (Shekarriz et al. 1997).
The lowest concentration limit is constrained by the signal-to-noise ratio ( S N R ) of the NMR experimental system. The S N R depends upon several factors such as the working field, nucleus, geometry of the coil, and NMR relaxation times. In practice, once the principal parameters are fixed by the experiment, the limits of the ammonia concentration can be determined easily from a single NMR scan. The S N R can be roughly formulated as shown:
S N R X CJNacq c I
(4.1)
were N, is the number of acquisitions and C is the concentration of ammonium ion in the solution. On the other hand, we know that quantitative NMR parameters can be extracted if the S N R is greater than or equal to 80. This is about half of what we have for a single scan on a 17 wt% ammonium chloride solution. Each acquisition requires between 20 and 300 seconds, and to extract the diffusion parameter at least four experiments are required. These considerations show that it would be difficult to work with concentrations lower than 50 p&J (0.1 wt% of salt). How- ever, this value is about 20 to 50 times the value measured in the Hanford tanks, so our method does allow measurements at realistic concentrations. Because the sensitivity of 14N and 15N are close, this discussion holds for both nuclei.
4.2 NMR Relaxation Times
The “life-time” of the NMR signal is characterized by two relaxation times: the spin-lattice relaxation time (TI) and the spin-spin relaxation time (T2). They always satisfy TI 2 T2 inequality and are generally about the same order of magnitude in bulk liquids. It is well known that the relaxation process can be greatly enhanced in presence of paramagnetic substances or if the fluid is confined in a porous medium (Callaghan 1991).
4.3 Limitations on Determination of Diffusion Coefficient
Several issues regarding hardware limitations in the PFG experiment merit some discus- sion. As shown in Equation (2.1), the attenuation of the signal depends upon the amplitude of the gradient, g, the duration of these gradients, 6, and the diffusion time, D. The strength of the gradients is limited by the power supplied to the coils. In standard imaging systems the practical
4.1

gradient ranges from 2 to 40 Gausskm. Our system is capable of going up to a maximum gradient of 30 Gausskm. The other major limitation is the duration of the PFG experiment or A + 26 (see Figure 2.1). This duration cannot be much longer than the relaxation times. A reasonable timing would be A = T2/2 and 6 = T2/4 (or A + 26 = T2). We can then substitute T, for A and 6 in Equation (2.1). Moreover, to obtain an accurate and reproducible value of D, we know that the attenuation of the signal has to be at least 112 pa in 1990). Thus the experimental limitation to determine the diffusion coefficient can be expressed by the following inequality:
-y2gax T', DI 16 2 2 e (4-2)
For diffusion coefficients of 2 x 10⁻⁵ cm%, the relaxation times T1 and T2 need to be 50 ms or larger for both nuclei 14N and 15N. This constraint determines the conditions under which we can and cannot measure diffusion, as discussed in the next section.
4.4 Self-Diffusion Coefficient of 14N Ammonia in Aqueous Solutions
The diffusion coefficient has been measured for different samples of ammonia solution. Representative data are shown in Figure 4.1 for a solution of 3.3 M of ammonium chloride with a pH of 5.16. The acquisition time was approximately eight minutes, and the attenuation of the signal is well described by Equation (2.1). The diffusion coefficient is found to be 2.15 (-+ 0.01) x 10-5 cm2/s.
Figure 4.1. Diffusion of 14N in Aqueous Solution of Ammonium Chloride
4.2

4.4.1 Effect of pH
A series of experiments was performed to study the dependence of relaxation times of 14N as a function of solution pH. In an aqueous solution of ammonium chloride, the ammonium concentration was maintained at approximately 3.3 M, while the pH was varied by adding small amounts of acid to lower it and ammonium hydroxide to raise it. In Figure 4.2 note that the relaxa- tion times strongly depend on the pH, especially for basic solutions (pH >7). Also note that on this figure the relaxation time plunges below 50 ms for pH >8.5. Thus it would not be possible to measure diffusion of ammonia solutions having a pH higher than 8.5, based on the detectibility arguments presented in the previous sections. This strong pH dependence of the relaxation times is probably due to the nature of the relaxation process, which is quadrupolar and very sensitive to the electronic environment of the molecules (Mason 1987).
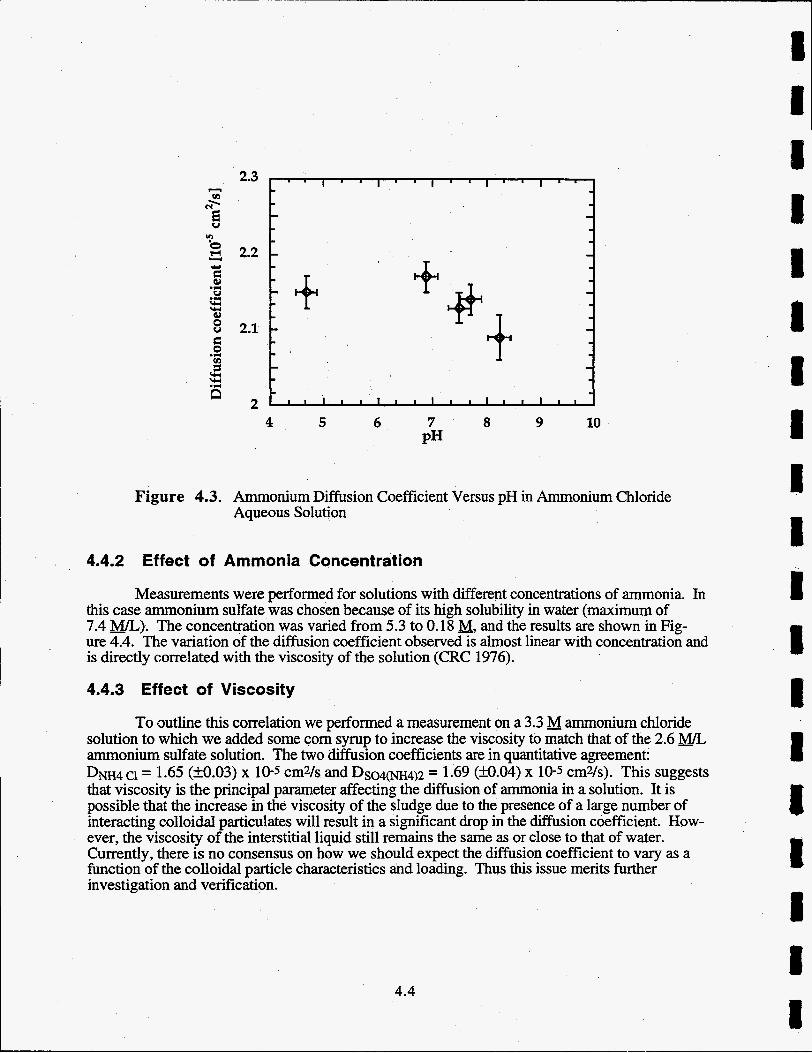
Figure 4.3 shows the effect of pH on the diffusion coefficient measured for ammonium chloride solutions. Although some variation is observed, the pH does not dramatically affect the diffusion in such solutions. The small differences (&%I), slightly larger than the experimental error, can be attributed to the slight differences in viscosity of the solutions to which we added acid or ammonium hydroxide.
c1 z u loo0 I ," 0
X
0 X
2 4 6 8 PH
10 12
Figure 4.2. 14N Relaxation Times Versus pH in Aqueous Solution of Ammonium Chloride
4.3
5 Y
2.3
2.2
2.1
2 4 5 6 7 8 9 10
PH
Figure 4.3. Ammonium Diffusion Coefficient Versus pH in Ammonium Chloride Aqueous Solution
4.4.2 Effect of Ammonia Concentration
Measurements were performed for solutions with different concentrations of ammonia. In this case ammonium sulfate was chosen because of its high solubility in water (maximum of 7.4 M/L). The concentration was varied from 5.3 to 0.18 M, and the results are shown in Fig- ure 4.4. The variation of the diffusion coefficient observed is almost linear with concentration and is directly correlated with the viscosity of the solution (CRC 1976).
4.4.3 Effect of Viscosity
solution to which we added some corn syrup to increase the viscosity to match that of the 2.6 _M/L ammonium sulfate solution. The two diffusion coefficients are in quantitative agreement: D N H ~ C ~ = 1.65 (kO.03) x 10-5 Cm% and D s o ~ ( N H ~ ) ~ = 1.69 (ko.04) x 10-5 cm2/s). This suggests that viscosity is the principal parameter affecting the diffusion of ammonia in a solution. It is possible that the increase in the viscosity of the sludge due to the presence of a large number of interacting colloidal particulates will result in a significant drop in the diffusion coefficient. How- ever, the viscosity of the interstitial liquid still remains the same as or close to that of water. Currently, there is no consensus on how we should expect the diffusion coefficient to vary as a function of the colloidal particle characteristics and loading. Thus this issue merits further investigation and verification.
To outline this correlation we performed a measurement on a 3.3 M ammonium chloride
4.4
I 1 I I I I II I 8

z s
- -)(- ,Diffusion coefficient
2 2
2
1.8
1.6
1.4
1.2
- -+ - - relative viscosity
2
1.8
1.6
1.4
1.2
1 0 1 2 3 4 5
Concentration [MA1 6
Figure 4.4. 14N Diffusion Coefficient and Relative Viscosity Versus pH in Ammonium Sulfate Aqueous Solution
4.4.4 Apparent Diffusion Coefficient of Ammonia in Porous Media
One set of experiments has been conducted in a porous medium to show feasibility of diffusion coefficient measurements using the current PFG NMR technique. The porous medium was composed of randomly packed PMMA beads (200 pm) saturated with a 3.3 M ammonium chloride solution (pH 4.67). As is seen in Figure 4.5, the attenuation of the NMR signal of the bulk solution is greater than that for the solution in the porous media. This will lead to an approxi- mately 30% smaller diffusion coefficient for the fluid in the porous medium. In fact, the diffusion time (D) is long enough to let a large portion of the molecules encounter the surface of the particles within the pores of porous media, causing an "observed" restricted or hindered diffusion. The corresponding diffusion coefficient is called the MWI apparent diffusion coefficient and is a .
function of D in the NMR experiment. This particular property of the PFG measurement has been used to characterize the structural properties of porous system (Callaghan 1991; Chui et al. 1995).
4.4.5 15N Labeled Ammonia Solutions
The 15N isotope has become an increasingly accessible nucleus for NMR related work. Enriched salts such as ammonium chloride or ammonium sulfate and even ammonium hydroxide solutions have become commercially available. Although 1SN labeled products are relatively expensive (around $100 per gram or mL), the 15N nucleus has a spin 1/2 and presents several advantages from the spectroscopy point of view (Mason 1987). This nucleus has a higher
4.5

100
T 3 4 Y
2 k
10 0 2104 410' $10' 810' 1 lo5
q b/cm 1
Figure 4.5. 14N Diffusion Coefficients for Ammonium Chloride in Bulk Solution and in a Saturated Porous Medium
gyromagnetic ratio, leading to a higher sensitivity to diffusion measurements (see Table 3.1 and Equation 2.1). Also, relaxation is caused by dipolar interactions instead of quadrupolar for 14N, leading to longer relaxation times. Table 4.1 shows the relaxation times of 1SN labeled ammonium chloride solutions with different pH.
Because the relaxation times are less sensitive to the pH of the solution, we should be able to measure the diffusion coefficient for solutions up to pH 9.5 (relaxation times over 50 ms). The diffusion coefficient measured for the solution of 3.3 M/L ammonium concentration, pH 5.3, is of 2.20 (M.01) x 10-5 cm%, which is in excellent agreement with the 2.15 (M.01) x 10-5 cmVs value measured for standard ammonium chloride (see Figure 4.1).
Table 4.1. PH and Relaxation Times for 15N Ammonium Chloride Solutions
4.6
i I I I I I I
I E t I I i

5.0 Conclusions and Recommendations
Diffusion coefficients of ammonium aqueous solutions have been successfully determined by PFG NMR methods in bulk solutions and for confined solutions within porous media. Feasi- bility for relatively low concentrations (50 mMJL) and high pH (9.5) have been demonstrated. The diffusion coefficients measured are close to those found in pure water (== 2 x 10⁻⁵ cm2/s). There is no appreciable dependence of the diffusion coefficient upon concentration or pH within the range of conditions studied. However, as expected, it has been found that the diffusion coefficient is correlated to the viscosity of the solution and the porosity of the porous medium.
These attractive results will lead to further characterization of the rate of diffusion in model samples that closely resemble the conditions in the underground waste storage tanks at Hanford. Future experiments are recommended in which two different levels of complexity are added 1) varying the viscosity of the medium by adding colloidal particulates and 2) imposing a temperature gradient in the medium to examine the effect of thermal gradient on the ammonia difisivity. Both these variables will create a more realistic model of the Hanford tank waste conditions, especially in the nonconvective layer.
Other things to look for are 1) diffusion of NI&+ Cl- in high concentration of NaCl solution and 2) diffusion of m+ Cl- in high concentration of NaOH solution, if possible. It is expected that these two salts will have different effects on the solution viscosity and, as a result, might give rise to different values for diffusion coefficients.
5.1

6.0 References
Bain AD. 1990. “The choice of parameters in an NMR experiment. Application to the inversion- recovery T1 method.” J. Magn. Reson., 89:153-160.
Callaghan PT. 199 1. Principles of Nuclear Magnetic Resonance Microscopy, second edition. Oxford University Press, London.
Chui MM, RJ Phillips, and MJ McCarthy. 1995. “Measurement of the porous microstructure of hydrogels by nuclear magnetic resonance.” J. Coll. Int. Sci., 174(2):336-344.
CRC. 1976. Handbook of Chemistry and Physics, 57th edition. CRC Press, Boca Raton, Florida.
Hoult DI and RE Richards. 1976. “The signal-to-noise-ratio of a nuclear magnetic resonance experiment.” J. Magn. Reson., 24:7 1-85.
Idziak S and U Haeberlen. 1982. “Design and Construction of a High Homogeneity R F Coil for Solid-state Multipulse NMR.” J. Magn. Reson., 50:28 1-288.
Knuttel A and RS Balaban. 1991. “A Novel Approach for the Determination of Fast Exchange Rates.” J. M a p . Reson., 95:309-3 19.
Mason J ed. 1987. Multinuclear NMR. Plenum Press, New York.
Norton JD and LR Pederson. 1995. Solubilities of Gases in Simulated Tank 241 -SY-I 01 Wastes. PNL- 10785, Pacific Northwest Laboratory, Richland, Washington.
Palmer BJ, CM Anderson, G Chen, JM Cuta, TA Ferryman, and G Terrones. 1996. Evaluation of the Potential for Significant Ammonia Releases from Hanford Waste Tanks. PNNL-11237, Pacific Northwest National Laboratory, Richland, Washington.
Peurmng LM, SM Caley, and PA Gauglitz. 1997. Gas Release During Salt-Well Pumping: Model Predictions and Laboratory Validation Studies for SoJuble and Insoluble Gases. PNNL- 1 162 1, Pacific Northwest National Laboratory, Richland, Washington.
Shekarriz A, DR Rector, MA Chieda, M White, and JM Bates. 1997. Retained Gas Sampler Measurement Results for Hanford Waste Tanks 241 -AW-101, A-101, AN-105, AN-104, and AN-103. PNNL-11450 Rev. 1, Pacific Northwest National Laboratory, Richland, Washington.
Terrones G, BJ Palmer, and J Cuta. 1997. Ammonia Concentration Modeling Based on RGS Data. PNNL-11674, Pacific Northwest National Laboratory, Richland, Washington.
6.1
I I E I 1 U I I li
No. of Copies
Offsite
2 Ofice of Scientific and Technical Information
Onsite
1 DOE Richland Operations Office
CA Groendyke
PNNL-11678 Rev. 1 UC-2030
Distribution
s7-54
4 .Duke Engineering Services Hanford
RE Bauer (3) GD Johnson
S7-14 S7-15
No. of Copies
3 1 Paci.fic Northwest National. Laboratow
JM Bates (5) S Q Bennett JW Brothers (5) BC Bunker JA Fort SD Colson BJ Palmer CW Stewart G Terrones LA Mahoney DR Rector LR Pederson PA Gauglitz A Shekarriz (5) Information Release (5)
Distr. 1
K7- 15 K7-90 K9-20 K8-93 K7-15 K8-88 K7- 15 K7-15 K7- 15 K7- 15 K7- 15 K2-44 P7-41 K7-15 K1-06