nuclear fusion & solar activity. the sun the sun is a very dynamic (active) place the sun is a...
TRANSCRIPT

Nuclear Fusion & Solar Activity Nuclear Fusion & Solar Activity

The SunThe Sun
The sun is a very dynamic (active) The sun is a very dynamic (active) placeplace
Nuclear Fusion in the core of the sun Nuclear Fusion in the core of the sun produces huge amounts of Energyproduces huge amounts of Energy This Heat Energy rises to the surface This Heat Energy rises to the surface
because of convection (think density)because of convection (think density) As hot material reaches the surface of As hot material reaches the surface of
the sun gasses boil and erupt on surfacethe sun gasses boil and erupt on surface

Sun SpotsSun Spots
The Sun’s magnetic field slows The Sun’s magnetic field slows down the “boiling” on the down the “boiling” on the photosphere (surface) of the sunphotosphere (surface) of the sun This causes areas on the sun to be This causes areas on the sun to be
slightly cooler than the surrounding slightly cooler than the surrounding areas.areas.
These cooler spots are SunspotsThese cooler spots are Sunspots SunspotsSunspots = = cool dark regions on the cool dark regions on the
sun sun

Sunspots, Galileo Found Sunspots, Galileo Found ThemThem
Before the invention of the telescope, the Sun was thought Before the invention of the telescope, the Sun was thought to be a perfect disk. However as soon as telescopes to be a perfect disk. However as soon as telescopes became available, astronomers turned them to the Sun. became available, astronomers turned them to the Sun.
They discovered two things…Sunspots and blindness. They discovered two things…Sunspots and blindness. Not Galileo though. He observed only at sunset and sunrise Not Galileo though. He observed only at sunset and sunrise
and by projecting the light onto a screen rather than trying and by projecting the light onto a screen rather than trying to look through the telescope itself. He drew his results to look through the telescope itself. He drew his results very carefully: very carefully:
Here’s one of his drawings from 1612.Here’s one of his drawings from 1612.
SunspotsSunspots

SunspotsSunspots Sunspots and their location on the Sunspots and their location on the
sun move in a cycle of low to high sun move in a cycle of low to high activity.activity.

Sunspot CyclesSunspot Cycles The Number of sunspots changes from The Number of sunspots changes from
year to year.year to year. How many in Jan 2001?How many in Jan 2001? How many in 2009?How many in 2009?
Time (Year)

►The number of The number of sunspots increases sunspots increases and decreases in and decreases in cycles that last from cycles that last from 6-17 years 6-17 years (averaging 11 (averaging 11 years).years).
► Solar flares Solar flares accompany accompany increases in sunspot increases in sunspot activity.activity.
►What’s the max What’s the max we’ve observed?we’ve observed?____________


Other Activity on the SunOther Activity on the Sun
Solar FlaresSolar Flares = = Giant storms on the Giant storms on the surface of the sunsurface of the sun
Up to 5,000,000 Up to 5,000,000 °C °C (9,000,032 °F)(9,000,032 °F)
They send out They send out streams of charged streams of charged particles from the particles from the sun.sun.

Solar FlaresSolar Flares Solar Flares can reap havoc on Earth!Solar Flares can reap havoc on Earth! As emissions from the sun encounter Earth, As emissions from the sun encounter Earth,
they can ignite geomagnetic storms. they can ignite geomagnetic storms. These geomagnetic storms can cause:These geomagnetic storms can cause:
electrical power outageselectrical power outages damage to communication satellitesdamage to communication satellites radio communications disturbance radio communications disturbance

Increased solar emissions can also Increased solar emissions can also lead to a higher frequency of auroras lead to a higher frequency of auroras aka the Northern Lightsaka the Northern Lights
clip
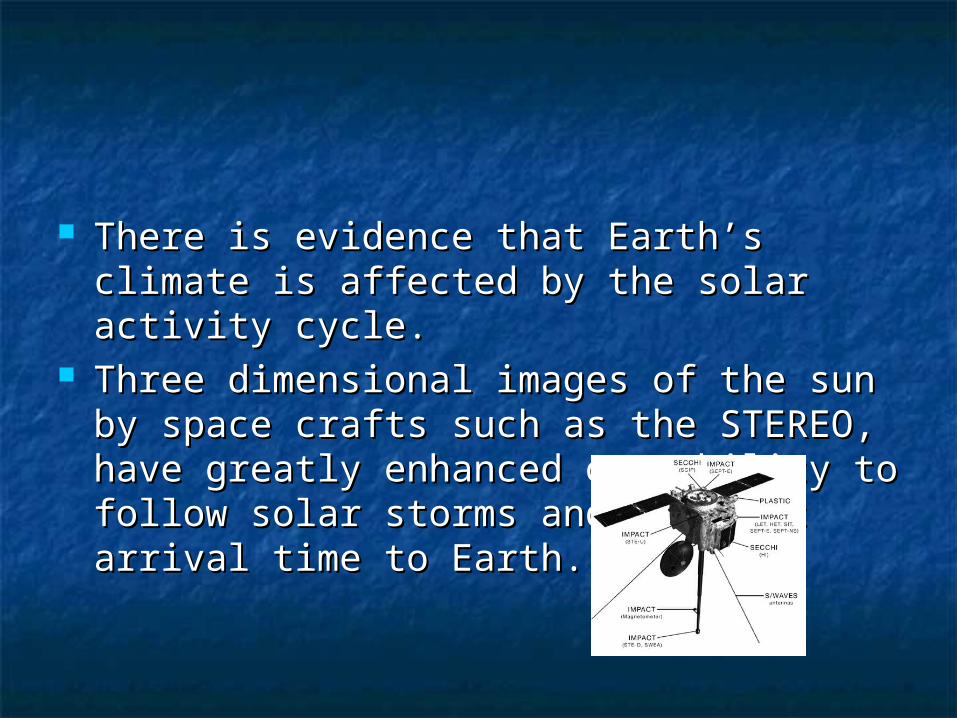
There is evidence that Earth’s climate is There is evidence that Earth’s climate is affected by the solar activity cycle.affected by the solar activity cycle.
Three dimensional images of the sun by Three dimensional images of the sun by space crafts such as the STEREO, have space crafts such as the STEREO, have greatly enhanced our ability to follow solar greatly enhanced our ability to follow solar storms and forecast arrival time to Earth.storms and forecast arrival time to Earth.

Nuclear FusionNuclear Fusion Nuclear FusionNuclear Fusion is why is why
the sun is sizzlin’ hot.”the sun is sizzlin’ hot.”
The Sun is about 70% The Sun is about 70% hydrogen and 28% and 28% helium and 2% metals.helium and 2% metals.
This changes slowly over This changes slowly over time as the Sun converts time as the Sun converts hydrogen to helium in its hydrogen to helium in its core. core.
Each second about 700,000,000 tons of hydrogen are converted to about 695,000,000 tons of helium
Random fact

FusionFusion•Nuclear Fusion = The process by which 2 or more nuclei (Hydrogen) join together or fuse.
This takes a huge amount of Energy because same charged nuclei repel each other
•When they do this a larger more massive nucleus is made (Helium).
•During this process Energy is produced in the form of light and heat.
Fusion, FYIFusion, FYI
Fusion (the combining of the nuclei Fusion (the combining of the nuclei of elements) is how all elements of elements) is how all elements found in the Universe are created.found in the Universe are created.
If it exists, it’s because of fusion.If it exists, it’s because of fusion. Humans can do this somewhat Humans can do this somewhat
unsuccessfully and for short amounts unsuccessfully and for short amounts of timeof time

The Solar WindThe Solar Wind
In addition to heat and light, the Sun In addition to heat and light, the Sun also emits a low density stream of also emits a low density stream of charged particles (mostly electrons charged particles (mostly electrons and protons) known as the and protons) known as the solar solar windwind which propagates throughout which propagates throughout the solar system at about 450 the solar system at about 450 km/sec (approx. 1 million mph)km/sec (approx. 1 million mph)

The Solar WindThe Solar Wind
The solar wind moves outward from The solar wind moves outward from the sun in a pinwheel shaped spiral the sun in a pinwheel shaped spiral pattern in a more or less steady flow. pattern in a more or less steady flow.

The Solar WindThe Solar Wind Recent data from the spacecraft Ulysses Recent data from the spacecraft Ulysses
show that during the minimum of the solar show that during the minimum of the solar cycle the solar wind emanating from the cycle the solar wind emanating from the polar regions flows at nearly double the rate, polar regions flows at nearly double the rate, 750 kilometers per second, than it does at 750 kilometers per second, than it does at lower latitudes. The composition of the solar lower latitudes. The composition of the solar wind also appears to differ in the polar wind also appears to differ in the polar regions. During the solar maximum, however, regions. During the solar maximum, however, the solar wind moves at an intermediate the solar wind moves at an intermediate speed. speed.

The Solar WindThe Solar Wind
Further study of the solar wind will Further study of the solar wind will be done by the recently launched be done by the recently launched Wind, ACE and SOHO spacecraft from Wind, ACE and SOHO spacecraft from the dynamically stable vantage point the dynamically stable vantage point directly between the Earth and the directly between the Earth and the Sun about 1.6 million km from Earth. Sun about 1.6 million km from Earth.
The solar wind has large effects on The solar wind has large effects on the tails of comets and even has the tails of comets and even has measurable effects on the measurable effects on the trajectories of spacecraft. trajectories of spacecraft.

E5.2e Explain how the Hertzsprung-Russell (H-R) diagram can be used to deduce other E5.2e Explain how the Hertzsprung-Russell (H-R) diagram can be used to deduce other parameters (distance). parameters (distance).
Clarification: Brightness and color can be determined given the location of a star on the Clarification: Brightness and color can be determined given the location of a star on the H-R diagramH-R diagram
E5.2f Explain how you can infer the temperature, life span, and mass of a star from its E5.2f Explain how you can infer the temperature, life span, and mass of a star from its color. Use the H-R diagram to explain the life cycles of stars. Clarification: The color. Use the H-R diagram to explain the life cycles of stars. Clarification: The Hertzsprung-Russell diagram illustrates the relationship between the absolute magnitude Hertzsprung-Russell diagram illustrates the relationship between the absolute magnitude and the surface temperature of stars. As stars evolve, their position on the Hertzsprung-and the surface temperature of stars. As stars evolve, their position on the Hertzsprung-Russell diagram moves. The temperature of a star is directly related to the color of a Russell diagram moves. The temperature of a star is directly related to the color of a star.star.
E5.2g Explain how the balance between fusion and gravity controls the evolution of a E5.2g Explain how the balance between fusion and gravity controls the evolution of a star (equilibriumstar (equilibrium
E5.2h Compare the evolution paths of low, moderate and high mass stars using the H-R E5.2h Compare the evolution paths of low, moderate and high mass stars using the H-R diagram.diagram.
after a solar storm emission.after a solar storm emission.

auroras auroras Hertzsprung-Russell (H-R) diagram Hertzsprung-Russell (H-R) diagram life cycle of starslife cycle of stars nuclear fusion nuclear fusion nuclear reactions nuclear reactions power disturbancespower disturbances radio and satellite communicationradio and satellite communication release of energyrelease of energy solar energysolar energy solar flaressolar flares solar windsolar wind source of chemical elementssource of chemical elements spontaneous nuclear reactionspontaneous nuclear reaction star compositionstar composition star destructionstar destruction star equilibriumstar equilibrium star formationstar formation star systemstar system star temperaturestar temperature star sizestar size star typesstar types stellar energystellar energy sunspot cyclesunspot cycle stellar evolutionstellar evolution

iii. Enrichmentiii. Enrichment CE: E5.2ACE: E5.2A Analyze the solar activity from the past 100 years and predict the impact Analyze the solar activity from the past 100 years and predict the impact
over the next 50 years if the pattern were to proceed at the same rate. over the next 50 years if the pattern were to proceed at the same rate. Explore the data for patterns in several ways such as segmenting time Explore the data for patterns in several ways such as segmenting time frames and averaging the number of peaks.frames and averaging the number of peaks.
iv. Generaliv. General CE: E5.2ACE: E5.2A Construct a table of sunspot activity and plot the points in order to make Construct a table of sunspot activity and plot the points in order to make
predictions about the solar cycle and possibility of disturbances to Earth’s predictions about the solar cycle and possibility of disturbances to Earth’s system. Look for patterns in the data to determine how predictable sun system. Look for patterns in the data to determine how predictable sun spot activity is.spot activity is.
v. Interventionv. Intervention CE: E5.2ACE: E5.2A Using records of sunspot activity calculate the average solar cycle length Using records of sunspot activity calculate the average solar cycle length
and use that data to predict future solar maximums. Calculate and graph and use that data to predict future solar maximums. Calculate and graph the number of years between the peaks and valleys.the number of years between the peaks and valleys.

Real World ContextReal World Context:: The origin of elements involves the formation of Hydrogen and Helium in the early The origin of elements involves the formation of Hydrogen and Helium in the early
universe followed by the formation of heavier elements.universe followed by the formation of heavier elements. ExclusionsExclusions Details of nuclear fusionDetails of nuclear fusion Reaction rates in starsReaction rates in stars Instruments, Measurement, and RepresentationsInstruments, Measurement, and Representations Telescopes and binoculars to see stars, nebulae, and galaxiesTelescopes and binoculars to see stars, nebulae, and galaxies Computer simulations of processes in starsComputer simulations of processes in stars Images taken by large or space based telescopesImages taken by large or space based telescopes Spectra of stars and galaxiesSpectra of stars and galaxies Graphs that depict the relationships of astronomic variables (e.g., brightness versus Graphs that depict the relationships of astronomic variables (e.g., brightness versus
temperature, distance to galaxies versus redshift)temperature, distance to galaxies versus redshift) Diagrams and Models showing a cross-section of the Sun and the evolution of starsDiagrams and Models showing a cross-section of the Sun and the evolution of stars
If Time:If Time: Investigate the risk of radiation exposure during air travelInvestigate the risk of radiation exposure during air travel