ntp.niehs.nih.govntp.niehs.nih.gov/iccvam/docs/endo_docs/erta-tmer/... · iccvam bg1luc er ta...
TRANSCRIPT

Appendix C – Background Review Document
M-1
Annex M
ICCVAM/NICEATM BG1Luc4E2 ER TA – Plate Redesign and the Compilation of an Historical Database

ICCVAM BG1Luc ER TA Evaluation Report
M-2
This page intentionally left blank
Appendix C – Background Review Document
M-3
Plate Redesign and the Compilation of an Historical Database
Prepared by The National Toxicology Program (NTP) Interagency Center
for the Evaluation of Alternative Toxicological Methods (NICEATM)
National Institute of Environmental Health Sciences (NIEHS) P.O. Box 12233
Mail Drop: EC-17 Research Triangle Park, NC, U.S.A. 27709
17 April 2008

ICCVAM BG1Luc ER TA Evaluation Report
M-4
This page intentionally left blank

Appendix C – Background Review Document
M-5
TABLE OF CONTENTS
LIST OF APPENDICES ................................................................................................................. M-7
LIST OF FIGURES ......................................................................................................................... M-8
LIST OF TABLES ......................................................................................................................... M-10
LIST OF ACRONYMS AND ABBREVIATIONS ..................................................................... M-13
PREFACE ....................................................................................................................................... M-14
EXECUTIVE SUMMARY ........................................................................................................... M-15
1.0 Introduction ....................................................................................................................... M-19
1.1 Overview of BG1LUC4E2 ER TA Assay ............................................................. M-20
2.0 Phase I Testing of Agonist Reference Standards and Controls at XDS ....................... M-22
2.1 The Revised Agonist Range Finder Plate Design .................................................. M-22
2.2 The Revised Agonist Comprehensive Testing Plate Design ................................. M-23
2.3 Evaluation of Historical Control Intralaboratory Reproducibility at XDS ............ M-26
2.3.1 Coefficients of Variation .......................................................................... M-26
2.3.2 Linear Regressions .................................................................................... M-26
2.3.3 Analysis of Variance ................................................................................. M-29
3.0 Phase I Testing of Agonist Reference Standard and Controls at ECVAM ................. M-30
3.1 Evaluation of Intralaboratory Reproducibility at ECVAM .................................... M-32
3.1.1 Coefficients of Variation .......................................................................... M-32
3.1.2 Linear Regressions .................................................................................... M-32
3.1.3 Analysis of Variance ................................................................................. M-35
4.0 Phase I Testing of Agonist Reference Standards and Controls at Hiyoshi .................. M-37
4.1 Evaluation of Intralaboratory Reproducibility at Hiyoshi ..................................... M-39
4.1.1 Coefficients of Variation .......................................................................... M-39
4.1.2 Linear Regressions .................................................................................... M-39
5.0 Phase I Agonist Interlaboratory Reproducibility .......................................................... M-43
5.1 DMSO Control ....................................................................................................... M-43
5.2 E2 Maximum Fold-Induction ................................................................................ M-45
5.3 E2 EC50 .................................................................................................................. M-47
5.4 Methoxychlor Weak Positive Control ................................................................... M-49
5.5 Variability of Agonist Reference Standard and Controls ...................................... M-51
5.6 Historical Database for Phase IIa Agonist Testing ................................................ M-52
6.0 Phase I Testing of Antagonist Reference Standard and Controls at XDS ................... M-53
6.1 The Revised Antagonist Range Finder Plate Design ............................................. M-53

ICCVAM BG1Luc ER TA Evaluation Report
M-6
6.2 The Revised Antagonist Comprehensive Testing Plate Design ............................. M-55
6.3 Evaluation of Intralaboratory Reproducibility at XDS .......................................... M-58
6.3.1 Coefficients of Variation .......................................................................... M-58
6.3.2 Linear Regressions .................................................................................... M-59
6.3.3 Analysis of Variance ................................................................................. M-62
7.0 Phase I Testing of Antagonist Reference Standard and Controls at ECVAM ......................................................................................................................... M-63
7.1 Evaluation of Intralaboratory Reproducibility at ECVAM .................................... M-65
7.1.1 Coefficients of Variation .......................................................................... M-65
7.1.2 Linear Regression ..................................................................................... M-65
7.1.3 Analysis of Variance ................................................................................. M-69
8.0 Phase I Testing of Antagonist Reference Standard and Controls at Hiyoshi ........................................................................................................................... M-70
8.1 Evaluation of Intralaboratory Reproducibility at Hiyoshi ..................................... M-72
8.1.1 Coefficients of Variation .......................................................................... M-72
8.1.2 Linear Regressions .................................................................................... M-72
9.0 Phase I Antagonist Interlaboratory Reproducibility ..................................................... M-76
9.1 DMSO Control ....................................................................................................... M-76
9.2 Ral\E2 Maximum Fold-Reduction ......................................................................... M-78
9.3 Ral\E2 IC50 ............................................................................................................. M-80
9.4 E2 Control .............................................................................................................. M-82
9.5 Flavone\E2 Weak Positive Control ........................................................................ M-84
9.6 Variability of Antagonist Reference Standard and Controls ................................. M-86
9.7 Historical Database for Phase IIa Antagonist Testing ........................................... M-87
10.0 Testing of Visual Observation Cell Viability Method at ECVAM and Hiyoshi ........................................................................................................................ M-89
11.0 Summary ............................................................................................................................ M-90
12.0 References .......................................................................................................................... M-91

Appendix C – Background Review Document
M-7
LIST OF APPENDICES
Appendix A Phase I Experiments Conducted to Establish Historical Databases .............................................................................................................. M-93
Appendix B Conduct and Analysis of Edging Effects Experiments ................................... M-107
Appendix C BG1LUC4E2 ER TA TA Agonist Protocol 18 April 2007 ............................. M-129
Appendix D BG1LUC4E2 ER TA TA Antagonist Protocol 18 April 2007 ........................ M-163
Appendix E BG1LUC4E2 ER TA TA Agonist Protocol 11 June 2007 .............................. M-203
Appendix F BG1LUC4E2 ER TA TA Antagonist Protocol 11 June 2007 ......................... M-237
Appendix G BG1LUC4E2 ER TA TA Agonist Protocol 02 August 2007 .......................... M-275
Appendix H BG1LUC4E2 ER TA TA Antagonist Protocol 02 August 2007 ..................... M-307
Appendix I BG1LUC4E2 ER TA TA Phase I Protocol Amendments .............................. M-343

ICCVAM BG1Luc ER TA Evaluation Report
M-8
LIST OF FIGURES
Figure 1-1 pGudLuc7.ERE Plasmid ........................................................................................ M-21
Figure 2-1 Revised Agonist Range Finder E2 Reference Standard ......................................... M-23
Figure 2-2 E2 Maximum Fold-Induction Values for Revised Agonist Range Finder Plates ............................................................................................... M-23
Figure 2-3 XDS Agonist Historical Database: Individual Experiments .................................. M-25
Figure 2-4 XDS Agonist Historical Database: Averaged Experiments ................................... M-25
Figure 2-5 Linear Regression of Agonist DMSO Control at XDS .......................................... M-27
Figure 2-6 Linear Regression of E2 Maximum Fold-Induction at XDS ................................. M-28
Figure 2-7 Linear Regression of E2 EC50 Values at XDS ....................................................... M-28
Figure 2-8 Linear Regression of the Methoxychlor Weak Positive Control at XDS ................................................................................................................... M-29
Figure 3-1 ECVAM Agonist Historical Database: Individual Experiments ........................... M-31
Figure 3-2 ECVAM Agonist Historical Database: Averaged Experiments ............................ M-31
Figure 3-3 Linear Regression of DMSO Controls at ECVAM ............................................... M-33
Figure 3-4 Linear Regression of E2 Maximum Fold-Induction at ECVAM ........................... M-34
Figure 3-5 Linear Regression of E2 EC50 Values at ECVAM ................................................. M-34
Figure 3-6 Linear Regression of the Methoxychlor Weak Positive Control at ECVAM ............................................................................................................. M-35
Figure 4-1 Hiyoshi Agonist Historical Database: Individual Experiments ............................. M-38
Figure 4-2 Hiyoshi Agonist Historical Database: Averaged Experiments .............................. M-38
Figure 4-3 Linear Regression of Agonist DMSO Controls at Hiyoshi .................................... M-40
Figure 4-4 Linear Regression of E2 Maximum Fold-Induction at Hiyoshi ............................ M-41
Figure 4-5 Linear Regression of E2 EC50 Values at Hiyoshi .................................................. M-41
Figure 4-6 Linear Regression of the Methoxychlor Weak Positive Control at Hiyoshi ............................................................................................................... M-42
Figure 5-1 Comparison Figure of the Agonist Historical Database ........................................ M-43
Figure 5-2 DMSO Control Scatter Plots .................................................................................. M-44
Figure 5-3 E2 Maximum Fold-Induction Scatter Plots ........................................................... M-46
Figure 5-4 E2 EC50 Scatter Plots ............................................................................................. M-48
Figure 5-5 Methoxychlor Weak Positive Control Scatter Plots .............................................. M-50
Figure 6-1 Revised Antagonist Range Finder Ral\E2 Reference Standard ............................. M-55
Figure 6-2 Ral\E2 Maximum Fold-Reduction Values for the Revised Antagonist Range Finder Plates ............................................................................. M-55
Figure 6-3 XDS Antagonist Historical Database: Individual Experiments ............................. M-57
Figure 6-4 XDS Antagonist Historical Database: Averaged Experiments .............................. M-58

Appendix C – Background Review Document
M-9
Figure 6-5 Linear Regression of Antagonist DSMO Controls at XDS ................................... M-60
Figure 6-6 Linear Regression of Ral\E2 Maximum Fold-Reduction at XDS ......................... M-60
Figure 6-7 Linear Regression of Ral\E2 IC50 at XDS ............................................................. M-61
Figure 6-8 Linear Regression of the E2 Control at XDS ......................................................... M-61
Figure 6-9 Linear Regression of the Flavone\E2 Weak Positive Control at XDS ................................................................................................................... M-62
Figure 7-1 ECVAM Antagonist Historical Database: Individual Experiments ...................... M-64
Figure 7-2 ECVAM Antagonist Historical Database: Averaged Experiments ....................... M-64
Figure 7-3 Linear Regression of Antagonist DMSO Controls at ECVAM ............................. M-66
Figure 7-4 Linear Regression of Ral\E2 Maximum Fold-Reduction at ECVAM ................................................................................................................. M-67
Figure 7-5 Linear Regression of Ral\E2 IC50 at ECVAM ....................................................... M-67
Figure 7-6 Linear Regression of the E2 Control at ECVAM .................................................. M-68
Figure 7-7 Linear Regression of the Flavone\E2 Weak Positive Control at ECVAM ................................................................................................................. M-68
Figure 8-1 Hiyoshi Antagonist Historical Database: Individual Experiments ........................ M-71
Figure 8-2 Hiyoshi Antagonist Historical Database: Averaged Experiments ......................... M-71
Figure 8-3 Linear Regression of DMSO Control at Hiyoshi ................................................... M-73
Figure 8-4 Linear Regression of Ral\E2 Maximum Fold-Reduction at Hiyoshi ................................................................................................................... M-74
Figure 8-5 Linear Regression of Ral\E2 IC50 at Hiyoshi ......................................................... M-74
Figure 8-6 Linear Regression of E2 Control at Hiyoshi .......................................................... M-75
Figure 8-7 Linear Regression of Flavone\E2 Weak Positive Control Values at Hiyoshi ................................................................................................................... M-75
Figure 9-1 Comparison Figure of the Antagonist Historical Database ................................... M-76
Figure 9-2 Antagonist DMSO Control Scatter Plots ............................................................... M-77
Figure 9-3 Ral\E2 Maximum Fold-Reduction Scatter Plots .................................................... M-79
Figure 9-4 Ral\E2 IC50 Scatter Plots ........................................................................................ M-81
Figure 9-5 E2 Control Scatter Plots ......................................................................................... M-83
Figure 9-6 Flavone\E2 Weak Positive Control Scatter Plots ................................................... M-84

ICCVAM BG1Luc ER TA Evaluation Report
M-10
LIST OF TABLES
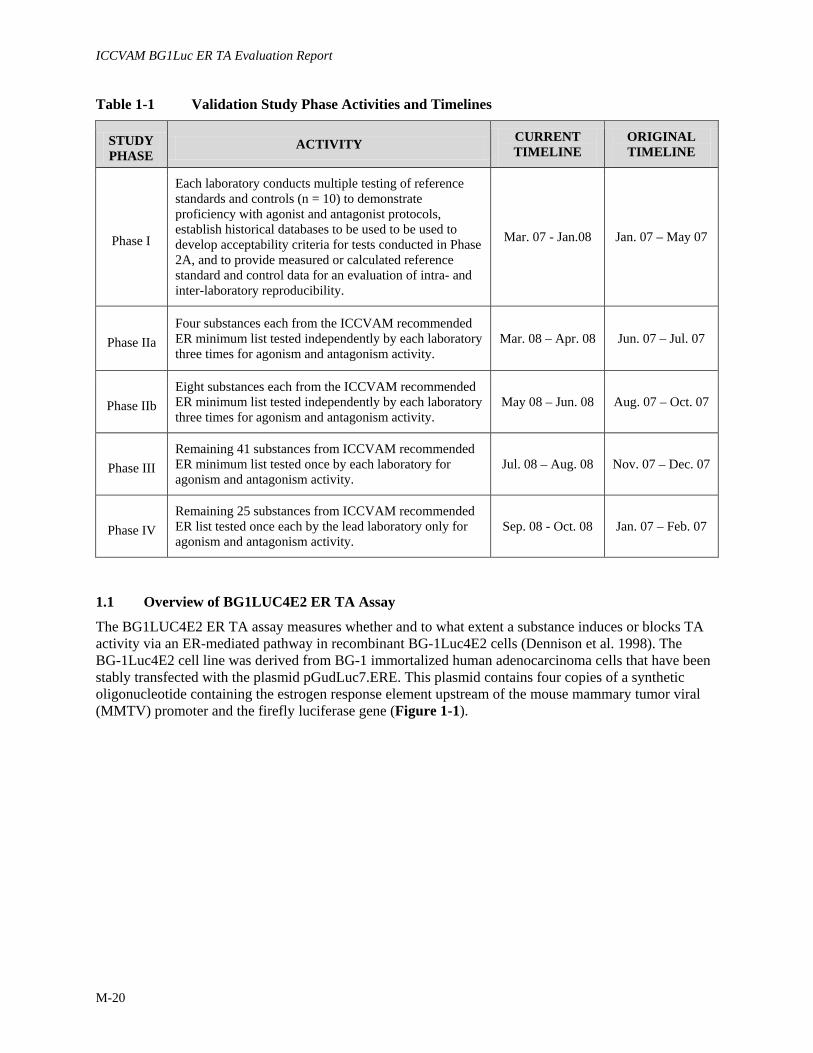
Table 1-1 Validation Study Phase Activities and Timelines .................................................. M-20
Table 2-1 Concentrations of E2 Reference Standard Used in Comprehensive Testing ................................................................................................................... M-22
Table 2-2 Means, Standard Deviations, and Coefficients of Variation of Reference Standard and Control Values ................................................................ M-28
Table 2-3 Linear Regression Analysis of Reference Standard and Control Values Over Time at XDS ..................................................................................... M-27
Table 2-4 ANOVA Results of Agonist Intralaboratory Reproducibility at XDS................... M-29
Table 3-1 Concentrations of the E2 Reference Standard Used in Comprehensive Testing ......................................................................................... M-30
Table 3-2 Means, Standard Deviations, and Coefficients of Variation of Reference Standard and Control Values ................................................................ M-32
Table 3-3 Linear Regression Analysis of Reference Standard and Control Values Over Time at ECVAM ............................................................................... M-33
Table 3-4 ANOVA Results of Agonist Intralaboratory Reproducibility at ECVAM ................................................................................................................. M-36
Table 4-1 Concentrations of the E2 Reference Standard Used in Comprehensive Testing ......................................................................................... M-37
Table 4-2 Means, Standard Deviations, and Coefficients of Variation of Reference Standard and Control Values ............................................................ M-39
Table 4-3 Linear Regression Analysis of Reference Standard and Control Values Over Time at Hiyoshi ................................................................................ M-40
Table 5-1 Means, Standard Deviations, and Coefficients of Variation for DMSO Control ....................................................................................................... M-44
Table 5-2 Newman-Keuls Results for Agonist DMSO Control ............................................. M-45
Table 5-3 Dunnett’s Results for Agonist DMSO Control ...................................................... M-45
Table 5-4 Means, Standard Deviations, and Coefficients of Variation for E2 Maximum Fold-Induction ................................................................................ M-46
Table 5-5 Newman-Keuls Results for E2 Maximum Fold-Induction .................................... M-47
Table 5-6 Dunnett’s Results for E2 Maximum Fold-Induction ............................................. M-47
Table 5-7 Means, Standard Deviations, and Coefficients of Variation for E2 EC50 Values ...................................................................................................... M-48
Table 5-8 Newman-Keuls Results for E2 EC50 Values .......................................................... M-49
Table 5-9 Dunnett’s Results for E2 EC50 Values ................................................................... M-49
Table 5-10 Means, Standard Deviations, and Coefficients of Variation for Methoxychlor Weak Positive Control ................................................................... M-50
Table 5-11 Newman-Keuls Results for Methoxychlor Weak Positive Control ....................... M-51
Table 5-12 Dunnett’s Results for Methoxychlor Weak Positive Control ................................ M-51

Appendix C – Background Review Document
M-11
Table 5-13 Agonist Historical Database Values Established for Phase IIa Acceptance Criteria ................................................................................ M-53
Table 6-1 Concentrations of the Ral/E2 Reference Standard Used in Comprehensive Testing ......................................................................................... M-56
Table 6-2 Means, Standard Deviations, and Coefficients of Variation of Reference Standard and Control Values ................................................................ M-59
Table 6-3 Linear Regression Analysis of Reference Standard and Control Values Over Time at XDS ..................................................................................... M-59
Table 6-4 ANOVA Results of Antagonist Intralaboratory Reproducibility at XDS ....................................................................................................................... M-62
Table 7-1 Concentrations of Ral/E2 Reference Standard Used in Comprehensive Testing ................................................................................................................... M-61
Table 7-2 Means, Standard Deviations, and Coefficients of Variation of Reference Standard and Control Values ................................................................ M-65
Table 7-3 Linear Regression Analysis of Reference Standard and Control Values Over Time at ECVAM ............................................................................... M-66
Table 7-4 ANOVA Results of Antagonist Intralaboratory Reproducibility at ECVAM ............................................................................................................. M-69
Table 8-1 Concentrations of Ral/E2 Reference Standard Used in Range Finder and Comprehensive Testing ....................................................................... M-70
Table 8-2 Means, Standard Deviations, and Coefficients of Variation of Reference Standard and Control Values ................................................................ M-72
Table 8-3 Linear Regression Analysis of Antagonist Control Values Over Time at Hiyoshi ..................................................................................................... M-73
Table 9-1 Means, Standard Deviations, and Coefficients of Variation for DMSO Control ................................................................................................. M-77
Table 9-2 Newman-Keuls Results for Antagonist DMSO Control ........................................ M-78
Table 9-3 Dunnett’s Results for DMSO Control .................................................................... M-78
Table 9-4 Means, Standard Deviations, and Coefficients of Variation for Ral/E2 Maximum Fold-Reduction ......................................................................... M-79
Table 9-5 Newman-Keuls Results for Ral/E2 Maximum Fold-Reduction ............................ M-80
Table 9-6 Dunnett’s Results for Ral/E2 Maximum Fold-Reduction ...................................... M-80
Table 9-7 Means, Standard Deviations, and Coefficients of Variation for Ral/E2 IC50 ....................................................................................................... M-81
Table 9-8 Newman-Keuls Results for Ral/E2 IC50 ................................................................ M-82
Table 9-9 Dunnett’s Results for Ral/E2 IC50 .......................................................................... M-82
Table 9-10 Means, Standard Deviations, and Coefficients of Variation for E2 Control .............................................................................................................. M-83
Table 9-11 Newman-Keuls Results for E2 Control ................................................................. M-84
Table 9-12 Dunnett’s Results for E2 Control ........................................................................... M-84

ICCVAM BG1Luc ER TA Evaluation Report
M-12
Table 9-13 Means, Standard Deviations, and Coefficients of Variation for the Flavone/E2 Weak Positive Control ........................................................................ M-83
Table 9-14 Newman-Keuls Results for Flavone/E2 Control ................................................... M-86
Table 9-15 Dunnett’s Results for the Flavone/E2 Weak Positive Control ............................... M-86
Table 9-16 Antagonist Historical Database Values Established for Phase IIa Acceptance Criteria at XDS ................................................................... M-88
Table 10-1 Visual Observation Scoring Table ......................................................................... M-89

Appendix C – Background Review Document
M-13
LIST OF ACRONYMS AND ABBREVIATIONS
ANOVA Analysis of variance BPA Bisphenol A CASRN Chemical Abstracts Service Registry Number CV Coefficient of variation DMSO Dimethyl sulfoxide DMSO Control 1% v/v DMSO in tissue culture medium E2 17β-Estradiol E2 control 2.5 x 10⁻⁵ µg/mL 17β-estradiol control used in the BG1LUC4E2 ER
TA antagonist assay E2 reference standard Serial dilution of 17β-estradiol reference standard for the
BG1LUC4E2 ER TA agonist assay EC50 Half–maximal effective concentration ER Estrogen receptor ECVAM The European Centre for the Validation of Alternative Methods Flavone/E2 weak positive control 25 µg/mL flavone with 2.5 x 10⁻⁵ µg/mL 17β-estradiol; used as a
weak positive control in the BG1LUC4E2 ER TA antagonist assay Hiyoshi Hiyoshi Corporation IC50 Concentration of the test substance that inhibits the reference
estrogen response by 50% ICCVAM Interagency Coordinating Committee on the Validation of
Alternative Methods ICCVAM Guidelines “ICCVAM Evaluation of In Vitro Test Methods for Detecting
Potential Endocrine Disruptors: Estrogen Receptor and Androgen Receptor Binding and Transcriptional Activation Assays” (ICCVAM 2006).
JaCVAM Japanese Center for the Validation of Alternative Methods Methoxychlor p,p'-Methoxychlor Methoxychlor weak positive control 3.13 µg/mL methoxychlor weak positive control for the
BG1LUC4E2 ER TA agonist assay NICEATM National Toxicology Program (NTP) Interagency Center for the
Evaluation of Alternative Toxicological Methods Raloxifene Raloxifene HCl Ral/E2 reference standard Serial dilution of raloxifene with a fixed concentration of 2.5 x 10⁻⁵
µg/mL 17β-estradiol reference standard for the BG1LUC4E2 ER TA antagonist assay
RLU Relative light units SD Standard deviation TA Transcriptional activation XDS Xenobiotic Detection Systems, Inc.

ICCVAM BG1Luc ER TA Evaluation Report
M-14
PREFACE
The proposed U.S. Environmental Protection Agency (EPA) Tier 1 endocrine disruptor screening program (EDSP) (EPA 1998) includes validated in vitro test methods to determine if chemicals interact with the estrogen receptor (ER). The Interagency Coordinating Committee on the Validation of Alternative Methods (ICCVAM) developed recommendations that include essential test method components and a list of 78 reference substances that should be used to standardize and validate in vitro ER binding and transcriptional activation (TA) test methods (ICCVAM 2003, 2006). A U.S. Federal Register (FR) notice by ICCVAM requested nomination of in vitro ER binding and TA test methods for validation studies (FR Vol. 68, No. 106, pp. 33171-33172, 3 June 2003). In response, a stably transfected ER TA assay (BG1LUC4E2 ER TA) developed by Xenobiotic Detection Systems, Inc. (XDS) to detect in vitro ER agonist and antagonist activity was nominated. An ICCVAM prescreen evaluation of the XDS background review document supporting the nomination resulted in a ICCVAM recommendation that it should be a high priority for validation studies.
In preparation for the validation study, the National Toxicology Program Interagency Center for the Evaluation of Alternative Methods (NICEATM) conducted a protocol standardization study for the detection of ER agonists and antagonists using the BG1LUC4E2 ER TA assay. ICCVAM-recommended essential test method components (ICCVAM 2003) were incorporated into the protocols and the intralaboratory reproducibility and accuracy of the standardized protocols were evaluated using a representative subset of the recommended reference substances (ICCVAM 2003, 2006).
Based on the results obtained in the protocol standardization study, NICEATM, the European Centre for the Validation of Alternative Methods (ECVAM), and the Japanese Center for the Validation of Alternative Methods (JaCVAM) designed and initiated a collaborative international validation study using three laboratories (one each in Japan, the United States, and Europe) to evaluate the reproducibility and accuracy of the BG1LUC4E2 ER TA assay for detecting ER agonists and antagonists. The validation study will evaluate the 78 reference substances recommended by ICCVAM for validation of in vitro ER test methods (ICCVAM, 2006). The study will proceed in four phases and the initial phase (Phase I) has been completed. Phase I focused on the transferability of the protocols developed during the protocol standardization study by establishing and comparing a historical control database in each laboratory. Positive and vehicle controls for the ER agonist and antagonist protocols were evaluated and test acceptance criteria was established for each laboratory. Phase II will evaluate 12 coded reference substances selected from the ICCVAM recommended minimum list of 53 reference substances, with each substance tested three times, in each laboratory in two stages. Intra- and inter- laboratory reproducibility and accuracy for agonist and antagonist detection will be assessed during and after each of the first two phases. Excessive variation and discordance will be investigated and protocols modified accordingly. Optimized final test method agonist and antagonist protocols will be used for Phases III and IV. Phase III will evaluate the performance (accuracy and reliability) of the optimized test method protocols using the remaining coded 41 minimum validation substances (each compound tested once for agonist or antagonist activity in each laboratory). The final phase (Phase IV) will test the remaining 25 substances on the ICCVAM list of 78 reference substances, each substance tested once for ER agonist or antagonist activity in a single laboratory.
Appendix C – Background Review Document
M-15
EXECUTIVE SUMMARY
Phase I of the National Toxicology Program Interagency Center for the Evaluation of Alternative Toxicological Methods (NICEATM), European Centre for the Validation of Alternative Methods (ECVAM) and the Japanese Center for the Validation of Alternative Methods (JaCVAM) designed multi-phased international validation study of the BG1LUC4E2 ER TA assay for the detection of estrogen receptor (ER) agonists and antagonists has been completed by all participating laboratories. The goal of Phase I of the validation study was to demonstrate proficiency with agonist and antagonist protocols, demonstrate intra- and inter-laboratory reproducibility, establish historical databases to be used as quality controls for subsequent study phases, and to modify test plate designs to improve test throughput. Phase I results are based on the multiple testing of reference standards and controls using agonist and antagonist protocols developed in the BG1LUC4E2 ER TA Assay Protocol Standardization Study as well as the evaluation of test plate designs, at the lead laboratory, that were modified to improve testing efficiency. Results of Phase I testing of agonist and antagonist reference standards and controls demonstrated the ability of the participating laboratories to conduct the assays in a reproducible manner, supported the modifications made to the protocols to increase testing efficiency, and established an historical database to use as quality controls for the next phase of the validation study.
Testing of Reference Standards and Controls at XDS, the Lead Laboratory Multiple testing of agonist and antagonist reference standards and controls was conducted at the lead laboratory (Xenobiotic Detection Systems, Inc. [XDS]) to evaluate the utility of test plate designs that were modified to improve statistical robustness of range finder testing by including duplicates of each test substance concentration and using all 96 test plate wells. Results demonstrated that the maximum response of modified range finder agonist and antagonist reference standards consistently exceeded the three-fold induction or reduction requirement for test plate acceptance. Serial dilutions of bisphenol A (BPA) and tamoxifen were also tested in the respective modified agonist and antagonist range finder plate designs to evaluate possible bias response between outside and inside test plate wells. Results demonstrated that, although there were statistically significant differences of measured values between outside and inside wells, the differences do not impact selection of the appropriate starting concentration for comprehensive testing. To increase testing throughput, the plate designs for agonist and antagonist comprehensive testing were also modified to use all 96 wells. To evaluate the effect of using outer test plate wells on comprehensive testing, EC50 values from serial dilutions of BPA derived from replicates using outside wells were compared to EC50 values derived from replicates using inside wells. The comparison indicated that there were no significant differences between EC50 values derived from replicates using outside wells and those derived from using inside wells.
Multiple testing of agonist and antagonist reference standards and controls was conducted to demonstrate proficiency with the modified comprehensive test plate designs, demonstrate intra- and inter-laboratory reproducibility, and establish an historical database to use as quality controls for the next phase of the validation study at XDS. Testing results were evaluated for intralaboratory reproducibility by conducting a linear regression analysis. The analysis indicated that values associated with the agonist reference standard and controls were not significantly different over time. However, analysis indicated that antagonist reference standard and control values associated with the DMSO and E2 controls, the flavone/E2 weak positive control, and Ral/E2 maximum fold-reduction, but not Ral/E2 IC50 were significantly different over time. Within-day variability was compared to across-day variability of reference standard and control values by conducting an analysis of variance. The analysis indicated that the variability of values associated with the agonist reference standard and controls were not significantly different. However, the analysis indicated that the variability of antagonist reference standard and control values associated with the DMSO and E2 controls, the flavone/E2 weak positive control, and Ral/E2 IC50, but not Ral/E2 maximum fold-reduction were significantly different.

ICCVAM BG1Luc ER TA Evaluation Report
M-16
Testing of Reference Standards and Controls at the ECVAM Laboratory Multiple testing of agonist and antagonist reference standards and controls was conducted to demonstrate proficiency with the modified comprehensive test plate designs, demonstrate intra- and inter-laboratory reproducibility, and establish an historical database to use as quality controls for the next phase of the validation study at the ECVAM Laboratories (ECVAM). Testing results were evaluated for intralaboratory reproducibility by conducting a linear regression analysis. The analysis indicated that agonist reference standard and control values associated with E2 maximum fold-induction, DMSO controls and methoxychlor weak positive controls were not significantly different over time, but were significantly different for E2 EC50 values. The analysis indicated that values associated with antagonist Ral\E2 maximum fold-reduction, DMSO vehicle controls and flavone\E2 weak positive controls were not statistically different over time, but were significantly different for Ral\E2 IC50 and E2 control values. Within-day variability was compared to across-day variability of reference standard and control values by conducting an analysis of variance. The analysis indicated that the variability of values associated with the agonist E2 maximum fold-induction and the methoxychlor weak positive control were not significantly different, but were significantly different for DMSO vehicle control and E2 EC50 values. The analysis indicated that the variability of values associated with the antagonist Ral\E2 maximum fold-reduction and flavone\E2 weak positive control values were not significantly different, but were significantly different for E2 and DMSO control values.
Testing of Reference Standards and Controls at the JaCVAM Laboratory Multiple testing of agonist and antagonist reference standards and controls was conducted to demonstrate proficiency with the modified comprehensive test plate designs, demonstrate intra- and inter-laboratory reproducibility, and establish an historical database to use as quality controls for the next phase of the validation study at Hiyoshi Corporation (Hiyoshi). Testing results were evaluated for intralaboratory reproducibility by conducting a linear regression analysis. The analysis indicated that agonist reference standard and control values associated with E2 maximum fold-induction, DMSO controls and E2 EC50 were not significantly different over time, but were significantly different for methoxychlor weak positive control values. The analysis indicated that values associated with antagonist Ral\E2 maximum fold-reduction, DMSO vehicle controls and flavone\E2 weak positive controls were not statistically different over time, but were significantly different for Ral\E2 IC50 and E2 control values.
The analysis indicated that values associated with antagonist reference standard and controls were not statistically significant over time. Within-day variability could not be compared to across-day variability for agonist or antagonist reference standard and control values at Hiyoshi because no more than one agonist or antagonist plate was tested on a single day.
Comparison of Reference Standard and Control Values Across Laboratories The means, standard deviations and coefficients of variation for values associated with agonist and antagonist reference standards and controls were compared across laboratories. An analysis of variance indicated that all values associated with agonist and antagonist reference standards and controls were significantly different across laboratories.
Phase I Intra- and Inter-Laboratory Reproducibility of Reference Standard and Control Values Statistically significant differences were observed in intra- and inter-laboratory reference and control values. It was not possible to identify the causes for these differences but contributing factors may be lot-to-lot differences in cell culture media and tissue culture supplies (for intra- and inter-laboratory differences) and differences in luminometers (for inter-laboratory differences). This underscores the importance of developing an historical control database for each individual laboratory. Phase I results that support the reliability of the assay are:
• Assay responds robustly to E2 reference estrogen and raloxifene reference anti-estrogen. • Assay consistently responds to weak-acting positive controls at concentrations several orders of
magnitude higher than the reference estrogen or anti-estrogen.

Appendix C – Background Review Document
M-17
• Assay plate induction or reduction values were consistently greater than three-fold (only 2 of 84 plates tested had values below three-fold).
• Phase I testing of reference standards and controls established historical databases that produced comparable test plate acceptance criteria for Phase IIa testing.
Therefore, based on the review of the results of Phase I, the Study management Team agreed to proceed with Phase IIa of the LUMI-CELL ER Assay international validation study.

ICCVAM BG1Luc ER TA Evaluation Report
M-18
This page intentionally left blank
Appendix C – Background Review Document
M-19
1.0 INTRODUCTION This technical report describes the Phase I procedures and results of the multi-phased international validation study of the BG1LUC4E2 ER TA assay, a transcriptional activation (TA) assay for the detection of estrogen receptor (ER) agonists and antagonists. The validation study is managed by the National Toxicology Program Interagency Center for the Evaluation of Alternative Toxicological Methods (NICEATM), the European Centre for the Validation of Alternative Methods (ECVAM), and the Japanese Center for the Validation of Alternative Methods (JaCVAM). The participating laboratories are:
• Xenobiotic Detection Systems, Inc. (XDS) located in Durham, NC, USA; the lead laboratory sponsored by NICEATM
• An ECVAM Laboratory located at the European Commission Joint Research Centre in Ispra, Italy • Hiyoshi Corporation (Hiyoshi) located in Omihachiman, Japan, sponsored by JaCVAM
During Phase I, multiple testing of reference standards and controls was conducted using agonist and antagonist protocols developed during the BG1LUC4E2 ER TA Assay Protocol Standardization Study (Protocol Standardization Study) to demonstrate proficiency with the agonist and antagonist protocols, establish historical databases to be used to develop acceptability criteria for tests conducted in Phase IIa, and to provide reference standard and control data for an evaluation of intra- and inter-laboratory reproducibility. Table 1-1 summarizes the activities in the different phases of the validation study as well as the original and current timeline for these activities. Phase I also included an evaluation at XDS for “edge” effects on the 96-well plate used for testing and a redesign of the plate layout based on the results. Also, additional testing was conducted at ECVAM and Hiyoshi to demonstrate proficiency with the visual observation method of assessing cell viability developed by XDS during the Protocol Standardization Study.
ICCVAM BG1Luc ER TA Evaluation Report
M-20
Table 1-1 Validation Study Phase Activities and Timelines
STUDY PHASE
ACTIVITY CURRENT TIMELINE
ORIGINAL TIMELINE
Phase I
Each laboratory conducts multiple testing of reference standards and controls (n = 10) to demonstrate proficiency with agonist and antagonist protocols, establish historical databases to be used to be used to develop acceptability criteria for tests conducted in Phase 2A, and to provide measured or calculated reference standard and control data for an evaluation of intra- and inter-laboratory reproducibility.
Mar. 07 - Jan.08 Jan. 07 – May 07
Phase IIa Four substances each from the ICCVAM recommended ER minimum list tested independently by each laboratory three times for agonism and antagonism activity.
Mar. 08 – Apr. 08 Jun. 07 – Jul. 07
Phase IIb Eight substances each from the ICCVAM recommended ER minimum list tested independently by each laboratory three times for agonism and antagonism activity.
May 08 – Jun. 08 Aug. 07 – Oct. 07
Phase III Remaining 41 substances from ICCVAM recommended ER minimum list tested once by each laboratory for agonism and antagonism activity.
Jul. 08 – Aug. 08 Nov. 07 – Dec. 07
Phase IV Remaining 25 substances from ICCVAM recommended ER list tested once each by the lead laboratory only for agonism and antagonism activity.
Sep. 08 - Oct. 08 Jan. 07 – Feb. 07
1.1 Overview of BG1LUC4E2 ER TA Assay
The BG1LUC4E2 ER TA assay measures whether and to what extent a substance induces or blocks TA activity via an ER-mediated pathway in recombinant BG-1Luc4E2 cells (Dennison et al. 1998). The BG-1Luc4E2 cell line was derived from BG-1 immortalized human adenocarcinoma cells that have been stably transfected with the plasmid pGudLuc7.ERE. This plasmid contains four copies of a synthetic oligonucleotide containing the estrogen response element upstream of the mouse mammary tumor viral (MMTV) promoter and the firefly luciferase gene (Figure 1-1).

Appendix C – Background Review Document
M-21
Figure 1-1 pGudLuc7.ERE Plasmid
BG1 adenocarcinoma cells that endogenously express ER were transfected with the reporter gene construct and stable transfectants were selected by growth in minimal essential medium (MEM) containing gentamycin (G418) (Rogers and Denison 2000). The resultant cell line expresses luciferase activity in response to estrogen and estrogen-like substances.
During BG1LUC4E2 ER TA, BG-1Luc4E2 cells are cultured and selected with G418, and then conditioned in estrogen-free medium for at least 48 hours. After conditioning, cells are seeded into 96 well plates for 24 to 48 hours and then incubated in estrogen-free medium containing solvent and/or reference standard, control, or test substance for 19 to 24 hr. Cytotoxicity is then evaluated and cells are subsequently lysed, treated with luciferase reagent, and luminescence in each well is measured in a luminometer as relative light units (RLU).
As a means to control variability, luminescence measurements from the assay are initially adjusted by subtracting the mean RLU values for wells containing the vehicle control from the mean RLU values for wells containing reference standards or controls other than the vehicle control. Luminescence measurements are further adjusted by scaling the highest adjusted RLU values for the reference estrogen to 10,000. Adjusting all values relative to a fixed reference of 10,000 allows for comparisons to be made between tests and across laboratories, irrespective of the original magnitude of the response.

ICCVAM BG1Luc ER TA Evaluation Report
M-22
2.0 PHASE I TESTING OF AGONIST REFERENCE STANDARD AND CONTROLS AT XDS
2.1 The Revised Agonist Range Finder Plate Design
Range finder testing in the BG1LUC4E2 ER TA agonist assay is used to select the starting concentration for the comprehensive testing of substances being evaluated for estrogenic activity. The plate layout for reference standards and the different controls used for agonist range finder testing in the Protocol Standardization Study limited testing to logarithmic (log) serial dilutions for five substances, with each concentration tested in a single well only (see Appendix B, Figure B-1). However, this methodology resulted in studies where the selection of the starting concentration to be used for comprehensive testing was problematic. To minimize this problem in future studies, the study design for agonist range finder testing was made more robust by testing duplicates of each test substance concentration. However, this change resulted in a reduction in the number of substances that could be tested on a single plate when using the standard plate configuration which excluded using outer wells. In order to increase efficiency, the plate designs were modified to use all 96 wells to run reference standards, controls and test substances. To evaluate whether using the outer wells would bias the data due to so-called “edging effects”1
• Reference standard :17β-estradiol (CASRN 50-28-2 [E2]): Four concentrations (5.00 x 10⁻⁵, 1.25 x 10⁻⁵, 3.13 x 10⁻⁶ and 7.83 x 10⁻⁷ µg/mL) tested in duplicate (E2 reference standard).
, bisphenol A (Chemical Abstract Services Registry Number [CASRN] 80-05-7 [BPA]) was tested over a seven-point logarithmic serial dilution concentration range (100 µg/mL – 1 x10⁻⁴ µg/mL) in each plate column using the modified plate design. Results of this testing demonstrated that although there are statistical differences between the level of RLUs in the outer and inner wells, these differences do not impact selection of the appropriate starting concentration for comprehensive testing (see Appendix B, Section 2-1 for results and discussion of edging effects testing with BPA). The modified plate design allows for the range finder testing of six test compounds in duplicate (see Figure B-3 in Appendix B). The reference standard and vehicle control used in the modified agonist range finder plate configuration is:
• Vehicle control: dimethyl sulfoxide (CASRN 67-68-5 [DMSO]) 1% (v/v) solution in tissue culture media run in four replicate wells (DMSO control).
At XDS, in Phase I, the modified range finder plate design was run in 10 separate plates. Test plate acceptance criteria was based on the maximum fold-induction of E2 (i.e., the highest average E2 RLU value divided by the average DMSO control RLU value must be greater than three-fold). Testing was conducted according to the 11 June 2007 version of BG1LUC4E2 ER TA agonist protocol (Appendix E), which was revised to reflect the modified range finder plate design using the outer wells in plate row H to run the duplicate four point E2 reference standard and the four DMSO control replicates. Testing indicated that the duplicate four point E2 reference standard produced a repeatable concentration response curve (Figure 2-1) that consistently exceeded the three-fold E2 maximum fold-induction requirement (Figure 2-2), thus demonstrating the acceptability of the revised plate configuration using outside wells for the range finder reference standard and control.
1 “Edging” or “edge” effects refer to differences in the RLU detected on a plate between the outer (n = 36) and
inner (n = 60) wells of a 96-well plate. These differences are thought to result from differences in vapor pressure between the two sets of wells (Nagy 2002, Oliver 1989).

Appendix C – Background Review Document
M-23
Figure 2-1 Revised Agonist Range Finder E2 Reference Standard1
-6.5 -6.0 -5.5 -5.0 -4.5 -4.00
2500
5000
7500
1000013-Jun-07a13-Jun-07b15-Jun-07a15-Jun-07b29-Jun-07a29-Jun-07b29-Jun-07c05-Jul-07a05-Jul-07b06-Jul-07
Log E2 Concentration (µg/mL)
Abbreviations: E2 = 17ß-estradiol; RLU = Relative Light Units 1 The solid connecting line represents the concentration curve for the averaged adjusted relative light unit (RLU) values for the
4-point range finder E2 reference standard concentrations from each plate tested.
Figure 2-2 E2 Maximum Fold-Induction Values for Revised Agonist Range Finder Plates1
0
1
2
3
4
5
6
7
1 Bars represent fold-induction (the highest averaged E2 RLU value from the 4-point E2 reference standard divided by the
average DMSO control RLU value) from each range finder plate tested.
2.2 The Revised Agonist Comprehensive Testing Plate Design
To increase the testing efficiency of the BG1LUC4E2 ER TA assay, it was proposed that the plate layouts for agonist comprehensive testing also be revised to use all 96 wells (see Figure B-9 in Appendix B). To evaluate whether using the outer wells would bias the data due to edging effects, EC50 values were

ICCVAM BG1Luc ER TA Evaluation Report
M-24
calculated for the seven-point logarithmic serial dilutions of BPA tested in each plate column using the modified range finder plate configuration described above (Section 2.1). A comparison of BPA EC50 values demonstrated that there were no significant differences between inner and outer wells (see Appendix B, Section 2-1 for results and discussion of edging effects testing with BPA). This allows for the testing of 11-point double serial dilutions of two substances in triplicate, instead of only one substance as would occur if the original plate configuration was used (see Figure B-7 in Appendix B).
Testing of agonist reference standard and controls to demonstrate proficiency with the modified agonist protocol and to establish a historical database was conducted at XDS using the modified plate design according to procedures in the updated 2 August 2007 (Appendix G) version of BG1LUC4E2 ER TA agonist protocol. The reference standard and controls used to test the modified plate configuration for comprehensive testing were:
• Reference standard: Serial dilutions of E2 consisting of 11 concentrations in duplicate (E2 reference standard) (Table 2-1).
• Vehicle control: DMSO (1% v/v) in tissue culture media run in four replicate wells (DMSO control). • Weak positive control: p,p'-Methoxychlor (CASRN 72-43-5) (methoxychlor) run in four replicate
wells at a concentration of 3.13 µg/mL (methoxychlor weak positive control).
Table 2-1 Concentrations of the E2 Reference Standard Used in Comprehensive Testing
E2 Concentrations1
1.00 x 10⁻⁴ 6.25 x 10⁻⁶ 3.92 x 10⁻⁷
5.00 x 10⁻⁵ 3.13 x 10⁻⁶ 1.95 x 10⁻⁷
2.50 x 10⁻⁵ 1.56 x 10⁻⁶ 9.78 x 10⁻⁸
1.25 x 10⁻⁵ 7.83 x 10⁻⁷
Abbreviations: E2 = 17ß-estradiol 1 Concentrations are presented in µg/mL.
The reference standard and controls were tested in 10 separate plates on three separate days (2 plates each on 2 separate days and 6 plates on another day) to demonstrate proficiency with the modified agonist protocol and to establish a historical database. Acceptance or rejection of a test plate was based on plate induction; plates were rejected if the fold-induction for the maximum E2 response was less than three. Tabulated testing results from individual test plates, including plate induction and E2 EC50 values are provided in Table A-1 in Appendix A, and the RLU values from the DMSO controls and averaged highest non-adjusted RLU values from the E2 reference standard from individual test plates are presented in Figure A-1 in Appendix A. Individual and averaged adjusted and normalized RLU values for the E2 reference standard and the methoxychlor weak positive control from accepted test plates are presented in Figures 2-3 and 2-4 respectively.

Appendix C – Background Review Document
M-25
Figure 2-3 XDS Agonist Historical Database: Individual Experiments1
-7 -6 -5 -4 -3 -2 -1-2000
0
2000
4000
6000
8000
10000
12000
E2 Reference Standard
Methoxychlor Control
Log Concentration (µg/mL)
Abbreviations: E2 = 17ß-estradiol; methoxychlor control = methoxychlor weak positive control; RLU = Relative Light Units; XDS = Xenobiotic Detection Systems, Inc.
1 Each square and solid connecting line represents the concentration curve for the adjusted and normalized RLU values for the 11-point E2 reference standard concentrations from each plate tested during the creation of the agonist historical database. The upward-facing arrows represent the averaged adjusted and normalized RLU values for the methoxychlor weak positive control from each plate tested during the creation of the agonist historical database. Error bars represent the standard deviation from the mean.
Figure 2-4 XDS Agonist Historical Database: Averaged Experiments1
-7 -6 -5 -4 -3 -2 -1-2000
0
2000
4000
6000
8000
10000
12000
Averaged E2 Reference StandardAveraged Methoxychlor
Log Dose (µg/mL)
Abbreviations: E2 = 17ß-estradiol; methoxychlor = methoxychlor weak positive control; RLU = Relative Light Units; XDS = Xenobiotic Detection Systems, Inc.
1 The solid connecting line represents the concentration curve for the averaged adjusted and normalized RLU values for the 11-point E2 reference standard concentrations from all plates tested. The methoxychlor value represents the averaged adjusted and normalized RLU values for the methoxychlor weak positive control from all plates tested. Error bars represent the standard error of the mean.

ICCVAM BG1Luc ER TA Evaluation Report
M-26
2.3 Evaluation of Historical Control Intralaboratory Reproducibility at XDS
The within-day and across-day reproducibility of the RLU values associated with the DMSO control wells, the fold-induction of E2 at its maximum response, the calculated E2 EC50 values, and the adjusted and normalized RLU values associated with the methoxychlor weak positive control have been statistically analyzed. RLU values from plate controls using three or more replicate wells (i.e., DMSO and methoxychlor weak positive controls) were evaluated using the Q test (see Section 11.6.2 in 17 April 2007 version of BG1LUC4E2 ER TA agonist protocol in Appendix C) to identify outliers before calculating test plate averages for the respective controls. None of the replicate wells produced RLU values that were considered as outliers by the Q test. Averaged reference standard and control values were also evaluated using the Q test to identify outliers when three of more plates were tested on a given day. This analysis identified a calculated E2 EC50 value in one of six plates tested on the same day as an outlier compared to the other values on that day (E2 EC50 value for experimental plate XICT4BP in Table A-1 in Appendix A) and was excluded from analysis. Coefficients of variation (CVs = the standard deviation [SD] divided by the mean and expressed as a percent) were determined for reference standard and control values to assess relative plate to plate variability. To assess the intralaboratory reproducibility of the reference standard and the control values across time, a linear regression analysis was conducted using the least squares method in GraphPad PRISM® 4.0 (PRISM®). Lastly, the variability of reference standard and control values from test plates run on the same day was compared to the variability of test plates run across days by conducting the one-way analysis of variance (ANOVA) method in PRISM®.
2.3.1 Coefficients of Variation
The means, SDs and CVs for DMSO control, E2 maximum fold-induction, and E2 EC50 and methoxychlor weak positive control values from the 10 plates tested are provided in Table 2-2.
Table 2-2 Means, Standard Deviations, and Coefficients of Variation of Reference Standard and Control Values
XDS
N1 Units Mean SD CV
DMSO 10 RLU 5394 2558 47% E2 Maximum
Fold-Induction 10 Fold-Induction 4.7 0.70 15%
E2 EC50 92 µg/mL 2.3 x 10⁻⁶ 4.5 x 10⁻⁷ 20%
Methoxychlor 10 Adjusted
RLU 5709 974 13%
Abbreviations: CV = coefficient of variation; DMSO = dimethyl sulfoxide; E2 = 17ß-estradiol; EC50 = half-maximal effective concentration; methoxychlor = methoxychlor weak positive control; SD = standard deviation; XDS = Xenobiotic Detection Systems, Inc.
1 Number of plates tested 2 The E2 EC50 value in one of six plates tested on the same day was identified as an outlier and was excluded from analysis.
2.3.2 Linear Regressions
Results of the linear regression analysis for reference standard and control values are provided in Table 2-3. The analysis was conducted using the averaged reference standard and control values from each plate tested. The slope of the regression line, based on a two-tailed test, was judged to be statistically significant at p < 0.05.

Appendix C – Background Review Document
M-27
Table 2-3 Linear Regression Analysis of Reference Standard and Control Values Over Time at XDS
Slope p-value (Slope)1 Unit Intercept
DMSO 15.5 0.540 RLU 4308
E2 Maximum
Fold-Induction -0.002 0.800 Fold-Induction 4.6
E2 EC50 -5.0 x 10⁻⁹ 0.262 µg/mL 2.6 x 10⁻⁶
Methoxychlor 1.66 0.865 Adjusted RLU 5592
Abbreviations: DMSO = dimethyl sulfoxide; E2 = 17ß-estradiol; EC50 = half-maximal effective concentration; methoxychlor = methoxychlor weak positive control; RLU = relative light units; XDS = Xenobiotic Detection Systems, Inc.
1 Statistically significant from zero at p < 0.05. Results from the linear regression analysis of the averaged non-adjusted DMSO control RLU values from each test plate are graphically presented in Figure 2-5. The slope of the linear regression, although appearing positive, was not significantly different from zero (p = 0.540, Table 2-3), demonstrating the intralaboratory reproducibility of the DMSO control.
Figure 2-5 Linear Regression of Agonist DMSO Control at XDS
0 10 20 30 40 50 60 70 80 90 1000
1000
2000
3000
4000
5000
6000
7000
8000
Study Day Abbreviations: DMSO = dimethyl sulfoxide; RLU = relative light units; XDS = Xenobiotic Detection Systems, Inc.
Results from the linear regression analysis of E2 maximum fold-induction are graphically presented in Figure 2-6. The slope of the linear regression was not significantly different from zero (p = 0.800) (Table 2-3), demonstrating the intralaboratory reproducibility of plate induction.

ICCVAM BG1Luc ER TA Evaluation Report
M-28
Figure 2-6 Linear Regression of E2 Maximum Fold-Induction at XDS
0 10 20 30 40 50 60 70 80 90 1000
1
2
3
4
5
6
7
8
9
10
11
Study Day Abbreviations: E2 = 17ß-estradiol; XDS = Xenobiotic Detection Systems, Inc.
Results from the linear regression analysis of E2 EC50 values are graphically presented in Figure 2-7. The slope of the linear regression was not significantly different from zero (p = 0.262, Table 2-3), demonstrating the intralaboratory reproducibility of the E2 reference standard EC50 values.
Figure 2-7 Linear Regression of E2 EC50 Values at XDS
0 10 20 30 40 50 60 70 80 90 1000
1.0x10⁻⁶
2.0x10⁻⁶
3.0x10⁻⁶
4.0x10⁻⁶
5.0x10⁻⁶
Study Day Abbreviations: E2 = 17ß-estradiol; EC50 = half-maximal effective concentration; XDS = Xenobiotic Detection Systems, Inc.
Results from the linear regression analysis of the averaged adjusted and normalized methoxychlor weak positive control RLU values from each test plate are graphically presented in Figure 2-8. The slope of the linear regression was not significantly different from zero (p = 0.865, Table 2-3), demonstrating the intralaboratory reproducibility of the methoxychlor weak positive control.

Appendix C – Background Review Document
M-29
Figure 2-8 Linear Regression of the Methoxychlor Weak Positive Control at XDS
0 10 20 30 40 50 60 70 80 90 1000
1000
2000
3000
4000
5000
6000
7000
8000
9000
10000
11000
Study Day Abbreviations: RLU = relative light units; XDS = Xenobiotic Detection Systems, Inc.
2.3.3 Analysis of Variance
The results of the ANOVA comparing the variability of reference standard and control values from test plates run on the same day to values from test plates run across days is provided in Table 2-4. The analysis was conducted using the averaged reference standard and control values from each plate tested. Variability is statistically significant at p < 0.05. Results from the analysis indicate that within-day variability is not significantly different from between-day variability for reference standard and control values.
Table 2-4 ANOVA Results of Agonist Intralaboratory Reproducibility at XDS
p-Value1 F Value2
DMSO 0.068 4.0
E2 Maximum Fold-
Induction 0.749 0.3
E2 EC50 0.529 0.7
Methoxychlor 0.596 0.6
Abbreviation: ANOVA=analysis of variance; DMSO = dimethyl sulfoxide; E2 = 17ß-estradiol; EC50 = half-maximal effective concentration; methoxychlor = methoxychlor weak positive control; XDS = Xenobiotic Detection Systems, Inc.
1 Variability is statistically significant at p < 0.05
2 F = ratio of between-day variability to within-day variability – a ratio of 1.0 indicates that the within-day variability to between-day variability is equal and a ratio of zero indicates that all means are equal.

ICCVAM BG1Luc ER TA Evaluation Report
M-30
3.0 PHASE I TESTING OF AGONIST REFERENCE STANDARD AND CONTROLS AT ECVAM
Testing of agonist reference standard and controls was done using the modified plate design and procedures in the 2 August 2007 version of BG1LUC4E2 ER TA agonist protocol (Appendix G), which was revised to reflect the use of all 96 test plate wells. The reference standard and controls used for agonist testing were:
• Reference standard: Serial dilutions of E2 consisting of 10 concentrations in duplicate (E2 reference standard) (Table 3-1).
• Vehicle control: DMSO (1% v/v) in tissue culture media run in four replicate wells (DMSO control). • Weak positive control: methoxychlor run in four replicate wells at a concentration of 3.13 µg/mL
(methoxychlor weak positive control).
Table 3-1 Concentrations of the E2 Reference Standard Used in Comprehensive Testing
E2 Concentrations1
1.00 x 10⁻⁴ 6.25 x 10⁻⁶ 3.92 x 10⁻⁷
5.00 x 10⁻⁵ 3.13 x 10⁻⁶ 1.95 x 10⁻⁷
2.50 x 10⁻⁵ 1.56 x 10⁻⁶ 9.78 x 10⁻⁸
1.25 x 10⁻⁵ 7.83 x 10⁻⁷
Abbreviations: E2 = 17ß-Estradiol 1 Concentrations are presented in µg/mL. The reference standard and controls were tested in 18 separate 96-well plates on 9 separate days (2 plates each on 9 separate days) to demonstrate proficiency with the modified agonist protocol and to establish a historical database. Acceptance or rejection of a test plate was based on plate induction; plates were rejected if the fold-induction for the maximum E2 response was less than three. Tabulated testing results from individual test plates, including plate induction and E2 reference standard EC50 values, are provided in Table A-2 in Appendix A, and the RLU values from the DMSO controls and averaged highest non-adjusted RLU values from the E2 reference standard from individual test plates are presented in Figure A-2 in Appendix A. Individual and averaged adjusted and normalized RLU values for the E2 reference standard and the methoxychlor weak positive control from accepted test plates are presented in Figures 3-1 and 3-2 respectively.

Appendix C – Background Review Document
M-31
Figure 3-1 ECVAM Agonist Historical Database: Individual Experiments1
-7 -6 -5 -4 -3 -2 -1-2000
0
2000
4000
6000
8000
10000
12000
E2 Reference Standard
Methoxychlor Control
Log Concentration (µg/mL)
Abbreviations: E2 = 17ß-estradiol; ECVAM = The European Centre for the Validation of Alternative Methods; methoxychlor control = methoxychlor weak positive control; RLU = relative light units
1 Each square and solid connecting line represents the concentration curve for the adjusted and normalized RLU values for the 11-point E2 reference standard concentrations from each plate tested during the creation of the agonist historical database. The upward-facing arrows represent the averaged adjusted and normalized RLU values for the methoxychlor weak positive control from each plate tested during the creation of the agonist historical database. Error bars represent the standard deviation from the mean.
Figure 3-2 ECVAM Agonist Historical Database: Averaged Experiments1
-7 -6 -5 -4 -3 -2 -1-2000
-1000
0
1000
2000
3000
4000
5000
6000
7000
8000
9000
10000
11000
Mean DMSO +3X SDAveraged MethoxychlorAveraged E2 Reference Standard
Log Dose (µg/mL)
Abbreviations: E2 = 17ß-estradiol; ECVAM = The European Centre for the Validation of Alterative Methods; methoxychlor = methoxychlor weak positive control; RLU = relative light units
1 The solid connecting line represents the concentration curve for the averaged adjusted and normalized RLU values for the 11-point E2 reference standard concentrations from all plates tested. The methoxychlor value represents the averaged adjusted and normalized RLU values for the methoxychlor weak positive control from all plates tested. Error bars represent the standard error from the mean.

ICCVAM BG1Luc ER TA Evaluation Report
M-32
3.1 Evaluation of Intralaboratory Reproducibility at ECVAM
The within-day and across-day reproducibility of the RLU values associated with the DMSO control wells, the fold-induction of E2 at its maximum response, the calculated E2 EC50 values, and the adjusted and normalized RLU values associated with the methoxychlor weak positive control have been statistically analyzed. RLU values from plate controls using three or more replicate wells (i.e., DMSO and methoxychlor weak positive controls) were evaluated using the Q test (see Section 11.6.2 in 2 August 2007 version of BG1LUC4E2 ER TA agonist protocol in Appendix G) to identify outliers before calculating test plate averages for the respective controls. None of the replicate wells produced RLU values that were considered as outliers by the Q test. CVs were determined for reference standard and control values to assess relative plate to plate variability. To assess the intralaboratory reproducibility of the reference standard and the control values across time, a linear regression analysis was conducted using the least squares method in PRISM®. Lastly, the variability of reference standard and control values from test plates run on the same day was compared to the variability of test plates run across days by conducting an ANOVA using PRISM®.
3.1.1 Coefficients of Variation
The means, SDs and CVs for DMSO control, E2 maximum fold-induction, and E2 EC50 and methoxychlor weak positive control values from the 18 plates tested are provided in Table 3-2.
Table 3-2 Means, Standard Deviations, and Coefficients of Variation of Reference Standard and Control Values
ECVAM
N1 Units Mean SD CV
DMSO 18 RLU 3486 1582 45%
E2 Maximum
Fold-Induction 18 Fold-Induction 8.1 0.93 11%
E2 EC50 18 µg/mL 2.72 x 10⁻⁶ 8.45 x 10⁻⁷ 37%
Methoxychlor 18 Adjusted RLU 4494 590 8%
Abbreviations: CV = coefficient of variation; DMSO = dimethyl sulfoxide; E2 = 17ß-estradiol; EC50 = half-maximal effective concentration; ECVAM = The European Centre for the Validation of Alternative Methods; methoxychlor = methoxychlor weak positive control; RLU = relative light units; SD = standard deviation
1 Number of plates tested
3.1.2 Linear Regressions
Results of the linear regression analysis for the reference standard and control values are provided in Table 3-3. The analysis was conducted using the averaged reference standard and control values from each plate tested. The slope of the regression line, based on a two-tailed test, was judged to be statistically significant at p<0.05.

Appendix C – Background Review Document
M-33
Table 3-3 Linear Regression Analysis of Reference Standard and Control Values Over Time at ECVAM1,2
Slope p-value (Slope) Unit Intercept
DMSO 86.4 0.064 RLU 2286
E2 Maximum Fold-
Induction -0.03 0.351 Fold-Induction 8.4
E2 EC50 5.4 x 10⁻⁸ 0.002 µg/mL 2.3 x 10⁻⁶
Methoxychlor -10.74 0.564 Adjusted RLU 4641
Abbreviations: DMSO = dimethyl sulfoxide; E2 = 17ß-estradiol; EC50 = half-maximal effective concentration; ECVAM = European Centre for the Validation of Alternative Methods; methoxychlor = methoxychlor weak positive control; RLU = relative light units
1 Statistically significant from zero at p < 0.05. 2 Values in italics have p values that are less than 0.05.
Results from the linear regression analysis of the averaged non-adjusted DMSO control RLU values from each test plate are graphically presented in Figure 3-2. The slope of the linear regression, although appearing to be positive, was not significantly different from zero (p = 0.064, Table 3-3), demonstrating the intralaboratory reproducibility of the DMSO control.
Figure 3-3 Linear Regression of DMSO Controls at ECVAM
0 5 10 15 20 25 300
1000
2000
3000
4000
5000
6000
7000
8000
Study Day Abbreviations: DMSO = dimethyl sulfoxide; ECVAM = European Centre for the Validation of Alternative Methods;
RLU = relative light units
Results from the linear regression analysis of E2 maximum fold-induction are graphically presented in Figure 3-4. The slope of the linear regression was not statistically different from zero (p = 0.351, Table 3-3), demonstrating the intralaboratory reproducibility of the E2 maximum fold-induction.

ICCVAM BG1Luc ER TA Evaluation Report
M-34
Figure 3-4 Linear Regression of E2 Maximum Fold-Induction at ECVAM
0 5 10 15 20 25 300
1
2
3
4
5
6
7
8
9
10
11
Study Day Abbreviations: E2 = 17ß-estradiol; ECVAM = European Centre for the Validation of Alternative Methods
Results from the linear regression analysis of E2 EC50 values are graphically presented in Figure 3-5. The linear regression indicates that E2 EC50 values are statistically significant over time (p = 0.002, Table 3-3).
Figure 3-5 Linear Regression of E2 EC50 Value at ECVAM
0 5 10 15 20 25 300
1.0x10⁻⁶
2.0x10⁻⁶
3.0x10⁻⁶
4.0x10⁻⁶
5.0x10⁻⁶
Study Day Abbreviations: E2 = 17ß-estradiol; EC50 = half-maximal effective concentration; ECVAM = European Centre for the Validation
of Alternative Methods
Results from the linear regression analysis of the averaged adjusted and normalized methoxychlor weak positive control RLU values from each test plate are graphically presented in Figure 3-6. The slope of the

Appendix C – Background Review Document
M-35
linear regression was not significantly different from zero (p = 0.564, Table 3-3), demonstrating the intralaboratory reproducibility of the methoxychlor weak positive control.
Figure 3-6 Linear Regression of the Methoxychlor Weak Positive Controls at ECVAM
0 5 10 15 20 25 300
1000
2000
3000
4000
5000
6000
7000
8000
9000
10000
11000
Study Day Abbreviations: ECVAM = European Centre for the Validation of Alternative Methods; RLU = relative light units 3.1.3 Analysis of Variance
The variability of the reference standard and control values from test plates run on the same day was compared to the variability of test plates run across days by conducting an ANOVA using PRISM®. Variability is statistically significant at p < 0.05. Results from the analysis are provided in Table 3-4 and indicate that within-day variability is not statistically significant from between-day variability for E2 maximum fold-induction and methoxychlor weak positive control values but is significantly different for DMSO control and E2 EC50 values. As can be seen in Figure 3-2, the within-day variability of DMSO values is minimal compared to between-day variability. The variability of unadjusted DMSO vehicle control RLU values is inherent to the assay and reflects the variability of background estrogenic activity. Evaluation of test substances is based on protocol procedures that adjust for background estrogenic activity, therefore the observed statistically significant variability of unadjusted DMSO control RLU values does not affect the performance of the system.

ICCVAM BG1Luc ER TA Evaluation Report
M-36
Table 3-4 ANOVA Results of Agonist Intralaboratory Reproducibility at ECVAM
p- Value1 F Value2
DMSO <0.001 49.0
E2 Maximum Fold-
Induction 0.256 1.6
E2 EC50 <0.001 6.0
Methoxychlor 0.485 1.0
Abbreviations: ANOVA = analysis of variance; DMSO = dimethyl sulfoxide; E2 = 17ß-estradiol; EC50 = half-maximal effective concentration; ECVAM = European Centre for the Validation of Alternative Methods; methoxychlor = half-maximal effective concentration; methoxychlor = methoxychlor weak positive control
1 Variability is statistically significant at p < 0.05 - values in italics have p values that are less than 0.05. 2 F = ratio of between-day variability to within-day variability – a ratio of 1.0 indicates that the within-day variability to
between-day variability is equal and a ratio of zero indicates that all means are equal.

Appendix C – Background Review Document
M-37
4.0 PHASE I TESTING OF AGONIST REFERENCE STANDARD AND CONTROLS AT HIYOSHI
Testing of agonist reference standards and controls to demonstrate proficiency with the agonist protocol and to establish a historical database was conducted at Hiyoshi using procedures in the 18 April 2007 version of BG1LUC4E2 ER TA agonist protocol (Appendix C). Phase I testing was initiated at Hiyoshi before development of modified plate designs using all 96 wells of test plates had been completed at the lead laboratory, therefore testing of the agonist reference standard and controls used the plate design developed during the Protocol Standardization Study using inside wells only. The reference standard and controls for agonist testing were:
• Reference standard: Serial dilutions of E2 consisting of 10 concentrations in duplicate (E2 reference standard) (Table 4-1).
• Vehicle control: DMSO, 1% (v/v) solution in tissue culture media run in four replicate wells (DMSO control).
• Weak positive control: methoxychlor run in four replicate wells at a concentration of 3.13 µg/mL (methoxychlor weak positive control).
Table 4-1 Concentrations of the E2 Reference Standard Used in Comprehensive Testing
E2 Concentrations1
1.00 x 10⁻⁴ 6.25 x 10⁻⁶ 1.95 x 10⁻⁷
5.00 x 10⁻⁵ 3.13 x 10⁻⁶ 9.78 x 10⁻⁸
2.50 x 10⁻⁵ 1.56 x 10⁻⁶
1.25 x 10⁻⁵ 7.83 x 10⁻⁷
Abbreviations: E2 = 17ß-estradiol 1 Concentrations are presented in µg/mL.
The agonist reference standard and controls were tested in 12 separate plates on 12 separate days to demonstrate proficiency with the agonist protocol and to establish a historical database. Acceptance or rejection of a test plate was based on plate induction; plates are rejected if the fold-induction for the maximum E2 response was less than three. Tabulated testing results from individual test plates, including plate fold-induction and E2 EC50 values are provided in Table A-3 in Appendix A (note: test plates HIrefsubAg3 and HIrefsubAg3 did not meet acceptance criteria [induction was less than three-fold] and were not included in data analysis). The RLU values from the DMSO controls and averaged highest non-adjusted RLU values from the E2 reference standard from individual test plates are presented in Figure A-3 in Appendix A. Individual and averaged adjusted and normalized RLU values for the E2 reference standard and the methoxychlor weak positive control from accepted test plates are presented in Figures 4-1 and 4-2 respectively.

ICCVAM BG1Luc ER TA Evaluation Report
M-38
Figure 4-1 Hiyoshi Agonist Historical Database: Individual Experiments1,2
-7 -6 -5 -4 -3 -2 -1-2000
0
2000
4000
6000
8000
10000
12000 E2 Reference StandardMethoxychlor Control
Log Concentration (µg/mL)
Abbreviations: E2 = 17ß-estradiol; Hiyoshi = Hiyoshi Corporation; methoxychlor control = methoxychlor weak positive control; RLU = relative light units
1 Each square and solid connecting line represents the concentration curve for the adjusted and normalized RLU values for the 11-point E2 reference standard concentrations from each plate tested during the creation of the agonist historical database. The upward-facing arrows represent the averaged adjusted and normalized RLU values for the methoxychlor weak positive control from each plate tested during the creation of the agonist historical database. Error bars represent the standard deviation from the mean.
2 Experiments on 04 July and 06 July 2007 did not meet acceptance criteria. Figure 4-2 Hiyoshi Agonist Historical Database: Averaged Experiments1
-7 -6 -5 -4 -3 -2 -1-2000
0
2000
4000
6000
8000
10000
12000
Averaged Methoxychlor
Averaged E2 Reference Standard
Log Concentration (µg/mL)
Abbreviations: E2 = 17ß-estradiol; Hiyoshi = Hiyoshi Corporation; methoxychlor = methoxychlor weak positive control; RLU = relative light units
1 The solid connecting line represents the concentration curve for the averaged adjusted and normalized RLU values for the 10-point E2 reference standard concentrations from all plates tested. The methoxychlor value represents the averaged adjusted and normalized RLU values for the methoxychlor weak positive control from all plates tested. Error bars represent the standard error from the mean.

Appendix C – Background Review Document
M-39
4.1 Evaluation of Intralaboratory Reproducibility at Hiyoshi
The within-day and across-day reproducibility of the RLU values associated with the DMSO solvent control wells, the fold-induction of E2 at its maximum response, the calculated E2 EC50 values, and the adjusted and normalized RLU values associated with the methoxychlor weak positive control have been statistically analyzed. RLU values from plate controls using three or more replicate wells (i.e., DMSO and methoxychlor weak positive controls) were evaluated using the Q test (see Section 11.6.2 in 2 August 2007 version of BG1LUC4E2 ER TA agonist protocol in Appendix G) to identify outliers before calculating test plate averages for the respective controls. None of the replicate wells produced RLU values that were considered as outliers by the Q test. CVs were determined for reference standard and control values to assess relative plate to plate variability. To assess the intralaboratory reproducibility of the reference standard and the control values across time, a linear regression analysis was conducted using the least squares method in PRISM®.
4.1.1 Coefficients of Variation
The means, SDs and CVs for DMSO control, E2 fold-induction, and E2 EC50 and methoxychlor weak positive control values from the 10 plates tested are provided in Table 4-2.
Table 4-2 Means, Standard Deviations, and Coefficients of Variation of Reference Standard and Control Values
Hiyoshi
N1 Units Mean SD CV
DMSO 10 RLU 4006 1500 37% E2 Maximum
Fold-Induction 10 Fold-Induction 4.5 0.86 19%
E2 EC50 10 µg/mL 3.1 x 10⁻⁶ 7.9 x 10⁻⁷ 26%
Methoxychlor 10 Adjusted RLU 7420 392 5%
Abbreviations: CV=coefficient of variation; DMSO = dimethyl sulfoxide; E2 = 17ß-estradiol; EC50 = half-maximal effective concentration; methoxychlor = methoxychlor weak positive control; RLU = relative light units; SD = standard deviation
1 Number of plates tested 4.1.2 Linear Regressions
Results of the linear regression analysis for the reference standard and control values are provided in Table 4-3. The analysis was conducted using the averaged reference standard and control values from each plate tested. The slope of the regression line, based on a two-tailed test, was judged to be statistically significant at p < 0.05.
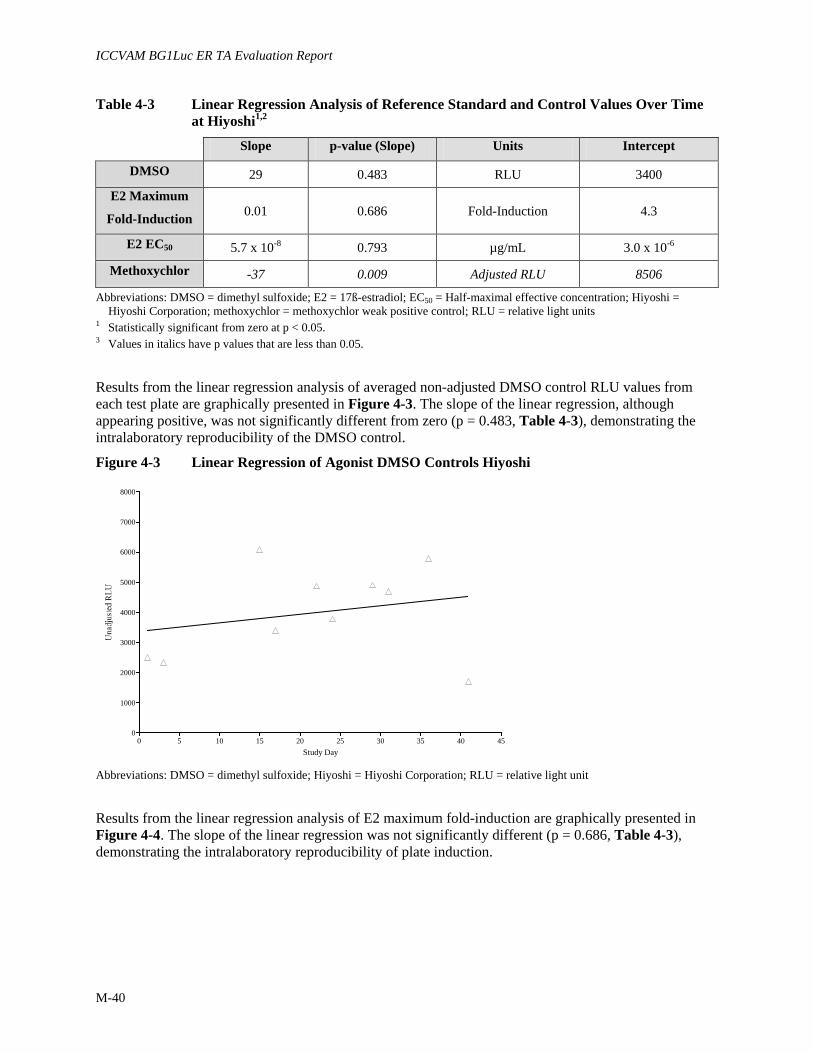
ICCVAM BG1Luc ER TA Evaluation Report
M-40
Table 4-3 Linear Regression Analysis of Reference Standard and Control Values Over Time at Hiyoshi1,2
Slope p-value (Slope) Units Intercept
DMSO 29 0.483 RLU 3400 E2 Maximum
Fold-Induction 0.01 0.686 Fold-Induction 4.3
E2 EC50 5.7 x 10⁻⁸ 0.793 µg/mL 3.0 x 10⁻⁶
Methoxychlor -37 0.009 Adjusted RLU 8506
Abbreviations: DMSO = dimethyl sulfoxide; E2 = 17ß-estradiol; EC50 = Half-maximal effective concentration; Hiyoshi = Hiyoshi Corporation; methoxychlor = methoxychlor weak positive control; RLU = relative light units
1 Statistically significant from zero at p < 0.05. 3 Values in italics have p values that are less than 0.05.
Results from the linear regression analysis of averaged non-adjusted DMSO control RLU values from each test plate are graphically presented in Figure 4-3. The slope of the linear regression, although appearing positive, was not significantly different from zero (p = 0.483, Table 4-3), demonstrating the intralaboratory reproducibility of the DMSO control.
Figure 4-3 Linear Regression of Agonist DMSO Controls Hiyoshi
0 5 10 15 20 25 30 35 40 450
1000
2000
3000
4000
5000
6000
7000
8000
Study Day Abbreviations: DMSO = dimethyl sulfoxide; Hiyoshi = Hiyoshi Corporation; RLU = relative light unit
Results from the linear regression analysis of E2 maximum fold-induction are graphically presented in Figure 4-4. The slope of the linear regression was not significantly different (p = 0.686, Table 4-3), demonstrating the intralaboratory reproducibility of plate induction.

Appendix C – Background Review Document
M-41
Figure 4-4 Linear Regression of E2 Maximum Fold-Induction at Hiyoshi
0 5 10 15 20 25 30 35 40 450
1
2
3
4
5
6
7
8
Study Day Abbreviations: E2 = 17ß-estradiol; Hiyoshi = Hiyoshi Corporation
Results from the linear regression analysis of E2 EC50 values are graphically presented in Figure 4-5. The slope of the linear regression was not significantly different (p = 0.793, Table 4-3), demonstrating the intralaboratory reproducibility of the EC50 control.
Figure 4-5 Linear Regression of E2 EC50 Values at Hiyoshi
0 5 10 15 20 25 30 35 40 450
1.0x10⁻⁶
2.0x10⁻⁶
3.0x10⁻⁶
4.0x10⁻⁶
5.0x10⁻⁶
Study Day Abbreviations: E2 = 17ß-estradiol; EC50 = half-maximal effective concentration; Hiyoshi = Hiyoshi Corporation
Results from the linear regression analysis of the averaged adjusted and normalized methoxychlor weak positive control RLU values from each test plate are graphically presented in Figure 4-6. The linear regression indicates that values are significantly different over time (p = 0.009, Table 4-3).
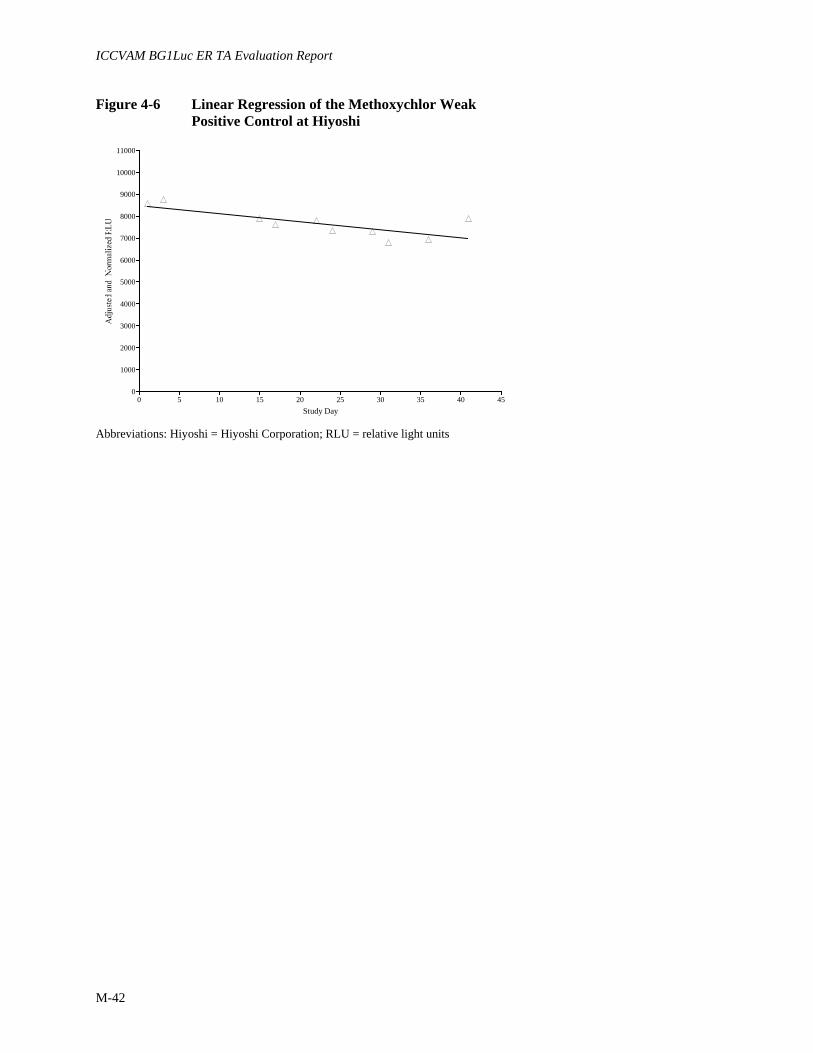
ICCVAM BG1Luc ER TA Evaluation Report
M-42
Figure 4-6 Linear Regression of the Methoxychlor Weak Positive Control at Hiyoshi
0 5 10 15 20 25 30 35 40 450
1000
2000
3000
4000
5000
6000
7000
8000
9000
10000
11000
Study Day Abbreviations: Hiyoshi = Hiyoshi Corporation; RLU = relative light units

Appendix C – Background Review Document
M-43
5.0 PHASE I AGONIST INTERLABORATORY REPRODUCIBILITY Averaged RLU values associated with the DMSO solvent control wells, the fold-induction of E2, the calculated E2 EC50 values, and the adjusted and normalized RLU values associated with the methoxychlor weak positive control wells from each laboratory as well as averaged values for these parameters from the Protocol Standardization Study are presented in Figure 5-1. The E2 reference standard concentration curves are similar in the three participating laboratories and are also very similar to the concentration curve produced during the Protocol Standardization Study. The line representing the DMSO Mean + 3X SD for each of the laboratories is also very similar (substances giving RLU values above this line are considered positive for agonist activity). Based on these results, it is expected that the identification of substances as either positive or negative for agonist activity will be similar across laboratories.
Figure 5-1 Comparison Figure of the Agonist Historical Database1,2,3
-7 -6 -5 -4 -3 -2 -1-2000
0
2000
4000
6000
8000
10000
12000Hiyoshi E2Hiyoshi Methoxychlor
ECVAM E2ECVAM Methoxychlor
Standardization E2
XDS E2XDS Methoxychlor
Standardization Methoxychlor
ECVAM DMSO Mean +3X SD
Hiyoshi DMSOMean +3X SD
XDS DMSO Mean+3X SD
Standardization DMSOMean +3X SD
Log Concentration (µg/mL)
Abbreviations: 3X SD = Three times the standard deviation from the mean; DMSO = dimethyl sulfoxide; E2 = 17ß-estradiol; ECVAM = European Centre for the Validation of Alternative Methods; Hiyoshi = Hiyoshi Corporation; methoxychlor = methoxychlor weak positive control; RLU = relative light units; standardization = data compiled during the BG1LUC4E2 ER TA Protocol Standardization Study; XDS = Xenobiotic Detection Systems, Inc.
1 The connecting line represents the concentration curve for the averaged adjusted relative light unit values for the E2 reference standard concentrations from all plates tested from the BG1LUC4E2 ER TA Protocol Standardization Study and the three laboratories.
2 The methoxychlor value represents the averaged adjusted relative light unit values for methoxychlor weak positive control from all plates tested from the BG1LUC4E2 ER TA Protocol Standardization Study and the three laboratories.
3 The horizontal lines represent the DMSO Mean + 3X SD from the BG1LUC4E2 ER TA Protocol Standardization Study and the three laboratories.
5.1 DMSO Control
Averaged unadjusted DMSO control RLU values were compared across laboratories as well as with the RLU values from the Protocol Standardization Study. Scatter plots of these values are presented in Figure 5-2.
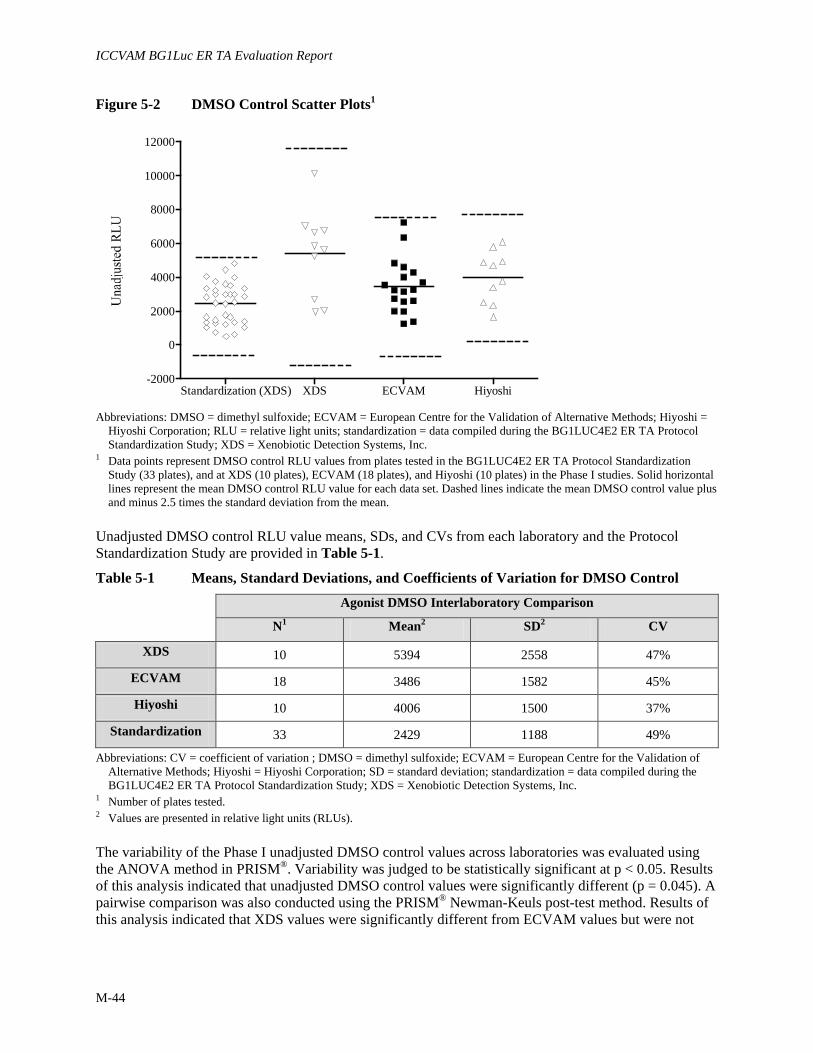
ICCVAM BG1Luc ER TA Evaluation Report
M-44
Figure 5-2 DMSO Control Scatter Plots1
Standardization (XDS) XDS ECVAM Hiyoshi-2000
0
2000
4000
6000
8000
10000
12000
Abbreviations: DMSO = dimethyl sulfoxide; ECVAM = European Centre for the Validation of Alternative Methods; Hiyoshi =
Hiyoshi Corporation; RLU = relative light units; standardization = data compiled during the BG1LUC4E2 ER TA Protocol Standardization Study; XDS = Xenobiotic Detection Systems, Inc.
1 Data points represent DMSO control RLU values from plates tested in the BG1LUC4E2 ER TA Protocol Standardization Study (33 plates), and at XDS (10 plates), ECVAM (18 plates), and Hiyoshi (10 plates) in the Phase I studies. Solid horizontal lines represent the mean DMSO control RLU value for each data set. Dashed lines indicate the mean DMSO control value plus and minus 2.5 times the standard deviation from the mean.
Unadjusted DMSO control RLU value means, SDs, and CVs from each laboratory and the Protocol Standardization Study are provided in Table 5-1.
Table 5-1 Means, Standard Deviations, and Coefficients of Variation for DMSO Control
Agonist DMSO Interlaboratory Comparison
N1 Mean2 SD2 CV
XDS 10 5394 2558 47%
ECVAM 18 3486 1582 45%
Hiyoshi 10 4006 1500 37%
Standardization 33 2429 1188 49%
Abbreviations: CV = coefficient of variation ; DMSO = dimethyl sulfoxide; ECVAM = European Centre for the Validation of Alternative Methods; Hiyoshi = Hiyoshi Corporation; SD = standard deviation; standardization = data compiled during the BG1LUC4E2 ER TA Protocol Standardization Study; XDS = Xenobiotic Detection Systems, Inc.
1 Number of plates tested. 2 Values are presented in relative light units (RLUs). The variability of the Phase I unadjusted DMSO control values across laboratories was evaluated using the ANOVA method in PRISM®. Variability was judged to be statistically significant at p < 0.05. Results of this analysis indicated that unadjusted DMSO control values were significantly different (p = 0.045). A pairwise comparison was also conducted using the PRISM® Newman-Keuls post-test method. Results of this analysis indicated that XDS values were significantly different from ECVAM values but were not

Appendix C – Background Review Document
M-45
significantly different from Hiyoshi values, and that ECVAM values were significantly different from Hiyoshi values (Table 5-2).
Table 5-2 Newman-Keuls Results for Agonist DMSO Control
Mean
Difference1 p-value2
XDS vs ECVAM 1908 <0.05 XDS vs Hiyoshi 1388 >0.05
ECVAM vs Hiyoshi -520 >0.05 Abbreviations: DMSO = Dimethyl sulfoxide; ECVAM = European Centre for the Validation of Alternative Methods; Hiyoshi =
Hiyoshi Corporation; XDS = Xenobiotic Detection Systems, Inc. 1 Values are presented in relative light units (RLUs) 2 Variability is statistically significant at p<0.05 - values in italics have p values that are less than 0.05. A comparison of unadjusted DMSO control RLU values from each laboratory was made with RLU values from the Protocol Standardization Study using the Dunnett’s test in PRISM®. Results of this analysis indicated that ECVAM values were not significantly different from values from the Protocol Standardization Study but that XDS and Hiyoshi values were significantly different (Table 5-3).
Table 5-3 Dunnett’s Results for Agonist DMSO Control1
Agonist DMSO Control
N2 Mean Difference3 p-value4
XDS 10 -2965 <0.01 ECVAM 18 -1057 >0.05 Hiyoshi 10 -1577 <0.05
Abbreviations: DMSO = dimethyl sulfoxide; ECVAM = European Centre for the Validation of Alternative Methods; Hiyoshi = Hiyoshi Corporation; XDS = Xenobiotic Detection Systems, Inc.
1 The results from the participating laboratories were compared to the results from the BG1LUC4E2 ER TA Protocol Standardization Study.
2 Number of plates tested
3 Values are presented in relative light units (RLUs)
4 Variability is statistically significant at p < 0.05 - values in italics have p values that are less than 0.05.
5.2 E2 Maximum Fold-Induction
The E2 maximum fold-induction values were compared across laboratories as well as with values from the Protocol Standardization Study. Scatter plots of these values are presented in Figure 5-3.
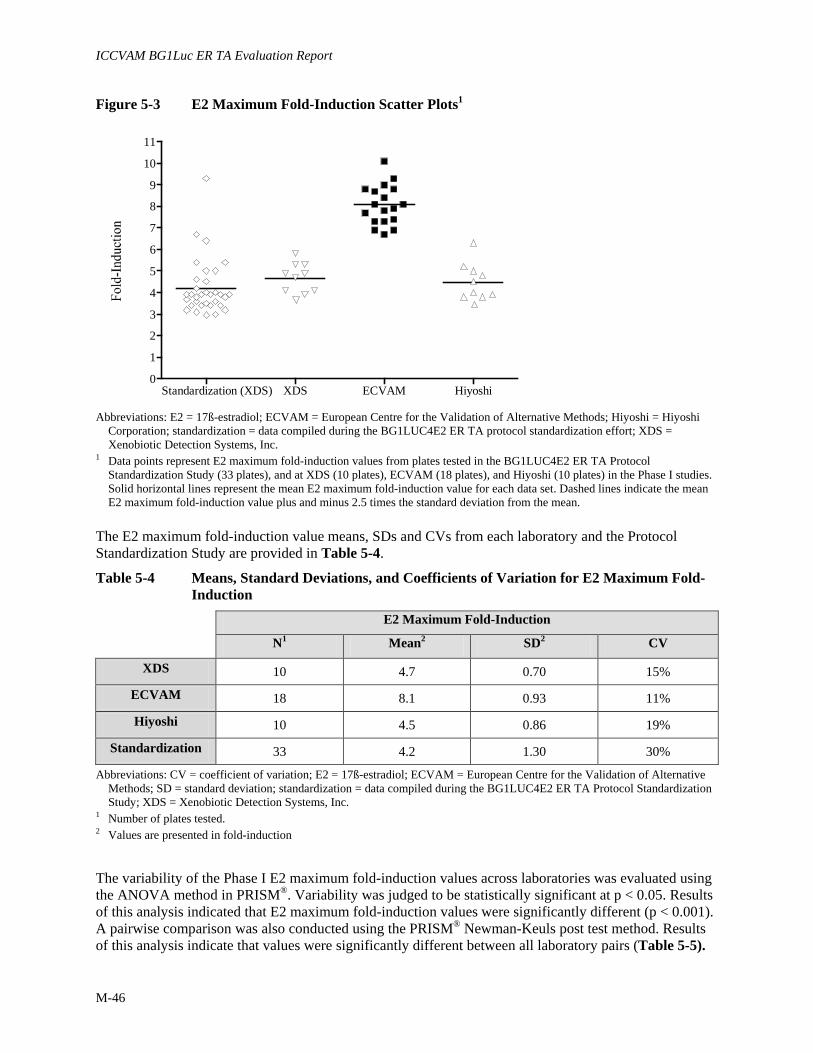
ICCVAM BG1Luc ER TA Evaluation Report
M-46
Figure 5-3 E2 Maximum Fold-Induction Scatter Plots1
Standardization (XDS) XDS ECVAM Hiyoshi0
1
2
3
4
5
6
7
8
9
10
11
Abbreviations: E2 = 17ß-estradiol; ECVAM = European Centre for the Validation of Alternative Methods; Hiyoshi = Hiyoshi
Corporation; standardization = data compiled during the BG1LUC4E2 ER TA protocol standardization effort; XDS = Xenobiotic Detection Systems, Inc.
1 Data points represent E2 maximum fold-induction values from plates tested in the BG1LUC4E2 ER TA Protocol Standardization Study (33 plates), and at XDS (10 plates), ECVAM (18 plates), and Hiyoshi (10 plates) in the Phase I studies. Solid horizontal lines represent the mean E2 maximum fold-induction value for each data set. Dashed lines indicate the mean E2 maximum fold-induction value plus and minus 2.5 times the standard deviation from the mean.
The E2 maximum fold-induction value means, SDs and CVs from each laboratory and the Protocol Standardization Study are provided in Table 5-4.
Table 5-4 Means, Standard Deviations, and Coefficients of Variation for E2 Maximum Fold-Induction
E2 Maximum Fold-Induction
N1 Mean2 SD2 CV
XDS 10 4.7 0.70 15%
ECVAM 18 8.1 0.93 11%
Hiyoshi 10 4.5 0.86 19%
Standardization 33 4.2 1.30 30%
Abbreviations: CV = coefficient of variation; E2 = 17ß-estradiol; ECVAM = European Centre for the Validation of Alternative Methods; SD = standard deviation; standardization = data compiled during the BG1LUC4E2 ER TA Protocol Standardization Study; XDS = Xenobiotic Detection Systems, Inc.
1 Number of plates tested. 2 Values are presented in fold-induction
The variability of the Phase I E2 maximum fold-induction values across laboratories was evaluated using the ANOVA method in PRISM®. Variability was judged to be statistically significant at p < 0.05. Results of this analysis indicated that E2 maximum fold-induction values were significantly different (p < 0.001). A pairwise comparison was also conducted using the PRISM® Newman-Keuls post test method. Results of this analysis indicate that values were significantly different between all laboratory pairs (Table 5-5).

Appendix C – Background Review Document
M-47
Table 5-5 Newman-Keuls Results for E2 Maximum Fold-Induction
Mean
Difference1 p-value2
XDS vs ECVAM -3.0 <0.001
XDS vs Hiyoshi 1.0 <0.05
ECVAM vs Hiyoshi 4.0 <0.001
Abbreviations: E2 = 17ß-estradiol; ECVAM = European Centre for the Validation of Alternative Methods; Hiyoshi = Hiyoshi Corporation; XDS = Xenobiotic Detection Systems, Inc.
1 Values are presented in fold-induction
2 Variability is statistically significant at p < 0.05 - values in italics have p values that are less than 0.05. A comparison of the E2 maximum fold-induction values from each laboratory was made with induction values from the Protocol Standardization Study using the Dunnett’s test in PRISM®. Results of this analysis indicated that XDS and Hiyoshi values were not statistically different than values from the Protocol Standardization Study (Table 5-6) but that ECVAM values were significantly different.
Table 5-6 Dunnett’s Results for E2 Maximum Fold-Induction1
Fold-Induction
N2 Mean Difference3 p-value4
XDS 10 -0.8 >0.05 ECVAM 18 -3.8 <0.01 Hiyoshi 10 0.2 >0.05
Abbreviations: E2 = 17ß-estradiol; ECVAM = European Centre for the Validation of Alternative Methods; Hiyoshi = Hiyoshi Corporation; XDS = Xenobiotic Detection Systems, Inc.
1 The results from the participating laboratories were compared to the results from the BG1LUC4E2 ER TA Protocol Standardization Study.
2 Number of plates tested. 3 Values are presented in relative light units (RLUs)
4 Variability is statistically significant at p < 0.05 - values in italics have p values that are less than 0.05.
5.3 E2 EC50
E2 EC50 values were compared across laboratories as well as with values from the Protocol Standardization Study. Scatter plots of these values are presented in Figure 5-4.

ICCVAM BG1Luc ER TA Evaluation Report
M-48
Figure 5-4 E2 EC50 Scatter Plots1
Standardization (XDS) XDS ECVAM Hiyoshi0
1.0x10⁻⁶
2.0x10⁻⁶
3.0x10⁻⁶
4.0x10⁻⁶
5.0x10⁻⁶
Abbreviations: E2 = 17ß-estradiol; EC50 = half-maximal effective concentration; ECVAM = European Centre for the Validation
of Alternative Methods; Hiyoshi = Hiyoshi Corporation; standardization = data compiled during the BG1LUC4E2 ER TA protocol standardization effort; XDS = Xenobiotic Detection Systems, Inc.
1Data points represent E2 EC50 values from plates tested in the BG1LUC4E2 ER TA Protocol Standardization Study (33 plates), and at XDS (10 plates), ECVAM (18 plates), and Hiyoshi (10 plates) in the Phase I studies. Solid horizontal lines represent the mean E2 EC50 value for each data set. Dashed lines indicate the mean E2 EC50 value plus and minus 2.5 times the standard deviation from the mean.
E2 EC50 value means, SDs and CVs from each laboratory and the Protocol Standardization Study are provided in Table 5-7.
Table 5-7 Means, Standard Deviations, and Coefficients of Variation for E2 EC50 Values
Agonist E2 EC50 Interlaboratory Comparison
N1 Mean SD CV
XDS 9 2.3 x 10⁻⁶ 4.5 x 10⁻⁷ 20%
ECVAM 18 2.3 x 10⁻⁶ 8.5 x 10⁻⁷ 37%
Hiyoshi 10 3.1 x 10⁻⁶ 7.9 x 10⁻⁷ 26%
Standardization 33 1.7 x 10⁻⁶ 7.6 x 10⁻⁷ 44%
Abbreviations: CV = coefficient of variation; E2 = 17ß-estradiol; EC50 = half-maximal effective concentration; ECVAM = European Centre for the Validation of Alternative Methods; Hiyoshi = Hiyoshi Corporation; SD = standard deviation; standardization = data compiled during the BG1LUC4E2 ER TA Protocol Standardization Study; XDS = Xenobiotic Detection Systems, Inc.
1 Number of plates tested.
The variability of the Phase I E2 EC50 values across laboratories was evaluated using the ANOVA method in PRISM®. Variability was judged to be statistically significant at p < 0.05. Results of this analysis indicated that E2 EC50 values were statistically significant (p < 0.001). A pairwise comparison was also conducted using the PRISM® Newman-Keuls post-test method. Results of this analysis indicated that XDS values were not significantly different from ECVAM values but were significantly different

Appendix C – Background Review Document
M-49
from Hiyoshi values, and that ECVAM values were significantly different from Hiyoshi values (Table 5-8).
Table 5-8 Newman-Keuls Results for E2 EC50 Values
Mean
Difference1 p-value2
XDS vs ECVAM 0.3 x 10⁻⁷ >0.05
XDS vs Hiyoshi -7.8 x 10⁻⁷ <0.05
ECVAM vs Hiyoshi -8.1 x 10⁻⁷ <0.05
Abbreviations: E2 = 17ß-estradiol; EC50 = half-maximal inhibitory concentration; ECVAM = European Centre for the Validation of Alternative Methods; Hiyoshi = Hiyoshi Corporation; XDS = Xenobiotic Detection Systems, Inc.
1 Presented in µg/mL
2 Variability is statistically significant at p<0.05
A comparison of E2 EC50 values from each laboratory was made with values from the Protocol Standardization Study using the Dunnett’s test in PRISM®. Results of this analysis indicated that ECVAM values were not significantly different from values from the Protocol Standardization Study but that XDS and Hiyoshi values were significantly different (Table 5-9).
Table 5-9 Dunnett’s Results for E2 EC50 Values1
E2 EC50
N2 Mean Difference p value3
XDS 9 -5.7 x 10⁻⁷ >0.05
ECVAM 18 -5.3 x 10⁻⁷ >0.05
Hiyoshi 10 -13.4 x 10⁻⁷ <0.01
Abbreviations: E2 = 17ß-estradiol; EC50 = half-maximal inhibitory concentration; ECVAM = European Centre for the Validation of Alternative Methods; Hiyoshi = Hiyoshi Corporation; XDS = Xenobiotic Detection Systems, Inc.
1 The results from the participating laboratories were compared to the results from the BG1LUC4E2 ER TA Protocol Standardization Study.
2 Number of plates tested. 3 Variability is statistically significant at p<0.05 - values in Italics have p values that are less than 0.05. 5.4 Methoxychlor Weak Positive Control
Adjusted and normalized methoxychlor control RLU values were compared across laboratories as well as with values from the Protocol Standardization Study. Scatter plots of these values are presented in Figure 5-5.
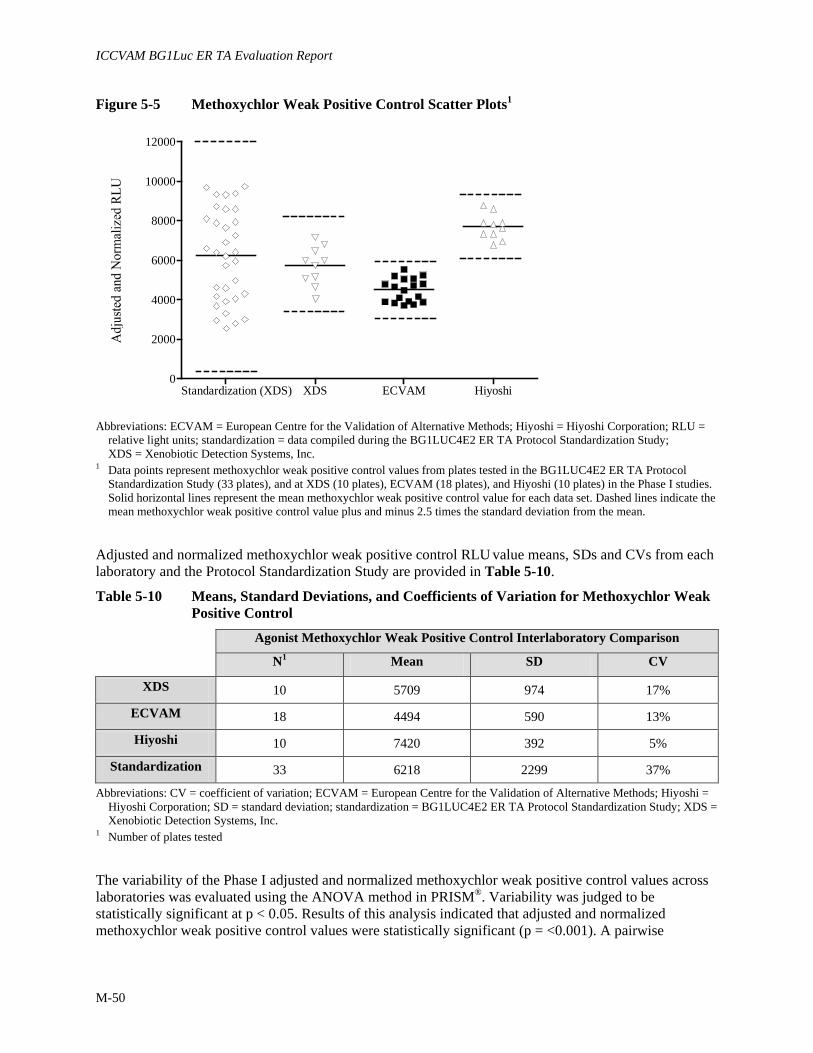
ICCVAM BG1Luc ER TA Evaluation Report
M-50
Figure 5-5 Methoxychlor Weak Positive Control Scatter Plots1
Standardization (XDS) XDS ECVAM Hiyoshi0
2000
4000
6000
8000
10000
12000
Abbreviations: ECVAM = European Centre for the Validation of Alternative Methods; Hiyoshi = Hiyoshi Corporation; RLU =
relative light units; standardization = data compiled during the BG1LUC4E2 ER TA Protocol Standardization Study; XDS = Xenobiotic Detection Systems, Inc.
1 Data points represent methoxychlor weak positive control values from plates tested in the BG1LUC4E2 ER TA Protocol Standardization Study (33 plates), and at XDS (10 plates), ECVAM (18 plates), and Hiyoshi (10 plates) in the Phase I studies. Solid horizontal lines represent the mean methoxychlor weak positive control value for each data set. Dashed lines indicate the mean methoxychlor weak positive control value plus and minus 2.5 times the standard deviation from the mean.
Adjusted and normalized methoxychlor weak positive control RLU value means, SDs and CVs from each laboratory and the Protocol Standardization Study are provided in Table 5-10.
Table 5-10 Means, Standard Deviations, and Coefficients of Variation for Methoxychlor Weak Positive Control
Agonist Methoxychlor Weak Positive Control Interlaboratory Comparison
N1 Mean SD CV
XDS 10 5709 974 17%
ECVAM 18 4494 590 13%
Hiyoshi 10 7420 392 5%
Standardization 33 6218 2299 37%
Abbreviations: CV = coefficient of variation; ECVAM = European Centre for the Validation of Alternative Methods; Hiyoshi = Hiyoshi Corporation; SD = standard deviation; standardization = BG1LUC4E2 ER TA Protocol Standardization Study; XDS = Xenobiotic Detection Systems, Inc.
1 Number of plates tested The variability of the Phase I adjusted and normalized methoxychlor weak positive control values across laboratories was evaluated using the ANOVA method in PRISM®. Variability was judged to be statistically significant at p < 0.05. Results of this analysis indicated that adjusted and normalized methoxychlor weak positive control values were statistically significant (p = <0.001). A pairwise

Appendix C – Background Review Document
M-51
comparison was also conducted using the PRISM® Newman-Keuls post test method. Results of this analysis indicate that values were significantly different between all laboratory pairs (Table 5-11).
Table 5-11 Newman-Keuls Results for Methoxychlor Weak Positive Control
Mean
Difference1 p-value2
XDS vs ECVAM 1215 <0.001
XDS vs Hiyoshi -1983 <0.001
ECVAM vs Hiyoshi -3198 <0.001
Abbreviations: ECVAM = European Centre for the Validation of Alternative Methods; Hiyoshi = Hiyoshi Corporation; XDS = Xenobiotic Detection Systems, Inc.
1 Presented in adjusted relative light units
2 Variability is statistically significant at p < 0.05 - values in italics have p values that are less than 0.05. A comparison of adjusted and normalized methoxychlor weak positive control RLU values from each laboratory was made with values from the Protocol Standardization Study using the Dunnett’s test in PRISM®. Results of this analysis indicated that XDS values were not significantly different from values from the Protocol Standardization Study but that ECVAM and Hiyoshi values were significantly different (Table 5-12).
Table 5-12 Dunnett’s Results for Methoxychlor Weak Positive Control1
Methoxychlor Weak Positive Control
N2 Mean Difference p-value3
XDS 10 509 >0.05
ECVAM 18 1724 <0.01
Hiyoshi 10 -1474 <0.05
Abbreviations: ECVAM = The European Centre for the Validation of Alternative Methods; Hiyoshi = Hiyoshi Corporation; XDS = Xenobiotic Detection Systems, Inc.
1 The results from the participating laboratories were compared to the results from the BG1LUC4E2 ER TA Protocol Standardization Study.
2 Number of plates tested
3 Variability is statistically significant at p < 0.05 - values in italics have p values that are less than 0.05.
5.5 Variability of Agonist Reference Standard and Controls
Statistically significant differences were observed in intra- and interlaboratory agonist reference standard and control values. It was not possible to identify the causes for these differences but some of the contributing factors may be lot-to-lot differences in cell culture media and tissue culture supplies (for intra- and interlaboratory differences) and differences in luminometers (for interlaboratory differences). This underscores the importance of developing an historical database for each individual laboratory. Although significant differences were observed for intra- and interlaboratory agonist reference standard and control values, the results of Phase I agonist testing demonstrates the reliability of the assay as follows:
• The assay responds robustly to E2 reference estrogen
ICCVAM BG1Luc ER TA Evaluation Report
M-52
• The assay consistently responds to the methoxychlor weak positive control, which is tested at a concentration several orders of magnitude higher than the E2 reference estrogen
• The assay E2 maximum fold-induction values were consistently greater that three-fold (only 2 of 40 agonist plates tested had values below three-fold)
• Phase I testing of agonist reference standard and controls established historical databases that produced comparable test plate acceptance criteria for Phase IIa testing.
5.6 Historical Database for Phase IIa Agonist Testing
The acceptance or rejection of agonist tests to be conducted in Phase IIa will be based on the evaluation of test plate reference standard and control results. Results will be compared to acceptance criteria derived from the historical databases established from Phase I testing at each laboratory. Agonist test plate acceptance criteria to be used in Phase IIa for range finder testing is summarized as follows:
• Plate induction, as measured by dividing the averaged highest E2 reference standard RLU value by the averaged DMSO control value, must be greater than three-fold.
• DMSO control RLU values must be within 2.5 times the SD of the historical DMSO control value.
Agonist test plate acceptance criteria to be used in Phase IIa for comprehensive testing is summarized as follows:
• Plate induction, as measured by dividing the averaged highest E2 reference standard RLU value by the averaged DMSO control value, must be greater than three-fold.
• E2 EC50 values must be within 2.5 times the SD of the historical database E2 EC50 value. • DMSO control RLU values must be within 2.5 times the SD of the historical DMSO control value. • Methoxychlor weak positive control RLU values must be within 2.5 times the SD of the historical
methoxychlor weak positive control value.
The acceptance criteria derived from the historical databases established from Phase I testing at each laboratory is provided in Table 5-13.

Appendix C – Background Review Document
M-53
Table 5-13 Agonist Historical Database Values Established for Phase IIa Acceptance Criteria
XDS
Units Mean SD Mean Plus 2.5
Times SD
Mean Minus 2.5
Times SD
DMSO RLU 5394 2558 11789 0* E2 EC50 µg/mL 2.3 x 10⁻⁶ 4.5 x 10⁻⁷ 3.4 x 10⁻⁶ 1.2 x 10⁻⁶
Methoxychlor Adjusted RLU 5709 974 8144 3274
ECVAM
Units Mean SD Mean Plus 2.5
Times SD
Mean Minus 2.5
Times SD
DMSO RLU 3486 1582 7441 0*
E2 EC50 µg/mL 2.7 x 10⁻⁶ 8.5 x 10⁻⁷ 4.8 x 10⁻⁶ 1.9 x 10⁻⁶
Methoxychlor Adjusted RLU 4494 590 5969 3019
Hiyoshi
Units Mean SD Mean Plus 2.5
Times SD
Mean Minus 2.5
Times SD
DMSO RLU 4006 1500 7756 256
E2 EC50 µg/mL 3.1 x 10⁻⁶ 7.9 x 10⁻⁷ 5.1 x 10⁻⁶ 1.1 x 10⁻⁶
Methoxychlor Adjusted RLU 7420 392 8399 6441
Abbreviations: DMSO = dimethyl sulfoxide; E2 = 17β-estradiol; EC50 = half-maximal effective concentration; ECVAM = The European Centre for the Validation of Alternative Methods; Hiyoshi = Hiyoshi Corporation; methoxychlor = methoxychlor weak positive control; RLU = relative light units; SD = standard deviation; XDS = Xenobiotic Detection Systems, Inc.
* Unadjusted DMSO control values can not be below zero.

ICCVAM BG1Luc ER TA Evaluation Report
M-54
6.0 PHASE I TESTING OF ANTAGONIST REFERENCE STANDARD AND CONTROLS AT XDS
6.1 The Revised Antagonist Range Finder Plate Design
Range finder testing in the BG1LUC4E2 ER TA antagonist assay is used to select the starting concentration for the comprehensive testing of substances being evaluated for anti-estrogenic activity. The plate layout for reference standards and the different controls used for antagonist range finder testing in the Protocol Standardization Study limited testing to log serial dilutions for five substances, with each concentration tested in a single well only (see Figure B-2 in Appendix B). However, this methodology resulted in studies where the selection of the starting concentration to be used for comprehensive testing was problematic. To minimize this problem in future studies, the study design for antagonist range finder testing was made more robust by testing duplicates of each test substance concentration. However, this change resulted in a reduction in the number of substances that could be tested on a single plate when using the standard plate configuration which excluded using outer wells. In order to increase efficiency, the plate designs were modified to use all 96 wells to run reference standard, controls and test substances. To evaluate whether using the outer wells would bias the data due to edging effects, tamoxifen (CASRN 10540-29-1) was tested over a seven-point log serial dilution concentration range (50 µg/mL – 5 x10⁻⁵ µg/mL) in each plate column using the modified plate design. Results of this testing demonstrated that although there are statistical differences between the level of RLUs in the outer and inner wells, these differences do not impact selection of the appropriate starting concentration for comprehensive testing (see Appendix B, Section 2-1 for results and discussion of edging effects testing with tamoxifen). The modified plate design allows for the range finder testing of six test compounds in duplicate (see Figure B-4 in Appendix B). The reference standard and vehicle control used in the modified agonist range finder plate configuration are:
• Reference standard for range finder testing: Raloxifene HCl (CASRN 84449-90-1 [Ral] at three concentrations (1.56 x 10⁻³, 3.91 x 10⁻⁴, and 9.77 x 10⁻⁵ µg/mL) plus a fixed concentration of E2 (2.5 x 10⁻⁵ µg/mL) in duplicate wells (range finder Ral/E2 reference standard).
• Vehicle control: DMSO (1% v/v) in tissue culture media run in three replicate wells (DMSO control). • E2 control: E2 (2.5 x 10⁻⁵ µg/mL) in tissue culture media used as a base line control run in three
replicate wells (E2 control).
At XDS, in Phase I, the modified range finder plate design was run in seven separate 96-well plates. Test plate acceptance criteria was based on the maximum fold-reduction of Ral/E2 (i.e., the highest average Ral/E2 RLU divided by the lowest average Ral/E2 RLU value must be greater than three-fold). Testing was conducted according to the 11 June 2007 version of BG1LUC4E2 ER TA agonist protocol (Appendix F), which was revised to reflect the modified range finder plate design using the outer wells in plate row H to run the duplicate three point Ral/E2 reference standard, the three DMSO control replicates, and the three E2 replicates. Testing indicated that the duplicate three point Ral/E2 reference standard produced a repeatable concentration response curve (Figure 6-1) that consistently exceeded the three-fold plate reduction requirement (Figure 6-2), therefore demonstrating the acceptability of the revised plate configuration using outside wells for range finder reference standard and controls.

Appendix C – Background Review Document
M-55
Figure 6-1 Revised Antagonist Range Finder Ral/E2 Reference Standard1
-4.3 -3.9 -3.5 -3.1 -2.7-2000
0
2000
4000
6000
8000
1000019-Jul-07a19-Jul-07b19-Jul-07c19-Jul-07d03-Aug-07a03-Aug-07b03-Aug-07c
Log Ral/E2 Concentration ( µg/mL)
Abbreviations: E2 = 17ß-estradiol; Ral = raloxifene HCl; RLU = relative light units 1 The solid connecting line represents the concentration curve for the averaged relative light unit (RLU) values for the 3-point
range finder Ral/E2 reference standard concentrations from each plate tested.
Figure 6-2 Ral\E2 Maximum Fold-Reduction Values for the Revised Antagonist Range Finder Plates1
0
1
2
3
4
5
Abbreviations: E2 = 17ß-estradiol; Ral = raloxifene HCl 1 Bars represent fold-reduction (the highest averaged Ral/E2 RLU value from the 3-point Ral/E2 reference standard divided by
the lowest averaged Ral/E2 RLU value from the 3-point Ral/E2 reference standard) from each range finder plate tested.

ICCVAM BG1Luc ER TA Evaluation Report
M-56
6.2 The Revised Antagonist Comprehensive Testing Plate Design
To increase the testing efficiency of the BG1LUC4E2 ER TA assay, it was proposed that the plate layouts for antagonist comprehensive testing also be revised to use all 96 wells (see Figure B-10 in Appendix B). To evaluate whether using the outer wells would bias the data due to edging effects, EC50 values were calculated for the seven point logarithmic serial dilutions of BPA tested in each plate column using the modified range finder plate configuration described above (Section 2.1). Based on the results described in Sections 2.1 and 2.2 for BPA EC50 values, which indicated that there were no significant differences for EC50 values between inner and outer wells, biologically significant differences in comprehensive testing results for the antagonist protocol (i.e., IC50
2
Testing of antagonist reference standard and controls to demonstrate proficiency with the modified antagonist protocol and to establish a historical database was conducted at XDS using the modified plate design according to procedures in the updated 2 August 2007 (Appendix H) version of BG1LUC4E2 ER TA agonist protocol. The reference standard and controls used to test the modified plate design for comprehensive testing were:
values) are not anticipated. This allows for the testing of 11-point double serial dilutions of two substances in triplicate, instead of only one substance as would occur if the original plate configuration was used (see Figure B-8 in Appendix B).
• Reference standard: Ral, double serial dilutions consisting of nine concentrations plus a fixed concentration (2.5 x 10⁻⁵ µg/mL) of E2 in duplicate wells (Ral/E2 reference standard) (Table 6-1)
• Vehicle control: DMSO (1% v/v) in tissue culture media run in four replicate wells DMSO control). • E2 control: E2 (2.5 x 10⁻⁵ µg/mL) in tissue culture media used as a base line control run in four
replicate wells (E2 control). • Weak positive control: flavone (CASRN 525-82-6) (25 µg/mL) with E2 (2.5 x 10⁻⁵ µg/mL) in tissue
culture media used as a weak positive control run in four replicate wells (flavone/E2 control).
Table 6-1 Concentrations of the Ral/E2 Reference Standard Used in Comprehensive Testing
Raloxifene
Concentrations1 E2 Concentrations
1.25 x 10⁻² 2.5 x 10⁻⁵
6.25 x 10⁻³ 2.5 x 10⁻⁵
3.13 x 10⁻³ 2.5 x 10⁻⁵
1.56 x 10⁻³ 2.5 x 10⁻⁵
7.81 x 10⁻⁴ 2.5 x 10⁻⁵
3.91 x 10⁻⁴ 2.5 x 10⁻⁵
1.95 x 10⁻⁴ 2.5 x 10⁻⁵
9.77 x 10⁻⁵ 2.5 x 10⁻⁵
4.88 x 10⁻⁵ 2.5 x 10⁻⁵
Abbreviations: E2 = 17ß-estradiol; Ral = raloxifene HCl 1 Concentrations are presented in µg/mL.
2 IC50 = concentration of the test substance inhibiting the reference estrogen response by 50%
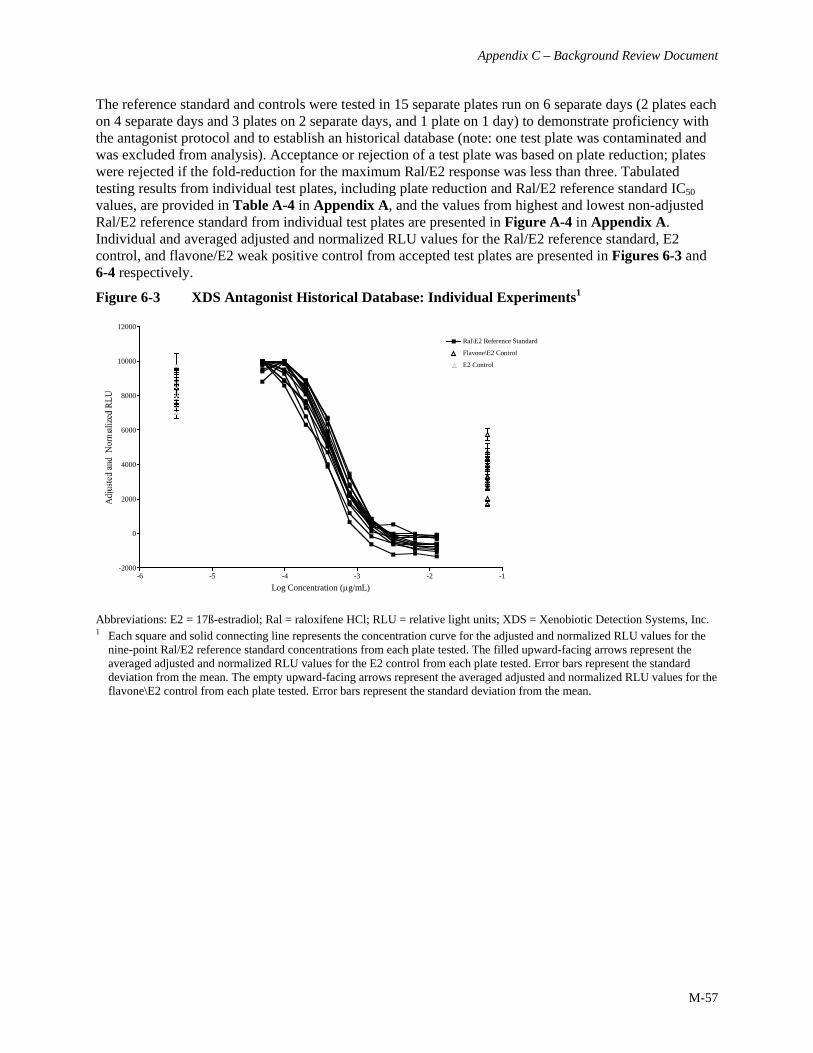
Appendix C – Background Review Document
M-57
The reference standard and controls were tested in 15 separate plates run on 6 separate days (2 plates each on 4 separate days and 3 plates on 2 separate days, and 1 plate on 1 day) to demonstrate proficiency with the antagonist protocol and to establish an historical database (note: one test plate was contaminated and was excluded from analysis). Acceptance or rejection of a test plate was based on plate reduction; plates were rejected if the fold-reduction for the maximum Ral/E2 response was less than three. Tabulated testing results from individual test plates, including plate reduction and Ral/E2 reference standard IC50 values, are provided in Table A-4 in Appendix A, and the values from highest and lowest non-adjusted Ral/E2 reference standard from individual test plates are presented in Figure A-4 in Appendix A. Individual and averaged adjusted and normalized RLU values for the Ral/E2 reference standard, E2 control, and flavone/E2 weak positive control from accepted test plates are presented in Figures 6-3 and 6-4 respectively.
Figure 6-3 XDS Antagonist Historical Database: Individual Experiments1
-6 -5 -4 -3 -2 -1-2000
0
2000
4000
6000
8000
10000
12000
Ral\E2 Reference Standard
Flavone\E2 Control
E2 Control
Log Concentration (µg/mL) Abbreviations: E2 = 17ß-estradiol; Ral = raloxifene HCl; RLU = relative light units; XDS = Xenobiotic Detection Systems, Inc. 1 Each square and solid connecting line represents the concentration curve for the adjusted and normalized RLU values for the
nine-point Ral/E2 reference standard concentrations from each plate tested. The filled upward-facing arrows represent the averaged adjusted and normalized RLU values for the E2 control from each plate tested. Error bars represent the standard deviation from the mean. The empty upward-facing arrows represent the averaged adjusted and normalized RLU values for the flavone\E2 control from each plate tested. Error bars represent the standard deviation from the mean.

ICCVAM BG1Luc ER TA Evaluation Report
M-58
Figure 6-4 XDS Antagonist Historical Database: Averaged Experiments
-6 -5 -4 -3 -2 -1-2000
0
2000
4000
6000
8000
10000
12000
Averaged Ral/E2Reference Standard
Averaged E2Averaged Flavone/E2
Log Concentration (µg/mL) Abbreviations: E2 = 17ß-estradiol; Ral = raloxifene HCl; RLU = relative light units; XDS = Xenobiotic Detection Systems, Inc. 1 The solid connecting line represents the concentration curve for the averaged adjusted and normalized RLU values for the
nine-point Ral/E2 reference standard concentrations from all plates tested. The E2 value represents the averaged adjusted and normalized RLU values for the E2 control from all plates tested. The flavone/E2 value represents the averaged adjusted and normalized RLU values for the flavone/E2 control from all plates tested. Error bars represent the standard error of the mean.
6.3 Evaluation of Intralaboratory Reproducibility at XDS
The within-day and across-day reproducibility of the RLU values associated with the DMSO solvent control wells, the fold-reduction of Ral/E2 at its maximum response, the calculated Ral/E2 IC50 values, and the adjusted and normalized RLU values associated with the E2 control and flavone/E2 weak positive control have been statistically analyzed. RLU values from plate controls using three or more replicate wells (i.e., DMSO , E2 and flavone/E2 weak positive controls) were evaluated using the Q test (see Section 13.5.3 in the BG1LUC4E2 ER TA antagonist protocol in Appendix H) to identify outliers before calculating test plate averages for the respective controls. None of the replicate wells produced RLU values that were considered as outliers by the Q test. Averaged reference standard and control values were also evaluated using the Q test to identify outliers when three of more plates were tested on a given day. None of the plates produced RLU values that were considered as outliers by the Q test. CVs were determined for reference standard and control values to assess relative plate to plate variability. To assess the intralaboratory reproducibility of the reference standard and the control values across time, a linear regression analysis was conducted using the least squares method in PRISM®. Lastly, the variability of reference standard and control values from test plates run on the same day was compared to the variability of test plates run across days by conducting an ANOVA using PRISM®.
6.3.1 Coefficients of Variation
The means, SDs and CVs for DMSO control, Ral/E2 maximum fold-reduction, Ral/E2 IC50, and E2 and flavone/E2 weak positive control values from the 14 plates tested are provided in Table 6-2.
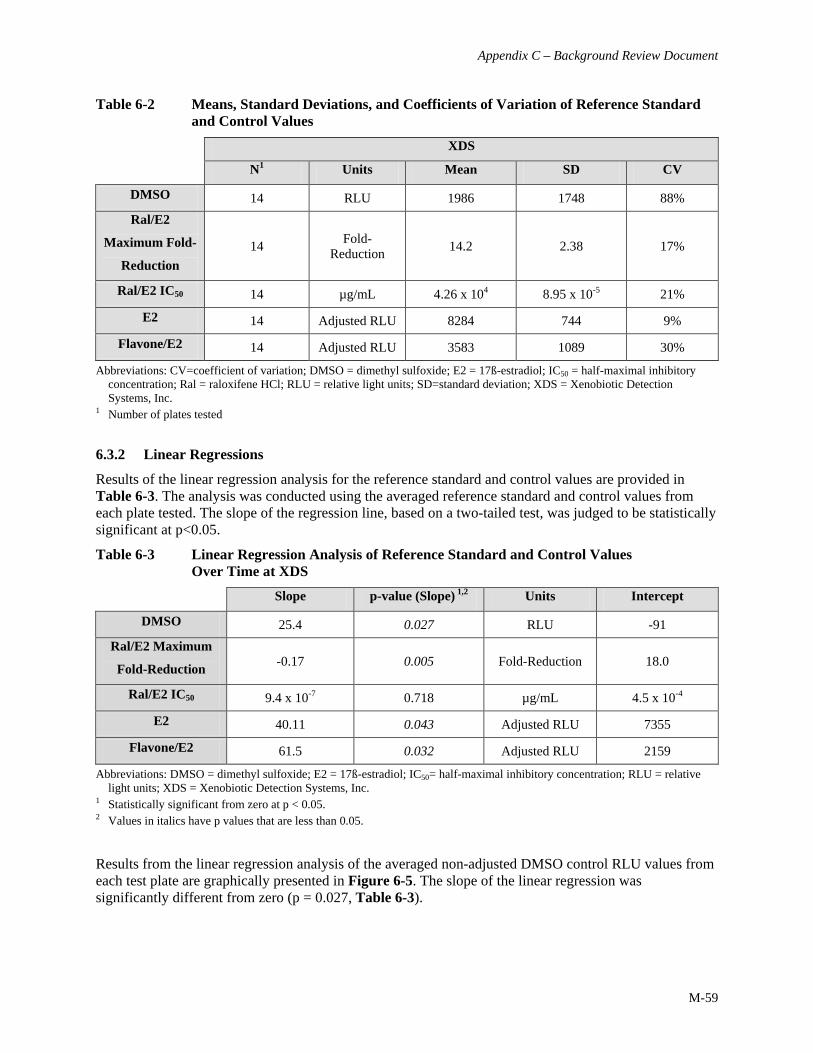
Appendix C – Background Review Document
M-59
Table 6-2 Means, Standard Deviations, and Coefficients of Variation of Reference Standard and Control Values
XDS
N1 Units Mean SD CV
DMSO 14 RLU 1986 1748 88% Ral/E2
Maximum Fold-
Reduction 14 Fold-
Reduction 14.2 2.38 17%
Ral/E2 IC50 14 µg/mL 4.26 x 10⁴ 8.95 x 10⁻⁵ 21%
E2 14 Adjusted RLU 8284 744 9%
Flavone/E2 14 Adjusted RLU 3583 1089 30%
Abbreviations: CV=coefficient of variation; DMSO = dimethyl sulfoxide; E2 = 17ß-estradiol; IC50 = half-maximal inhibitory concentration; Ral = raloxifene HCl; RLU = relative light units; SD=standard deviation; XDS = Xenobiotic Detection Systems, Inc.
1 Number of plates tested
6.3.2 Linear Regressions
Results of the linear regression analysis for the reference standard and control values are provided in Table 6-3. The analysis was conducted using the averaged reference standard and control values from each plate tested. The slope of the regression line, based on a two-tailed test, was judged to be statistically significant at p<0.05.
Table 6-3 Linear Regression Analysis of Reference Standard and Control Values Over Time at XDS
Slope p-value (Slope) 1,2 Units Intercept
DMSO 25.4 0.027 RLU -91 Ral/E2 Maximum
Fold-Reduction -0.17 0.005 Fold-Reduction 18.0
Ral/E2 IC50 9.4 x 10⁻⁷ 0.718 µg/mL 4.5 x 10⁻⁴
E2 40.11 0.043 Adjusted RLU 7355
Flavone/E2 61.5 0.032 Adjusted RLU 2159
Abbreviations: DMSO = dimethyl sulfoxide; E2 = 17ß-estradiol; IC50= half-maximal inhibitory concentration; RLU = relative light units; XDS = Xenobiotic Detection Systems, Inc.
1 Statistically significant from zero at p < 0.05. 2 Values in italics have p values that are less than 0.05.
Results from the linear regression analysis of the averaged non-adjusted DMSO control RLU values from each test plate are graphically presented in Figure 6-5. The slope of the linear regression was significantly different from zero (p = 0.027, Table 6-3).

ICCVAM BG1Luc ER TA Evaluation Report
M-60
Figure 6-5 Linear Regression of Antagonist DMSO Controls at XDS
0 5 10 15 20 25 30 35-1000
0
1000
2000
3000
Study Day Abbreviations: DMSO = dimethyl sulfoxide; RLU = relative light units; XDS = Xenobiotic Detection Systems, Inc.
Results from the linear regression analysis of Ral/E2 maximum fold-reduction are graphically presented in Figure 6-6. The slope of the linear regression was significantly different from zero (p = 0.005, Table 6-3).
Figure 6-6 Linear Regression of Ral/E2 Maximum Fold-Reduction at XDS
0 5 10 15 20 25 30 350
2
4
6
8
10
12
14
16
18
20
Study Day Abbreviations: E2 = 17ß-estradiol; Ral = raloxifene HCl; XDS = Xenobiotic Detection Systems, Inc.
Results from the linear regression analysis of Ral/E2 IC50 values are graphically presented in Figure 6-7. The slope of the linear regression was not significantly different from zero (p = 0.718, Table 6-3), demonstrating the intralaboratory reproducibility of Ral/E2 IC50 values.

Appendix C – Background Review Document
M-61
Figure 6-7 Linear Regression of Ral/E2 IC50 at XDS
0 5 10 15 20 25 300
1.0x10⁻⁴
2.0x10⁻⁴
3.0x10⁻⁴
4.0x10⁻⁴
5.0x10⁻⁴
6.0x10⁻⁴
7.0x10⁻⁴
8.0x10⁻⁴
Study Day Abbreviations: E2 = 17ß-estradiol; Ral = raloxifene HCl; IC50 = half-maximal inhibitory concentration; XDS = Xenobiotic
Detection Systems, Inc.
Results from the linear regression analysis of the averaged adjusted and normalized E2 control RLU values from each test plate are graphically presented in Figure 6-8. The slope of the linear regression was significantly different from zero (p = 0.043, Table 6-3).
Figure 6-8 Linear Regression of the E2 Control at XDS
0 5 10 15 20 25 30 350
1000
2000
3000
4000
5000
6000
7000
8000
9000
10000
11000
Study Day Abbreviations: E2 = 17ß-estradiol; RLU = relative light units; XDS = Xenobiotic Detection Systems, Inc. Results from the linear regression analysis of the averaged adjusted and normalized flavone/E2 control RLU values from each test plate are graphically presented in Figure 6-9. The slope of the linear regression was significantly different from zero (p = 0.032, Table 6-3).

ICCVAM BG1Luc ER TA Evaluation Report
M-62
Figure 6-9 Linear Regression of the Flavone/E2 Weak Positive Control at XDS
0 5 10 15 20 25 30 350
1000
2000
3000
4000
5000
Study Day Abbreviations: E2 = 17ß-estradiol; RLU = relative light units; XDS = Xenobiotic Detection Systems, Inc.
6.3.3 Analysis of Variance
The results of the ANOVA comparing the variability of reference standard and control values from test plates run on same day to values from test plates run across days is provided in Table 6-4. The analysis was conducted using the averaged reference standard and control values from each plate tested. Variability is statistically significant at p < 0.05. Results from the analysis indicated that within-day variability was not significantly different from between-day variability for Ral/E2 maximum fold-reduction but was significantly different for DMSO control, E2 control, flavone/E2 weak positive control and Ral/E2 IC50 values.
Table 6-4 ANOVA Results of Antagonist Intralaboratory Reproducibility at XDS
p-Value1,2 F Value3
DMSO <0.001 213 Ral/E2 Maximum Fold-
Reduction 0.22 1.8
Ral/E2 IC50 0.02 5.2
E2 0.004 8.6
Flavone/E2 0.02 5.1
Abbreviation: ANOVA = analysis of variance; DMSO = dimethyl sulfoxide; E2 = 17ß-estradiol; IC50 = half-maximal inhibitory concentration; Ral = raloxifene HCl; XDS = Xenobiotic Detection Systems, Inc.
1 Variability is statistically significant at p < 0.05
2 Values in italics have p values that are less than 0.05. 3 F = ratio of between-day variability to within-day variability – a ratio of 1.0 indicates that the within-day variability to
between-day variability is equal and a ratio of zero indicates that all means are equal.
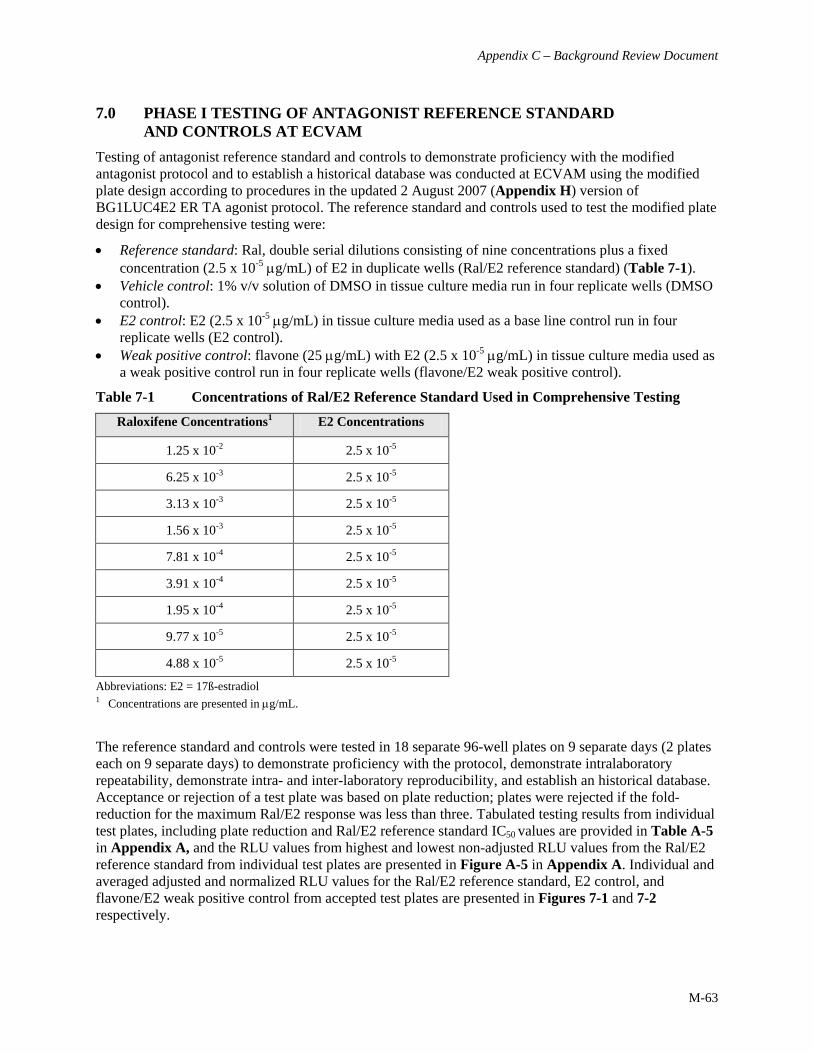
Appendix C – Background Review Document
M-63
7.0 PHASE I TESTING OF ANTAGONIST REFERENCE STANDARD AND CONTROLS AT ECVAM
Testing of antagonist reference standard and controls to demonstrate proficiency with the modified antagonist protocol and to establish a historical database was conducted at ECVAM using the modified plate design according to procedures in the updated 2 August 2007 (Appendix H) version of BG1LUC4E2 ER TA agonist protocol. The reference standard and controls used to test the modified plate design for comprehensive testing were:
• Reference standard: Ral, double serial dilutions consisting of nine concentrations plus a fixed concentration (2.5 x 10⁻⁵ µg/mL) of E2 in duplicate wells (Ral/E2 reference standard) (Table 7-1).
• Vehicle control: 1% v/v solution of DMSO in tissue culture media run in four replicate wells (DMSO control).
• E2 control: E2 (2.5 x 10⁻⁵ µg/mL) in tissue culture media used as a base line control run in four replicate wells (E2 control).
• Weak positive control: flavone (25 µg/mL) with E2 (2.5 x 10⁻⁵ µg/mL) in tissue culture media used as a weak positive control run in four replicate wells (flavone/E2 weak positive control).
Table 7-1 Concentrations of Ral/E2 Reference Standard Used in Comprehensive Testing
Raloxifene Concentrations1 E2 Concentrations
1.25 x 10⁻² 2.5 x 10⁻⁵
6.25 x 10⁻³ 2.5 x 10⁻⁵
3.13 x 10⁻³ 2.5 x 10⁻⁵
1.56 x 10⁻³ 2.5 x 10⁻⁵
7.81 x 10⁻⁴ 2.5 x 10⁻⁵
3.91 x 10⁻⁴ 2.5 x 10⁻⁵
1.95 x 10⁻⁴ 2.5 x 10⁻⁵
9.77 x 10⁻⁵ 2.5 x 10⁻⁵
4.88 x 10⁻⁵ 2.5 x 10⁻⁵
Abbreviations: E2 = 17ß-estradiol 1 Concentrations are presented in µg/mL. The reference standard and controls were tested in 18 separate 96-well plates on 9 separate days (2 plates each on 9 separate days) to demonstrate proficiency with the protocol, demonstrate intralaboratory repeatability, demonstrate intra- and inter-laboratory reproducibility, and establish an historical database. Acceptance or rejection of a test plate was based on plate reduction; plates were rejected if the fold-reduction for the maximum Ral/E2 response was less than three. Tabulated testing results from individual test plates, including plate reduction and Ral/E2 reference standard IC50 values are provided in Table A-5 in Appendix A, and the RLU values from highest and lowest non-adjusted RLU values from the Ral/E2 reference standard from individual test plates are presented in Figure A-5 in Appendix A. Individual and averaged adjusted and normalized RLU values for the Ral/E2 reference standard, E2 control, and flavone/E2 weak positive control from accepted test plates are presented in Figures 7-1 and 7-2 respectively.
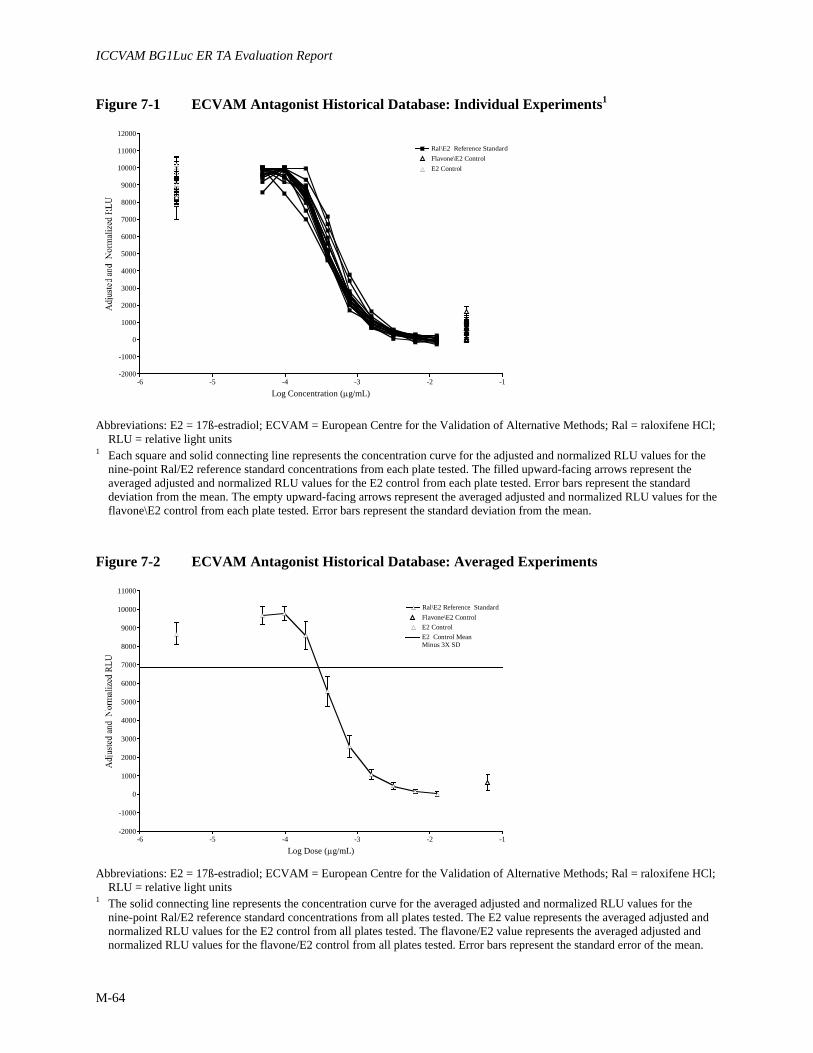
ICCVAM BG1Luc ER TA Evaluation Report
M-64
Figure 7-1 ECVAM Antagonist Historical Database: Individual Experiments1
-6 -5 -4 -3 -2 -1-2000
-1000
0
1000
2000
3000
4000
5000
6000
7000
8000
9000
10000
11000
12000
Flavone\E2 ControlE2 Control
Ral\E2 Reference Standard
Log Concentration (µg/mL) Abbreviations: E2 = 17ß-estradiol; ECVAM = European Centre for the Validation of Alternative Methods; Ral = raloxifene HCl;
RLU = relative light units 1 Each square and solid connecting line represents the concentration curve for the adjusted and normalized RLU values for the
nine-point Ral/E2 reference standard concentrations from each plate tested. The filled upward-facing arrows represent the averaged adjusted and normalized RLU values for the E2 control from each plate tested. Error bars represent the standard deviation from the mean. The empty upward-facing arrows represent the averaged adjusted and normalized RLU values for the flavone\E2 control from each plate tested. Error bars represent the standard deviation from the mean.
Figure 7-2 ECVAM Antagonist Historical Database: Averaged Experiments
-6 -5 -4 -3 -2 -1-2000
-1000
0
1000
2000
3000
4000
5000
6000
7000
8000
9000
10000
11000
E2 Control MeanMinus 3X SD
Ral\E2 Reference StandardFlavone\E2 ControlE2 Control
Log Dose (µg/mL) Abbreviations: E2 = 17ß-estradiol; ECVAM = European Centre for the Validation of Alternative Methods; Ral = raloxifene HCl;
RLU = relative light units 1 The solid connecting line represents the concentration curve for the averaged adjusted and normalized RLU values for the
nine-point Ral/E2 reference standard concentrations from all plates tested. The E2 value represents the averaged adjusted and normalized RLU values for the E2 control from all plates tested. The flavone/E2 value represents the averaged adjusted and normalized RLU values for the flavone/E2 control from all plates tested. Error bars represent the standard error of the mean.

Appendix C – Background Review Document
M-65
7.1 Evaluation of Intralaboratory Reproducibility at ECVAM
The within-day and across-day reproducibility of the RLU values associated with the DMSO solvent control wells, the fold-reduction of Ral/E2 at its maximum response, the calculated Ral/E2 IC50 values, and the adjusted and normalized RLU values associated with the E2 control and flavone/E2 weak positive control have been statistically analyzed. RLU values from plate controls using three or more replicate wells (i.e., DMSO , E2 and flavone/E2 weak positive controls) were evaluated using the Q test (see Section 13.5.3 in the BG1LUC4E2 ER TA antagonist protocol in Appendix H) to identify outliers before calculating test plate averages for the respective controls. None of the replicate wells produced RLU values that were considered as outliers by the Q test. CVs were determined for reference standard and control values to assess relative plate to plate variability. To assess the intralaboratory reproducibility of the reference standard and the control values across time, a linear regression analysis was conducted using the least squares method in PRISM®. Lastly, the variability of reference standard and control values from test plates run on the same day was compared to the variability of test plates run across days by conducting an ANOVA using PRISM®.
7.1.1 Coefficients of Variation
The means, SDs and CVs for DMSO control, Ral/E2 maximum fold-reduction, Ral/E2 IC50, E2 control, and flavone/E2 weak positive control values from the 14 plates tested are provided in Table 7-2.
Table 7-2 Means, Standard Deviations, and Coefficients of Variation of Reference Standard and Control Values
ECVAM N1 Units Mean SD CV
DMSO 18 RLU 3783 1588 42% Ral/E2 Maximum Fold-Reduction 18 Fold-
Reduction 8.0 0.70 9%
Ral/E2 IC50 18 µg/mL 4.30 x 10⁴ 7.85 x 10⁵ 18%
E2 18 Adjusted RLU 8881 640 7%
Flavone/E2 18 Adjusted RLU 644 458 71%
Abbreviations: CV = coefficient of variation; DMSO = dimethyl sulfoxide; E2 = 17ß-estradiol; ECVAM = European Centre for the Validation of Alternative Methods; IC50 = half-maximal inhibitory concentration; Ral = raloxifene HCl; RLU = relative light units; SD = standard deviation
1 Number of plates tested 7.1.2 Linear Regressions
Results of the linear regression analysis for the reference standard and control values are provided in Table 7-3. The analysis was conducted using the averaged reference standard and control values from each plate tested. The slope of the regression line, based on a two-tailed test, was judged to be statistically significant at p < 0.05.

ICCVAM BG1Luc ER TA Evaluation Report
M-66
Table 7-3 Linear Regression Analysis of Reference Standard and Control Values Over Time at ECVAM
Slope p-value (Slope) 1,2 Units Intercept
DMSO 70.2 0.142 RLU 2809 Ral/E2
Maximum
Fold-Reduction 0.003 0.890 Fold-Reduction 7.9
Ral/E2 IC50 6.3 x 10⁻⁶ 0.001 µg/mL 4.63 x 10⁻⁴
E2 45.5 0.012 Adjusted RLU 8249
Flavone/E2 18.7 0.178 Adjusted RLU 385
Abbreviations: DMSO = dimethyl sulfoxide; E2 = 17ß-estradiol; ECVAM = European Centre for the Validation of Alternative Methods; IC50 = half-maximal inhibitory concentration; Ral = raloxifene HCl; RLU = relative light units
1 Statistically significant from zero at p < 0.05 2 Values in italics have p values that are less than 0.05.
Results from the linear regression analysis of the averaged non-adjusted DMSO control RLU values from each test plate are graphically presented in Figure 7-3. The slope of the linear regression, although appearing positive, was not significantly different from zero (p = 0.142, Table 7-3), demonstrating the intralaboratory reproducibility of the DMSO control.
Figure 7-3 Linear Regression of Antagonist DMSO Controls at ECVAM
0 5 10 15 20 25 300
1000
2000
3000
4000
5000
6000
7000
8000
Study Day Abbreviations: DMSO = dimethyl sulfoxide; ECVAM = European Centre for the Validation of Alternative Methods; RLU =
relative light units
Results from the linear regression analysis of Ral/E2 maximum fold-reduction are graphically presented in Figure 7-4. The slope of the linear regression was not significantly different (p = 0.890, Table 7-3), demonstrating the intralaboratory reproducibility of plate reduction.

Appendix C – Background Review Document
M-67
Figure 7-4 Linear Regression of Ral/E2 Maximum Fold-Reduction at ECVAM
0 5 10 15 20 25 300
1
2
3
4
5
6
7
8
9
10
11
12
13
14
Study Day Abbreviations: E2 = 17ß-estradiol; ECVAM = European Centre for the Validation of Alternative Methods; Ral = raloxifene HCl
Results from the linear regression analysis of the Ral/E2 reference standard IC50 values are graphically presented in Figure 7-5. The slope of the linear regression was significantly different than zero (p = 0.001, Table 7-3).
Figure 7-5 Linear Regression of Ral/E2 IC50 Values at ECVAM
0 5 10 15 20 25 300
1.0x10⁻⁴
2.0x10⁻⁴
3.0x10⁻⁴
4.0x10⁻⁴
5.0x10⁻⁴
6.0x10⁻⁴
7.0x10⁻⁴
8.0x10⁻⁴
Study Day Abbreviations: E2 = 17ß-estradiol; ECVAM = European Centre for the Validation of Alternative Methods; IC50 = half maximal
inhibitory concentration; Ral = raloxifene HCl
Results from the linear regression analysis of the averaged adjusted and normalized E2 control RLU values from each test plate are graphically presented in Figure 7-6. The slope of the linear regression was significantly different than zero (p = 0.012, Table 7-3).

ICCVAM BG1Luc ER TA Evaluation Report
M-68
Figure 7-6 Linear Regression of the E2 Controls at ECVAM
0 5 10 15 20 25 300
2000
4000
6000
8000
10000
12000
Study Day Abbreviations: E2 = 17ß-estradiol; ECVAM = European Centre for the Validation of Alternative Methods; RLU = relative light
units
Results from the linear regression analysis of the averaged adjusted and normalized flavone/E2 weak positive control RLU values from each test plate are graphically presented in Figure 7-7. The slope of the linear regression, although appearing positive, was not significantly different from zero (p = 0.178, Table 7-3), demonstrating the intralaboratory reproducibility of the flavone control.
Figure 7-7 Linear Regression of the Flavone/E2 Weak Positive Control at ECVAM
0 5 10 15 20 25 30-1000
-500
0
500
1000
1500
2000
Study Day Abbreviations: E2 = 17ß-estradiol; ECVAM = European Centre for the Validation of Alternative Methods; RLU = relative light
units

Appendix C – Background Review Document
M-69
7.1.3 Analysis of Variance
The results of the ANOVA comparing the variability of reference standard and control values from test plates run on the same day to values from test plates run across days are provided in Table 7-4. The analysis was conducted using the averaged reference standard and control values from each plate tested. Variability is statistically significant at p < 0.05. Results from the analysis indicated that within-day variability was not significantly different from between-day variability for Ral/E2 maximum fold-reduction, Ral/E2 IC50, and flavone/E2 weak positive control values, but was significantly different for DMSO and E2 controls values.
Table 7-4 ANOVA Results of Antagonist Intralaboratory Reproducibility at ECVAM1,2,3
p-Value F Value1
DMSO <0.001 15.5 Ral/E2 Maximum Fold-
Reduction 0.107 2.4
Ral/E2 IC50 0.078 2.7
E2 0.012 5.7
Flavone/E2 0.252 1.6
Abbreviation: ANOVA = analysis of variance; DMSO = dimethyl sulfoxide; E2 = 17ß-estradiol; ECVAM = The European Centre for the Validation of Alternative Methods; IC50 = half-maximal inhibitory concentration; Ral = raloxifene HCl
1 Variability is statistically significant at p < 0.05
2 F = ratio of between-day variability to within-day variability – a ratio of 1.0 indicates that the within-day variability to between-day variability is equal and a ratio of zero indicates that all means are equal.
3 Values in italics have p values that are less than 0.05.

ICCVAM BG1Luc ER TA Evaluation Report
M-70
8.0 PHASE I TESTING OF ANTAGONIST REFERENCE STANDARD AND CONTROLS AT HIYOSHI
The testing of antagonist reference standard and controls was done using 96-well plates according to procedures in the 18 April 2007 version of BG1LUC4E2 ER TA antagonist protocol (Appendix D [note: Phase I testing was initiated at Hiyoshi before development of modified plate designs using all 96 wells of test plates had been completed at the lead laboratory, therefore testing of antagonist reference standards and controls used the plate designs using inside wells only]). Reference standard and controls used for antagonist testing were:
• Reference standard: Ral, double serial dilutions consisting of nine concentrations plus a fixed concentration (2.5 x 10⁻⁵ µg/mL) of E2 in duplicate wells (Ral/E2 reference standard) (Table 8-1).
• Vehicle control: DMSO (1% v/v) diluted in tissue culture media run in three replicate wells (DMSO control).
• E2 control: E2 (2.5 x 10⁻⁵ µg/mL) in tissue culture media used as a base line control run in four replicate wells (E2 control).
• Weak Positive Control: flavone (25 µg/mL) with E2 (2.5 x 10⁻⁵ µg/mL) in tissue culture media used as a weak positive control run in four replicate wells (flavone/E2 weak positive control).
Table 8-1 Concentrations of Ral/E2 Reference Standard Used in Range Finder and Comprehensive Testing
Raloxifene Concentrations1 E2 Concentrations
1.25 x 10⁻² 2.5 x 10⁻⁵
6.25 x 10⁻³ 2.5 x 10⁻⁵
3.13 x 10⁻³ 2.5 x 10⁻⁵
1.56 x 10⁻³ 2.5 x 10⁻⁵
7.81 x 10⁻⁴ 2.5 x 10⁻⁵
3.91 x 10⁻⁴ 2.5 x 10⁻⁵
1.95 x 10⁻⁴ 2.5 x 10⁻⁵
9.77 x 10⁻⁵ 2.5 x 10⁻⁵
4.88 x 10⁻⁵ 2.5 x 10⁻⁵
Abbreviations: E2 = 17ß-estradiol; Ral = raloxifene HCl 1 Concentrations are presented in µg/mL.
The reference standard and controls were tested in 12 separate plates on 12 separate days to demonstrate proficiency with protocols, demonstrate intra- and inter-laboratory reproducibility, and establish an historical database. Acceptance or rejection of a test plate was based on plate reduction; plates are rejected if the fold-induction was less than three. Tabulated testing results from individual test plates, including plate reduction and Ral/E2 reference standard IC50 values are provided in Table A-6 in Appendix A, and the RLU values from highest and lowest non-adjusted RLU values from the Ral/E2 reference standard from individual test plates are presented in Figure A-6 in Appendix A. Individual and averaged adjusted and normalized RLU values for the Ral/E2 reference standard, E2 control, and flavone/E2 weak positive control are presented in Figures 8-1 and 8-2 respectively.

Appendix C – Background Review Document
M-71
Figure 8-1 Hiyoshi Antagonist Historical Database: Individual Experiments1
-6 -5 -4 -3 -2 -1-2000
0
2000
4000
6000
8000
10000
12000
Ral\E2 Reference Standard
Flavone\E2 Control
E2 Control
Log Concentration (µg/mL) Abbreviations: E2 = 17ß-estradiol; Hiyoshi = Hiyoshi Corporation; Ral = raloxifene HCl; RLU = relative light units 1 Each square and solid connecting line represents the concentration curve for the adjusted and normalized RLU values for the
nine-point Ral/E2 reference standard concentrations from each plate tested during the creation of the agonist historical database. The filled upward-facing arrows represent the averaged adjusted and normalized RLU values for the E2 control from each plate tested during the creation of the agonist historical database. Error bars represent the standard deviation from the mean. The empty upward-facing arrows represent the averaged adjusted and normalized RLU values for the flavone\E2 control from each plate tested during the creation of the agonist historical database. Error bars represent the standard deviation from the mean.
Figure 8-2 Hiyoshi Antagonist Historical Database: Averaged
Experiments
-6 -5 -4 -3 -2 -1-2000
0
2000
4000
6000
8000
10000
12000
AveragedFlavone/E2AveragedE2
Averaged Ral/E2Reference Standard
Log Concentration (µg/mL) Abbreviations: E2 = 17ß-estradiol; Hiyoshi = Hiyoshi Corporation; Ral = raloxifene HCl; RLU = relative light units 1 The solid connecting line represents the concentration curve for the averaged adjusted and normalized RLU values for the
nine-point Ral/E2 reference standard concentrations from all plates tested. The E2 value represents the averaged adjusted and normalized RLU values for the E2 control from all plates tested. The flavone/E2 value represents the averaged adjusted and normalized RLU values for the flavone/E2 control from all plates tested. Error bars represent the standard error of the mean.

ICCVAM BG1Luc ER TA Evaluation Report
M-72
8.1 Evaluation of Intralaboratory Reproducibility at Hiyoshi
The within-day and across-day reproducibility of the RLU values associated with the DMSO solvent control wells, the fold-reduction of Ral/E2 at its maximum response, the calculated Ral/E2 IC50 values, and the adjusted and normalized RLU values associated with the E2 control and flavone/E2 weak positive control have been statistically analyzed. RLU values from plate controls using three or more replicate wells (i.e., DMSO , E2 and flavone/E2 weak positive controls) were evaluated using the Q test (see Section 13.6.2 in 18 April 2007 version of BG1LUC4E2 ER TA antagonist protocol in Appendix D) to identify outliers before calculating test plate averages for the respective controls. None of the replicate wells produced RLU values that were considered as outliers by the Q test. CVs were determined for reference standard and control values to assess relative plate to plate variability. To assess the intralaboratory reproducibility of the reference standard and the control values across time, a linear regression analysis was conducted using the least squares method in PRISM®.
8.1.1 Coefficients of Variation
The means, SDs and CVs for DMSO control, Ral/E2 maximum fold-reduction, Ral/E2 IC50, E2 control, and flavone/E2 weak positive control values from the 12 plates tested are provided in Table 8-2.
Table 8-2 Means, Standard Deviations, and Coefficients of Variation of Reference Standard and Control Values
Hiyoshi
N1 Units Mean SD CV
DMSO 12 RLU 4048 1386 34% Ral/E2 Maximum
Fold-Reduction 12 Fold-Reduction 7.9 2.33 30%
Ral/E2 IC50 12 µg/mL 6.29 x 10⁴ 1.29 x 10⁻⁴ 21%
E2 12 Adjusted RLU 6013 1369 23%
Flavone/E2 12 Adjusted RLU 1255 747 60%
Abbreviations: CV = coefficient of variation; DMSO = dimethyl sulfoxide; E2 = 17ß-estradiol; Hiyoshi = Hiyoshi Corporation; IC50 = half-maximal inhibitory concentration; Ral = raloxifene HCl; RLU = relative light units; SD = standard deviation
1 Number of plates tested
8.1.2 Linear Regressions
Results of the linear regression analysis for the reference standard and control values are provided in Table 8-3. The analysis was conducted using the averaged reference standard and control values from each plate tested. The slope of the regression line, based on a two-tailed test, was judged to be statistically significant at p < 0.05.

Appendix C – Background Review Document
M-73
Table 8-3 Linear Regression Analysis of Antagonist Controls Over Time at Hiyoshi
Slope p-value (Slope) 1 Units Intercept
DMSO 5.8 0.867 RLU 3934 Ral/E2 Maximum
Fold-Reduction 0.02 0.674 Fold-Reduction 7.4
Ral/E2 IC50 -3.6 x 10⁻⁷ 0.924 µg/mL 6.4 x 10⁻⁴
E2 6.66 0.827 Adjusted RLU 5597
Flavone/E2 -4.0 0.782 Adjusted RLU 1324
Abbreviations: DMSO = dimethyl sulfoxide; E2 = 17ß-estradiol; Hiyoshi = Hiyoshi Corporation; IC50 = half-maximal inhibitory concentration; Ral = raloxifene HCl; RLU = relative light units
1 Statistically significant from zero at p < 0.05 Results from the linear regression analysis of the averaged non-adjusted DMSO control RLU values from each test plate are graphically presented in Figure 8-3. The slope of the linear regression was not significantly different from zero (p = 0.867, Table 8-3), demonstrating the intralaboratory reproducibility of the DMSO control.
Figure 8-3 Linear Regression of DMSO Control at Hiyoshi
0 5 10 15 20 25 30 35 40 450
1000
2000
3000
4000
5000
6000
7000
8000
Study Day Abbreviations: DMSO = dimethyl sulfoxide; Hiyoshi = Hiyoshi Corporation; RLU = relative light units
Results from the linear regression analysis of Ral/E2 maximum fold-reduction are graphically presented in Figure 8-4. The slope of the linear regression was not significantly different from zero (p = 0.674, Table 8-3), demonstrating the intralaboratory reproducibility of plate reduction.

ICCVAM BG1Luc ER TA Evaluation Report
M-74
Figure 8-4 Linear Regression of Ral/E2 Maximum Fold-Reduction at Hiyoshi
0 5 10 15 20 25 30 35 40 450
2
4
6
8
10
12
14
16
Study Day Abbreviations: E2 = 17ß-estradiol; Hiyoshi = Hiyoshi Corporation; Ral = raloxifene HCl Results from the linear regression analysis of Ral/E2 IC50 values are graphically presented in Figure 8-5. The slope of the linear regression was not significantly different from zero (p = 0.924, Table 8-3), demonstrating the intralaboratory reproducibility of Ral/E2 IC50 values.
Figure 8-5 Linear Regression of Ral/E2 IC50 Values at Hiyoshi
0 5 10 15 20 25 30 35 40 450
1.0x10⁻⁴
2.0x10⁻⁴
3.0x10⁻⁴
4.0x10⁻⁴
5.0x10⁻⁴
6.0x10⁻⁴
7.0x10⁻⁴
8.0x10⁻⁴
9.0x10⁻⁴
1.0x10⁻³
Study Day Abbreviations: E2 = 17ß-estradiol; Hiyoshi = Hiyoshi Corporation; IC50 = half-maximal inhibitory concentration; Ral =
raloxifene HCl
Results from the linear regression analysis of the averaged adjusted and normalized E2 control RLU values from each test plate are graphically presented in Figure 8-6. The slope of the linear regression was not significantly different from zero (p = 0.827, Table 8-3), demonstrating the intralaboratory reproducibility of the E2 control.

Appendix C – Background Review Document
M-75
Figure 8-6 Linear Regression of E2 Control at Hiyoshi
0 5 10 15 20 25 30 35 40 450
2000
4000
6000
8000
10000
Study Day Abbreviations: E2 = 17ß-estradiol; Hiyoshi = Hiyoshi Corporation; RLU = relative light units Results from the linear regression analysis of the averaged adjusted and normalized flavone/E2 weak positive control RLU values from each test plate are graphically presented in Figure 8-7. The slope of the linear regression was not significantly different from zero (p = 0.782, Table 8-3), demonstrating the intralaboratory reproducibility of the flavone/E2 weak positive control.
Figure 8-7 Linear Regression of Flavone/E2 Weak Positive Control Values at Hiyoshi
0 5 10 15 20 25 30 35 40 45-500
0
500
1000
1500
2000
2500
3000
3500
Study Day Abbreviations: E2 = 17ß-estradiol; Hiyoshi = Hiyoshi Corporation; RLU = relative light units

ICCVAM BG1Luc ER TA Evaluation Report
M-76
9.0 PHASE I ANTAGONIST INTERLABORATORY REPRODUCIBILITY Averaged RLU values associated with the DMSO control wells, the maximum fold-reduction of Ral/E2, calculated Ral/E2 IC50 values, the adjusted and normalized RLU values associated with the E2 control, and flavone/E2 weak positive control wells from each laboratory, as well as averaged values for these parameters from the Protocol Standardization Study are presented in Figure 9-1. The Ral/E2 reference standard concentration curve is similar in the three participating laboratories and are also very similar to the curve produced during the Protocol Standardization Study.
Figure 9-1 Comparison Figure of the Antagonist Historical Database
-6 -5 -4 -3 -2 -1-2000
0
2000
4000
6000
8000
10000
12000
ECVAM FlavoneECVAM Ral/E2
ECVAM E2
Hiyoshi Ral/E2
Hiyoshi E2Hiyoshih Flavone
E2 Mean -3X SD
E2 Mean -3X SD
StandardizationE2 Mean -3X SD
Standardization Ral/E2
Standardization E2Standardization Flavone
XDS E2 Control Mean -3X SD
XDS Ral/E2
XDS E2XDS Flavone
Log Concentration (µg/mL) Abbreviations: 3X SD = three times the standard deviation from the mean; E2 = 17ß-estradiol; ECVAM = European Centre for
the Validation of Alternative Methods; Flavone = flavone\E2 weak positive control; Hiyoshi = Hiyoshi Corporation; Ral = raloxifene HCl; RLU = relative light units; standardization = data compiled during the BG1LUC4E2 ER TA Protocol Standardization Study; XDS = Xenobiotic Detection Systems, Inc.
9.1 DMSO Control
Averaged unadjusted DMSO control RLU values were compared across laboratories as well as with unadjusted DMSO control RLU values from the Protocol Standardization Study. Scatter plots of these values are presented in Figure 9-2.

Appendix C – Background Review Document
M-77
Figure 9-2 Antagonist DMSO Control Scatter Plots1
Standardization (XDS) XDS ECVAM Hiyoshi-4000
-2000
0
2000
4000
6000
8000
Abbreviations: DMSO = dimethyl sulfoxide; ECVAM = European Centre for the Validation of Alternative Methods; Hiyoshi =
Hiyoshi Corporation; standardization = data compiled during the BG1LUC4E2 ER TA Protocol Standardization Study; XDS = Xenobiotic Detection Systems, Inc.
1 Data points represent adjusted DMSO control RLU values from plates tested in the Protocol Standardization Study (28 plates), and at XDS (14 plates), ECVAM (18 plates), and Hiyoshi (12 plates) in the Phase I studies. Solid horizontal lines represent the mean DMSO control RLU value for each data set. Dashed lines indicate the mean DMSO control value plus and minus 2.5 times the standard deviation from the mean.
Unadjusted DMSO control RLU value means, SDs and CVs from each laboratory and the Protocol Standardization Study are provided in Table 9-1.
Table 9-1 Means, Standard Deviations, and Coefficients of Variation for DMSO Control
Antagonist DMSO Control
N1 Mean SD CV
XDS 14 1986 1747 88%
ECVAM 18 3783 1588 42%
Hiyoshi 12 4048 1386 34%
Standardization 28 2251 1304 58%
Abbreviations: CV = coefficient of variation; DMSO = dimethyl sulfoxide; SD = standard deviation; standardization = BG1LUC4E2 ER TA Protocol Standardization Study
1 Number of plates tested. The variability of the Phase I unadjusted DMSO control values across laboratories was evaluated using the ANOVA method in PRISM®. Variability was judged to be statistically significant at p < 0.05. Results of this analysis indicated that unadjusted DMSO control values were significantly different (p < 0.001). A pairwise comparison was also conducted using the PRISM® Newman-Keuls post test method. Results of this analysis indicated that XDS values were significantly different from ECVAM and Hiyoshi values, but ECVAM values were not significantly different from Hiyoshi values (Table 9-2).

ICCVAM BG1Luc ER TA Evaluation Report
M-78
Table 9-2 Newman-Keuls Results for Antagonist DMSO Control
Mean Difference1 p-value2
XDS vs ECVAM -3286 <0.001
XDS vs Hiyoshi -3551 <0.001
ECVAM vs Hiyoshi -265 >0.05
Abbreviations: ECVAM = European Centre for the Validation of Alternative Methods; Hiyoshi = Hiyoshi Corporation; XDS = Xenobiotic Detection Systems, Inc.
1 Presented in relative light units
2 Variability is statistically significant at p < 0.05 - values in italics have p values that are less than 0.05.
A comparison of unadjusted DMSO control RLU values from each laboratory was made with unadjusted DMSO control RLU values from the Protocol Standardization Study using the Dunnett’s test in PRISM®. Results of this analysis indicate that XDS, ECVAM and Hiyoshi values were statistically different from values from the Protocol Standardization Study (Table 9-3).
Table 9-3 Dunnett’s Results for DMSO Control
Antagonist DMSO Values1
N2 Mean Difference p-value3
XDS 14 1755 <0.01
ECVAM 18 -1532 <0.01
Hiyoshi 12 -1797 <0.01
Abbreviations: ECVAM = The European Centre for the Validation of Alternative Methods; Hiyoshi = Hiyoshi Corporation; XDS = Xenobiotic Detection Systems, Inc.
1 The results from the participating laboratories were compared to the results from the BG1LUC4E2 ER TA Protocol Standardization Study.
2 Number of plates tested
3 Variability is statistically significant at p < 0.05 - values in Italics have p values that are less than 0.05. 9.2 Ral\E2 Maximum Fold-Reduction
The Ral/E2 maximum fold-reduction were compared across laboratories as well as with values from the Protocol Standardization Study. Scatter plots of these values are presented in Figure 9-3.

Appendix C – Background Review Document
M-79
Figure 9-3 Ral/E2 Maximum Fold-Reduction Scatter Plots1
Standardization (XDS) XDS ECVAM Hiyoshi0
2
4
6
8
10
12
14
16
18
20
Abbreviations: E2 = 17ß-estradiol; ECVAM = European Centre for the Validation of Alternative Methods; Hiyoshi = Hiyoshi
Corporation; Ral = raloxifene HCl; standardization = data compiled during the BG1LUC4E2 ER TA Protocol Standardization Study; XDS = Xenobiotic Detection Systems, Inc.
1 Data points represent Ral/E2 maximum fold-reduction values from plates tested in the protocol standardization study (28 plates), and at XDS (14 plates), ECVAM (18 plates), and Hiyoshi (12 plates) in the Phase I studies. Solid horizontal lines represent the mean Ral/E2 maximum fold-reduction value for each data set. Dashed lines indicate the mean Ral/E2 maximum fold-reduction value plus and minus 2.5 times the standard deviation from the mean.
The Ral/E2 maximum fold-reduction means, SDs and CVs from each laboratory and the Protocol Standardization Study are provided in Table 9-4.
Table 9-4 Means, Standard Deviations, and Coefficients of Variation for Ral/E2 Maximum Fold-Reduction
Ral/E2 Maximum Fold-Reduction
N1 Mean SD CV
XDS 14 14.2 2.38 17%
ECVAM 18 8.0 0.70 9%
Hiyoshi 12 7.9 2.33 30%
Standardization 28 6.1 1.26 21%
Abbreviations: CV = coefficient of variation; ECVAM = European Centre for the Validation of Alternative Methods; Hiyoshi = Hiyoshi Corporation; SD = standard deviation; standardization = data compiled during the BG1LUC4E2 ER TA Protocol Standardization Study; XDS = Xenobiotic Detection Systems, Inc.
1 Number of plates tested. The variability of the Phase I Ral/E2 maximum fold-reduction values across laboratories was evaluated using the ANOVA method in PRISM®. Variability was judged to be statistically significant at p < 0.05. Results of this analysis indicated that Ral/E2 maximum fold-reduction values were significantly different (p = 0.001). A pairwise comparison was also conducted using the PRISM® Newman-Keuls post test method. Results of this analysis indicated that XDS values were significantly different from ECVAM and Hiyoshi values, but ECVAM values were not significantly different from Hiyoshi values (Table 9-5).

ICCVAM BG1Luc ER TA Evaluation Report
M-80
Table 9-5 Newman-Keuls Results for Ral/E2 Maximum Fold-Reduction
Mean Difference1 p-value2
XDS vs ECVAM 6.2 <0.001
XDS vs Hiyoshi 6.3 <0.01
ECVAM vs Hiyoshi 0.1 >0.05
Abbreviations: E2 = 17ß-estradiol; ECVAM = The European Centre for the Validation of Alternative Methods; Hiyoshi = Hiyoshi Corporation; Ral = raloxifene HCl; XDS = Xenobiotic Detection Systems, Inc.
1 Presented in fold-reduction
2 Variability is statistically significant at p < 0.05 - values in italics have p values that are less than 0.05.
A comparison of Ral/E2 maximum fold-reduction values from each laboratory was made with values from the Protocol Standardization Study using the Dunnett’s test in PRISM®. Results of this analysis indicated that ECVAM and Hiyoshi values were not statistically different from values from the Protocol Standardization Study but XDS values were significantly different (Table 9-6).
Table 9-6 Dunnett’s Results for Ral/E2 Maximum Fold-Reduction
Ral/E2 Maximum Fold-Reduction1
N2 Mean Difference p-value3
XDS 14 -8.1 <0.01
ECVAM 18 -1.9 >0.05
Hiyoshi 12 -1.9 >0.05
Abbreviations: E2 = 17ß-estradiol; ECVAM = The European Centre for the Validation of Alternative Methods; Hiyoshi = Hiyoshi Corporation; Ral = raloxifene HCl; XDS = Xenobiotic Detection Systems, Inc.
1 The results from the participating laboratories were compared to the results from the BG1LUC4E2 ER TA Protocol Standardization Study.
2 Number of plates tested
3 Variability is statistically significant at p < 0.05 - values in italics have p values that are less than 0.05. 9.3 Ral\E2 IC50
Ral/E2 IC50 values were compared across laboratories as well as with values from the Protocol Standardization Study. Scatter plots of these values are presented in Figure 9-4.

Appendix C – Background Review Document
M-81
Figure 9-4 Ral/E2 IC50 Scatter Plots1
Standardization (XDS) XDS ECVAM Hiyoshi0
2.0x10⁻⁴
4.0x10⁻⁴
6.0x10⁻⁴
8.0x10⁻⁴
1.0x10⁻³
1.2x10⁻³
1.4x10⁻³
1.6x10⁻³
1.8x10⁻³
2.0x10⁻³
Abbreviations: E2 = 17ß-estradiol; ECVAM = European Centre for the Validation of Alternative Methods; Hiyoshi = Hiyoshi
Corporation; IC50 = half-maximum inhibitory concentration; Ral = raloxifene HCl; standardization = data compiled during the BG1LUC4E2 ER TA Protocol Standardization Study; XDS = Xenobiotic Detection Systems, Inc.
1 Data points represent Ral/E2 IC50 values from plates tested in the protocol standardization study (28 plates), and at XDS (14 plates), ECVAM (18 plates), and Hiyoshi (12 plates) in the Phase I studies. Solid horizontal lines represent the mean Ral/E2 IC50 value for each data set. Dashed lines indicate the mean Ral/E2 IC50 value plus and minus 2.5 times the standard deviation from the mean.
Ral/E2 IC50 value means, SDs and CVs from each laboratory and the Protocol Standardization Study are provided in Table 9-7.
Table 9-7 Means, Standard Deviations, and Coefficients of Variation for Ral/E2 IC50
Ral\E2 IC50
N1 Mean SD CV
XDS 14 4.26 x 10⁴ 8.95 x 10⁻⁵ 21%
ECVAM 18 4.30 x 10⁴ 7.85 x 10⁵ 18%
Hiyoshi 12 6.29 x 10⁴ 1.29 x 10⁻⁴ 21%
Standardization 28 1.14 x 10⁻³ 1.95 x 10⁴ 17%
Abbreviations: CV=coefficient of variation; E2 = 17ß-estradiol; ECVAM = European Centre for the Validation of Alternative Methods; Hiyoshi = Hiyoshi Corporation; IC50 = half-maximal inhibitory concentration; Ral = raloxifene HCl; SD=standard deviation; standardization = data compiled during the BG1LUC4E2 ER TA Protocol Standardization Study; XDS = Xenobiotic Detection Systems, Inc.
1 Number of plates tested.
The variability of the Phase I Ral/E2 IC50 values across laboratories was evaluated using the ANOVA method in PRISM®. Variability was judged to be statistically significant at p < 0.05. Results of this analysis indicated that Ral/E2 IC50 values were significantly different (p < 0.001). A pairwise comparison was also conducted using the PRISM® Newman-Keuls post test method. Results of this analysis indicated that XDS values were not significantly different from ECVAM values but were statistically different from Hiyoshi values, and ECVAM values were significantly different from Hiyoshi values (Table 9-8).

ICCVAM BG1Luc ER TA Evaluation Report
M-82
Table 9-8 Newman-Keuls Results for Ral/E2 IC50
Mean Difference1 p-value2
XDS vs ECVAM - 4.3 x 10⁻⁶ >0.05
XDS vs Hiyoshi -2.0 x 10⁻⁴ <0.001
ECVAM vs Hiyoshi -2.0 x 10⁻⁴ <0.001
Abbreviations: E2 = 17ß-estradiol; ECVAM = European Centre for the Validation of Alternative Methods; Hiyoshi = Hiyoshi Corporation; IC50 = half-maximal inhibitory concentration; Ral = raloxifene HCl; XDS = Xenobiotic Detection Systems, Inc.
1 Presented in µg/mL
2 Variability is statistically significant at p<0.05 - values in italics have p values that are less than 0.05.
A comparison of Ral/E2 IC50 values from each laboratory was made with values from the Protocol Standardization Study using the Dunnett’s test in PRISM®. Results of this analysis indicated that values from all three laboratories were statistically different from values from the Protocol Standardization Study (Table 9-9).
Table 9-9 Dunnett’s Results for Ral/E2 IC50
Ral/E2 IC50 Values1
N2 Mean Difference p-value3
XDS 14 -8.93 x 10⁻⁵ <0.01
ECVAM 18 -9.36 x 10⁻⁵ <0.01
Hiyoshi 12 -2.94 x 10⁻⁴ <0.01
Abbreviations: E2 = 17ß-estradiol; ECVAM = European Centre for the Validation of Alternative Methods; Hiyoshi = Hiyoshi Corporation; IC50 = half-maximal inhibitory concentration; Ral = raloxifene HCl
1 The results from the participating laboratories were compared to the results from the BG1LUC4E2 ER TA Protocol Standardization Study.
2 Number of plates tested
3 Variability is statistically significant at p < 0.05 - values in italics have p values that are less than 0.05. 9.4 E2 Control
Adjusted and normalized E2 control RLU values were compared across laboratories as well as with values from the Protocol Standardization Study. Scatter plots of these values are presented in Figure 9-5.
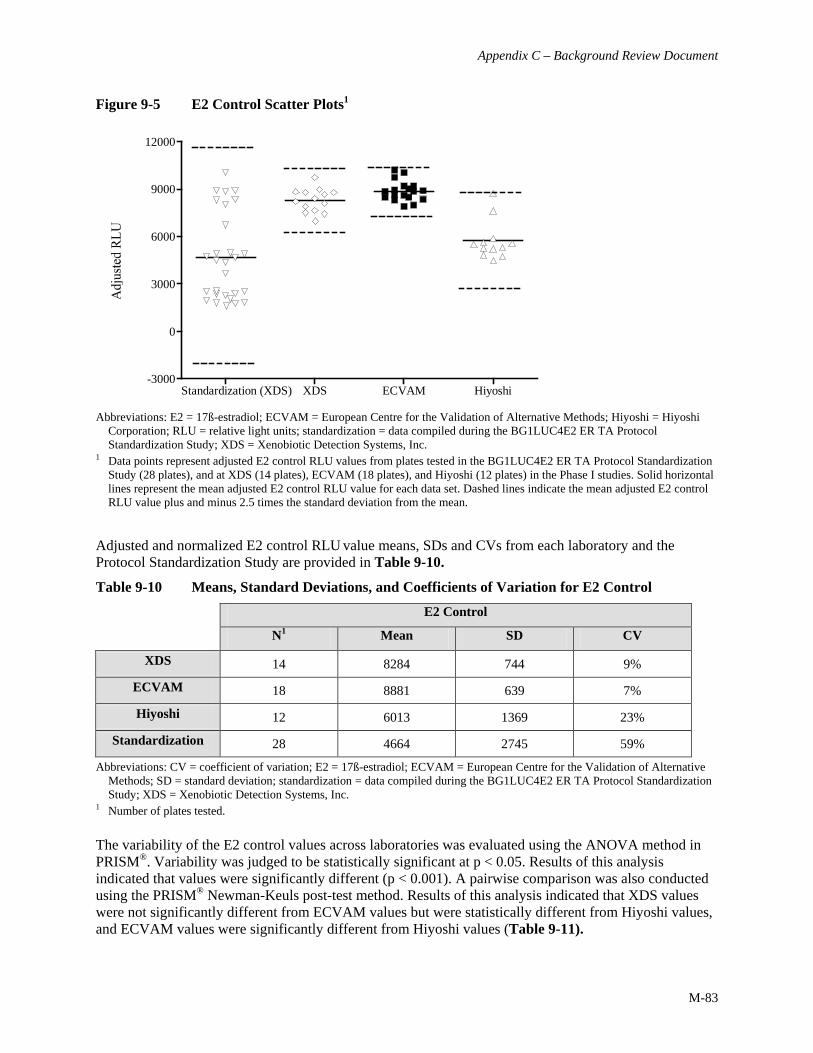
Appendix C – Background Review Document
M-83
Figure 9-5 E2 Control Scatter Plots1
Standardization (XDS) XDS ECVAM Hiyoshi-3000
0
3000
6000
9000
12000
Abbreviations: E2 = 17ß-estradiol; ECVAM = European Centre for the Validation of Alternative Methods; Hiyoshi = Hiyoshi
Corporation; RLU = relative light units; standardization = data compiled during the BG1LUC4E2 ER TA Protocol Standardization Study; XDS = Xenobiotic Detection Systems, Inc.
1 Data points represent adjusted E2 control RLU values from plates tested in the BG1LUC4E2 ER TA Protocol Standardization Study (28 plates), and at XDS (14 plates), ECVAM (18 plates), and Hiyoshi (12 plates) in the Phase I studies. Solid horizontal lines represent the mean adjusted E2 control RLU value for each data set. Dashed lines indicate the mean adjusted E2 control RLU value plus and minus 2.5 times the standard deviation from the mean.
Adjusted and normalized E2 control RLU value means, SDs and CVs from each laboratory and the Protocol Standardization Study are provided in Table 9-10.
Table 9-10 Means, Standard Deviations, and Coefficients of Variation for E2 Control
E2 Control
N1 Mean SD CV
XDS 14 8284 744 9%
ECVAM 18 8881 639 7%
Hiyoshi 12 6013 1369 23%
Standardization 28 4664 2745 59%
Abbreviations: CV = coefficient of variation; E2 = 17ß-estradiol; ECVAM = European Centre for the Validation of Alternative Methods; SD = standard deviation; standardization = data compiled during the BG1LUC4E2 ER TA Protocol Standardization Study; XDS = Xenobiotic Detection Systems, Inc.
1 Number of plates tested. The variability of the E2 control values across laboratories was evaluated using the ANOVA method in PRISM®. Variability was judged to be statistically significant at p < 0.05. Results of this analysis indicated that values were significantly different (p < 0.001). A pairwise comparison was also conducted using the PRISM® Newman-Keuls post-test method. Results of this analysis indicated that XDS values were not significantly different from ECVAM values but were statistically different from Hiyoshi values, and ECVAM values were significantly different from Hiyoshi values (Table 9-11).

ICCVAM BG1Luc ER TA Evaluation Report
M-84
Table 9-11 Newman-Keuls Results for E2 Control
Mean Difference1 p-value2
XDS vs ECVAM -598 >0.05
XDS vs Hiyoshi 2271 <0.001
ECVAM vs Hiyoshi 2868 <0.001
Abbreviations: E2 = 17ß-estradiol; ECVAM = European Centre for the Validation of Alternative Methods; Hiyoshi = Hiyoshi Corporation; XDS = Xenobiotic Detection Systems, Inc.
1 Presented in adjusted relative light units
2 Variability is statistically significant at p < 0.05 - values in italics have p values that are less than 0.05.
A comparison of E2 control RLU values from each laboratory was made with values from the Protocol Standardization Study using the Dunnett’s test in PRISM®. Results of this analysis indicate that Hiyoshi values were not statistically different from values from the Protocol Standardization Study but that XDS and ECVAM values were statistically different (Table 9-12).
Table 9-12 Dunnett’s Results for E2 Control
E2 Control Values1
N2 Mean Difference p-value3
XDS 14 -3620 <0.01
ECVAM 18 -4217 <0.01
Hiyoshi 12 -1349 >0.05
Abbreviations: E2 = 17ß-estradiol; ECVAM = The European Centre for the Validation of Alternative Methods; Hiyoshi = Hiyoshi Corporation; XDS = Xenobiotic Detection Systems
1 The results from the participating laboratories were compared to the results from the BG1LUC4E2 ER TA Protocol Standardization Study.
2 Number of plates tested
3 Variability is statistically significant at p < 0.05 - values in italics have p values that are less than 0.05. 9.5 Flavone/E2 Weak Positive Control
Adjusted and normalized flavone/E2 weak positive control RLU values were compared across laboratories as well as with values from the Protocol Standardization Study. Scatter plots of these values are presented in Figure 9-6.

Appendix C – Background Review Document
M-85
Figure 9-6 Flavone/E2 Weak Positive Control Scatter Plots1
Standardization (XDS) XDS ECVAM Hiyoshi-1000
0
1000
2000
3000
4000
5000
6000
7000
Abbreviations: E2 = 17ß-estradiol; ECVAM = European Centre for the Validation of Alternative Methods; Hiyoshi = Hiyoshi
Corporation; RLU = relative light units; standardization = data compiled during the BG1LUC4E2 ER TA Protocol Standardization Study; XDS = Xenobiotic Detection Systems, Inc.
1 Data points represent adjusted flavone/E2 control RLU values from plates tested in the BG1LUC4E2 ER TA Protocol Standardization Study (28 plates), and at XDS (14 plates), ECVAM (18 plates), and Hiyoshi (12 plates) in the Phase I studies. Solid horizontal lines represent the mean adjusted flavone/E2 control RLU value for each data set. Dashed lines indicate the mean adjusted flavone/E2 control RLU value plus and minus 2.5 times the standard deviation from the mean.
Adjusted flavone/E2 control RLU value means, SDs and CVs from each laboratory and the Protocol Standardization Study are provided in Table 9-13.
Table 9-13 Means, Standard Deviations, and Coefficients of Variation for the Flavone/E2 Weak Positive Control
Flavone/E2 Weak Positive Control
N1 Mean2 SD2 CV
XDS 14 3583 1089 30%
ECVAM 18 644 458 71%
Hiyoshi 12 1255 747 60%
Standardization 28 1453 1011 70%
Abbreviations: CV=coefficient of variation; E2 = 17ß-estradiol; ECVAM = European Centre for the Validation of Alternative Methods; Hiyoshi = Hiyoshi Corporation; SD=standard deviation; standardization = data compiled during the BG1LUC4E2 ER TA Protocol Standardization Study
1 Number of plates tested. 2 Units are in adjusted relative light units.
The variability of the flavone/E2 control weak positive control values across laboratories was evaluated using the ANOVA method in PRISM®. Variability was judged to be statistically significant at p < 0.05. Results of this analysis indicated that flavone/E2 weak positive control values were significantly different (p < 0.001). A pairwise comparison was also conducted using the PRISM® Newman-Keuls post-test
ICCVAM BG1Luc ER TA Evaluation Report
M-86
method. Results of this analysis indicated that XDS values were significantly different from ECVAM and Hiyoshi values, but were not statistically different from Hiyoshi values (Table 9-14).
Table 9-14 Newman-Keuls Results for the Flavone/E2 Control
Mean Difference1 p-value2
XDS vs ECVAM 2939 <0.001
XDS vs Hiyoshi 2357 <0.001
ECVAM vs Hiyoshi -582 >0.05
Abbreviations: E2 = 17ß-estradiol; ECVAM = European Centre for the Validation of Alternative Methods; Hiyoshi = Hiyoshi Corporation; XDS = Xenobiotic Detection Systems, Inc.
1 Presented in adjusted relative light units
2 Variability is statistically significant at p < 0.05 - values in italics have p values that are less than 0.05.
A comparison of adjusted and normalized flavone/E2 weak positive control RLU values from each laboratory was made with values from the Protocol Standardization Study using the Dunnett’s test in PRISM®. Results of this analysis indicate that Hiyoshi values were not significantly different than values from the Protocol Standardization Study but that XDS and ECVAM values were significantly different (Table 9-15).
Table 9-15 Dunnett’s Results for the Flavone/E2 Weak Positive Control1
Flavone/E2 Values
N2 Mean Difference p-value
XDS 14 -2129 <0.01
ECVAM 18 809 <0.01
Hiyoshi 12 227 >0.05
Abbreviations: E2 = 17ß-estradiol; ECVAM = European Centre for the Validation of Alternative Methods; Hiyoshi = Hiyoshi Corporation; XDS = Xenobiotic Detection Systems, Inc.
1 The results from the participating laboratories were compared to the results from BG1LUC4E2 ER TA Protocol Standardization Study.
2 Number of plates tested
3 Variability is statistically significant at p < 0.05 - values in italics have p values that are less than 0.05.
9.6 Variability of Antagonist Reference Standard and Controls
Statistically significant differences were observed in intra- and interlaboratory antagonist reference standard and control values. It was not possible to identify the causes for these differences but some of the contributing factors may be lot-to-lot differences in cell culture media and tissue culture supplies (for intra- and interlaboratory differences) and differences in luminometers (for interlaboratory differences). This underscores the importance of developing an historical database for each individual laboratory. Although significant differences were observed for intra- and interlaboratory antagonist reference standard and control values, the results of Phase I antagonist testing demonstrates the reliability of the assay as follows:
• The assay responds robustly to Ral reference anti-estrogen.
Appendix C – Background Review Document
M-87
• The assay consistently responds to the flavone/E2 weak positive control, which is tested at a concentration several orders of magnitude higher than the Ral/E2 reference estrogen.
• The assay Ral/E2 maximum fold-reduction values were consistently greater that three-fold (none of the plates tested had values below three-fold).
• Phase I testing of antagonist reference standard and controls established historical databases that produced comparable test plate acceptance criteria for Phase IIa testing.
9.7 Historical Database for Phase IIa Antagonist Testing
The acceptance or rejection of antagonist tests to be conducted in Phase IIa will be based on the evaluation of test plate reference standard and control results. Results will be compared to acceptance criteria derived from the historical databases established from Phase I testing at each laboratory. Antagonist test plate acceptance criteria to be used in Phase IIa for range finder testing is summarized as follows:
• Plate reduction, as measured by dividing the averaged highest Ral/E2 reference standard RLU value by the averaged lowest Ral/E2 reference standard value, must be greater than three-fold.
• DMSO control RLU values must be within 2.5 times the SD of the historical DMSO control value.
Agonist test plate acceptance criteria to be used in Phase IIa for comprehensive testing is summarized as follows:
• Plate reduction, as measured by dividing the averaged highest Ral/E2 reference standard RLU value by the averaged lowest Ral/E2 reference standard value, must be greater than three-fold.
• Ral/E2 IC50 values must be within 2.5 times the SD of the historical database Ral/E2 IC50 value. • DMSO control RLU values must be within 2.5 times the SD of the historical DMSO control value. • E2 control RLU values must be within 2.5 times the SD of the historical E2 control value. • Flavone/E2 (the weak positive control) RLU values must be within 2.5 times the SD of the historical
Flavone/E2 control value.
The acceptance criteria derived from the historical databases established from Phase I testing at each laboratory is provided in Table 9-15.

ICCVAM BG1Luc ER TA Evaluation Report
M-88
Tables 9-16 Antagonist Historical Database Values Established for Phase IIa Acceptance Criteria at XDS
XDS
Units Mean SD Mean Plus 2.5
Times SD
Mean Minus
2.5 Times SD
DMSO RLU 1986 1748 6355 0*
Ral\E2 IC50 µg/mL 4.3 x 10⁻⁴ 9.0 x 10⁻⁵ 6.5 x 10⁻⁴ 2.0 x 10⁻⁴
E2 Adjusted RLU 8284 744 10143 6424
Flavone/E2 Adjusted RLU 3583 1089 6305 860 ECVAM
Units Mean SD Mean Plus 2.5
Times SD
Mean Minus
2.5 Times SD
DMSO RLU 3783 1587 7752 0*
Ral\E2 IC50 µg/mL 4.3 x 10⁻⁴ 7.9 x 10⁻⁵ 6.3 x 10⁻⁴ 2.3 x 10⁻⁴
E2 Adjusted RLU 8881 640 10480 7282
Flavone/E2 Adjusted RLU 644 458 1789 -501 Hiyoshi
Units Mean SD Mean Plus 2.5
Times SD
Mean Minus
2.5 Times SD
DMSO RLU 4048 1386 7513 583
Ral\IC50 µg/mL 6.3 x 10⁻⁴ 1.3 x 10⁻⁴ 9.5 x 10⁻⁴ 3.1 x 10⁻⁴
E2 Adjusted RLU 6013 1369 9435 2591
Flavone/E2 Adjusted RLU 1255 747 3122 -612
Abbreviations: DMSO = dimethyl sulfoxide; E2 = 17β-estradiol; ECVAM = European Centre for the Validation of Alternative Methods; Hiyoshi = Hiyoshi Corporation; IC50 = half-maximal inhibitory concentration; Ral = raloxifene HCl; RLU = relative light unit; SD = standard deviation; XDS = Xenobiotic Detection Systems, Inc.
* Unadjusted DMSO values can not be below zero

Appendix C – Background Review Document
M-89
10.0 TESTING OF VISUAL OBSERVATION CELL VIABILITY METHOD AT ECVAM AND HIYOSHI
A comparison of the visual observation and CellTiter-Glo® methods for assessing cell viability was conducted during the Protocol Standardization Study. Results of the comparison were reviewed and discussed at a 16 November 2006 BG1LUC4E2 ER TA Assay Validation Study Management Team (SMT) teleconference. The SMT concluded that the qualitative visual observation method was similar to the quantitative CellTiter-Glo® method for establishing a cytotoxic dose of a test substance. The SMT concluded that the visual observation method was both an accurate and practical method for assessing cell viability in the BG1LUC4E2 ER TA Assay, particularly considering that using the CellTiter-Glo® method necessitates running concurrent parallel plates. The SMT agreed to remove the use of the CellTiter-Glo® method from the BG1LUC4E2 ER TA Assay protocols following testing at ECVAM and Hiyoshi to demonstrate proficiency with the visual observation method and a study amendment was written outlining this modification to the study design (see study Amendment I in Appendix I). Proficiency was demonstrated by testing concentrations of BPA that would induce a complete range of cytotoxicity (i.e., Categories 1, 2, 3, and 4 as defined in the BG1LUC4E2 ER TA Assay Visual Observation Cell Viability Manual, (see Table 10-1). BPA concentrations (100, 90, 80, 70, 60, and 50 µg/mL) were tested in triplicate wells of a 96-well plates. Exposed BG-1 cells from each test plate were assessed for cell viability with an inverted phase contrast microscope at 100X as per the procedures in the BG1LUC4E2 ER TA Assay Visual Observation Cell Viability Manual. Digital photomicrographs of exposed cells were recorded and provided to the validation study Project Coordinator along with the cytotoxicity scoring information. Photomicrographs and corresponding cytotoxicity scores were reviewed by the NICEATM SMT and XDS Study Director and it was determined that proficiency with the visual observation method was demonstrated by the ECVAM and Hiyoshi.
Table 10-1 Visual Observation Scoring Table
Viability Score Brief Description1
1 Normal Cell Morphology and Cell Density
2 Altered Cell Morphology and/or Small Gaps between Cells
3 Altered Cell Morphology and/or Large Gaps between Cells
4 Few (or no) Visible Cells
P Wells containing precipitation are to be noted with “P”
ICCVAM BG1Luc ER TA Evaluation Report
M-90
11.0 SUMMARY Phase I of the multi-phased international validation study of the BG1LUC4E2 ER TA assay for the detection of estrogen receptor (ER) agonists and antagonists has been completed by all participating laboratories. Multiple testing of reference standards and controls was based on agonist and antagonist protocols developed during the Protocol Standardization Study and results were used to demonstrate proficiency with protocols and establish historical databases to be used as quality controls for subsequent study phases. Evaluation of results indicated that reference standard and control results were repeatable and reproducible. Multiple testing of reference standards and controls conducted at XDS was also used to further refine assay protocols for testing in subsequent study phases. Additional testing was conducted at ECVAM and Hiyoshi to demonstrate proficiency with the visual observation method of assessing cell viability developed by XDS during the Protocol Standardization Study.
The goal of Phase I of the validation study was to demonstrate proficiency with agonist and antagonist protocols, demonstrate intra- and inter-laboratory reproducibility, establish historical databases to be used as quality controls for subsequent study phases, and to modify test plate configurations to improve testing through-put, by conducting multiple testing of reference standards and controls using agonist and antagonist protocols developed during the Protocol Standardization Study.
Testing of reference standards and controls conducted at XDS was also used to further refine assay protocols for testing. Additional testing was conducted at ECVAM and Hiyoshi to demonstrate proficiency with the visual observation method of assessing cell viability developed by XDS during the Protocol Standardization Study.
Statistically significant differences were observed in intra- and inter-laboratory reference and control values. It was not possible to identify the causes for these differences but contributing factors may be lot-to-lot differences in cell culture media and tissue culture supplies (for intra- and inter-laboratory differences) and differences in luminometers (for inter-laboratory differences). This underscores the importance of developing an historical control database for each individual laboratory. Phase I results that support the reliability of the assay are:
• Assay responds robustly to E2 reference estrogen and Ral reference anti-estrogen. • Assay consistently responds to weak-acting positive controls at concentrations several orders of
magnitude higher than the reference estrogen or anti-estrogen. • Assay plate induction or reduction values were consistently greater than three-fold (only 2 of 84
plates tested had values below three-fold). • Phase I testing of reference standards and controls established historical databases that produced
comparable test plate acceptance criteria for Phase IIa testing.
Based on the review of the results of Phase I, the Study Management Team agreed to proceed with Phase IIa of the LUMI-CELL ER Assay international validation study.
Appendix C – Background Review Document
M-91
12.0 REFERENCES Nagy SR, Sanborn JR, Hammock BD, Denison MS. 2002. Development of a green fluorescent protein-based cell bioassay for the rapid and inexpensive detection and characterization of Ah receptor agonists. Toxicol Sci 65:200-210.
Oliver MH, Harrison NK, Bishop JE, Cole PJ, Laurent GJ. 1989. A rapid and convenient assay for counting cells cultured in microwell plates: application for assessment of growth factors. J Cell Sci 92:513-518.
EPA. 1998. Endocrine Disruptor Screening Program; Proposed Statement of Policy. 63 FR 71542-71568. Available: http://www.epa.gov/EPA-PEST/1998/December/Day-28/p34298.htm [accessed 14 February 2006].
FR Notice (Vol. 68, No. 106, pp. 33171-33172, June 3, 2003): National Toxicology Program (NTP), NTP Interagency Center for the Evaluation of Alternative Toxicological Methods (NICEATM); Notice of Availability of a Revised List of Recommended Reference Substances for Validation of In Vitro Estrogen and Androgen Receptor Binding and Transcriptional Activation Assays: Request for Comments and Submission of In Vivo and In Vitro Data.

ICCVAM BG1Luc ER TA Evaluation Report
M-92
This page intentionally left blank