nsw schools physical activity and nutrition survey...
TRANSCRIPT

NSW Schools Physical Activity and Nutrition Survey (SPANS) 2004
Summary Report
From the University of Sydney, School of Public Health, and the NSW Centre for Obesity and OverweightDr Michael Booth (Principal investigator) Ms Sandie Hodgson (Project officer)
Dr Elizabeth Denney-Wilson (Co-investigator) Ms Rachel Wilkenfeld (Project officer)
Dr Louise Hardy (Project officer)
From the University of Wollongong, Faculty of Education, and the Child Obesity Research CentreDr Anthony Okely (Chief investigator)
From the University of Sydney, School of Public HealthDr Timothy Dobbins (Statistician)
From the University of Sydney, School of Public Health, and the NSW Centre for Physical Activity and HealthDr Baohui Yang (Statistician)
Field teamLiesel Allen Rutherford Technology High School
Claire Anderson Pymble Ladies College
Michelle Andrews Point Clare Public School
Belinda Harden PLC Sydney
Tim Henry Mt St Joseph Milperra
Adam Johnson Fairfield High School
Paul Lynch Bishop Tyrrell Anglican College
Glen McClue Mount Riverview High School
Craig Maher Tuggerah Lakes Secondary College
Brenda Norman Deniliquin High School
Amanda Palmer Riverside Girls High School
Vanessa Roach Boronia Park Public School
Paul Robinson Arncliffe Public School
Anthony Simone Berala Public School
Cheryl Small Epping Public School
Supplementary studyWayne Cotton Faculty of Education, University of Wollongong Kate Williams School of Public Health, University of Sydney
Alana Craft Mt St Joseph Milperra
FundingThe survey was funded primarily by NSW Health. In addition, the NSW Department of Education and Training funded several members of the field team.
Education sector liaisonMs Rosemary Davis, NSW Department of Education and Training Ms Julie Thompson, Association of Independent Schools
Mr Paul Doorn, NSW Department of Education and Training Ms Lorraine Walker, Catholic Education Commission, NSW
Photographic Images Courtesy of Beecroft Primary School and Kingsgrove High School.
EditorDr Mark Ragg, Ragg Ahmed Pty Ltd
Recommended citationBooth M, Okely AD, Denney-Wilson E, Hardy L, Yang B, Dobbins T (2006). NSW Schools Physical Activity and Nutrition Survey (SPANS) 2004: Summary Report. Sydney: NSW Department of Health.
This work is copyright. It may be reproduced in whole or part for study training purposes subject to the inclusion of an acknowledgment of the source and no commercial usage or sale.
© NSW Department of Health
ISBN: 0 7347 3931SHP: (CCDPHA) 060058
This report is one of a series of three reports.
The other two are: Booth M, Okely AD, Denney-Wilson E, Hardy L, Yang B, Dobbins T (2006). NSW Schools Physical Activity and Nutrition Survey (SPANS) 2004: Full Report. Sydney: NSW Department of Health.
NSW Centre for Overweight and Obesity (2006). NSW Schools Physical Activity and Nutrition Survey (SPANS) 2004: Short Report. Sydney: NSW Department of Health.
Download copies of these reports: www.health.nsw.gov.au or www.coo.health.usyd.edu.au
For additional copies contact: Better Health Centre Phone: (02) 9879 0443 Fax: (02) 9879 0994
Further information about this document is available from: Nutrition and Physical Activity Branch Centre for Chronic Disease Prevention and Health Advancement NSW Department of Health LMB 961 North Sydney NSW 2059 Phone: (02) 9391 9661
Acknowledgements

ForewordPhysical activity, good nutrition and maintaining a healthy weight are important factors for developing and maintaining good health. Although overweight and obesity has long been regarded by health professionals as an important condition that increases the risk of ill-health, it has only recently been recognised as a population-wide problem that requires a whole-of-community approach.
In September 2002, the NSW Government convened the NSW Childhood Obesity Summit in response to the threat of rapidly rising rates of overweight and obesity among children.
Two key recommendations of the summit were:
• to establish a centre of excellence for research into overweight and obesity; and
• to commission a state-wide survey to determine the current levels of overweight and obesity, patterns of physical activity and sedentary behaviour, and the nutrition profiles of children and young people in New South Wales.
In 2003, the NSW Centre for Overweight and Obesity was established at the University of Sydney. Its first task was to conduct a survey of physical activity and nutrition in school students (SPANS). Almost 5500 school-aged children in NSW participated in the survey, one of the most comprehensive ever conducted in Australia.
This report provides the NSW Government with the information needed to further develop its policies and programs in the area, and also to assess progress against the Prevention of Obesity in Children and Young People: NSW Government Action Plan 2003–2007.
John Hatzistergos, Minister for HealthApril 2006
SPANS 2004 Summary Reportii
1 • page 3 Prevalence of overweight, obesity and combined overweight and obesity among boys and girls in Years K, 2, 4, 6, 8 and 10
2 • page 4 Secular trends in the prevalence of overweight and obesity combined among boys and girls in Years 2, 4, 6, 8 and 10, for the 1985, 1997 and 2004 NSW data sets
3 • page 6 Prevalence of 1 hour/day of MVPA during summer school terms among boys and girls in Years 6, 8 and 10
4 • page 6 Prevalence of 1 hour/day of MVPA during summer school terms among boys and girls in Years 8 and 10 in 1997 and 2004
5 • page 7 Median hours/week spent in small screen recreation (SSR), educational, travel, cultural and social sedentary behaviours among boys and girls in Years 6, 8 and 10
6 • page 7 Prevalence of engaging in more than 2 hours/day of small screen recreation among boys and girls in Years 6, 8 and 10
7 • page 9 Prevalence of the use of the different modes of travel to school among boys and girls in Years 6, 8 and 10
8 • page 10 Prevalence of adequate fitness among boys and girls in Years 4, 6, 8 and 10
9 • page 12 Prevalence of skill mastery and near-mastery among boys and girls in Years 2, 4, 6, 8 and 10
10 • page 13
Proportion of boys and girls in Years 6, 8 and 10
consuming nil, 1, 2-3, 4-5 or 6+ serves of fruit per day
11 • page 14 Proportion of boys and girls in Years 6, 8 and 10 consuming nil, 1, 2-3, 4-5 or 6+ serves of vegetables per day
12 • page 15 Proportion of boys and girls in Years 6, 8 and 10 consuming nil, < 250ml, 250-400ml, 400ml-1 litre or > 1 litre of soft drink per day
13 • page 18 Proportion of boys and girls in Years 6, 8 and 10 consuming fast food never, less than once/week, 1-3 times/week, 4-6 times/week or every day
List of figures and tables
Figures
Tables
1 • page 2 Measures administered to each Year group and their approximate ages

Foreword ................................................................................................. i
List of figures and tables ............................................................... ii
Executive summary ..........................................................................iv
1: What is SPANS 2004? ........................................................... 1
2: How did we carry out the survey? ................................. 2
3: Overweight and obesity ....................................................... 3
4: Physical activity ......................................................................... 5
5: Sedentary behaviours ............................................................ 7
6: Travel to and from school ................................................... 9
7: Cardiorespiratory fitness ....................................................10
8: Fundamental movement skills ........................................11
9: Food habits ...............................................................................13
10: Eating patterns ........................................................................18
11: Influences over food and drink choices .....................19
12: Markers of chronic disease ...............................................20
13: School environment .............................................................21
14: Recommendations ................................................................22
15: References .................................................................................23
Contents

Executive summaryAlmost 5500 school-aged children in Kindergarten and Years 2, 4, 6, 8 and 10 – students aged 5 to 16 – were surveyed in 2004 as part of the NSW Schools Physical Activity and Nutrition Survey (SPANS). The aim was to provide current data and trends on physical activity, modes of travel to and from school, fundamental movement skill proficiency, sedentary behaviours, fitness levels, food habits and eating patterns, risk factors for chronic disease and the body composition of children and young people in NSW.
Overweight and obesity
Overall, almost a quarter of students aged 5-16 were overweight or obese. Boys and girls aged 9-12 (Years 4-6) had some of the highest rates – up to 33% for some groups. Children from lower socioeconomic areas and those from Middle Eastern backgrounds were more likely to be in an unhealthy weight range.
Many more students were overweight or obese in 2004 than in 1985 or 1997, based on comparable surveys. For boys, the rate of increase in overweight is speeding up, although among girls the rate of increase is steady or slowing.
Overall, the prevalence of overweight and obesity combined among students aged 7-16 has risen from 11% in 1985 to 20% in 1997 to 25% in 2004.
Physical activity, and travel to and from school
In 2004, three-quarters of boys and girls aged 11-16 years met the national recommendation of at least one hour of moderate to vigorous physical activity each day.
Today’s students are generally more active than their counterparts in 1985 and 1997, with the prevalence of physical activity participation increasing by between 15% and 25% from 1985 to 2004 among secondary school students.
About 30% of Year 6 students walked to school every day and the same proportion travelled by car. Twenty per cent used public transport. Among secondary school students, more than 50% used public transport, 20% walked and 20% travelled by car.
Sedentary behaviours
A very high proportion of young people spent more than the recommended two hours a day in front of a small screen. Research shows that excessive TV watching and small screen recreation – computer games and so on – is associated with increased risk of overweight and obesity.
Fitness and fundamental movement skills
More than 50% of boys and more than 60% of girls were adequately fit. This is an increase from 1997.
Proficiency at fundamental movement skills like catching, throwing, running and jumping also increased significantly between 1997 and 2004.
Food habits
While students ate reasonable amounts of fruits, few ate the recommended amount of vegetables. Students ate confectionery too often, and many drank too much soft drink instead of milk or fruit juice. Those who drank milk tended to drink full cream milk, not low fat as recommended.
The most striking feature was the proportion of students who missed meals. Regular meals – with the family and away from the TV – promote healthy eating.
Markers of chronic disease
Almost one in five 15-16-year-olds had high insulin concentrations, putting them at risk for the development of type 2 diabetes. Nine per cent of boys showed signs of damage to their livers and 10% had risk factors for the development of cardiovascular disease. Overweight and obese students were much more likely than those who were not overweight to have risk factors for diabetes, cardiovascular disease and liver disease. In fact, more than 20% of boys who were either overweight or obese had two or more risk factors.
School environments
Most primary and secondary schools have a wide range of facilities that could be used for physical activity. There is very little difference between urban and rural schools, and compared to 1997 data the usage trends are generally positive. However, facilities in most primary and secondary schools are not made available before and after school. This may be due to concerns about liability, supervision requirements and vandalism.
Evidence from other parts of this survey, such as the increases in students’ fundamental movement skills, cardiorespiratory fitness and physical activity, highlight the fine work that schools have done over the past seven years.
iv SPANS 2004 Summary Report
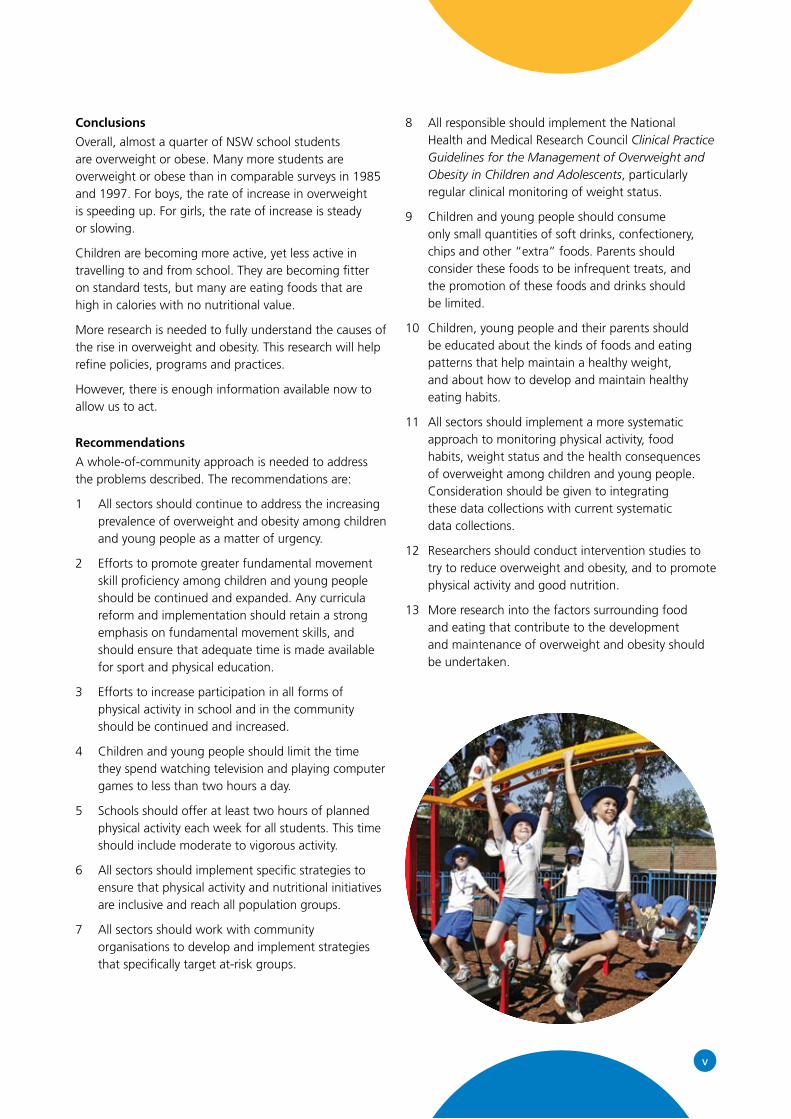
Conclusions
Overall, almost a quarter of NSW school students are overweight or obese. Many more students are overweight or obese than in comparable surveys in 1985 and 1997. For boys, the rate of increase in overweight is speeding up. For girls, the rate of increase is steady or slowing.
Children are becoming more active, yet less active in travelling to and from school. They are becoming fitter on standard tests, but many are eating foods that are high in calories with no nutritional value.
More research is needed to fully understand the causes of the rise in overweight and obesity. This research will help refine policies, programs and practices.
However, there is enough information available now to allow us to act.
Recommendations
A whole-of-community approach is needed to address the problems described. The recommendations are:
1 All sectors should continue to address the increasing prevalence of overweight and obesity among children and young people as a matter of urgency.
2 Efforts to promote greater fundamental movement skill proficiency among children and young people should be continued and expanded. Any curricula reform and implementation should retain a strong emphasis on fundamental movement skills, and should ensure that adequate time is made available for sport and physical education.
3 Efforts to increase participation in all forms of physical activity in school and in the community should be continued and increased.
4 Children and young people should limit the time they spend watching television and playing computer games to less than two hours a day.
5 Schools should offer at least two hours of planned physical activity each week for all students. This time should include moderate to vigorous activity.
6 All sectors should implement specific strategies to ensure that physical activity and nutritional initiatives are inclusive and reach all population groups.
7 All sectors should work with community organisations to develop and implement strategies that specifically target at-risk groups.
8 All responsible should implement the National Health and Medical Research Council Clinical Practice Guidelines for the Management of Overweight and Obesity in Children and Adolescents, particularly regular clinical monitoring of weight status.
9 Children and young people should consume only small quantities of soft drinks, confectionery, chips and other “extra” foods. Parents should consider these foods to be infrequent treats, and the promotion of these foods and drinks should be limited.
10 Children, young people and their parents should be educated about the kinds of foods and eating patterns that help maintain a healthy weight, and about how to develop and maintain healthy eating habits.
11 All sectors should implement a more systematic approach to monitoring physical activity, food habits, weight status and the health consequences of overweight among children and young people. Consideration should be given to integrating these data collections with current systematic data collections.
12 Researchers should conduct intervention studies to try to reduce overweight and obesity, and to promote physical activity and good nutrition.
13 More research into the factors surrounding food and eating that contribute to the development and maintenance of overweight and obesity should be undertaken.
v

The NSW Schools Physical Activity and Nutrition Survey (SPANS) was carried out in 2004 and had four main aims:
to provide up-to-date information on schoolchildren and their weight, fitness levels, eating patterns and levels of physical activity, including a comparison with earlier figures
to examine the key behaviours likely to contribute to a child being overweight
to look at the prevalence of some of the risk factors associated with chronic disease, such as heart disease and type 2 diabetes; and
to provide a basis for recommended actions to address the issues.
The full results of the survey are available at a www.health.nsw.gov.au or www.coo.health.usyd.edu.au
This report comprises a summary of the full report.
•
•
•
•
1: What is SPANS 2004?Concern over the rising levels of childhood obesity led to the NSW Childhood Obesity Summit in 2002. As a consequence of the summit, the NSW Department of Health established the NSW Centre for Overweight and Obesity, then commissioned it to carry out a state-wide survey of school children.
1 SPANS 2004 Summary Report1

2
Almost 5500 children from Kindergarten and Years 2, 4, 6, 8 and 10 took part. Children in these years range from 5 to 16 years of age.
Field staff were trained to collect the relevant information. The measures included:
height, weight and waist girth
fundamental movement skill proficiency
physical activity and cardiorespiratory fitness
modes of travel to and from school
the time usually spent in sedentary behaviours
food habits and eating patterns.
In addition, five sub-studies were conducted on:
physical activity
markers of chronic disease
the school environment
school canteens
response bias.
•
•
•
•
•
•
•
•
•
•
•
Not all measures were administered to all students. Table 1 shows which measures were administered to which Year groups.
The response rates for the different components of the survey were satisfactory and the sample had similar demographic characteristics to the NSW population of primary and secondary school students as a whole, and therefore it can be thought to accurately represent the population.
2: How did we carry out the survey?Ninety-three schools (45 primary and 48 secondary schools), which represented a mix of schools in NSW – urban and rural, primary and secondary, and Government, Catholic and Independent – were surveyed.
Table 1: Measures administered to each Year group and their approximate ages
Kindergarten Year 2 Year 4 Year 6 Year 8 Year 10
MeasureAge 5-6
Age 7-8
Age 9-10
Age 11-12
Age 13-14
Age 15-16
Demographics ✔ ✔ ✔ ✔ ✔ ✔
Anthropometry ✔ ✔ ✔ ✔ ✔ ✔
Fundamental movement skills ✔ ✔ ✔ ✔ ✔
Cardiorespiratory endurance (fitness) ✔ ✔ ✔ ✔
Self-reported information ✔ ✔ ✔
Physical activity sub-study ✔ ✔
Biomarker sub-study ✔

SPANS 2004 Summary Report3
Being overweight or obese substantially increases the risk of both acute health problems and the chronic diseases that account for a high proportion of illness, disability and premature death. Obese children have a high risk of becoming obese adults, and are at increased risk of developing heart disease, diabetes, orthopaedic problems, sleep apnoea, asthma, fatty liver and psychosocial problems.
Being overweight or obese is associated with psychological distress, poorer social well-being and lower income.
Method
To assess the level of overweight and obesity, the height and weight of each participant was measured by field staff. Body mass index (BMI) was used to ascertain whether someone was in a healthy or unhealthy weight range, using age-appropriate categories recommended by the International Obesity Task Force.1 BMI was calculated using the following formula:
Body mass index = weight in kg (height in m)2
Please note that for the purposes of the research, and in line with international practice, overweight is defined as being above a certain BMI, but below the level at which a person would be called obese.
Current rates
Overall, 25% of boys and 23.3% of girls were either overweight or obese.
In boys, the prevalence rose from 15% among Kindergarten boys to 32% among Year 6 boys, then fell to 27% among secondary school boys. For obesity alone, the prevalence was 6.6% among boys in Kindergarten, rising to a peak of 9.4% among Year 6 boys, before tapering off.
In girls, the prevalence was generally in the range of 20-25%, with a peak of 30% among Year 4 students. For obesity alone, the prevalence rose from 4.6% among girls in Kindergarten to a peak of 7.7% among Year 4 and 6 girls, then declined to 4.2% among Year 10 girls.
Other patterns to emerge were that:
the prevalence of overweight rose as socioeconomic status fell; and
boys of all ages, and girls in Years 4, 6 and 10, were more likely to be overweight if they came from a Middle Eastern background.
•
•
3: Overweight and obesityBeing overweight or obese is one of the most significant threats to a young person’s health.
Prev
elan
ce o
f o
verw
eig
ht
and
ob
esit
y (%
)
Boys Year Group
Year
K 2 4 6 8 10 AII0
5
10
15
20
25
30
35
Overweight Obese Combined
Prev
elan
ce o
f o
verw
eig
ht
and
ob
esit
y (%
)
Overweight Obese Combined
Girls Year Group
Year
K 2 4 6 8 10 AII0
5
10
15
20
25
30
35
Year
5
10
15
20
25
30
35
1985 1997 2004
Girls Trends 1985-1997-2004
2 4 6 8 10
Year
5
10
15
20
25
30
35
1985 1997 2004
Boys Trends 1985-1997-2004
2 4 6 8 10Pr
evel
ance
of
ove
rwei
gh
t / o
bes
ity
(%)
Prev
elan
ce o
f o
verw
eig
ht
/ ob
esit
y (%
)
Figure 1: Prevalence (%) of overweight, obesity and combined overweight and obesity among boys (top) and girls (bottom) in Years K, 2, 4, 6, 8 and 10

4
Trends 1985–2004
The proportion of schoolchildren who are overweight or obese has increased markedly over the past 20 years.
This is shown by comparing the current results with the 1997 NSW Schools Physical Activity and Fitness Survey2 and the 1985 Australian Health and Fitness Survey3 for students in Years 2-10 (age range 7-16 years).
For boys, the rate of increase sped up between the latest two surveys. That is, being overweight is becoming more of a problem, more quickly, than before.
For girls, while there is variation in age groups, in general the rate of increase is slowing. That is, while the rate of overweight and obesity is still rising, it is rising more slowly than it did between 1985 and 1997.
Summary
In 2004, almost a quarter of children and young people from Kindergarten to Year 10 (aged 5-16 years) were overweight or obese. Children in Years 6-8 (aged 9-12) had some of the highest rates. Children from lower socioeconomic areas and boys from Middle Eastern backgrounds were more likely to be overweight or obese.
Overweight and obesity is far more common than it used to be. It appears that in boys, the trend towards being overweight or obese is accelerating. In girls, the trend is not accelerating, but is still of concern.
Figure 2: Secular trends in the prevalence (%) of overweight and obesity combined among boys and girls in Years 2, 4, 6, 8 and 10, for the 1985, 1997 and 2004 NSW data sets
Year
5
10
15
20
25
30
35
1985 1997 2004
Girls Trends 1985-1997-2004
2 4 6 8 10
Year
5
10
15
20
25
30
35
1985 1997 2004
Boys Trends 1985-1997-2004
2 4 6 8 10
Prev
elan
ce o
f o
verw
eig
ht
/ ob
esit
y (%
) Pr
evel
ance
of
ove
rwei
gh
t / o
bes
ity
(%)
Year
5
10
15
20
25
30
35
1985 1997 2004
Girls Trends 1985-1997-2004
2 4 6 8 10
Year
5
10
15
20
25
30
35
1985 1997 2004
Boys Trends 1985-1997-2004
2 4 6 8 10
Prev
elan
ce o
f o
verw
eig
ht
/ ob
esit
y (%
) Pr
evel
ance
of
ove
rwei
gh
t / o
bes
ity
(%)
SPANS 2004 Summary Report
Weight-bearing physical activity, such as running, walking, dancing and ball sports, helps to maximise bone strength and bone mineral density, which are both important predictors of osteoporosis in later life.
Vigorous physical activity is associated with improved blood pressure, cholesterol and insulin concentrations, which are all related to coronary heart disease and type 2 diabetes among adults.
As well, active young people have better psychological health, and many forms of physical activity enable young people to connect with their peers and develop important social skills.
The Australian Physical Activity Guidelines for Children and Youth4 recommend that students spend at least an hour in moderate-to-vigorous physical activity (MVPA) each day. They also recommend that children should not spend more than two hours per day playing computer games, watching television or surfing the internet for entertainment.
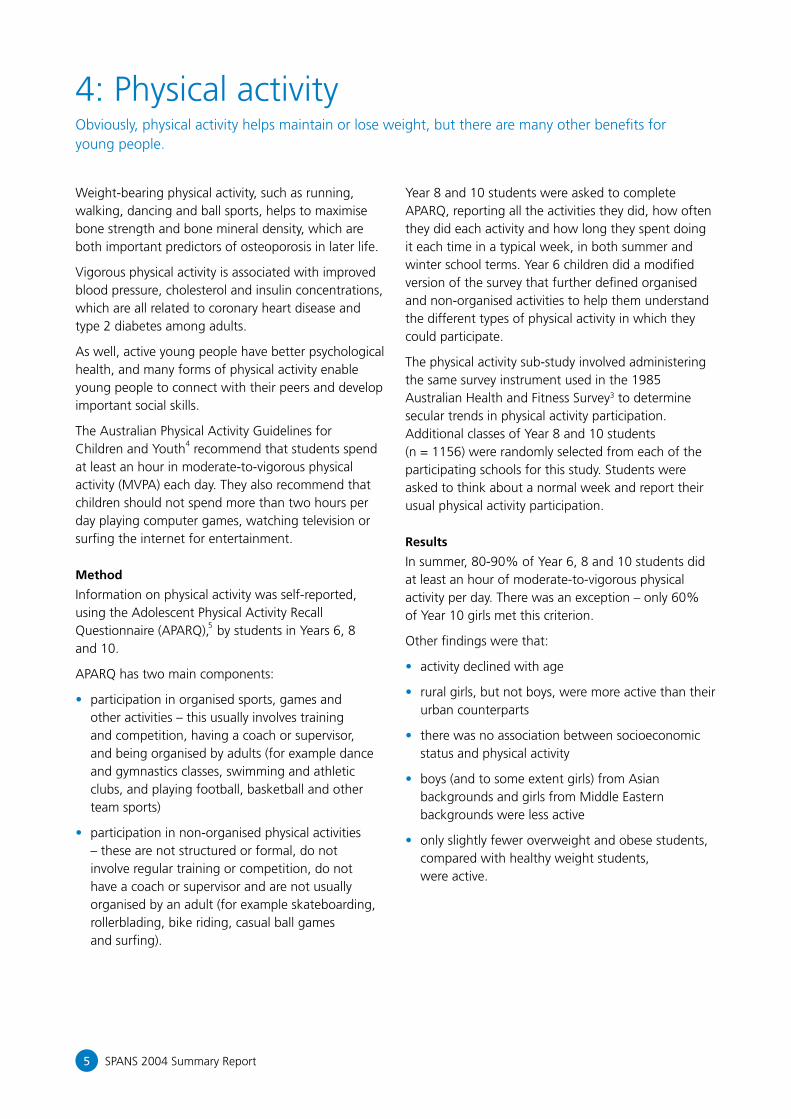
Method
Information on physical activity was self-reported, using the Adolescent Physical Activity Recall Questionnaire (APARQ),5 by students in Years 6, 8 and 10.
APARQ has two main components:
participation in organised sports, games and other activities – this usually involves training and competition, having a coach or supervisor, and being organised by adults (for example dance and gymnastics classes, swimming and athletic clubs, and playing football, basketball and other team sports)
participation in non-organised physical activities – these are not structured or formal, do not involve regular training or competition, do not have a coach or supervisor and are not usually organised by an adult (for example skateboarding, rollerblading, bike riding, casual ball games and surfing).
•
•
Year 8 and 10 students were asked to complete APARQ, reporting all the activities they did, how often they did each activity and how long they spent doing it each time in a typical week, in both summer and winter school terms. Year 6 children did a modified version of the survey that further defined organised and non-organised activities to help them understand the different types of physical activity in which they could participate.
The physical activity sub-study involved administering the same survey instrument used in the 1985 Australian Health and Fitness Survey3 to determine secular trends in physical activity participation. Additional classes of Year 8 and 10 students (n = 1156) were randomly selected from each of the participating schools for this study. Students were asked to think about a normal week and report their usual physical activity participation.
Results
In summer, 80-90% of Year 6, 8 and 10 students did at least an hour of moderate-to-vigorous physical activity per day. There was an exception – only 60% of Year 10 girls met this criterion.
Other findings were that:
activity declined with age
rural girls, but not boys, were more active than their urban counterparts
there was no association between socioeconomic status and physical activity
boys (and to some extent girls) from Asian backgrounds and girls from Middle Eastern backgrounds were less active
only slightly fewer overweight and obese students, compared with healthy weight students, were active.
•
•
•
•
•
4: Physical activityObviously, physical activity helps maintain or lose weight, but there are many other benefits for young people.
5
6
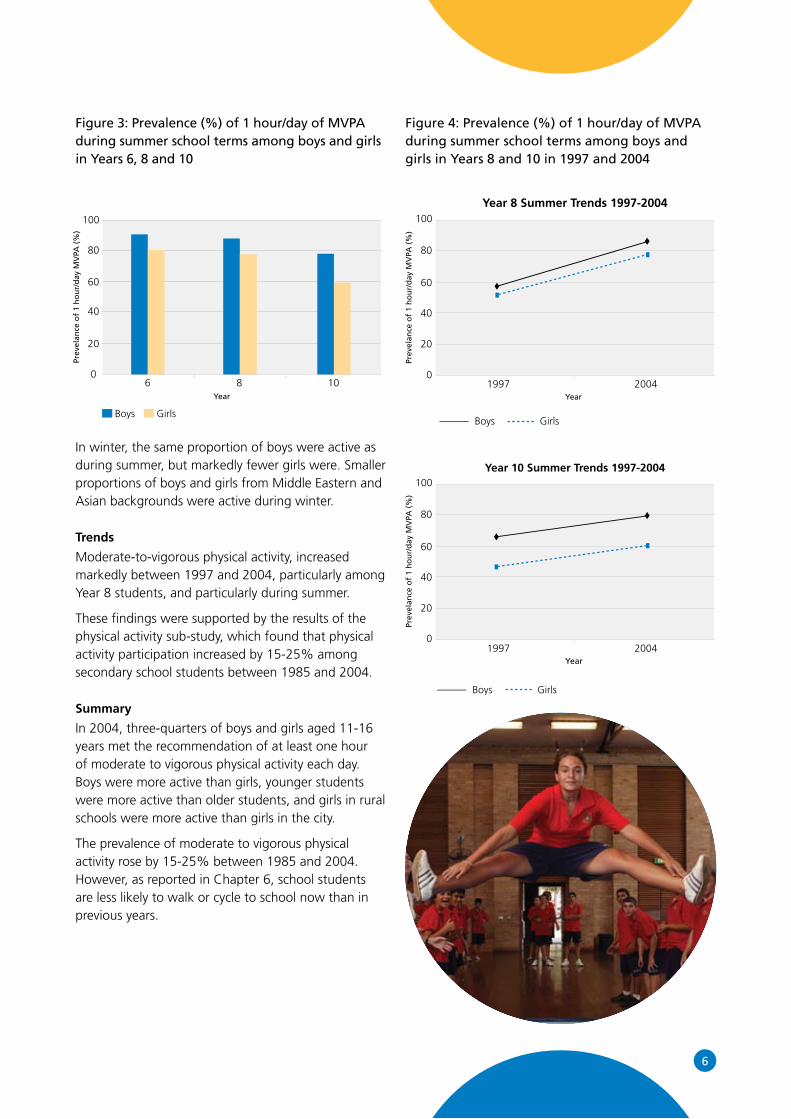
Figure 3: Prevalence (%) of 1 hour/day of MVPA during summer school terms among boys and girls in Years 6, 8 and 10
In winter, the same proportion of boys were active as during summer, but markedly fewer girls were. Smaller proportions of boys and girls from Middle Eastern and Asian backgrounds were active during winter.
Trends
Moderate-to-vigorous physical activity, increased markedly between 1997 and 2004, particularly among Year 8 students, and particularly during summer.
These findings were supported by the results of the physical activity sub-study, which found that physical activity participation increased by 15-25% among secondary school students between 1985 and 2004.
Summary
In 2004, three-quarters of boys and girls aged 11-16 years met the recommendation of at least one hour of moderate to vigorous physical activity each day. Boys were more active than girls, younger students were more active than older students, and girls in rural schools were more active than girls in the city.
The prevalence of moderate to vigorous physical activity rose by 15-25% between 1985 and 2004. However, as reported in Chapter 6, school students are less likely to walk or cycle to school now than in previous years.
Year
Prev
elan
ce o
f 1
ho
ur/
day
MV
PA (
%)
6 8 100
20
40
60
80
100
Boys Girls
0
20
40
60
80
100
Boys Girls
YearPr
evel
ance
of
1 h
ou
r/d
ay M
VPA
(%
)
0
20
40
60
80
100
1997 2004
Year 8 Summer Trends 1997-2004
Year
Prev
elan
ce o
f 1
ho
ur/
day
MV
PA (
%)
1997 2004
Year 10 Summer Trends 1997-2004
Boys Girls
Figure 4: Prevalence (%) of 1 hour/day of MVPA during summer school terms among boys and girls in Years 8 and 10 in 1997 and 2004
SPANS 2004 Summary Report7
Method
Students were asked to think about a normal school week and, from a list of 11 sedentary behaviours, write down how long they spent on each one before and after school on each day of the week and on weekends.
The raw data were summarised to yield the total number of minutes spent in sedentary behaviours each week. They were also used to determine the total number of minutes per week spent in each of the following categories of sedentary behaviours:
small screen recreation: watching TV, watching videos/DVDs, using the computer for fun
education: using the computer for homework, being tutored, Saturday school
travel: by car, bus, train or boat
cultural activities: reading for fun, doing crafts or hobbies, playing/practicing a musical instrument
social activities: sitting around, chatting with friends, talking on the phone, “chilling”, going to church.
Results
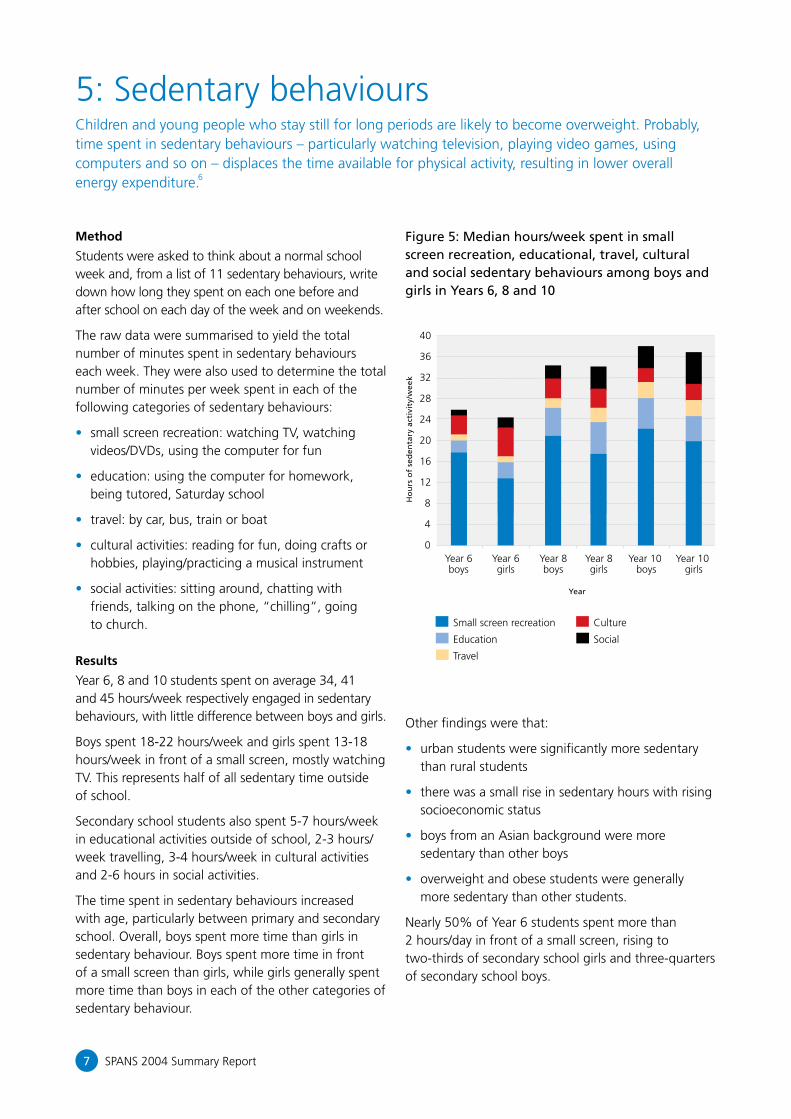
Year 6, 8 and 10 students spent on average 34, 41 and 45 hours/week respectively engaged in sedentary behaviours, with little difference between boys and girls.
Boys spent 18-22 hours/week and girls spent 13-18 hours/week in front of a small screen, mostly watching TV. This represents half of all sedentary time outside of school.
Secondary school students also spent 5-7 hours/week in educational activities outside of school, 2-3 hours/week travelling, 3-4 hours/week in cultural activities and 2-6 hours in social activities.
The time spent in sedentary behaviours increased with age, particularly between primary and secondary school. Overall, boys spent more time than girls in sedentary behaviour. Boys spent more time in front of a small screen than girls, while girls generally spent more time than boys in each of the other categories of sedentary behaviour.
•
•
•
•
•
Figure 5: Median hours/week spent in small screen recreation, educational, travel, cultural and social sedentary behaviours among boys and girls in Years 6, 8 and 10
Other findings were that:
urban students were significantly more sedentary than rural students
there was a small rise in sedentary hours with rising socioeconomic status
boys from an Asian background were more sedentary than other boys
overweight and obese students were generally more sedentary than other students.
Nearly 50% of Year 6 students spent more than 2 hours/day in front of a small screen, rising to two-thirds of secondary school girls and three-quarters of secondary school boys.
•
•
•
•
5: Sedentary behavioursChildren and young people who stay still for long periods are likely to become overweight. Probably, time spent in sedentary behaviours – particularly watching television, playing video games, using computers and so on – displaces the time available for physical activity, resulting in lower overall energy expenditure.6
Ho
urs
of
sed
enta
ry a
ctiv
ity/
wee
k
Year
Year 6boys
Year 6girls
Year 8boys
Year 8girls
Year 10 boys
Year 10 girls
0
4
8
12
16
20
24
28
32
36
40
Small screen recreation
Education
Travel
Culture
Social

8
Figure 6: Prevalence (%) of engaging in more than 2 hours/day of small screen recreation (SSR) among boys and girls in Years 6, 8 and 10
Summary
A very high proportion of young people spend more than the recommended maximum 2 hours per day watching television and engaging in other small screen behaviours. Three-quarters of secondary school boys and two-thirds of secondary school girls spend more than 2 hours per day engaged in small screen recreation. Many studies show that excessive TV watching and small screen recreation is associated with increased risk of overweight and obesity.
Year
Prev
elan
ce o
f >
2 h
ou
rs/d
ay S
SR (
%)
6 8 100
20
40
60
80
100
Boys Girls
”Children and young people who stay still for long periods are likely to become overweight.“
SPANS 2004 Summary Report9
The main purpose of this component of the survey was to determine:
the proportions of students in Years 6, 8 and 10 who travel to and from school by car, by public transport and by walking or cycling every school day
the amount of time spent walking among those who walk or use public transport; and
how these characteristics differ across the demographic variables.
The term “active travel” refers to walking or cycling for transport or, because it invariably requires some walking, using public transport.
Method
Students were asked to report, separately, how they travelled to school and how they travelled home from school in a usual week. A checklist of eight modes of transport was provided – walking, train, bicycle, car, school bus, other bus, ferry and other transport. Students were asked to report separately for travel to and from school which modes of transport they used, on how many days they used these types of transport (1-5), and how long they spent on each mode each time they used it. The proportions travelling by car, public transport or walking do not add up to 100% because students could report more than one mode of transport for each trip.
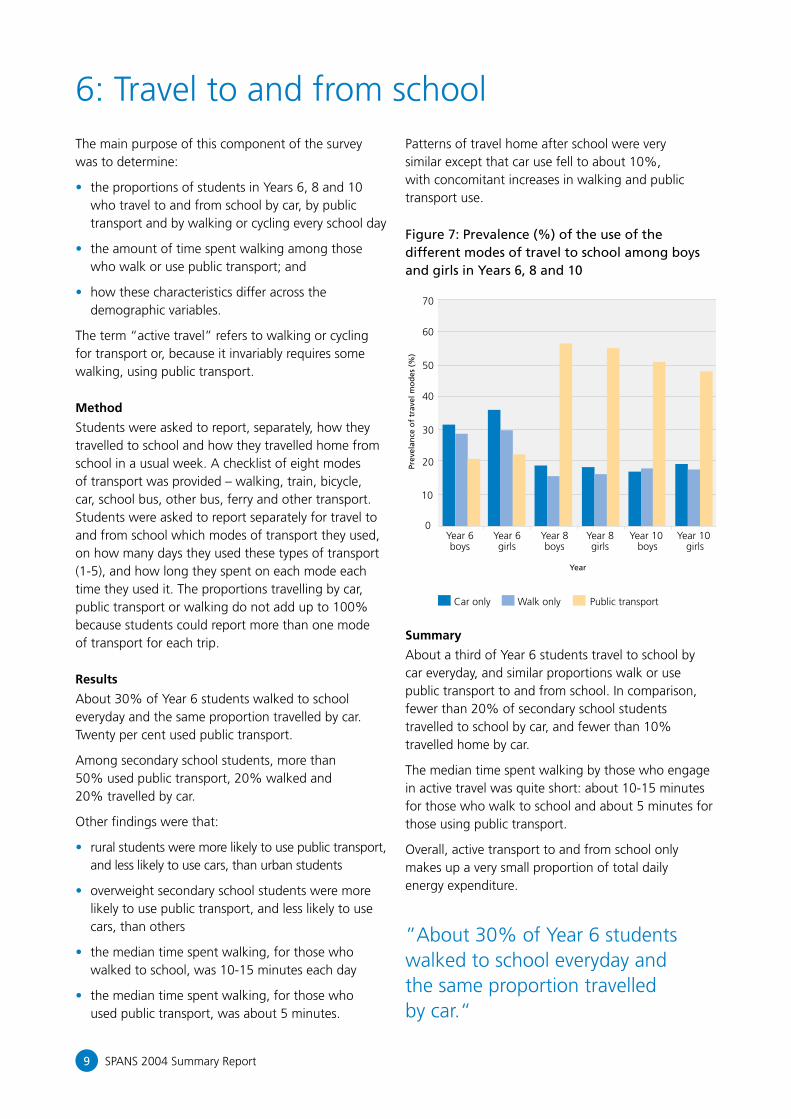
Results
About 30% of Year 6 students walked to school everyday and the same proportion travelled by car. Twenty per cent used public transport.
Among secondary school students, more than 50% used public transport, 20% walked and 20% travelled by car.
Other findings were that:
rural students were more likely to use public transport, and less likely to use cars, than urban students
overweight secondary school students were more likely to use public transport, and less likely to use cars, than others
the median time spent walking, for those who walked to school, was 10-15 minutes each day
the median time spent walking, for those who used public transport, was about 5 minutes.
•
•
•
•
•
•
•
Patterns of travel home after school were very similar except that car use fell to about 10%, with concomitant increases in walking and public transport use.
Figure 7: Prevalence (%) of the use of the different modes of travel to school among boys and girls in Years 6, 8 and 10
Summary
About a third of Year 6 students travel to school by car everyday, and similar proportions walk or use public transport to and from school. In comparison, fewer than 20% of secondary school students travelled to school by car, and fewer than 10% travelled home by car.
The median time spent walking by those who engage in active travel was quite short: about 10-15 minutes for those who walk to school and about 5 minutes for those using public transport.
Overall, active transport to and from school only makes up a very small proportion of total daily energy expenditure.
”About 30% of Year 6 students walked to school everyday and the same proportion travelled by car.“
6: Travel to and from school
Year 6boys
Year 6girls
Year 8boys
Year 8girls
Year 10 boys
Year 10 girls
Prev
elan
ce o
f tr
avel
mo
des
(%
)
Year
0
10
20
30
40
50
60
70
Car only Walk only Public transport

10
Method
Students in Years 4, 6, 8 and 10 participated in a 20-metre shuttle run test commonly known as the “beep test”.7 Scores were recorded as the level and shuttle reached in the test and converted to the number of laps completed. Based on this score, students were categorised as “adequately fit” or “unfit” using age-and sex-adjusted criterion-referenced standards from the FITNESSGRAM Test Administration Manual.8
”About 60% of boys and 70-80% of girls (except for Year 10) were adequately fit.“
Results
More than 50% of boys were adequately fit, with a small increase in this proportion with age.
More than 60% of girls were adequately fit, with this proportion slightly increasing from Year 4 to Year 8, but then decreasing from Year 8 to Year 10.
More rural boys and girls were adequately fit, although the differences between urban and rural students were quite small. More students in the highest tertile of socioeconomic status were adequately fit than in the low and middle tertiles.
Boys and girls from Middle Eastern backgrounds were less adequately fit than other students. This was also the case for Year 8 and 10 girls from Asian backgrounds.
Much smaller proportions of overweight students were adequately fit than were healthy-weight students.
Trends
Overall, the proportion of students who were classified as adequately fit increased between 1997 and 2004. These findings are consistent with the finding of increased self-reported physical activity over the same period.
Figure 8: Prevalence (%) of adequate fitness among boys and girls in Years 4, 6, 8 and 10
Summary
About 60% of boys and 70-80% of girls (except for Year 10) were adequately fit. A greater proportion of boys and girls from rural schools were classified as fit than were boys and girls attending urban schools. Generally, fitness increased between 1997 and 2004.
7: Cardiorespiratory fitnessA lack of cardiorespiratory fitness is a risk factor for coronary heart disease and other adult chronic diseases, such as colorectal cancer, type 2 diabetes and depression. It is also associated with higher all-cause mortality.
Year
Prev
elan
ce o
f ad
equ
ate
fitn
ess
(%)
4 6 8 100
20
40
60
80
100
Boys Girls

11
Fundamental movement skills form an integral part of the primary and early secondary school Personal Development, Health and Physical Education curriculum in NSW. Their prominent position is based upon:
the importance of motor development to the physical, cognitive and social growth and development of the child
our understanding that the development of fundamental movement skills is not automatic as a child grows and develops, but is largely influenced by environmental factors, including quality education – children need to be taught these skills at an early age; and
the fact that fundamental movement skills are the foundations of a physically active lifestyle.
Method
Seven fundamental movement skills were assessed. Four were locomotor skills – sprint run, vertical jump, side gallop and leap – and three were object-control skills – catch, overhand throw and kick. Observers used process-oriented checklists, with five to seven components for each skill.
For each skill, a score was calculated for each student based on the total number of components performed correctly. The number of skill components for each skill was summed to give a total score for each skill.
From this, two fundamental movement skill proficiency outcomes were created. One is mastery – possessing all components of a skill. The other is near-mastery – possessing all components bar one.
•
•
•
Results
Proficiency in fundamental movement skills increased significantly with age. Other findings are that:
boys are significantly more proficient at running, kicking, throwing and catching than girls
girls are more proficient at vertical jump, side gallop and leap than boys
proficiency increases with socioeconomic status (a relationship stronger among girls than boys); and
proficiency is markedly lower among students from Middle Eastern backgrounds, particularly girls.
Trends
In 1997, a similar assessment of fundamental movement skill proficiency was performed in the NSW Schools Fitness and Physical Activity Survey.
That survey found that, with the exception of one skill, the prevalence of mastery or near-mastery did not exceed 40% for boys and girls in any one Year group.
In contrast, the prevalence of mastery or near-mastery surpassed 40% more often than not in 2004.
In other words, the proficiency in fundamental movement skills increased markedly between 1997 and 2004. This is true for both boys and girls, and across all Years.
Summary
Students in NSW are much more proficient in fundamental movement skills in 2004 than they were in 1997. This provides clear support for the success of the professional development programs of the NSW Department of Education and Training and for the efforts of the Catholic and Independent education sectors.
•
•
•
•
8: Fundamental movement skills Fundamental movement skills are related to the health of young people. For example, studies have shown that children and adolescents with greater fundamental movement skill proficiency tend to be more physically active; have higher levels of aerobic fitness and self-esteem; and are less likely to be overweight.
SPANS 2004 Summary Report

12
0
20
40
60
80
100
0
20
40
60
80
100
Year
Prev
elan
ce o
f m
aste
ry/n
ear
mas
tery
(%
) Pr
evel
ance
of
mas
tery
/nea
r m
aste
ry (
%)
Prev
elan
ce o
f m
aste
ry/n
ear
mas
tery
(%
)
2
B
BB
BB
GG
GG G
4 6 80
20
40
60
80
100
0
20
40
60
80
100
10
Run
Year
2
B
BB
BB
G
G
GG
G
4 6 8 10
Mastery Near-mastery
Jump
Year
2
B
B
BB
G
G
G G
G
4 6 8 10
B
Catch
0
20
40
60
80
100
Prev
elan
ce o
f m
aste
ry/n
ear
mas
tery
(%
)
Prev
elan
ce o
f m
aste
ry/n
ear
mas
tery
(%
)
Year
2
B
B
B
B
G GG G G
4 6 8 10
B
Kick
Year
2
B
B
B
B
GG
GG G
4 6 8 10
B
Throw
Prev
elan
ce o
f m
aste
ry/n
ear
mas
tery
(%
)
Prev
elan
ce o
f m
aste
ry/n
ear
mas
tery
(%
)
0
20
40
60
80
100
0
20
40
60
80
100
Year
2
B
BB
BB
G
G
GG
G
4 6 8 10
Side-Gallop
Year
2
BB
B B BG
GG
GG
4 6 8 10
Leap
Mastery Near-masteryMastery Near-mastery
Mastery Near-masteryMastery Near-mastery
Mastery Near-masteryMastery Near-mastery
Figure 9: Prevalence (%) of skill mastery and near-mastery amongst boys (B) and girls (G) in Years 2, 4, 6, 8 and 10

13
Method
The SPANS food habits questionnaire was designed to examine the consumption of a set of “indicator” foods among Year 6, 8 and 10 students. The foods chosen were fruits, vegetables, bread, rice and pasta, meat, chicken and fish, milk, fruit juice, soft drinks and confectionery. Consumption of these foods has been associated with weight and health status. Selected results for those foods that have the greatest known impact on health are presented here.
Please note that because food habits were based on self-reporting, there is a tendency for “good” foods to be over-reported and “bad” foods to be under-reported.
”Food habits acquired during this time tend to continue into adulthood.“
Results
Fruit
About 65-70% of students reported eating at least two pieces of fruit each day. The Dietary Guidelines for Children and Adolescents in Australia recommends that they should eat at least three servings of fruit each day. Research also shows that fruit consumption is typically over-reported.
Fruit consumption is slightly higher among rural students, increases slightly with increasing socioeconomic status, and tends to be lower among students from Middle Eastern backgrounds.
”About 65-70% of students reported eating at least two pieces of fruit each day.“
Figure 10: Proportion (%) of boys and girls in Years 6, 8 and 10 consuming nil, 1, 2-3, 4-5 or 6+ serves of fruit per day
9: Food habits Adolescence is an important period of life for the study of health behaviours. Food habits acquired during this time tend to continue into adulthood. Adolescence is a time of increasing autonomy that provides opportunities to consume more food away from the influence of the family. Many adolescents have some discretionary income and may choose to spend this on food and drinks.
Year
Pro
po
rtio
n (
%)
6 8 10
Year
6 8 10
0
10
20
30
40
50
60
0
10
20
30
40
50
60
Pro
po
rtio
n (
%)
Boys
Girls
I don’t eat fruit
1 serve or less/day
2-3 serves/day
4-5 serves/day
6 serves or more/day
I don’t eat fruit
1 serve or less/day
2-3 serves/day
4-5 serves/day
6 serves or more/day
SPANS 2004 Summary Report

14
Vegetables
Only 15-25% of students reported eating at least four serves per day, which is the level recommended by the Dietary Guidelines for Children and Adolescents in Australia. Vegetables supply a range of vitamins and minerals, plus phytochemicals, fibre and carbohydrates. Consumption of vegetables reduces the risk of many chronic diseases, such as cancer and cardiovascular disease. Most students reported eating two serves per day.
Other findings were that:
there were no consistent associations between vegetable consumption and urban/rural place of residence or socioeconomic status
Year 8 and 10 students from Middle Eastern backgrounds had the lowest prevalence of adequate vegetable consumption
students from Asian backgrounds had the highest vegetable consumption
very few students reported eating no vegetables.
Figure 11: Proportion (%) of boys and girls in Years 6, 8 and 10 consuming nil, 1, 2-3, 4-5 or 6+ serves of vegetables per day
•
•
•
•
Year
Pro
po
rtio
n (
%)
6 8 10
Year
6 8 100
10
20
30
40
50
60
0
10
20
30
40
50
60
Pro
po
rtio
n (
%)
Boys
Girls
1 don’t eat vegetables
1 serve or less/day
2-3 serves/day
4-5 serves/day
> 6 serves/day
1 don’t eat vegetables
1 serve or less/day
2-3 serves/day
4-5 serves/day
> 6 serves/day
”Consumption of vegetables reduces the risk of many chronic diseases, such as cancer and cardiovascular disease.”
Year
Pro
po
rtio
n (
%)
6 8 10
Year
6 8 100
10
20
30
40
50
60
0
10
20
30
40
50
60
Pro
po
rtio
n (
%)
Boys
Girls
1 don’t eat vegetables
1 serve or less/day
2-3 serves/day
4-5 serves/day
> 6 serves/day
1 don’t eat vegetables
1 serve or less/day
2-3 serves/day
4-5 serves/day
> 6 serves/day

SPANS 2004 Summary Report15
Fruit juice and milk
Twenty per cent of students reported consuming fruit juice every day, and twice this number consumed fruit juice at least four times a week. Fruit juice is a source of vitamins and calories, but provides very little fibre. It is not a substitute for fresh fruit.
Slightly more than half of all boys consume at least 300ml of milk a day, but only 25-30% of girls do so. About 60% of students drink full cream milk. Only small proportions drink low fat milk, as recommended.
Soft drinks
Almost 60% of boys and more than 40% of girls drink more than 250ml per day of soft drink. As well, 7-12% of boys and a smaller proportion of girls drink more than 1 litre of it per day. These results are a concern – soft drinks are a non-nutritive, high-energy group of products, and consumption among adolescents exceeds that of the more
nutritious beverages such as milk and fruit juice.
Figure 12: Proportion (%) of boys and girls in Years 6, 8 and 10 consuming nil, < 250ml, 250-400ml, 400ml-1 litre or > 1 litre of soft drink per day
Year
Pro
po
rtio
n (
%)
6 8 10
Year
6 8 10
0
10
20
30
40
50
60
Pro
po
rtio
n (
%)
0
10
20
30
40
50
60
Boys
Girls
I don’t drink soft drink
< 250 ml/day
250-400 ml/day
> 400 ml-1 L/day
> 1 L/day
I don’t drink soft drink
< 250 ml/day
250-400 ml/day
> 400 ml-1 L/day
> 1 L/day
”Almost 60% of boys and more than 40% of girls drink more than 250ml per day of soft drink.“
Year
Pro
po
rtio
n (
%)
6 8 10
Year
6 8 10
0
10
20
30
40
50
60
Pro
po
rtio
n (
%)
0
10
20
30
40
50
60
Boys
Girls
I don’t drink soft drink
< 250 ml/day
250-400 ml/day
> 400 ml-1 L/day
> 1 L/day
I don’t drink soft drink
< 250 ml/day
250-400 ml/day
> 400 ml-1 L/day
> 1 L/day

16
Other findings were that:
soft drink consumption is generally higher among students of lower socioeconomic status
consumption is lowest among students of Asian background, and highest among boys of Middle Eastern background
most students say they would not normally choose diet soft drinks – this statement is more common among boys than girls, and more common among older students
about 20-25% of boys and 20% of girls usually drank soft drink with meals at home
about 20% of boys and 10-15% of girls usually drank soft drink with lunch at school.
Confectionery
Confectionery includes chocolates and lollies, but not biscuits, cakes, pies and sausage rolls.
Between 20% and 30% of students eat confectionery at least four times a week. About 10% of students eat confectionery daily.
This is a concern. Confectionery contains large amounts of fat and/or sugar. It is considered an “extra” food. The Australian Guide to Healthy Eating recommends that confectionery be eaten sometimes, in small amounts, or not at all.
”Between 20% and 30% of students eat confectionery at least four times a week. This is a concern.“
•
•
•
•
•
Summary
Most school students eat the recommended amount of fruit each day, but few eat the recommended amount of vegetables.
About half of all students drink more than 250ml per day of soft drink, while only 25-30% of girls drink the recommended 300ml of milk.
Many students eat too much confectionery.

18
Certain patterns of eating are associated with a healthy weight. They include:
having breakfasteating meals regularlyeating meals with familyminimising fast food consumption.
Eating a healthy breakfast also has the benefits of:
improved cognitive function at schoolattentivenesssocial interactionoverall nutrient balance and energy intake.
Adolescents who eat meals regularly with their family are more likely to:
eat the recommended amounts of fruit, vegetables and dairy products
drink less soft drinkeat less saturated fat.
Fast food outlets are very popular with adolescents, but meals from fast food outlets are generally higher in fat than food prepared at home. Adolescents who eat fast food regularly tend to have higher intakes of energy and soft drink, and consume less fruit, vegetables and milk.
Method
A self-reported questionnaire was administered to students in Years 6, 8 and 10.
Results
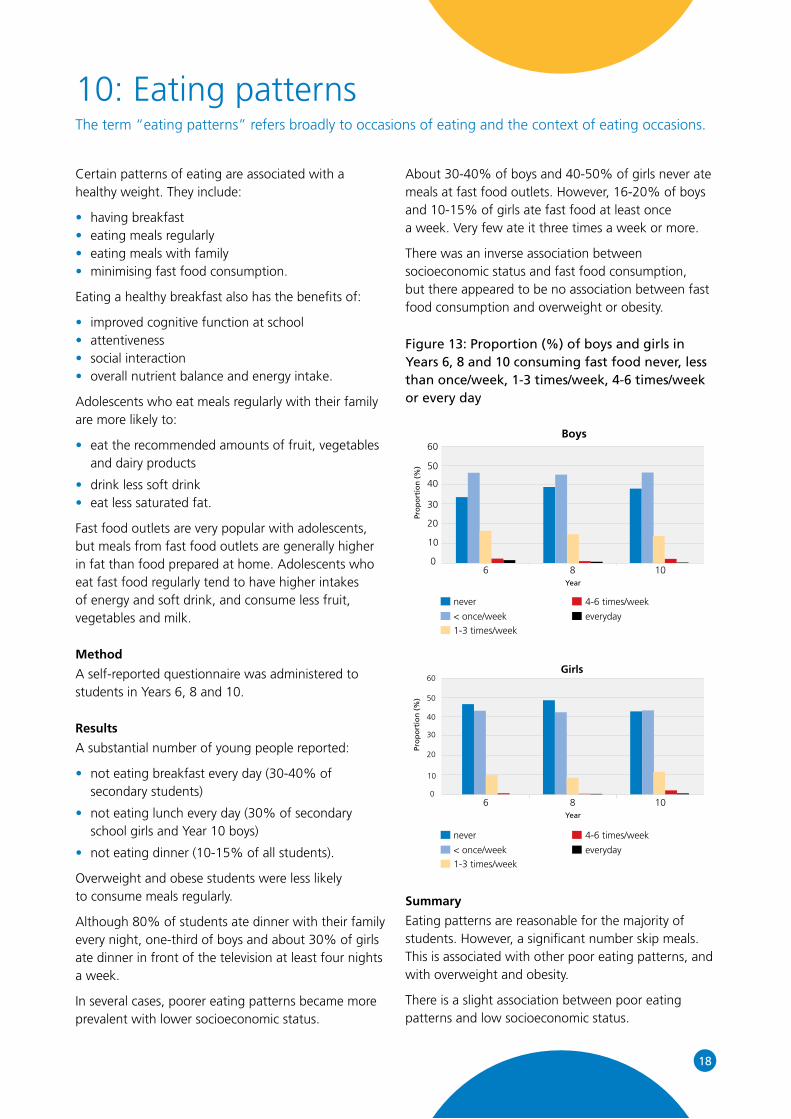
A substantial number of young people reported:
not eating breakfast every day (30-40% of secondary students)
not eating lunch every day (30% of secondary school girls and Year 10 boys)
not eating dinner (10-15% of all students).
Overweight and obese students were less likely to consume meals regularly.
Although 80% of students ate dinner with their family every night, one-third of boys and about 30% of girls ate dinner in front of the television at least four nights a week.
In several cases, poorer eating patterns became more prevalent with lower socioeconomic status.
••••
••••
•
••
•
•
•
About 30-40% of boys and 40-50% of girls never ate meals at fast food outlets. However, 16-20% of boys and 10-15% of girls ate fast food at least once a week. Very few ate it three times a week or more.
There was an inverse association between socioeconomic status and fast food consumption, but there appeared to be no association between fast food consumption and overweight or obesity.
Figure 13: Proportion (%) of boys and girls in Years 6, 8 and 10 consuming fast food never, less than once/week, 1-3 times/week, 4-6 times/week or every day
Summary
Eating patterns are reasonable for the majority of students. However, a significant number skip meals. This is associated with other poor eating patterns, and with overweight and obesity.
There is a slight association between poor eating patterns and low socioeconomic status.
10: Eating patternsThe term “eating patterns” refers broadly to occasions of eating and the context of eating occasions.
Year
Pro
po
rtio
n (
%)
6 8 10
Year
6 8 10
0
10
20
30
40
50
60
0
10
20
30
40
50
60
Pro
po
rtio
n (
%)
Boys
Girls
never
< once/week
1-3 times/week
4-6 times/week
everyday
never
< once/week
1-3 times/week
4-6 times/week
everyday

The diets of students are influenced by a number of internal and external factors, including their:
age
family
peers
television viewing
socioeconomic status
environment
personal beliefs.
Method
The survey used a self-administered questionnaire for students in Years 6, 8 and 10.
Results
Key findings were that:
most students thought vegetables made them feel healthy, and most students usually had vegetables served to them at home for dinner, but only about half said they enjoyed the taste
about 80% of students said eating fruit made them feel healthy, while an even greater proportion said they enjoyed fruit and it was always available at home
more than half of all students felt young people liked soft drink, although only about 20% thought that drinking soft drinks made them feel good
most students liked the taste of fast food, although few thought it offered value for money
students said they chose fast food outlets on the basis of convenience, not value for money or advertising
•
•
•
•
•
•
•
•
•
•
•
•
more than 80% of students said their parent/s and/or carer/s insisted they eat breakfast, and encouraged them to eat healthy food
about a third of girls and a quarter of boys helped to prepare meals for their family
the prevalence of “good” influences – insistence on eating vegetables, dining with family, helping to prepare meals – tended to decline with age.
Summary
These findings provide clues, but do not give enough information about the influences on food and drink choices to allow interventions to be designed. More work is needed.
”...about 80% of students said eating fruit made them feel healthy, while an even greater proportion said they enjoyed fruit and it was always available at home.“
•
•
•
11: Influences over food and drink choices
19 SPANS 2004 Summary Report

There is evidence that some of the markers of adult disease are present in children. It is presumed that these markers and risk factors are modifiable.
Method
In this sub-study, blood samples were collected from volunteer Year 10 students in the Sydney metropolitan area. The following measures were made, for the following reasons:
high density lipoprotein cholesterol (HDL), low density lipoprotein cholesterol (LDL), triglycerides and high sensitivity C-reactive protein (hsCRP) – all risk factors for cardiovascular disease
insulin and glucose – indicators of the likely development of type 2 diabetes, and also of cardiovascular disease
alanine aminotransferase (ALT) and gamma glutamyltransferase (GGT) – both indicators of liver cell injury or damage.
Blood pressure, which is a risk factor for cardiovascular disease, was also measured.
The levels determined to be abnormal, and the reasoning behind such decisions, can be seen in the full report.
Results
Boys were more likely than girls to have risk factors for chronic disease.
Fifteen to twenty per cent of Year 10 students had elevated concentrations of insulin. Twenty per cent of boys and 5% of girls had high blood pressure.
Nine per cent of Year 10 boys also had elevated ALT concentrations, 10% had low concentrations of HDL cholesterol and 5% had elevated concentrations of LDL cholesterol. Ten per cent had elevated C-reactive protein. Except for insulin and LDL cholesterol, all of the biomarkers were less prevalent among girls.
•
•
•
Almost 70% of obese boys, and an additional 30% of overweight boys, had elevated insulin levels. Obese girls were also much more likely than non-obese girls to have elevated insulin.
More than one quarter of overweight and obese boys, and one in five obese girls, had low levels of “good” cholesterol, and more than 30% of overweight and obese boys had high blood pressure. Over 40% of obese boys had elevated ALT.
In general, there was an inverse relationship between socioeconomic status and raised biomarkers.
Summary
The findings of this study are of very real concern. Almost one in five adolescents have high insulin concentrations, which is a significant step along the path to type 2 diabetes.
Overweight and obese boys have significant risk factors for type 2 diabetes, heart disease and fatty liver disease.
20
12: Markers of chronic disease Obese children and adolescents are at increased risk of developing a number of chronic, debilitating health problems, such as cardiovascular disease, type 2 diabetes and fatty liver disease. Because of the seriousness and prevalence of these conditions, cardiovascular disease and type 2 diabetes are two of Australia’s six health priority areas.

21
Method
The school environment was defined as including:
the physical environment – facilities and equipment
school policies – time allocated for PE and sport
school practices – making facilities available, allocation of staff to teaching PE and sport, barriers to participation and strategies to promote participation.
This definition encapsulates components of the Health Promoting School model, and also the way that school staff contextualise health, particularly physical activity.
It should be kept in mind that although randomly selected, only 45 primary and 48 secondary schools were surveyed for this part of the study. These are small figures, so caution in interpreting the results is recommended.
The school environment questionnaire was identical to that used in the NSW Schools Fitness and Physical Activity Survey 1997, allowing changes in NSW schools between 1997 and 2004 to be assessed.
Results
Most primary and secondary schools had a wide range of facilities that could be used for physical activity, with very little difference between urban and rural schools. However, facilities in most primary and secondary schools were not made available before and after school. This may be due to concerns about liability, supervision requirements and vandalism.
Most school staff felt PE and sport were well supported by their school and parents.
About half of the primary schools surveyed did not allocate the recommended amount of time (120 minutes per week) for physical activity.
The activities offered by primary and secondary schools for sport and PE were many and varied. It is clear that, in NSW schools, many activities beyond the “traditional” sports were available for students.
•
•
•
Schools reported that competing demands on curriculum time, and the amount and standard of facilities, were the strongest barriers to promoting physical activity.
Trends
In general, the trends were very positive. The exception is that more schools used external providers of physical education in 2004 than 1997.
Summary
Schools in NSW appear to be attempting to make their environments and policies supportive of physical activity participation. Given the many barriers to being physically active that have existed in schools over the past seven years – crowded curriculum, litigation and vandalism fears, safety concerns – it is clear that most schools have responded in positive ways, working to continue to provide physical activity opportunities for students.
Evidence from other parts of this survey – increases in students’ fundamental movement skills, cardiorespiratory fitness and physical activity – highlight the fine work that schools have done over the past seven years.
”In general, the trends were positive. The exception is that more schools used external providers of physical education in 2004 than 1997.“
13: School environmentTraditionally, research seeking to understand the influences on health behaviours has focused on individual factors such as age and sex (biological) and self-esteem and enjoyment (psychological). While individual factors are important, it is now well accepted that social and physical environment factors are also relevant. This part of the study examined the school environment.
SPANS 2004 Summary Report
The following recommendations take into account the results of the SPANS study as well as existing policies, programs and infrastructure in New South Wales. They use the following principles:
that all relevant government, non-government and private sectors – including health, education, sport and recreation, local government, transport and urban planning – have a shared responsibility with parents and community groups to act
that the recommendations apply to all children and young people in New South Wales, although in some cases there is an additional emphasis on at-risk groups.
The recommendations are as follows.
1. All sectors should continue to address the increasing prevalence of overweight and obesity among children and young people as a matter of urgency.
2. Efforts to promote greater fundamental movement skill proficiency among children and young people should be continued and expanded. Any curricula reform and implementation should retain a strong emphasis on fundamental movement skills, and should ensure that adequate time is made available for sport and physical education.
3. Efforts to increase participation in all forms of physical activity in school and in the community should be continued and increased.
4. Children and young people should limit the time they spend watching television and playing computer games to less than two hours a day.
5. Schools should offer at least two hours of planned physical activity each week for all students. This time should include moderate to vigorous activity.
6. All sectors should implement specific strategies to ensure that physical activity and nutritional initiatives are inclusive and reach all population groups.
7. All sectors should work with community organisations to develop and implement strategies that specifically target at-risk groups.
•
•
8. All responsible should implement the National Health and Medical Research Council Clinical Practice Guidelines for the Management of Overweight and Obesity in Children and Adolescents, particularly regular clinical monitoring of weight status.
9. Children and young people should consume only small quantities of soft drinks, confectionery, chips and other “extra” foods. Parents should consider these foods to be infrequent treats, and the promotion of these foods and drinks should be limited.
10. Children, young people and their parents should be educated about the kinds of foods and eating patterns that help maintain a healthy weight, and about how to develop and maintain healthy eating habits.
11. All sectors should implement a more systematic approach to monitoring physical activity, food habits, weight status and the health consequences of overweight among children and young people. Consideration should be given to integrating these data collections with current systematic data collections.
12. Researchers should conduct intervention studies to try to reduce overweight and obesity, and to promote physical activity and good nutrition.
13. More research into the factors surrounding food and eating that contribute to the development and maintenance of overweight and obesity should be undertaken.
14: Recommendations
22
23 SPANS 2004 Summary Report
1 Cole TJ, Bellizzi MC, Flegal KM, Dietz, WH (2000). Establishing a standard definition for child overweight and obesity worldwide: international survey. British Medical Journal, 320, 1240-1243.
2 Booth M, Macaskill P, McLellan, Phongsavan P, Okely T, Patterson J, Wright J, Bauman A, Baur L (1997). NSW Schools Fitness and Physical Activity Survey, 1997: Summary. Sydney: NSW Dept of School Education.
3 Australian Council for Health, Physical Education and Recreation (1987). Australian Health and Fitness Survey 1985. Parkside, South Australia: ACHPER.
4 Australian Government Department of Health and Ageing (2005). Australia’s Physical Activity Recommendations for Children and Young People. Canberra: Australian Government.
5 Booth ML, Okely AD, Chey T, Bauman A (2002). The reliability and validity of the Adolescent Physical Activity Recall Questionnaire. Medicine and Science in Sports and Exercise, 34, 1986-1995.
6 British Heart Foundation (2000). Couch kids: The growing epidemic. London: British Heart Foundation.
7 Leger LA, Lambert J (1982). A maximal multistage 20-m shuttle run test to predict V02 max. European Journal of Applied Physiology, 49, 1-12.
8 Cooper Institute for Aerobic Research (1999). FITNESSGRAM Test Administration Manual (2nd ed.). Champaign, IL: Human Kinetics.
15: References


© NSW Department of HealthISBN: 0 7347 3931SHP: (CCDPHA) 060058