nsw land and housing corporation - city of sydney
TRANSCRIPT

NSW Land and Housing Corporation
Glebe Mid-Rise Project
Planning Proposal – Traffic, Transport and Parking Report
Report Ref
Final | 11 May 2020
This report takes into account the particular
instructions and requirements of our client.
It is not intended for and should not be relied
upon by any third party and no responsibility
is undertaken to any third party.
Job number 272553-00
Arup Pty Ltd ABN 18 000 966 165
Arup
Level 5
151 Clarence Street
Sydney NSW 2000
Australia
www.arup.com

NSW Land and Housing Corporation Glebe Mid-Rise Project Planning Proposal – Traffic, Transport and Parking Report
Report Ref | Final | 11 May 2020 | Arup
\\GLOBAL.ARUP.COM\AUSTRALASIA\SYD\PROJECTS\272000\272553-00 GLEBE MIDRISE\WORK\INTERNAL\REPORTING\20200511 GLEBE MIDRISE TRANSPORT
ASSESSMENT_FINAL.DOCX
Contents Page
1 Introduction 2
1.1 Background 2
1.2 Scope of the Report 2
2 Existing Conditions 3
2.1 Site Location 3
2.2 Active Travel 4
2.3 Public Transport 5
2.4 Private Vehicles 8
3 Proposed Development 13
4 Proposed Transport Provision 14
4.1 Active Travel 14
4.2 Private Vehicles 15
4.3 Service vehicles 18
5 Transport Impact Assessment 20
5.1 Multimodal trip generation 20
5.2 Road network assessment 23
6 Summary 27
Appendices
Appendix A
Existing Traffic Volumes
Appendix B
SIDRA Modelling Results
Appendix C
Swept Paths

NSW Land and Housing Corporation Glebe Mid-Rise Project Planning Proposal – Traffic, Transport and Parking Report
Report Ref | Final | 11 May 2020 | Arup
\\GLOBAL.ARUP.COM\AUSTRALASIA\SYD\PROJECTS\272000\272553-00 GLEBE MIDRISE\WORK\INTERNAL\REPORTING\20200511 GLEBE MIDRISE TRANSPORT
ASSESSMENT_FINAL.DOCX
Page 2
1 Introduction
1.1 Background
Arup was appointed by NSW Land and Housing Corporation (LAHC) to provide
traffic and transport services to support the development of the Glebe mid-rise
project (the development). The development is a partnership between LAHC, City
of Sydney and the Government Architect NSW (GANSW) to deliver a mixed
tenure, mid-rise residential development. The proposed location for the
development is at 31 Cowper Street, Glebe and 2A-2D Wentworth Park Road,
Glebe.
1.2 Scope of the Report
This Traffic, Transport and Parking Report has been prepared to support the
Planning Proposal for the development. The Planning Proposal seeks to increase
the floor space ratio of the site from the existing ratio of 1.25, as outlined in the
City of Sydney LEP.
This report presents the following:
• An explanation of the existing transport conditions locally combined with
regional context;
• Description of the proposed development;
• Estimated multimodal trip generation for the proposed development and future
mode share targets;
• Information on walking, cycling and public transport surrounding the site,
including the development’s impact on these networks;
• Traffic analysis including SIDRA modelling of intersections in the vicinity of
the proposed development;
• Description of the proposed access arrangements for the development; and
• Parking and servicing arrangements that comply with Australian Standards
and parking demand management strategies.

NSW Land and Housing Corporation Glebe Mid-Rise Project Planning Proposal – Traffic, Transport and Parking Report
Report Ref | Final | 11 May 2020 | Arup
\\GLOBAL.ARUP.COM\AUSTRALASIA\SYD\PROJECTS\272000\272553-00 GLEBE MIDRISE\WORK\INTERNAL\REPORTING\20200511 GLEBE MIDRISE TRANSPORT
ASSESSMENT_FINAL.DOCX
Page 3
2 Existing Conditions
2.1 Site Location
The project comprises of 31 Cowper Street (south site) and 2A-2D Wentworth
Park Road (north site), which are located in Glebe, within the City of Sydney
Local Government Area (LGA). These sites are approximately two and a half
kilometres south west of the Sydney Central Business District (CBD). The two
sites combined will be referred to as “the site”. The site is situated south of
Wentworth Park, a popular venue for sporting events and leisure activities.
The site is bounded by Wentworth Park Road to the north, Cowper Street to the
east, Wentworth Street to the south and Mitchell Lane East to the west. Park Lane
runs east-west through the site. The site has a total area of approximately 1,800m2
and is presented on Figure 1.
Figure 1: Site location
There are four townhouses on the north site and 15 residential apartments on the
south site.

NSW Land and Housing Corporation Glebe Mid-Rise Project Planning Proposal – Traffic, Transport and Parking Report
Report Ref | Final | 11 May 2020 | Arup
\\GLOBAL.ARUP.COM\AUSTRALASIA\SYD\PROJECTS\272000\272553-00 GLEBE MIDRISE\WORK\INTERNAL\REPORTING\20200511 GLEBE MIDRISE TRANSPORT
ASSESSMENT_FINAL.DOCX
Page 4
2.2 Active Travel
2.2.1 Walking
Pedestrian footpaths are provided on both sides of Wentworth Street, Cowper
Street and Wentworth Park Road. There are no footpaths on Park Lane or Mitchell
Lane East. A zebra crossing is located on Wentworth Park Road west of Cowper
Street which provides a safe crossing point for pedestrians travelling between
Wentworth Park and the site (see Figure 2).
Figure 2: Zebra crossing on Wentworth Park Road

NSW Land and Housing Corporation Glebe Mid-Rise Project Planning Proposal – Traffic, Transport and Parking Report
Report Ref | Final | 11 May 2020 | Arup
\\GLOBAL.ARUP.COM\AUSTRALASIA\SYD\PROJECTS\272000\272553-00 GLEBE MIDRISE\WORK\INTERNAL\REPORTING\20200511 GLEBE MIDRISE TRANSPORT
ASSESSMENT_FINAL.DOCX
Page 5
2.2.2 Cycling
The existing cycling network surrounding the site are presented in Figure 3. A
shared path connects Wentworth Park Road and Wattle Street via Wentworth
Park. Glebe Point Road and Glebe Street are bicycle friendly streets that provide
connectivity in the vicinity of the site.
Figure 3: Existing cycling network
Source: City of Sydney, 2019
2.3 Public Transport
The public transport network surrounding the site is indicated in Figure 4. The
Wentworth Park and Glebe Light Rail stops are within walking distance of the site
and provide connections to Central Station, Leichardt and Dulwich Hill. Several
bus stops on Glebe Point Road and Harris Street are also within walking distance
and provide connections to the Sydney CBD, Leichardt, Coogee and Balmain.

NSW Land and Housing Corporation Glebe Mid-Rise Project Planning Proposal – Traffic, Transport and Parking Report
Report Ref | Final | 11 May 2020 | Arup
\\GLOBAL.ARUP.COM\AUSTRALASIA\SYD\PROJECTS\272000\272553-00 GLEBE MIDRISE\WORK\INTERNAL\REPORTING\20200511 GLEBE MIDRISE TRANSPORT
ASSESSMENT_FINAL.DOCX
Page 6
Figure 4: Existing public transport
2.3.1 Light Rail
The site is located approximately equal distance between two light rail stops. The
Wentworth Park Light Rail stop is located 750 metres to the north-east, a 10-
minute walk via Wentworth Park. The Glebe Light Rail stop is located
approximately 800 metres north-west of the site, an 11-minute walk via
Broughton Street.
The Inner West Light Rail line runs from Central to Dulwich Hill. During peak
times, the frequency of light rail services is one service every 5 to 8 minutes. The
travel time to Central Station, the closest train station to the site, is 17 minutes and
to Dulwich Hill it is 20 minutes.

NSW Land and Housing Corporation Glebe Mid-Rise Project Planning Proposal – Traffic, Transport and Parking Report
Report Ref | Final | 11 May 2020 | Arup
\\GLOBAL.ARUP.COM\AUSTRALASIA\SYD\PROJECTS\272000\272553-00 GLEBE MIDRISE\WORK\INTERNAL\REPORTING\20200511 GLEBE MIDRISE TRANSPORT
ASSESSMENT_FINAL.DOCX
Page 7
2.3.2 Bus
The site is located 450 metres away from bus services that stop along Glebe Point
Road. These bus stops provide access to routes 370, 431 and 433. Bus stops on
Harris Street are located approximately 650 metres from the site. Information on
the various bus routes and walk times are provided in Table 1.
Table 1: Bus service information
*AM-peak hour was assumed to be 08:00-09:00
2.3.3 Rail
Central Station is the closest station to the site, via a 22-minute walk or 17-minute
bus trip. Central Station provides access to a number of Sydney Trains services,
Intercity trains to various destinations and Interstate connections to Canberra and
Melbourne.
Route
No.
Route AM peak frequency (bph)* Closest stop (location
/ walk time) Inbound Outbound
370 Leichardt to
Coogee
6 5 Glebe Point Road
(203726) 6 minutes
431 Glebe Point to
Martin Place
13 5 Glebe Point Road
(203726) 6 minutes
433 Balmain to Pitt
Street
10 4 Glebe Point Road
(203726) 6 minutes
501 West Ryde to Pitt
Street
11 4 Harris Street (200720)
10 minutes

NSW Land and Housing Corporation Glebe Mid-Rise Project Planning Proposal – Traffic, Transport and Parking Report
Report Ref | Final | 11 May 2020 | Arup
\\GLOBAL.ARUP.COM\AUSTRALASIA\SYD\PROJECTS\272000\272553-00 GLEBE MIDRISE\WORK\INTERNAL\REPORTING\20200511 GLEBE MIDRISE TRANSPORT
ASSESSMENT_FINAL.DOCX
Page 8
2.4 Private Vehicles
2.4.1 Road network hierarchy
All roads immediately adjacent to the site area are local roads managed by the
City of Sydney. The key surrounding distributor roads are shown in Figure 5.
Vehicles travelling into the Sydney CBD would use Pyrmont Bridge Road,
whereas trips to the west could utilise Parramatta Road or Bridge Road.
Figure 5: Surrounding road network
2.4.2 Off-street parking
Existing vehicle access points exist along Park Lane providing access to both
sites. The north side of Park Lane provides access to 4 driveways at the rear of the
townhouses and the south side provides access to 3 lock-up garages. The existing
vehicle access points to the site are presented on Figure 6.

NSW Land and Housing Corporation Glebe Mid-Rise Project Planning Proposal – Traffic, Transport and Parking Report
Report Ref | Final | 11 May 2020 | Arup
\\GLOBAL.ARUP.COM\AUSTRALASIA\SYD\PROJECTS\272000\272553-00 GLEBE MIDRISE\WORK\INTERNAL\REPORTING\20200511 GLEBE MIDRISE TRANSPORT
ASSESSMENT_FINAL.DOCX
Page 9
Figure 6: Existing vehicle access
2.4.3 On-street parking
Kerbside restrictions in the vicinity of the site are outlined on Figure 7. Parking
restrictions on each of the surrounding streets reflect their varying functions.
There are approximately 27 2P 8am-6pm spaces, 8 2P 8am-10pm spaces and 9 2P
ticketed spaces within the vicinity of the site.
Wentworth Park Road, being a key distributor for the area, has limited, metered
parking. In contrast, the local streets and lanes adjacent to the site have a mixture
of time-restricted parking.
The Glebe (Area G) resident parking scheme Glebe applies to all streets adjacent
to the site. All residents are in the area are eligible for the scheme and their permit
exempt them from any time limit parking restrictions which apply.

NSW Land and Housing Corporation Glebe Mid-Rise Project Planning Proposal – Traffic, Transport and Parking Report
Report Ref | Final | 11 May 2020 | Arup
\\GLOBAL.ARUP.COM\AUSTRALASIA\SYD\PROJECTS\272000\272553-00 GLEBE MIDRISE\WORK\INTERNAL\REPORTING\20200511 GLEBE MIDRISE TRANSPORT
ASSESSMENT_FINAL.DOCX
Page 10
Figure 7: Existing kerbside restrictions
Due to the carriageway width on Wentworth Street (approximately 8.5m) where
parking is permitted on both sides of the street, traffic flows are only possible in
one direction at a time. From observations on site, this current arrangement does
not cause any major congestion. It was also noted that current parking restrictions
along Mitchell Lane East restrict vehicle flow. This is shown in Figure 8 below.

NSW Land and Housing Corporation Glebe Mid-Rise Project Planning Proposal – Traffic, Transport and Parking Report
Report Ref | Final | 11 May 2020 | Arup
\\GLOBAL.ARUP.COM\AUSTRALASIA\SYD\PROJECTS\272000\272553-00 GLEBE MIDRISE\WORK\INTERNAL\REPORTING\20200511 GLEBE MIDRISE TRANSPORT
ASSESSMENT_FINAL.DOCX
Page 11
Figure 8: Mitchell Lane East – restricted access due to parking
2.4.4 Existing traffic volumes
Traffic counts were undertaken in February 2020 at the Cowper Street /
Wentworth Street and Cowper Street / Wentworth Park Road intersections during
the commuter peak periods (6:00am-9:00am and 4:00pm-7:00pm). The identified
peak hours were as follows:
• AM peak hour: 8:00am – 9:00am; and
• PM peak hour: 5:30pm – 6:30pm.
The traffic flows at the intersections during these peak hours are summarised in
Table 2 and Table 3. Detailed vehicle movement diagrams are included in
Appendix A.

NSW Land and Housing Corporation Glebe Mid-Rise Project Planning Proposal – Traffic, Transport and Parking Report
Report Ref | Final | 11 May 2020 | Arup
\\GLOBAL.ARUP.COM\AUSTRALASIA\SYD\PROJECTS\272000\272553-00 GLEBE MIDRISE\WORK\INTERNAL\REPORTING\20200511 GLEBE MIDRISE TRANSPORT
ASSESSMENT_FINAL.DOCX
Page 12
Table 2: Cowper St / Wentworth St existing traffic volumes
Approach AM peak hour volume
(08:00-09:00)
PM peak hour volume
(17:30-18:30)
Cowper Street (North) 105 172
Cowper Street (South) 35 15
Wentworth Street (East) 1 1
Wentworth Street (West) 16 9
Total 157 197
Table 3: Cowper St / Wentworth Park Rd existing traffic volumes
Approach AM peak hour volume
(08:00-09:00)
PM peak hour volume
(17:30-18:30)
Cowper Street (South) 48 18
Wentworth Park Road (East) 366 980
Wentworth Park Road (West) 716 494
Total 1,130 1,492

NSW Land and Housing Corporation Glebe Mid-Rise Project Planning Proposal – Traffic, Transport and Parking Report
Report Ref | Final | 11 May 2020 | Arup
\\GLOBAL.ARUP.COM\AUSTRALASIA\SYD\PROJECTS\272000\272553-00 GLEBE MIDRISE\WORK\INTERNAL\REPORTING\20200511 GLEBE MIDRISE TRANSPORT
ASSESSMENT_FINAL.DOCX
Page 13
3 Proposed Development
The proposed development will include a mix of social and market housing, and
approximately 230m2 of non-residential floor space. The proposal comprises the
construction of two apartment blocks at adjacent sites:
• North site – 35 social housing units and 230m2 of non-residential floor space;
and
• South site – 34 private units and 5 townhouses.
Figure 9 shows an artist impression of the preliminary concept design, from the
perspective of Park Lane. The proposal also includes provision for commercial
space on the ground floor.
Figure 9: Artist impression of preliminary concept from Park Lane
The proposed apartment yields are outlined in Table 4.
Table 4: Apartment yield schedule
Site North site South site
Dwelling Type 1 bed 2 bed 1 bed 2 bed 3 bed
Units 28 7 14 20 5
Total 35 39

NSW Land and Housing Corporation Glebe Mid-Rise Project Planning Proposal – Traffic, Transport and Parking Report
Report Ref | Final | 11 May 2020 | Arup
\\GLOBAL.ARUP.COM\AUSTRALASIA\SYD\PROJECTS\272000\272553-00 GLEBE MIDRISE\WORK\INTERNAL\REPORTING\20200511 GLEBE MIDRISE TRANSPORT
ASSESSMENT_FINAL.DOCX
Page 14
4 Proposed Transport Provision
A summary of the proposed access arrangements for the development are
provided in Figure 10, with further details in the following sections.
Figure 10: Overview of proposed access arrangements
4.1 Active Travel
4.1.1 Walking
The main pedestrian access points to the development will be off Cowper Street,
and Wentworth Park Road. Access to the duplex units will also be possible from
Mitchell Lane. Open space adjacent to Wentworth Street will provide pedestrian
amenity within the south site.
4.1.2 Cycling
Both the north site and south site will provide bicycle parking facilities that can be
accessed directly from Park Lane. From Park Lane , Cowper Street and Mitchell
Street (shown in Figure 3 in Section 2.2.2) provide cycling routes which the link
to the wider City of Sydney cycling network.
Bicycle parking for residents and visitors will be provided in accordance with the
requirements outlined in the City of Sydney DCP. This will support sustainable
travel patterns to and from the development.

NSW Land and Housing Corporation Glebe Mid-Rise Project Planning Proposal – Traffic, Transport and Parking Report
Report Ref | Final | 11 May 2020 | Arup
\\GLOBAL.ARUP.COM\AUSTRALASIA\SYD\PROJECTS\272000\272553-00 GLEBE MIDRISE\WORK\INTERNAL\REPORTING\20200511 GLEBE MIDRISE TRANSPORT
ASSESSMENT_FINAL.DOCX
Page 15
Bicycle parking for residents should be provided at a rate of one space per
dwelling. This translates to 39 spaces required for the south site and 35 spaces
required for the north site.
For the north site, all bicycle parking will be provided in a bike room on
Basement Level 1 using stairs with a wheeling ramp or lift, accessed directly from
Park Lane. The type of bicycle parking will be a mix of storage cages and bicycle
rails.
For the south site, the bicycle parking will be provided across two facilities:
• A bike room (27 spaces) on the ground floor, accessed directly from Park
Lane
• A storage room with cages on Basement Level 2 (12 spaces), accessed via
stairs or a lift from the ground floor public domain area.
There will also be bicycle rails installed in the public realm at the key building
entrances for visitors.
4.2 Private Vehicles
Vehicle parking will only be provided within the south site. The access to the
basement car parking will connect to Wentworth Street and ramp up to the vehicle
lifts.
4.2.1 Car parking requirement
To ascertain the parking requirement for the site the City of Sydney LGA parking
rates were applied to the proposed development yield for the south site only. The
standards and the associated parking requirement based on the south site
development yield are outlined in Table 5.
Table 5: Proposed parking requirement (south site only)
Land use No. units /
GFA
Parking rate1 Parking
requirement
(maximum)
Residential
Studio 0 0.2 spaces per unit 0
1 bed 14 0.4 spaces per unit 6
2 bed 20 0.8 spaces per unit 16
3 bed 5 1.1 spaces per unit 6
Visitors -
0.167 – up to 30 dwellings
0.1 – 30 to 70 dwellings
0.05 – above 70 dwellings
7
Total 35
1 Sydney Local Environmental Plan (LEP) Division 1 (2012) - Land on category B

NSW Land and Housing Corporation Glebe Mid-Rise Project Planning Proposal – Traffic, Transport and Parking Report
Report Ref | Final | 11 May 2020 | Arup
\\GLOBAL.ARUP.COM\AUSTRALASIA\SYD\PROJECTS\272000\272553-00 GLEBE MIDRISE\WORK\INTERNAL\REPORTING\20200511 GLEBE MIDRISE TRANSPORT
ASSESSMENT_FINAL.DOCX
Page 16
All adaptable units will require an accessible parking space.
In addition to the above, car share parking spaces are to be provided in accordance
with the rates outlined in the City of Sydney DCP (see Table 6). It should be
noted that these estimates are based on maximum allowable car parking numbers.
Therefore, the requirement could be reduced if parking provision is lower than the
maximum standards within the DCP.
Table 6: Car share parking provision
Land use Car share parking rate2 Car share parking requirement
Residential 1 space per 60 normal spaces 1
Total 1
4.2.1.1 Access arrangements
Residents will enter and exit the car park via an entrance on Wentworth Street. 2P
(8am – 6pm Mon – Fri; permit holders excepted) kerbside restrictions currently
apply on both sides of the street.
To accommodate vehicle movements into and out of the car park entrance these
restrictions would need to be adjusted on the southern side of Wentworth Street.
We estimate this would result in a loss of four parking spaces. The current
restrictions would need to be replaced with ‘No Stopping’ for these four spaces.
As 30 parking spaces are being provided within the development we do not expect
the loss of four spaces to have a negative impact on parking supply for residents
in the area.
Swept paths appended to this report in Appendix C (SKT006-SKT007) illustrate
this arrangement.
2 City of Sydney DCP Section 3.11.2 – Land on category B

NSW Land and Housing Corporation Glebe Mid-Rise Project Planning Proposal – Traffic, Transport and Parking Report
Report Ref | Final | 11 May 2020 | Arup
\\GLOBAL.ARUP.COM\AUSTRALASIA\SYD\PROJECTS\272000\272553-00 GLEBE MIDRISE\WORK\INTERNAL\REPORTING\20200511 GLEBE MIDRISE TRANSPORT
ASSESSMENT_FINAL.DOCX
Page 17
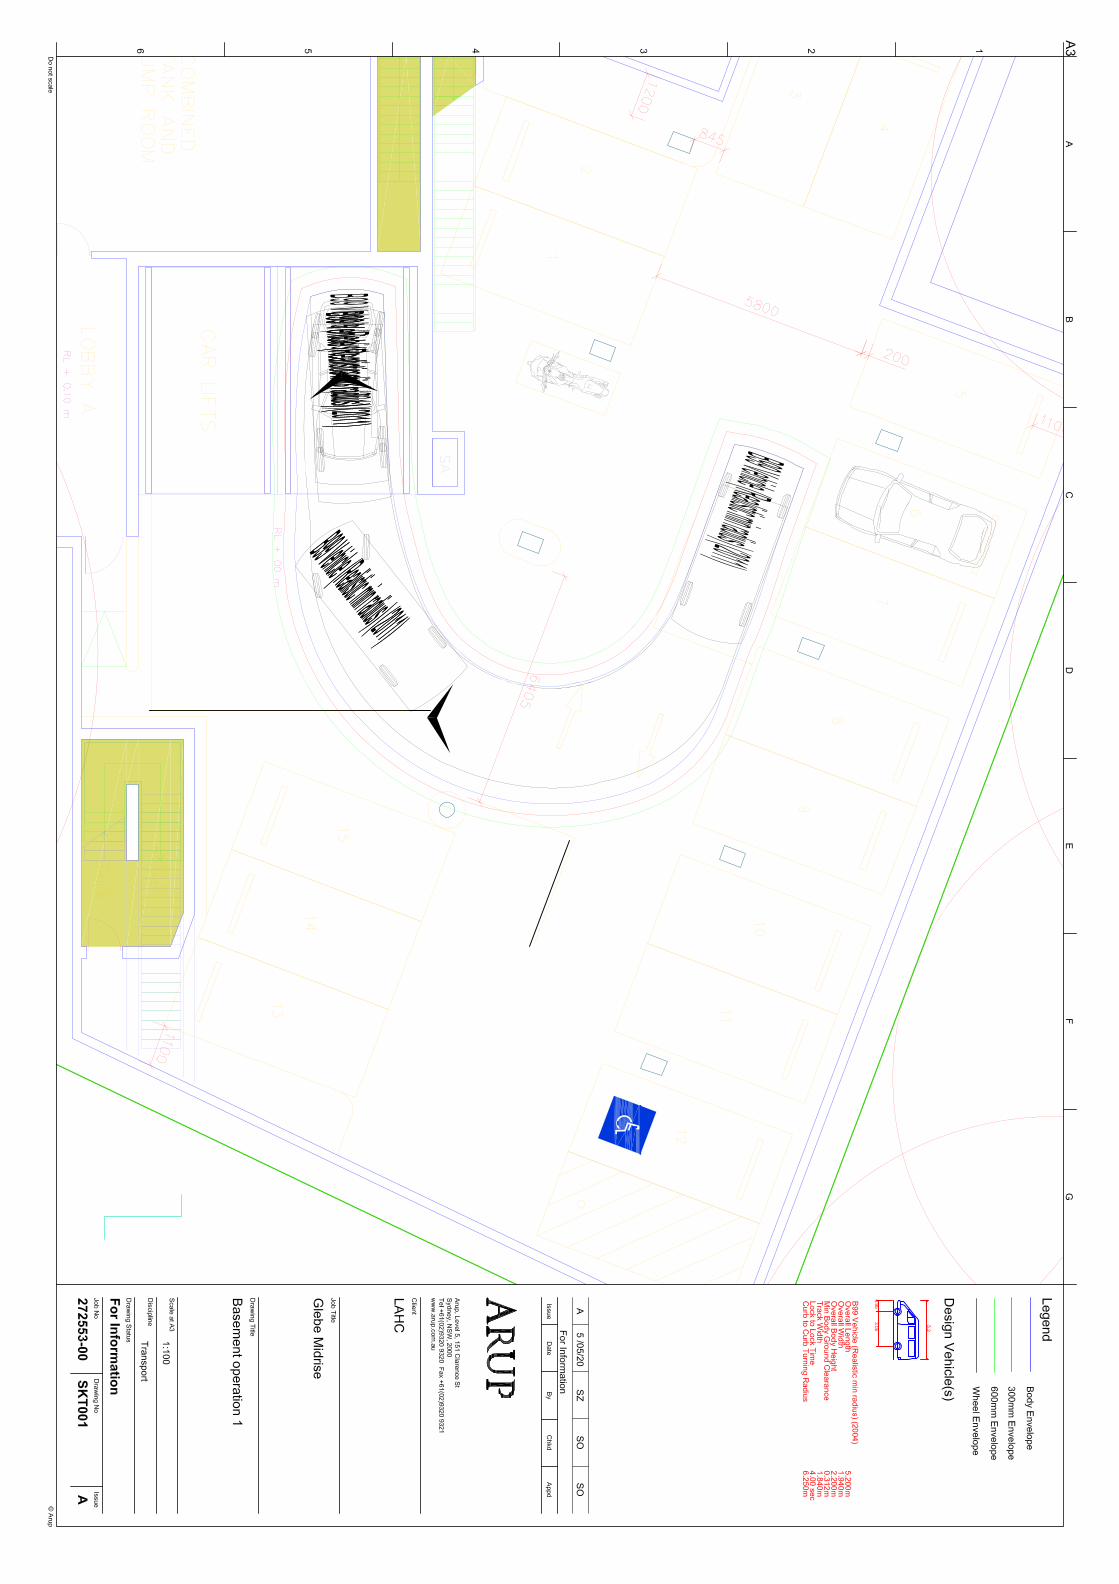
4.2.1.2 Car park layout
Thirty car parking spaces are proposed in the basement of the south site, split
across two levels. Figure 11 shows the proposed layout of Basement Level 2. The
car park layout for Basement Level 1 is similar.
Two car lifts are proposed to move vehicles between ground and basement levels.
The car lifts will both accommodate entries and exits. Stop lines and traffic
signals on each basement level will manage vehicle flows into the lifts. Vehicles
entering the development will have priority to reduce the likelihood of any
impacts of Wentworth Street. Due to the small number of parking spaces on the
basement levels and the low turnover rate expected for these spaces, queues for
the lifts are not expected to form often.
An accessible parking space has been provided for each adaptable unit, i.e. two.
One space is provided on each basement level.
No car parking is proposed to be provided for the commercial space.
Swept paths of vehicle movements within the basement are included in Appendix
C (SKT001-SKT005).

NSW Land and Housing Corporation Glebe Mid-Rise Project Planning Proposal – Traffic, Transport and Parking Report
Report Ref | Final | 11 May 2020 | Arup
\\GLOBAL.ARUP.COM\AUSTRALASIA\SYD\PROJECTS\272000\272553-00 GLEBE MIDRISE\WORK\INTERNAL\REPORTING\20200511 GLEBE MIDRISE TRANSPORT
ASSESSMENT_FINAL.DOCX
Page 18
Figure 11: South site basement level 2 layout
4.2.2 Motorcycle parking
Motorcycle parking for residents will be provided in accordance with the
requirements outlined in the City of Sydney DCP. The required provision is one
motorcycle parking space for every 12 car parking spaces provided. This equates
to three motorcycle parking spaces for the proposed development.
Three motorcycle parking spaces will be provided in the south site basement –
two on Basement Level 2 and one on Basement Level 1.
4.3 Service vehicles
Park Lane operates as a two-way laneway, with both ‘No Stopping’ and ‘No
Parking’ kerbside restrictions. Waste collection vehicles currently use Park Lane
to service the existing properties.
Park Lane runs between the north and south site and due to the locations of the
waste rooms, all servicing will to occur from this street. The locations of both
waste rooms are presented in Figure 12.

NSW Land and Housing Corporation Glebe Mid-Rise Project Planning Proposal – Traffic, Transport and Parking Report
Report Ref | Final | 11 May 2020 | Arup
\\GLOBAL.ARUP.COM\AUSTRALASIA\SYD\PROJECTS\272000\272553-00 GLEBE MIDRISE\WORK\INTERNAL\REPORTING\20200511 GLEBE MIDRISE TRANSPORT
ASSESSMENT_FINAL.DOCX
Page 19
Figure 12: Location of waste rooms
Loading Zone signage will be implemented on the north side of Park Lane to
ensure stopped service vehicles do not block entrances the bike rooms in both
sites.
Since the development is predominantly residential, waste collection will be the
primary servicing requirement. City of Sydney Council will generally undertake
waste collection of the buildings up to two times per week. As such, Loading zone
signage will allocate space for one large refuse vehicle which, is estimated to be
adequate to accommodate the servicing demand for both sites.

NSW Land and Housing Corporation Glebe Mid-Rise Project Planning Proposal – Traffic, Transport and Parking Report
Report Ref | Final | 11 May 2020 | Arup
\\GLOBAL.ARUP.COM\AUSTRALASIA\SYD\PROJECTS\272000\272553-00 GLEBE MIDRISE\WORK\INTERNAL\REPORTING\20200511 GLEBE MIDRISE TRANSPORT
ASSESSMENT_FINAL.DOCX
Page 20
5 Transport Impact Assessment
As noted in Section 2.1, there are currently four townhouses on the north site and
15 units on the south site.
The RMS Guide to Traffic Generating Developments was used to calculate the
existing number of trips in the AM and PM peak hours to the site. For low density
residential sites in the Sydney Metropolitan Area, an average person trip rate of
1.65 trips / dwelling was observed. This has been applied to four townhouses on
the north site. For high density residential sites in the Sydney Metropolitan Area,
an average person trip rate of 0.53 trips / dwelling was observed. This has been
applied to the 15 apartments on the south site
To calculate the trip generation of the proposed development, the high density
residential rate has been applied to both sites.
Table 7 presents the person trips for the existing and proposed development and
the net increase in person trips.
Table 7: Existing and proposed trip generation
Site
Existing Proposed Difference
AM peak
hour trips
PM peak
hour trips
AM peak
hour trips
PM peak
hour trips
AM peak
hour trips
PM peak
hour trips
North site 7 7 19 19 +12 +12
South site 8 8 21 21 +13 +13
Total 15 15 40 40 25 25
5.1 Multimodal trip generation
To ascertain the future impact of the development a multimodal trip generation
assessment has been undertaken for the additional trips generated by the site as a
result of the development.
2016 Journey to Work Census data for the relevant Statistical Census Area (SA2
117031331) was analysed to confirm the existing mode share for people travelling
to and from work in the precinct. This is presented in Table 8.

NSW Land and Housing Corporation Glebe Mid-Rise Project Planning Proposal – Traffic, Transport and Parking Report
Report Ref | Final | 11 May 2020 | Arup
\\GLOBAL.ARUP.COM\AUSTRALASIA\SYD\PROJECTS\272000\272553-00 GLEBE MIDRISE\WORK\INTERNAL\REPORTING\20200511 GLEBE MIDRISE TRANSPORT
ASSESSMENT_FINAL.DOCX
Page 21
Table 8: Multimodal trip generation
Mode Mode share % AM peak hour trips PM peak hour trips
Car Driver 30% 7 7
Car Passenger 3% 1 1
Train 14% 4 4
Bus 25% 6 6
Walk 19% 5 5
Cycle 5% 1 1
Other 4% 1 1
TOTAL 100% 25 25
These trips have been split by direction in Table 9, assuming 80% leave the
development and 20% enter the development in the AM peak hour. The reverse
assumption has been applied for the PM peak hour.
Table 9: Trip generation by mode and direction
Mode AM peak hour trips PM peak hour trips
In Out In Out
Car Driver 2 5 5 2
Car Passenger 0 1 1 0
Train 1 3 3 1
Bus 1 5 5 1
Walk 1 4 4 1
Cycle 0 1 1 0
Other 0 1 1 0
TOTAL 5 20 20 5
NSW Land and Housing Corporation Glebe Mid-Rise Project Planning Proposal – Traffic, Transport and Parking Report
Report Ref | Final | 11 May 2020 | Arup
\\GLOBAL.ARUP.COM\AUSTRALASIA\SYD\PROJECTS\272000\272553-00 GLEBE MIDRISE\WORK\INTERNAL\REPORTING\20200511 GLEBE MIDRISE TRANSPORT
ASSESSMENT_FINAL.DOCX
Page 22
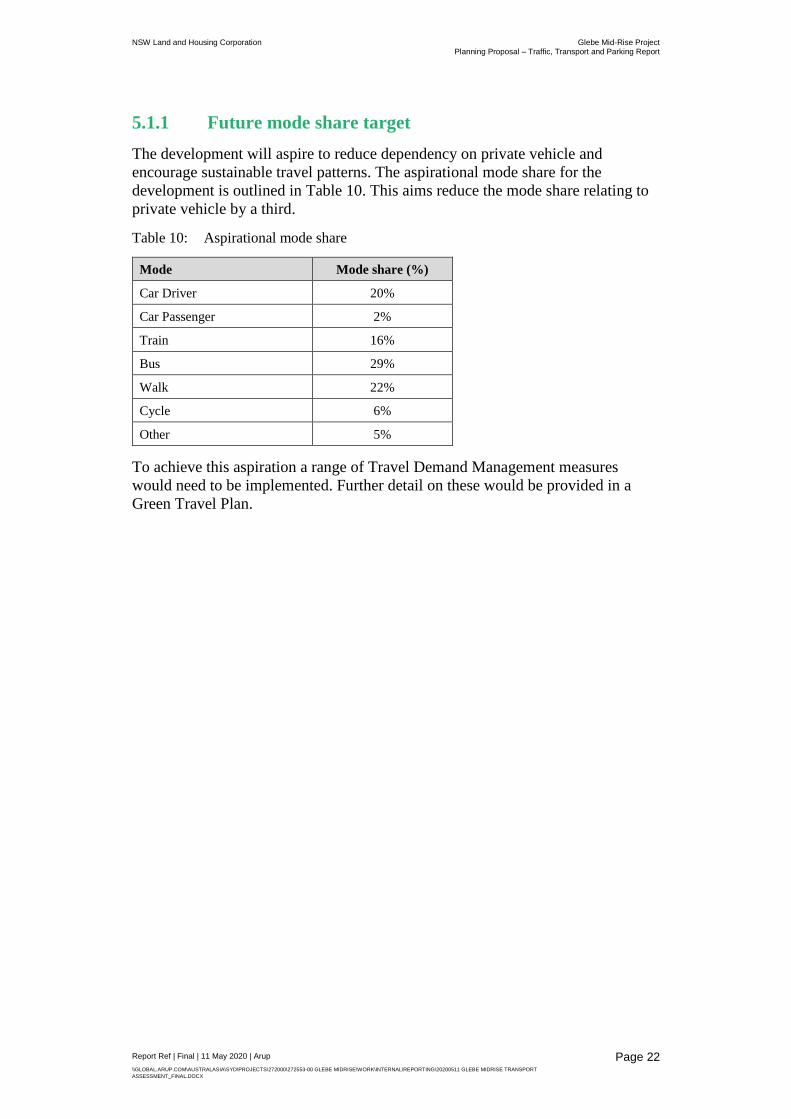
5.1.1 Future mode share target
The development will aspire to reduce dependency on private vehicle and
encourage sustainable travel patterns. The aspirational mode share for the
development is outlined in Table 10. This aims reduce the mode share relating to
private vehicle by a third.
Table 10: Aspirational mode share
Mode Mode share (%)
Car Driver 20%
Car Passenger 2%
Train 16%
Bus 29%
Walk 22%
Cycle 6%
Other 5%
To achieve this aspiration a range of Travel Demand Management measures
would need to be implemented. Further detail on these would be provided in a
Green Travel Plan.

NSW Land and Housing Corporation Glebe Mid-Rise Project Planning Proposal – Traffic, Transport and Parking Report
Report Ref | Final | 11 May 2020 | Arup
\\GLOBAL.ARUP.COM\AUSTRALASIA\SYD\PROJECTS\272000\272553-00 GLEBE MIDRISE\WORK\INTERNAL\REPORTING\20200511 GLEBE MIDRISE TRANSPORT
ASSESSMENT_FINAL.DOCX
Page 23
5.2 Road network assessment
5.2.1 Traffic distribution
Vehicle trips were distributed to the surrounding road network using 2016 census
data to consider the destination of residents travelling to work from the Glebe area
and the constraints of the local road network. This expected traffic distribution to
and from the site is outlined in Figure 13.
Figure 13: Forecast traffic distribution
This distribution was then applied to the private vehicle trips generated in the AM
and PM peak hours.
5.2.2 Traffic modelling
Traffic modelling of the existing and proposed scenarios was undertaken using
SIDRA 8 Isolated Intersection software. The following intersections were
modelled during the AM peak (08:00 – 09:00) and the PM peak (17:30 – 18:30):
• Cowper Street / Wentworth Street; and
• Cowper Street / Wentworth Park Road.
The modelling parameters used to analyse the performance of these intersections
are:
Level of Service (LoS) - a measure that uses the average delay experienced by
vehicles to categorically assign each approach and movement with a qualitative
ordinal grade (A through F, with A being the best and F being the worst). RMS

NSW Land and Housing Corporation Glebe Mid-Rise Project Planning Proposal – Traffic, Transport and Parking Report
Report Ref | Final | 11 May 2020 | Arup
\\GLOBAL.ARUP.COM\AUSTRALASIA\SYD\PROJECTS\272000\272553-00 GLEBE MIDRISE\WORK\INTERNAL\REPORTING\20200511 GLEBE MIDRISE TRANSPORT
ASSESSMENT_FINAL.DOCX
Page 24
Traffic Modelling Guidelines indicate the average delay relating to each grade,
this is outlined in Table 11.
Table 11: Level of service grades / description
Grade Average delay (seconds) Description
A Less than 14 Good operation
B 15 to 28 Good with acceptable delays and spare capacity
C 29 to 42 Satisfactory
D 43 to 56 Operating near capacity
E 57 to 70 At capacity. At signals, incidents will cause
excessive delays. Roundabouts required other
control mode
F Greater than 71 Unsatisfactory with excessive queuing
Degree of Saturation (DoS) - a ratio of demand to capacity. A DoS of 1.0
indicates that the demand and capacity at an approach or intersection are equal.
The RMS Traffic Modelling Guidelines outlines practical DoS for different
intersection types
95th percentile queue length – this is the queue length that only has a 5%
probability of being exceeded during the analysis time period. This parameter is
used to calculate lane lengths but is not representative of a queue a normal driver
would experience.

NSW Land and Housing Corporation Glebe Mid-Rise Project Planning Proposal – Traffic, Transport and Parking Report
Report Ref | Final | 11 May 2020 | Arup
\\GLOBAL.ARUP.COM\AUSTRALASIA\SYD\PROJECTS\272000\272553-00 GLEBE MIDRISE\WORK\INTERNAL\REPORTING\20200511 GLEBE MIDRISE TRANSPORT
ASSESSMENT_FINAL.DOCX
Page 25
Cowper Street / Wentworth Street
The existing configuration of the Cowper Street / Wentworth Street intersection is
presented in Figure 14.
Figure 14: Existing Cowper Street / Wentworth Street configuration
Modelling results
The results from the SIDRA modeling are presented in Table 12. A full output of
the modelling results is presented in Appendix B.
Table 12: Cowper Street / Wentworth Street modelling results
Scenario LoS DoS
95th percentile
queue
Existing AM peak hour A 0.06 1m
Existing AM peak hour +
development A 0.06 1m
Existing PM peak hour A 0.09 1m
Existing PM peak hour +
development A 0.10 1m

NSW Land and Housing Corporation Glebe Mid-Rise Project Planning Proposal – Traffic, Transport and Parking Report
Report Ref | Final | 11 May 2020 | Arup
\\GLOBAL.ARUP.COM\AUSTRALASIA\SYD\PROJECTS\272000\272553-00 GLEBE MIDRISE\WORK\INTERNAL\REPORTING\20200511 GLEBE MIDRISE TRANSPORT
ASSESSMENT_FINAL.DOCX
Page 26
The traffic modelling indicates the proposal will have a negligible impact on the
operation of the intersection which maintains a low DoS and queue length during
both peak hours.
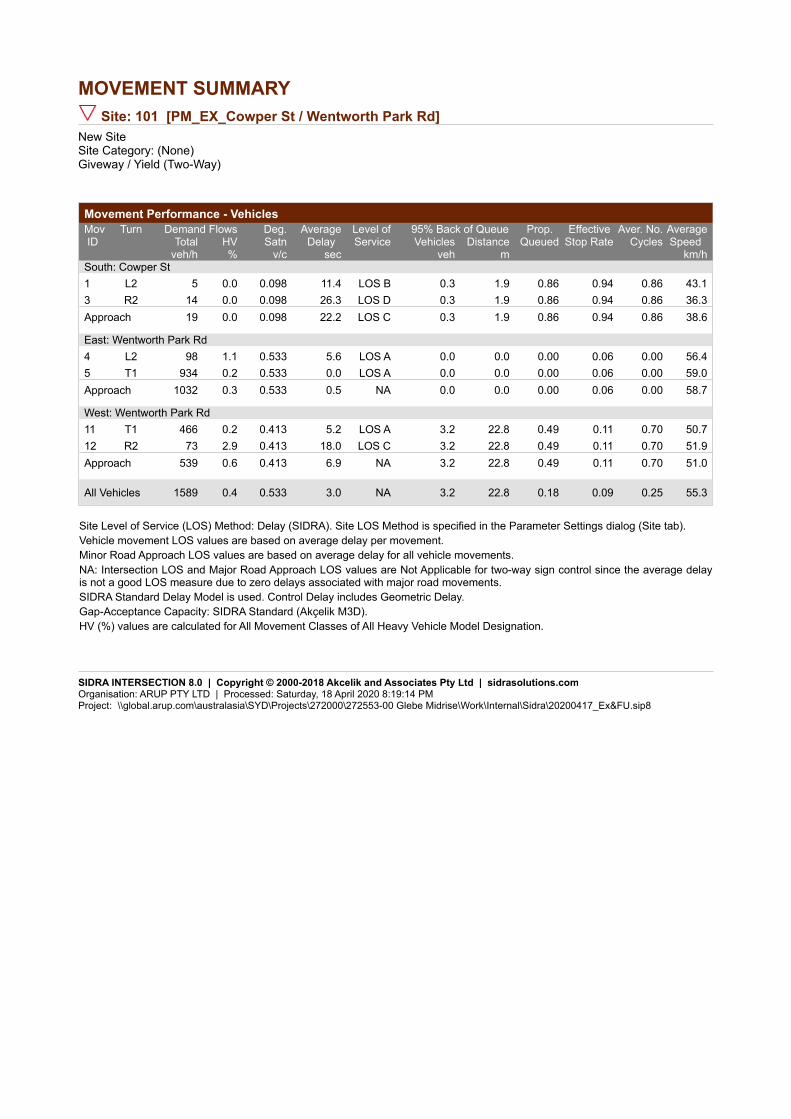
Cowper Street / Wentworth Park Road
The existing configuration of the Cowper Street / Wentworth Park Road
intersection is presented in Figure 15.
Figure 15: Existing Cowper Street / Wentworth Park Road configuration
Modelling results
The results from the SIDRA modeling are presented in Table 12. A full output of
the modelling results is presented in Appendix B.
Table 13: Cowper Street / Wentworth Park Road modelling results
Scenario LoS DoS
95th percentile
queue
Existing AM peak hour A 0.41 6m
Existing AM peak hour +
development A 0.41 7m
Existing PM peak hour A 0.53 23m
Existing PM peak hour +
development A 0.53 25m
Results for the intersection with development traffic present acceptable DoS on all
arms of the intersection. Overall, this modelling indicates the proposal will have a
negligible impact on the operation of the intersection.

NSW Land and Housing Corporation Glebe Mid-Rise Project Planning Proposal – Traffic, Transport and Parking Report
Report Ref | Final | 11 May 2020 | Arup
\\GLOBAL.ARUP.COM\AUSTRALASIA\SYD\PROJECTS\272000\272553-00 GLEBE MIDRISE\WORK\INTERNAL\REPORTING\20200511 GLEBE MIDRISE TRANSPORT
ASSESSMENT_FINAL.DOCX
Page 27
6 Summary
This report addresses the following transport impacts relating to the Glebe mid-
rise development:
• Vehicle access to the development will be provided via Wentworth Street
connecting to the basement parking within the south site;
• Thirty parking spaces including two accessible spaces are provided in the
basement levels of the south site connected via two car lifts;
• Servicing of both the north site and south site will occur on-street from a
Loading Zone signed on Park Lane with a capacity for one vehicle;
• The indicative scheme will generate an additional seven additional private
vehicle trips in both the AM and PM peak hours;
• The development aims to utilise the surrounding cycling routes and public
transport services to encourage sustainable travel patterns; and
• Applying traffic generated by the proposed development to the surrounding
road network indicates the uplift in traffic will have a negligible impact on
road network operation.

Appendix A
Existing Traffic Volumes

Existing traffic at Cowper St / Wentworth Park Rd intersection (AM peak hour)
Existing traffic at Cowper St / Wentworth Park Rd intersection (PM peak hour)

Existing traffic at Cowper St / Wentworth St intersection (AM peak hour)
Existing traffic at Cowper St / Wentworth St intersection (PM peak hour)

Appendix B
SIDRA Modelling Results

MOVEMENT SUMMARYSite: 101 [AM_EX_Cowper St / Wentworth St]
New SiteSite Category: (None)Giveway / Yield (Two-Way)
Movement Performance - VehiclesDemand Flows 95% Back of QueueMov
ID Turn Deg.
SatnAverage
Delay Level ofService
Prop. Queued
Effective Stop Rate
Aver. No.Cycles
AverageSpeed Total HV Vehicles Distance
veh/h % v/c sec veh m km/hSouth: Cowper Street1 L2 1 0.0 0.019 5.7 LOS A 0.0 0.1 0.02 0.03 0.02 48.72 T1 35 0.0 0.019 0.0 LOS A 0.0 0.1 0.02 0.03 0.02 59.23 R2 1 0.0 0.019 5.8 LOS A 0.0 0.1 0.02 0.03 0.02 55.4Approach 37 0.0 0.019 0.3 NA 0.0 0.1 0.02 0.03 0.02 58.7
East: Wentworth Street4 L2 1 0.0 0.003 5.8 LOS A 0.0 0.1 0.21 0.53 0.21 48.95 T1 1 0.0 0.003 4.6 LOS A 0.0 0.1 0.21 0.53 0.21 21.46 R2 1 0.0 0.003 6.1 LOS A 0.0 0.1 0.21 0.53 0.21 19.8Approach 3 0.0 0.003 5.5 LOS A 0.0 0.1 0.21 0.53 0.21 30.2
North: Cowper Street7 L2 11 20.0 0.059 4.5 LOS A 0.0 0.1 0.01 0.07 0.01 46.78 T1 98 2.2 0.059 0.0 LOS A 0.0 0.1 0.01 0.07 0.01 59.09 R2 2 0.0 0.059 4.5 LOS A 0.0 0.1 0.01 0.07 0.01 37.9Approach 111 3.8 0.059 0.5 NA 0.0 0.1 0.01 0.07 0.01 58.1
West: Wentworth Street10 L2 2 0.0 0.016 5.4 LOS A 0.1 0.4 0.18 0.54 0.18 28.811 T1 8 0.0 0.016 4.4 LOS A 0.1 0.4 0.18 0.54 0.18 40.712 R2 6 16.7 0.016 6.0 LOS A 0.1 0.4 0.18 0.54 0.18 46.6Approach 17 6.3 0.016 5.1 LOS A 0.1 0.4 0.18 0.54 0.18 42.7
All Vehicles 167 3.1 0.059 1.0 NA 0.1 0.4 0.03 0.11 0.03 56.0
Site Level of Service (LOS) Method: Delay (SIDRA). Site LOS Method is specified in the Parameter Settings dialog (Site tab).Vehicle movement LOS values are based on average delay per movement.Minor Road Approach LOS values are based on average delay for all vehicle movements.NA: Intersection LOS and Major Road Approach LOS values are Not Applicable for two-way sign control since the average delayis not a good LOS measure due to zero delays associated with major road movements.SIDRA Standard Delay Model is used. Control Delay includes Geometric Delay.Gap-Acceptance Capacity: SIDRA Standard (Akçelik M3D).HV (%) values are calculated for All Movement Classes of All Heavy Vehicle Model Designation.
SIDRA INTERSECTION 8.0 | Copyright © 2000-2018 Akcelik and Associates Pty Ltd | sidrasolutions.comOrganisation: ARUP PTY LTD | Processed: Wednesday, 22 April 2020 3:04:37 PMProject: \\global.arup.com\australasia\SYD\Projects\272000\272553-00 Glebe Midrise\Work\Internal\Sidra\20200417_Ex&FU.sip8

MOVEMENT SUMMARYSite: 101 [AM_FU_Cowper St / Wentworth St]
New SiteSite Category: (None)Giveway / Yield (Two-Way)
Movement Performance - VehiclesDemand Flows 95% Back of QueueMov
ID Turn Deg.
SatnAverage
Delay Level ofService
Prop. Queued
Effective Stop Rate
Aver. No.Cycles
AverageSpeed Total HV Vehicles Distance
veh/h % v/c sec veh m km/hSouth: Cowper Street1 L2 1 0.0 0.019 5.7 LOS A 0.0 0.1 0.02 0.03 0.02 48.72 T1 35 0.0 0.019 0.0 LOS A 0.0 0.1 0.02 0.03 0.02 59.23 R2 1 0.0 0.019 5.8 LOS A 0.0 0.1 0.02 0.03 0.02 55.4Approach 37 0.0 0.019 0.3 NA 0.0 0.1 0.02 0.03 0.02 58.7
East: Wentworth Street4 L2 1 0.0 0.003 5.8 LOS A 0.0 0.1 0.21 0.53 0.21 48.95 T1 1 0.0 0.003 4.6 LOS A 0.0 0.1 0.21 0.53 0.21 21.46 R2 1 0.0 0.003 6.1 LOS A 0.0 0.1 0.21 0.53 0.21 19.8Approach 3 0.0 0.003 5.5 LOS A 0.0 0.1 0.21 0.53 0.21 30.2
North: Cowper Street7 L2 11 20.0 0.059 4.5 LOS A 0.0 0.2 0.01 0.07 0.01 46.68 T1 98 2.2 0.059 0.0 LOS A 0.0 0.2 0.01 0.07 0.01 58.99 R2 3 0.0 0.059 4.5 LOS A 0.0 0.2 0.01 0.07 0.01 37.8Approach 112 3.8 0.059 0.6 NA 0.0 0.2 0.01 0.07 0.01 57.9
West: Wentworth Street10 L2 8 0.0 0.020 5.4 LOS A 0.1 0.5 0.13 0.54 0.13 28.911 T1 8 0.0 0.020 4.4 LOS A 0.1 0.5 0.13 0.54 0.13 40.712 R2 6 16.7 0.020 6.0 LOS A 0.1 0.5 0.13 0.54 0.13 46.6Approach 23 4.5 0.020 5.2 LOS A 0.1 0.5 0.13 0.54 0.13 39.7
All Vehicles 175 3.0 0.059 1.2 NA 0.1 0.5 0.03 0.13 0.03 55.1
Site Level of Service (LOS) Method: Delay (SIDRA). Site LOS Method is specified in the Parameter Settings dialog (Site tab).Vehicle movement LOS values are based on average delay per movement.Minor Road Approach LOS values are based on average delay for all vehicle movements.NA: Intersection LOS and Major Road Approach LOS values are Not Applicable for two-way sign control since the average delayis not a good LOS measure due to zero delays associated with major road movements.SIDRA Standard Delay Model is used. Control Delay includes Geometric Delay.Gap-Acceptance Capacity: SIDRA Standard (Akçelik M3D).HV (%) values are calculated for All Movement Classes of All Heavy Vehicle Model Designation.
SIDRA INTERSECTION 8.0 | Copyright © 2000-2018 Akcelik and Associates Pty Ltd | sidrasolutions.comOrganisation: ARUP PTY LTD | Processed: Monday, 11 May 2020 8:12:40 AMProject: \\global.arup.com\australasia\SYD\Projects\272000\272553-00 Glebe Midrise\Work\Internal\Sidra\20200417_Ex&FU.sip8

MOVEMENT SUMMARYSite: 101 [PM_EX_Cowper St / Wentworth St]
New SiteSite Category: (None)Giveway / Yield (Two-Way)
Movement Performance - VehiclesDemand Flows 95% Back of QueueMov
ID Turn Deg.
SatnAverage
Delay Level ofService
Prop. Queued
Effective Stop Rate
Aver. No.Cycles
AverageSpeed Total HV Vehicles Distance
veh/h % v/c sec veh m km/hSouth: Cowper Street1 L2 2 0.0 0.008 5.8 LOS A 0.0 0.1 0.10 0.15 0.10 46.72 T1 12 0.0 0.008 0.1 LOS A 0.0 0.1 0.10 0.15 0.10 56.23 R2 2 0.0 0.008 6.0 LOS A 0.0 0.1 0.10 0.15 0.10 53.1Approach 16 0.0 0.008 1.7 NA 0.0 0.1 0.10 0.15 0.10 54.3
East: Wentworth Street4 L2 1 0.0 0.003 6.0 LOS A 0.0 0.1 0.27 0.53 0.27 48.65 T1 1 0.0 0.003 4.8 LOS A 0.0 0.1 0.27 0.53 0.27 21.36 R2 1 0.0 0.003 6.3 LOS A 0.0 0.1 0.27 0.53 0.27 19.7Approach 3 0.0 0.003 5.7 LOS A 0.0 0.1 0.27 0.53 0.27 30.0
North: Cowper Street7 L2 11 0.0 0.094 4.5 LOS A 0.0 0.1 0.00 0.04 0.00 51.98 T1 168 1.9 0.094 0.0 LOS A 0.0 0.1 0.00 0.04 0.00 59.39 R2 2 0.0 0.094 4.5 LOS A 0.0 0.1 0.00 0.04 0.00 38.3Approach 181 1.7 0.094 0.3 NA 0.0 0.1 0.00 0.04 0.00 59.0
West: Wentworth Street10 L2 3 0.0 0.008 5.4 LOS A 0.0 0.2 0.06 0.55 0.06 28.911 T1 4 0.0 0.008 4.6 LOS A 0.0 0.2 0.06 0.55 0.06 40.812 R2 2 0.0 0.008 6.2 LOS A 0.0 0.2 0.06 0.55 0.06 47.8Approach 9 0.0 0.008 5.2 LOS A 0.0 0.2 0.06 0.55 0.06 39.9
All Vehicles 209 1.5 0.094 0.7 NA 0.0 0.2 0.02 0.08 0.02 57.2
Site Level of Service (LOS) Method: Delay (SIDRA). Site LOS Method is specified in the Parameter Settings dialog (Site tab).Vehicle movement LOS values are based on average delay per movement.Minor Road Approach LOS values are based on average delay for all vehicle movements.NA: Intersection LOS and Major Road Approach LOS values are Not Applicable for two-way sign control since the average delayis not a good LOS measure due to zero delays associated with major road movements.SIDRA Standard Delay Model is used. Control Delay includes Geometric Delay.Gap-Acceptance Capacity: SIDRA Standard (Akçelik M3D).HV (%) values are calculated for All Movement Classes of All Heavy Vehicle Model Designation.
SIDRA INTERSECTION 8.0 | Copyright © 2000-2018 Akcelik and Associates Pty Ltd | sidrasolutions.comOrganisation: ARUP PTY LTD | Processed: Wednesday, 6 May 2020 3:53:16 PMProject: \\global.arup.com\australasia\SYD\Projects\272000\272553-00 Glebe Midrise\Work\Internal\Sidra\20200417_Ex&FU.sip8

MOVEMENT SUMMARYSite: 101 [PM_FU_Cowper St / Wentworth St]
New SiteSite Category: (None)Giveway / Yield (Two-Way)
Movement Performance - VehiclesDemand Flows 95% Back of QueueMov
ID Turn Deg.
SatnAverage
Delay Level ofService
Prop. Queued
Effective Stop Rate
Aver. No.Cycles
AverageSpeed Total HV Vehicles Distance
veh/h % v/c sec veh m km/hSouth: Cowper Street1 L2 2 0.0 0.008 5.8 LOS A 0.0 0.1 0.10 0.15 0.10 46.72 T1 12 0.0 0.008 0.1 LOS A 0.0 0.1 0.10 0.15 0.10 56.23 R2 2 0.0 0.008 6.0 LOS A 0.0 0.1 0.10 0.15 0.10 53.1Approach 16 0.0 0.008 1.7 NA 0.0 0.1 0.10 0.15 0.10 54.3
East: Wentworth Street4 L2 1 0.0 0.003 6.0 LOS A 0.0 0.1 0.27 0.53 0.27 48.65 T1 1 0.0 0.003 4.8 LOS A 0.0 0.1 0.27 0.53 0.27 21.36 R2 1 0.0 0.003 6.4 LOS A 0.0 0.1 0.27 0.53 0.27 19.7Approach 3 0.0 0.003 5.7 LOS A 0.0 0.1 0.27 0.53 0.27 30.0
North: Cowper Street7 L2 11 0.0 0.098 4.6 LOS A 0.1 0.5 0.01 0.06 0.01 51.38 T1 168 1.9 0.098 0.0 LOS A 0.1 0.5 0.01 0.06 0.01 59.09 R2 8 0.0 0.098 4.5 LOS A 0.1 0.5 0.01 0.06 0.01 37.9Approach 187 1.7 0.098 0.5 NA 0.1 0.5 0.01 0.06 0.01 58.2
West: Wentworth Street10 L2 4 0.0 0.009 5.4 LOS A 0.0 0.2 0.05 0.55 0.05 28.911 T1 4 0.0 0.009 4.6 LOS A 0.0 0.2 0.05 0.55 0.05 40.712 R2 2 0.0 0.009 6.2 LOS A 0.0 0.2 0.05 0.55 0.05 47.8Approach 11 0.0 0.009 5.2 LOS A 0.0 0.2 0.05 0.55 0.05 38.9
All Vehicles 217 1.5 0.098 0.9 NA 0.1 0.5 0.02 0.10 0.02 56.5
Site Level of Service (LOS) Method: Delay (SIDRA). Site LOS Method is specified in the Parameter Settings dialog (Site tab).Vehicle movement LOS values are based on average delay per movement.Minor Road Approach LOS values are based on average delay for all vehicle movements.NA: Intersection LOS and Major Road Approach LOS values are Not Applicable for two-way sign control since the average delayis not a good LOS measure due to zero delays associated with major road movements.SIDRA Standard Delay Model is used. Control Delay includes Geometric Delay.Gap-Acceptance Capacity: SIDRA Standard (Akçelik M3D).HV (%) values are calculated for All Movement Classes of All Heavy Vehicle Model Designation.
SIDRA INTERSECTION 8.0 | Copyright © 2000-2018 Akcelik and Associates Pty Ltd | sidrasolutions.comOrganisation: ARUP PTY LTD | Processed: Monday, 11 May 2020 8:12:57 AMProject: \\global.arup.com\australasia\SYD\Projects\272000\272553-00 Glebe Midrise\Work\Internal\Sidra\20200417_Ex&FU.sip8

MOVEMENT SUMMARYSite: 101 [AM_EX_Cowper St / Wentworth Park Rd]
New SiteSite Category: (None)Giveway / Yield (Two-Way)
Movement Performance - VehiclesDemand Flows 95% Back of QueueMov
ID Turn Deg.
SatnAverage
Delay Level ofService
Prop. Queued
Effective Stop Rate
Aver. No.Cycles
AverageSpeed Total HV Vehicles Distance
veh/h % v/c sec veh m km/hSouth: Cowper St1 L2 21 0.0 0.104 6.6 LOS A 0.3 2.3 0.56 0.75 0.56 49.53 R2 29 0.0 0.104 14.5 LOS B 0.3 2.3 0.56 0.75 0.56 44.1Approach 51 0.0 0.104 11.2 LOS B 0.3 2.3 0.56 0.75 0.56 46.8
East: Wentworth Park Rd4 L2 59 5.4 0.202 5.6 LOS A 0.0 0.0 0.00 0.09 0.00 55.85 T1 323 3.3 0.202 0.0 LOS A 0.0 0.0 0.00 0.09 0.00 58.6Approach 382 3.6 0.202 0.9 NA 0.0 0.0 0.00 0.09 0.00 58.2
West: Wentworth Park Rd11 T1 697 2.3 0.410 0.4 LOS A 0.9 6.2 0.12 0.05 0.14 58.512 R2 56 1.9 0.410 7.9 LOS A 0.9 6.2 0.12 0.05 0.14 56.8Approach 753 2.2 0.410 0.9 NA 0.9 6.2 0.12 0.05 0.14 58.3
All Vehicles 1185 2.6 0.410 1.3 NA 0.9 6.2 0.10 0.09 0.11 57.6
Site Level of Service (LOS) Method: Delay (SIDRA). Site LOS Method is specified in the Parameter Settings dialog (Site tab).Vehicle movement LOS values are based on average delay per movement.Minor Road Approach LOS values are based on average delay for all vehicle movements.NA: Intersection LOS and Major Road Approach LOS values are Not Applicable for two-way sign control since the average delayis not a good LOS measure due to zero delays associated with major road movements.SIDRA Standard Delay Model is used. Control Delay includes Geometric Delay.Gap-Acceptance Capacity: SIDRA Standard (Akçelik M3D).HV (%) values are calculated for All Movement Classes of All Heavy Vehicle Model Designation.
SIDRA INTERSECTION 8.0 | Copyright © 2000-2018 Akcelik and Associates Pty Ltd | sidrasolutions.comOrganisation: ARUP PTY LTD | Processed: Saturday, 18 April 2020 8:16:00 PMProject: \\global.arup.com\australasia\SYD\Projects\272000\272553-00 Glebe Midrise\Work\Internal\Sidra\20200417_Ex&FU.sip8

MOVEMENT SUMMARYSite: 101 [AM_FU_Cowper St / Wentworth Park Rd]
New SiteSite Category: (None)Giveway / Yield (Two-Way)
Movement Performance - VehiclesDemand Flows 95% Back of QueueMov
ID Turn Deg.
SatnAverage
Delay Level ofService
Prop. Queued
Effective Stop Rate
Aver. No.Cycles
AverageSpeed Total HV Vehicles Distance
veh/h % v/c sec veh m km/hSouth: Cowper St1 L2 27 0.0 0.110 6.7 LOS A 0.4 2.5 0.53 0.73 0.53 49.83 R2 29 0.0 0.110 14.6 LOS B 0.4 2.5 0.53 0.73 0.53 44.5Approach 57 0.0 0.110 10.8 LOS B 0.4 2.5 0.53 0.73 0.53 47.5
East: Wentworth Park Rd4 L2 59 5.4 0.202 5.6 LOS A 0.0 0.0 0.00 0.09 0.00 55.85 T1 323 3.3 0.202 0.0 LOS A 0.0 0.0 0.00 0.09 0.00 58.6Approach 382 3.6 0.202 0.9 NA 0.0 0.0 0.00 0.09 0.00 58.2
West: Wentworth Park Rd11 T1 697 2.3 0.411 0.4 LOS A 0.9 6.3 0.12 0.05 0.14 58.512 R2 57 1.9 0.411 8.0 LOS A 0.9 6.3 0.12 0.05 0.14 56.8Approach 754 2.2 0.411 0.9 NA 0.9 6.3 0.12 0.05 0.14 58.3
All Vehicles 1193 2.6 0.411 1.4 NA 0.9 6.3 0.10 0.10 0.11 57.5
Site Level of Service (LOS) Method: Delay (SIDRA). Site LOS Method is specified in the Parameter Settings dialog (Site tab).Vehicle movement LOS values are based on average delay per movement.Minor Road Approach LOS values are based on average delay for all vehicle movements.NA: Intersection LOS and Major Road Approach LOS values are Not Applicable for two-way sign control since the average delayis not a good LOS measure due to zero delays associated with major road movements.SIDRA Standard Delay Model is used. Control Delay includes Geometric Delay.Gap-Acceptance Capacity: SIDRA Standard (Akçelik M3D).HV (%) values are calculated for All Movement Classes of All Heavy Vehicle Model Designation.
SIDRA INTERSECTION 8.0 | Copyright © 2000-2018 Akcelik and Associates Pty Ltd | sidrasolutions.comOrganisation: ARUP PTY LTD | Processed: Monday, 11 May 2020 8:13:19 AMProject: \\global.arup.com\australasia\SYD\Projects\272000\272553-00 Glebe Midrise\Work\Internal\Sidra\20200417_Ex&FU.sip8
MOVEMENT SUMMARYSite: 101 [PM_EX_Cowper St / Wentworth Park Rd]
New SiteSite Category: (None)Giveway / Yield (Two-Way)
Movement Performance - VehiclesDemand Flows 95% Back of QueueMov
ID Turn Deg.
SatnAverage
Delay Level ofService
Prop. Queued
Effective Stop Rate
Aver. No.Cycles
AverageSpeed Total HV Vehicles Distance
veh/h % v/c sec veh m km/hSouth: Cowper St1 L2 5 0.0 0.098 11.4 LOS B 0.3 1.9 0.86 0.94 0.86 43.13 R2 14 0.0 0.098 26.3 LOS D 0.3 1.9 0.86 0.94 0.86 36.3Approach 19 0.0 0.098 22.2 LOS C 0.3 1.9 0.86 0.94 0.86 38.6
East: Wentworth Park Rd4 L2 98 1.1 0.533 5.6 LOS A 0.0 0.0 0.00 0.06 0.00 56.45 T1 934 0.2 0.533 0.0 LOS A 0.0 0.0 0.00 0.06 0.00 59.0Approach 1032 0.3 0.533 0.5 NA 0.0 0.0 0.00 0.06 0.00 58.7
West: Wentworth Park Rd11 T1 466 0.2 0.413 5.2 LOS A 3.2 22.8 0.49 0.11 0.70 50.712 R2 73 2.9 0.413 18.0 LOS C 3.2 22.8 0.49 0.11 0.70 51.9Approach 539 0.6 0.413 6.9 NA 3.2 22.8 0.49 0.11 0.70 51.0
All Vehicles 1589 0.4 0.533 3.0 NA 3.2 22.8 0.18 0.09 0.25 55.3
Site Level of Service (LOS) Method: Delay (SIDRA). Site LOS Method is specified in the Parameter Settings dialog (Site tab).Vehicle movement LOS values are based on average delay per movement.Minor Road Approach LOS values are based on average delay for all vehicle movements.NA: Intersection LOS and Major Road Approach LOS values are Not Applicable for two-way sign control since the average delayis not a good LOS measure due to zero delays associated with major road movements.SIDRA Standard Delay Model is used. Control Delay includes Geometric Delay.Gap-Acceptance Capacity: SIDRA Standard (Akçelik M3D).HV (%) values are calculated for All Movement Classes of All Heavy Vehicle Model Designation.
SIDRA INTERSECTION 8.0 | Copyright © 2000-2018 Akcelik and Associates Pty Ltd | sidrasolutions.comOrganisation: ARUP PTY LTD | Processed: Saturday, 18 April 2020 8:19:14 PMProject: \\global.arup.com\australasia\SYD\Projects\272000\272553-00 Glebe Midrise\Work\Internal\Sidra\20200417_Ex&FU.sip8

MOVEMENT SUMMARYSite: 101 [PM_FU_Cowper St / Wentworth Park Rd]
New SiteSite Category: (None)Giveway / Yield (Two-Way)
Movement Performance - VehiclesDemand Flows 95% Back of QueueMov
ID Turn Deg.
SatnAverage
Delay Level ofService
Prop. Queued
Effective Stop Rate
Aver. No.Cycles
AverageSpeed Total HV Vehicles Distance
veh/h % v/c sec veh m km/hSouth: Cowper St1 L2 6 0.0 0.101 11.4 LOS B 0.3 2.0 0.86 0.94 0.86 43.33 R2 14 0.0 0.101 26.6 LOS D 0.3 2.0 0.86 0.94 0.86 36.5Approach 20 0.0 0.101 21.8 LOS C 0.3 2.0 0.86 0.94 0.86 39.1
East: Wentworth Park Rd4 L2 98 1.1 0.533 5.6 LOS A 0.0 0.0 0.00 0.06 0.00 56.45 T1 934 0.2 0.533 0.0 LOS A 0.0 0.0 0.00 0.06 0.00 59.0Approach 1032 0.3 0.533 0.5 NA 0.0 0.0 0.00 0.06 0.00 58.7
West: Wentworth Park Rd11 T1 466 0.2 0.427 5.5 LOS A 3.5 24.7 0.52 0.13 0.76 50.212 R2 79 2.7 0.427 18.1 LOS C 3.5 24.7 0.52 0.13 0.76 51.6Approach 545 0.6 0.427 7.4 NA 3.5 24.7 0.52 0.13 0.76 50.5
All Vehicles 1597 0.4 0.533 3.1 NA 3.5 24.7 0.19 0.09 0.27 55.1
Site Level of Service (LOS) Method: Delay (SIDRA). Site LOS Method is specified in the Parameter Settings dialog (Site tab).Vehicle movement LOS values are based on average delay per movement.Minor Road Approach LOS values are based on average delay for all vehicle movements.NA: Intersection LOS and Major Road Approach LOS values are Not Applicable for two-way sign control since the average delayis not a good LOS measure due to zero delays associated with major road movements.SIDRA Standard Delay Model is used. Control Delay includes Geometric Delay.Gap-Acceptance Capacity: SIDRA Standard (Akçelik M3D).HV (%) values are calculated for All Movement Classes of All Heavy Vehicle Model Designation.
SIDRA INTERSECTION 8.0 | Copyright © 2000-2018 Akcelik and Associates Pty Ltd | sidrasolutions.comOrganisation: ARUP PTY LTD | Processed: Monday, 11 May 2020 8:13:34 AMProject: \\global.arup.com\australasia\SYD\Projects\272000\272553-00 Glebe Midrise\Work\Internal\Sidra\20200417_Ex&FU.sip8

Appendix C
Swept Paths