nsf/rise workshop/short course on the development and study of advanced sensors and sensor materials...
TRANSCRIPT

NSF/RISE Workshop/Short Course on the Development and Study of Advanced Sensors and Sensor
Materials
Sensors for Physical and Chemical Variables: Temperature, Pressure,
Corrosion, etc.
Larry DaltonUniversity of Washington
July 10-14, 2006
Sensor Paints
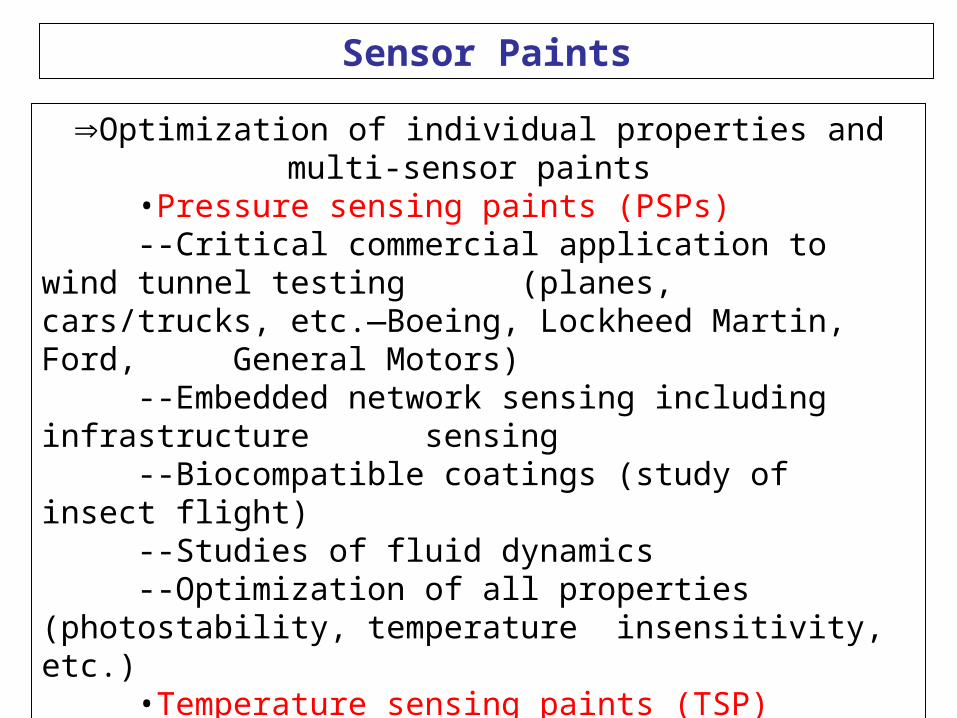
Optimization of individual properties and multi-sensor paints•Pressure sensing paints (PSPs)--Critical commercial application to wind tunnel testing
(planes, cars/trucks, etc.—Boeing, Lockheed Martin, Ford, General Motors)
--Embedded network sensing including infrastructure sensing
--Biocompatible coatings (study of insect flight)--Studies of fluid dynamics--Optimization of all properties (photostability, temperature insensitivity, etc.)•Temperature sensing paints (TSP)--Can be used with PSPs to achieve more accurate wind
tunnel measurements•Shear sensing paints (SSP)—Two approaches

Sensor Paints: New Directions
Infrastructure Monitoring (Smart worms—optical fibers)•Oxygen•Moisture•pH •Corrosion (various ions)•Stress/Strain
NIR Detection
Leak Detection
Smart Clothing

Sensing Materials PSP
•Used in the development of aircraft and other vehicles•Replaces older pressure tap technology•Phosphorescent dye dissolved in oxygen permeable polymer•Cheaper to use and gives continuous information

Coating on substrate
Substrate (wing)
Base coat
DyePSP Layer
O2 O2
O2 O21O2
O2O2
O2

• Theory– Luminescence of certain organometallic molecules (luminophors)
are quenched by oxygen gas– Combining these molecules with a polymer matrix results in PSP
• Advantages– Measures pressure distributions over a surface area– Allows real time modelling– Allows surface flow visualization
• Disadvantages– PSP has temperature dependency– Non-linear response to pressure– Reduced sensitivity at low speed testing
Pressure Sensitive Paint
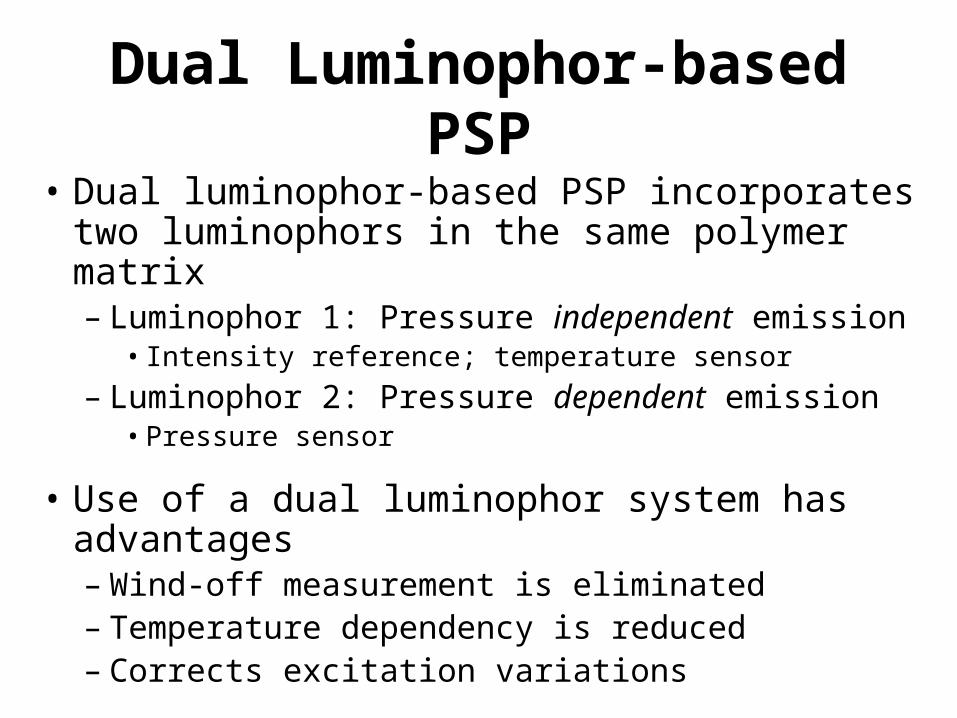
Dual Luminophor-based PSP
• Dual luminophor-based PSP incorporates two luminophors in the same polymer matrix– Luminophor 1: Pressure independent emission
• Intensity reference; temperature sensor
– Luminophor 2: Pressure dependent emission• Pressure sensor
• Use of a dual luminophor system has advantages– Wind-off measurement is eliminated– Temperature dependency is reduced– Corrects excitation variations
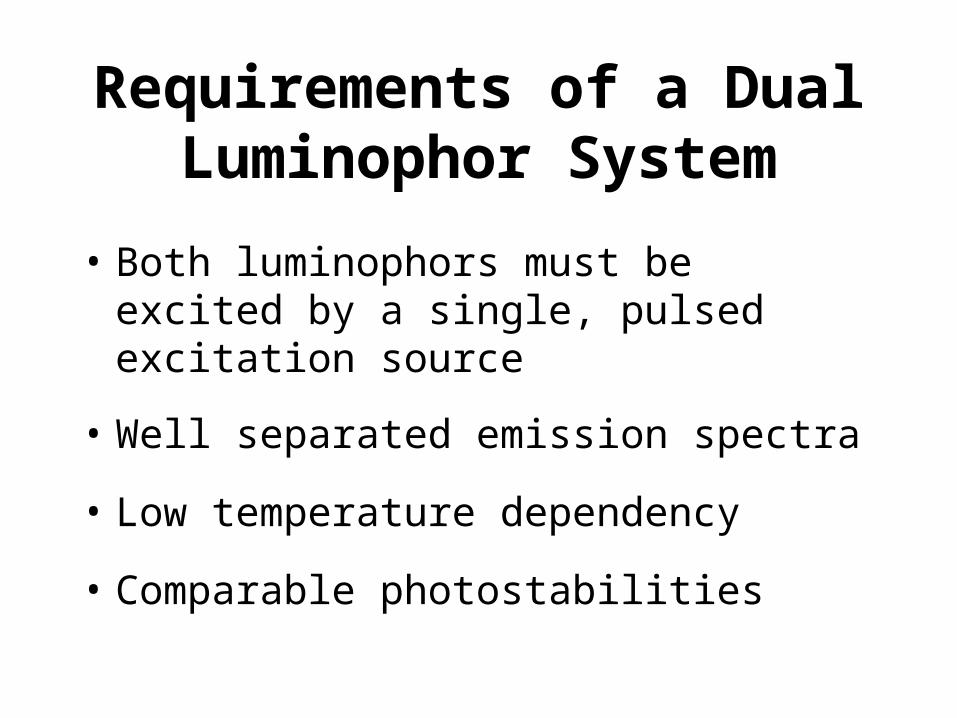
Requirements of a Dual Luminophor System
• Both luminophors must be excited by a single, pulsed excitation source
• Well separated emission spectra
• Low temperature dependency
• Comparable photostabilities

University of Washington’s Dual Luminophor PSP
• Luminophor 1 (Intensity reference):– Platinum tetra-fluorophenylporpholactone
(PtTFPL):
exc 390 nm, det 740 nm
• Luminophor 2 (Pressure sensor):– Magnesium tetra-
hexafluorophenylporphryn (MgTFPP):
exc 390 nm, det 650 nm
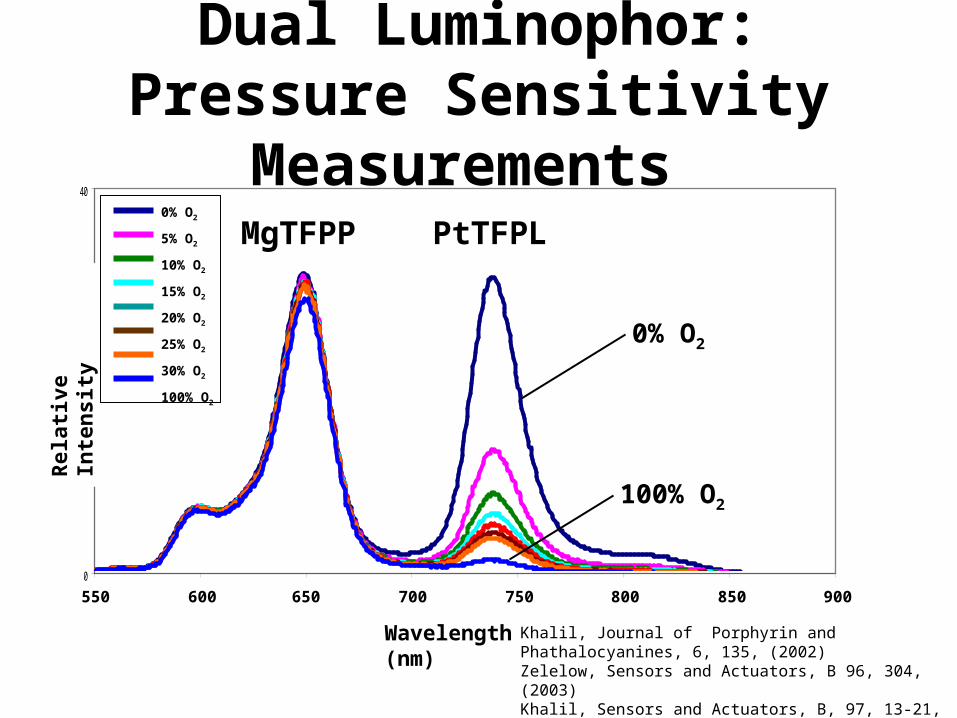
Dual Luminophor: Pressure Sensitivity Measurements
0
10
20
30
40
550 600 650 700 750 800 850 900
Wavelength (nm)
0% O2
5% O2
10% O2
15% O2
20% O2
25% O2
30% O2
100% O2
Wavelength (nm)
Rel
ativ
e In
ten
sity
0% O2
5% O2
10% O2
15% O2
20% O2
25% O2
30% O2
100% O2
550 650 700 750 800 850 900600
MgTFPP PtTFPL
0% O2
100% O2
Khalil, Journal of Porphyrin and Phathalocyanines, 6, 135, (2002)Zelelow, Sensors and Actuators, B 96, 304, (2003)Khalil, Sensors and Actuators, B, 97, 13-21, (2004)
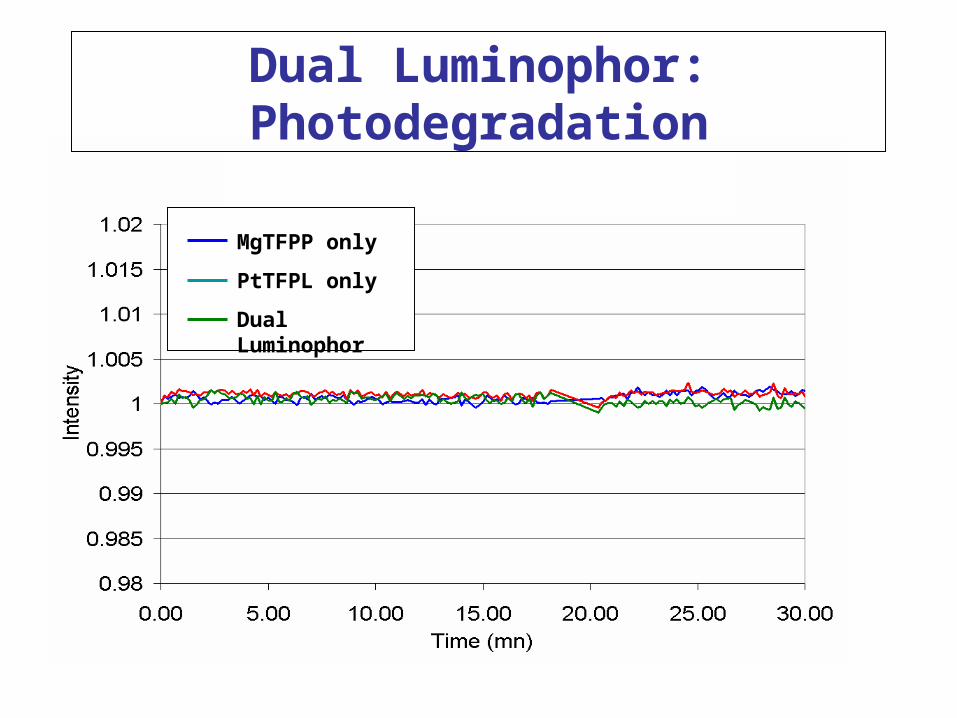
Dual Luminophor: Photodegradation
MgTFPP only
PtTFPL only
Dual Luminophor
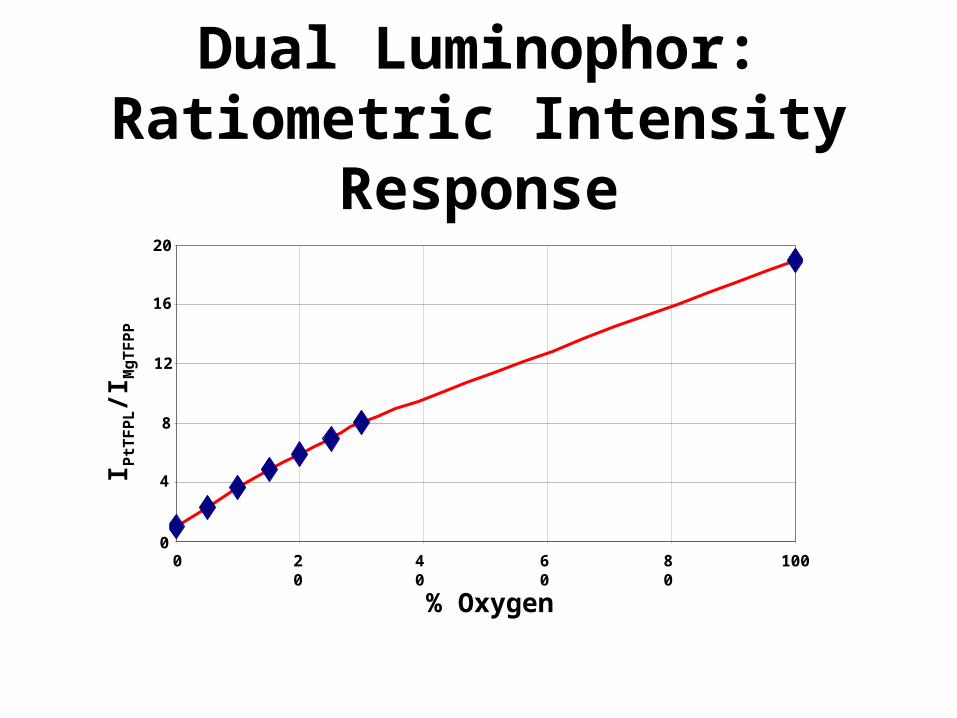
Dual Luminophor: Ratiometric Intensity
Response
0
4
8
12
16
20
0 20 40 60 80 100
% O 2
I PtT
FP
L/I
MgT
FP
P
00
4
8
12
16
20
20 40 60 80 100
% Oxygen

Dual Luminophor: Comparison to Single
Luminophor PSP
ST=-0.18% per °CSP=68% per bar
ST=+0.05% per °CSP=65% per bar
MgTFPP/PtTFPL PSPPref = 1 bar; Tref = 15° C
Single Luminophor PSPPref = 1 bar; Tref = 15° C

Temperature Sensitivity Correction
PSPcorr = I1 (k/I2 +1-k)

Singlet Oxygen Project Objective
• Develop a new approach to measure 2-D surface pressure by monitoring the 1270 nm singlet oxygen emission
Motivation• Availability of NIR InGaAs Camera• Many known efficient photosensitizers for singlet
oxygen• NIR detection allows for multiple sensor
configurations

Oxygenexch P
ke
xc
k1 kp
kq
k2 ko
13T
g1
11S
g30
1S
Energy Diagram
kO2
Porphyrin1270 nm
634 nm
Excitation Source
Radiationless Decay
Bimolecular Quenching
Molecular Emission

Simulation of Singlet Oxygen Production
Kexc=2000 s-1
kp=1.66e4 s-1
kq=1e8 s-1M-1
ko=.01 s-1
ko2=.67 s-1M-1
k1=0 s-1
k2=10000 s-1
[O2]=0.1 mM
[Porphyrin]=0.01 mM
τ(1g) = 1 ms
τ(1g) = 0.1 ms

Excitation on Film Setup
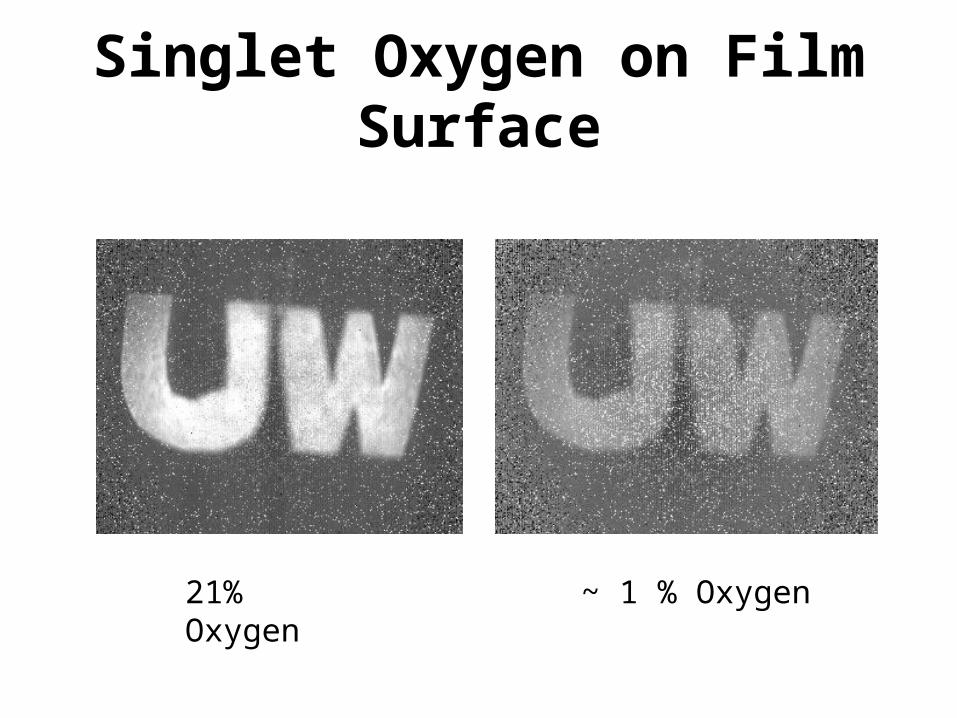
Singlet Oxygen on Film Surface
21% Oxygen ~ 1 % Oxygen

Stern Volmer plots at 650 nm &1270 nm

El Al 747-258F/SCD
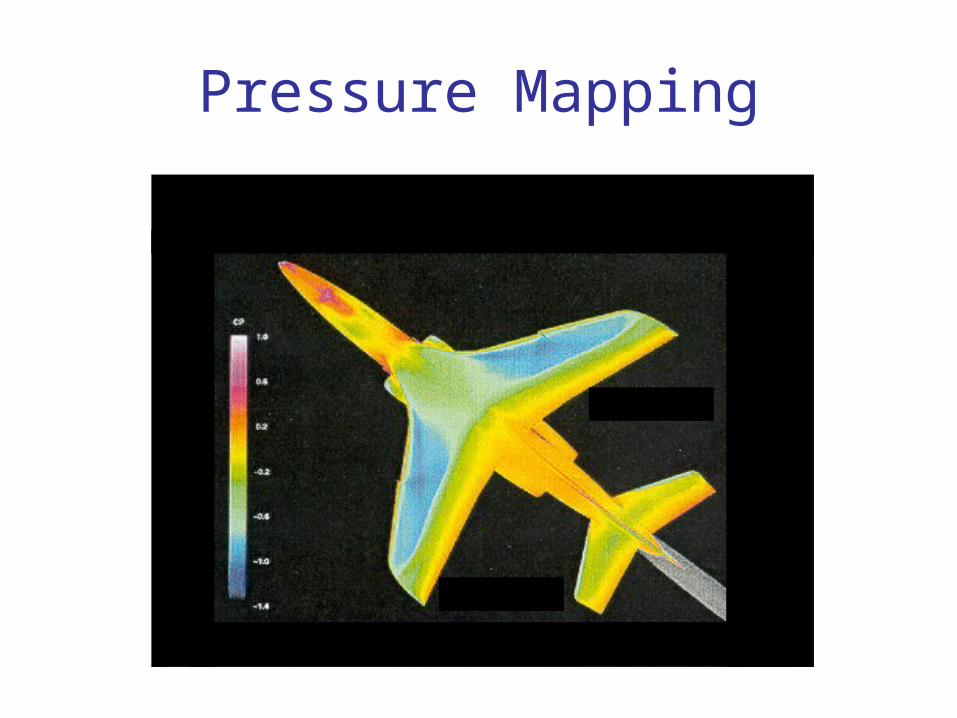
Pressure Mapping
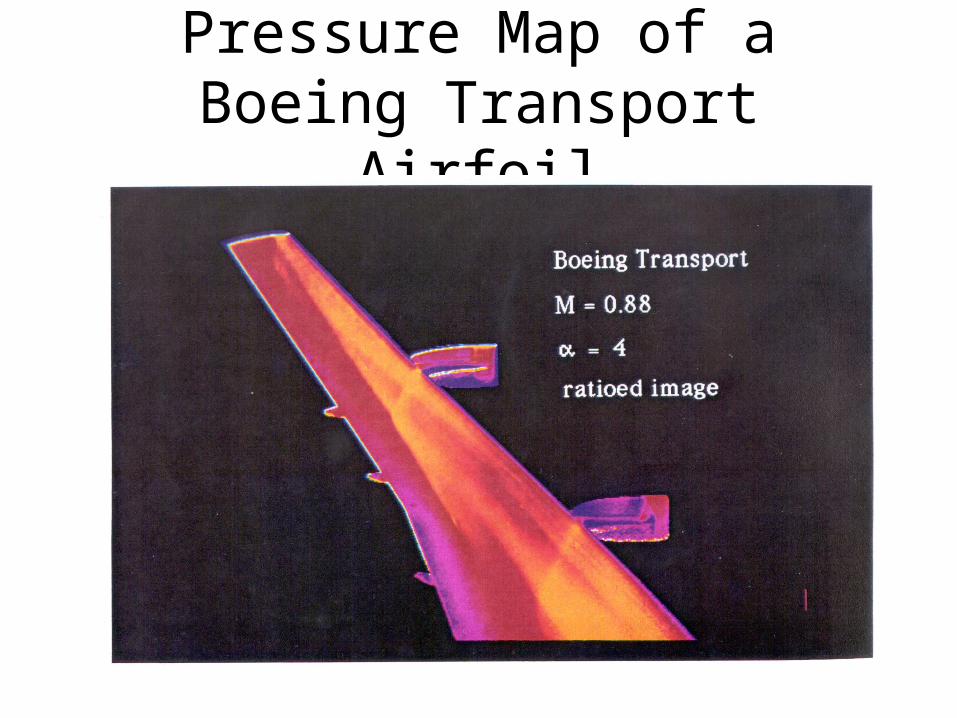
Pressure Map of a Boeing Transport Airfoil

Chine Placement

PSP Uses
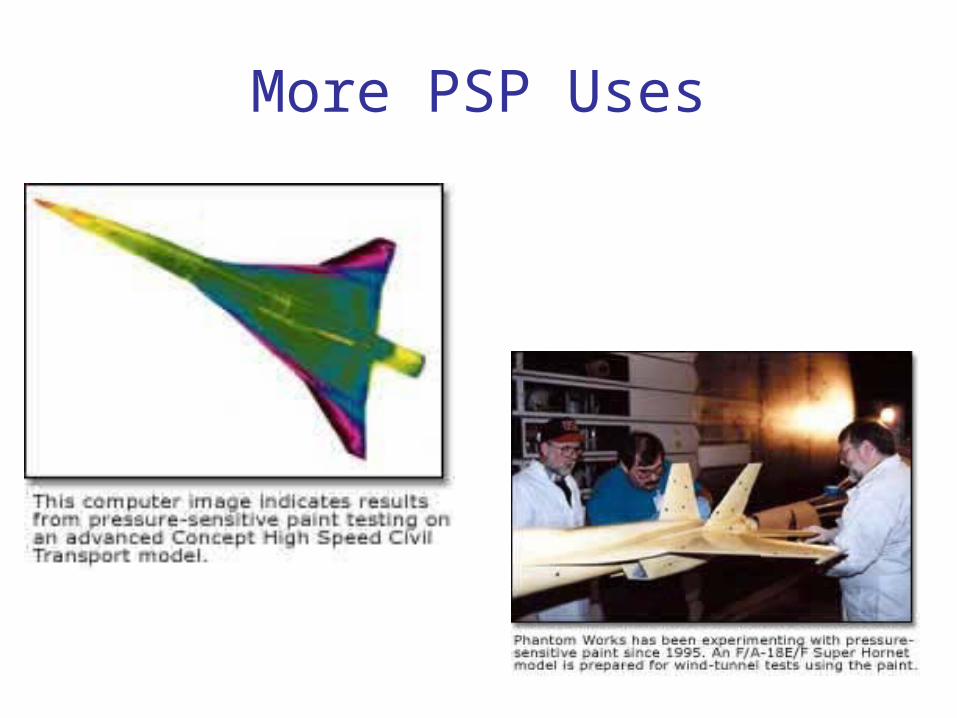
More PSP Uses

Low Speed Automotive Test Objectives
• Performance evaluation of dual luminophor PSP at low airflow velocities
–Dual luminophor PSP was applied to a model automobile and subject to low speed wind tunnel tests
–Points of evaluation:
• Temperature sensitivity correction
• Model motion
• Excitation variations

Raw Pressure and Temperature Data
Airflow velocity: V = 94 m/s

Corrected Cp Data
Airflow velocity: V = 94 m/s
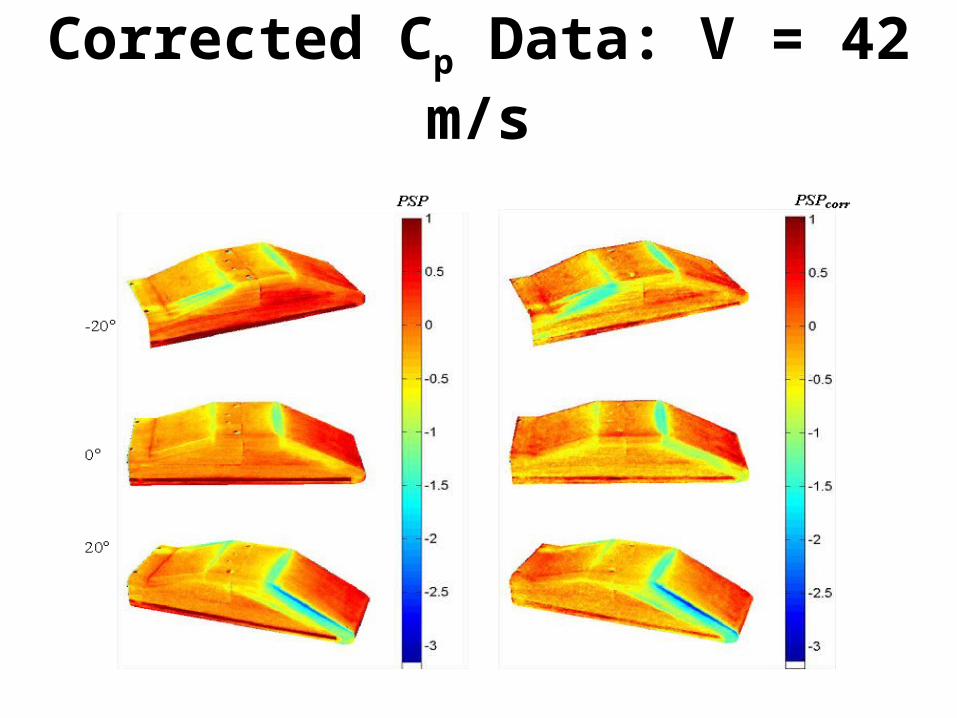
Corrected Cp Data: V = 42 m/s
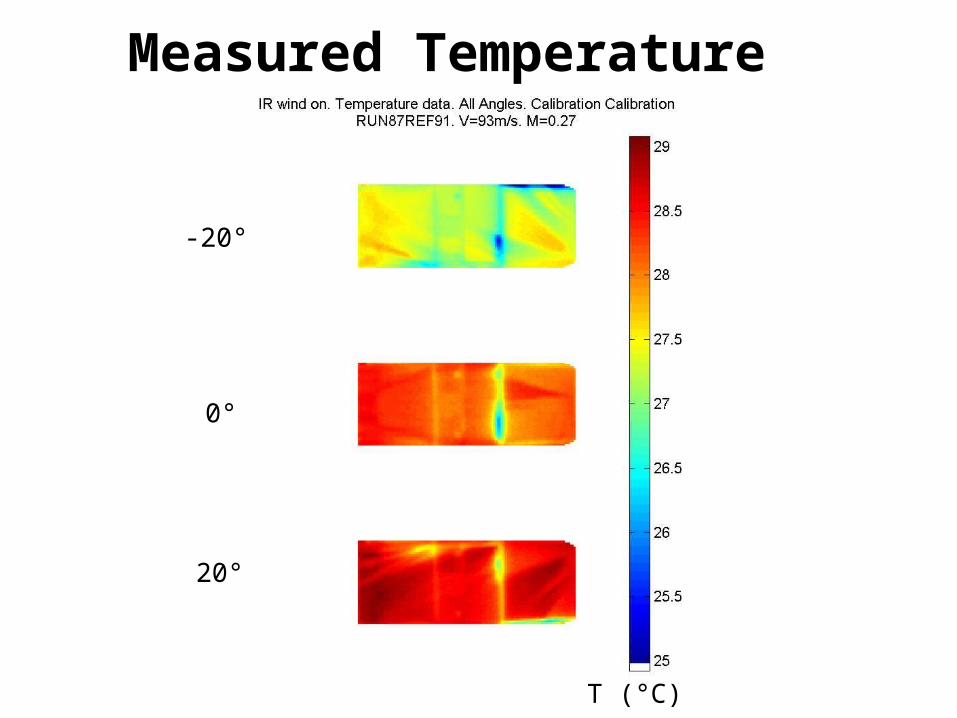
Measured Temperature
-20°
0°
20°
T (°C)

With and Without Mirror

Low Speed Automotive Test Summary
• The ratio of the two signals (PSP/TSP)– Simplicity, no need to compute local temperature– Correct for excitation variations – Reduced the temperature sensitivity to -0.07% / C – Minimum effect on the pressure sensitivity.
• PSPcorr algorithm and simple PSP/TSP ratio produced similar results.

Insect Flight: Anticipated Difficulties
• Response Time– Wing beat frequency = 200 Hz– Resolve into 10 positions 2000 Hz– 1/2000 Hz 0.5 ms response time desired
• Sensitivity– The minimum lift pressure required by a
honey bee in hovering flight is ~ 210-4 atm
• Existing PSPs were to stiff, heavy, and slow for insect flight applications P = 210-4 atm
P = 510-1 atm
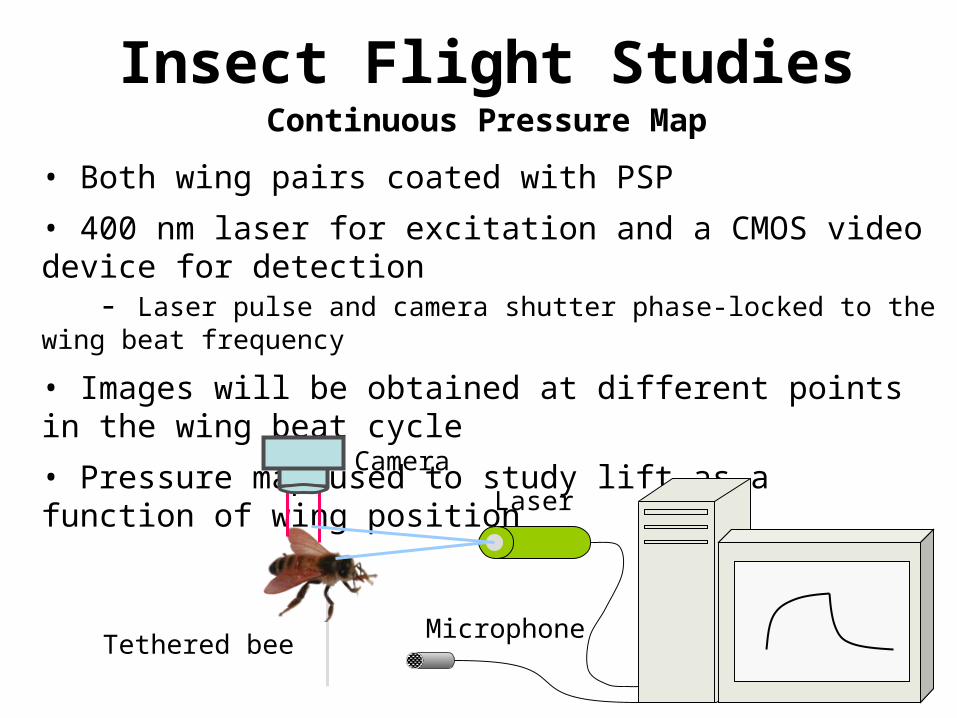
Insect Flight Studies
• Both wing pairs coated with PSP
• 400 nm laser for excitation and a CMOS video device for detection - Laser pulse and camera shutter phase-locked to the wing beat frequency
• Images will be obtained at different points in the wing beat cycle
• Pressure map used to study lift as a function of wing position
Microphone
Laser
Camera
Tethered bee
Continuous Pressure Map

Polymeric Smart Skin Materials—Biocompatible Coatings

Progress in Pressure Sensitive Paint at University of Washington
Properties 1990 2000 2004
Dynamic range 1.0 bar 50 m bar 1 m bar
Response Time 90%
(m sec)
2500 10 0.07
Temperature coefficient
(% Intensity / degree
-2.5 -0.6 -0.05
Temperature induced error
(m bar / degree)
34 10 1
Applications High speed
(airfoil)
M > 0.3
Re = 106
Low speed
(Auto model)
M> 0.1
Re = 105
Insect flight
M~ 0.02
Re = 103

Shear Stress
• One of the two fundamental forces measured by aerodynamicists.
– Pressure: force normal to airfoil surface, P– Shear Stress: force tangent to airfoil surface,
τw
airfoil
Surface Pressure, P Measured by PSP
airflow, v
Shear Stress, τw
Measured by SSP

Current Shear Stress Measurement Techniques– Mechanical balances– Preston Tubes– Hot wire and hot-film anemometry– MEMS sensors
• But these techniques are still point measurements.
• The resolution of data is dependent upon the number of sensors employed.
Naughton, J., Sheplak, M., Progress in Aerospace Sciences, 38, pp. 515-570 (2002)

SSP Project Objective
• To develop a shear sensitive paint that will provide high-resolution, 2-dimensional shear stress measurements over dynamic surfaces.
• Integrate this technology with current pressure and temperature sensitive paints, ultimately creating a single tool that will measure both pressure and shear stress.

SSP Project Approaches
• Method 1:
– Temperature sensitive paint (TSP)-based shear sensitive paint
• Method 2:
– Dynamic birefringence-based SSP

Method 1: TSP-based SSP
• Theory:– Shear stress can be calculated from the following,
τw = 2cf ρu2
cf = coefficient of friction, a constant that can be derived from the Reynold’s number
ρ = density of the airflow
u = velocity of airflow at a given point on the surface of the airfoil

Steady State Experiment
3 psi (~180 m/s, Re = 8.6x10⁴) 15 psi (~400 m/s, Re = 2.0x10⁵)
C
Wall Jet Wall Jet
Khalil, Rev. Sci Instrum., 75, pp. 192-206 (2004).
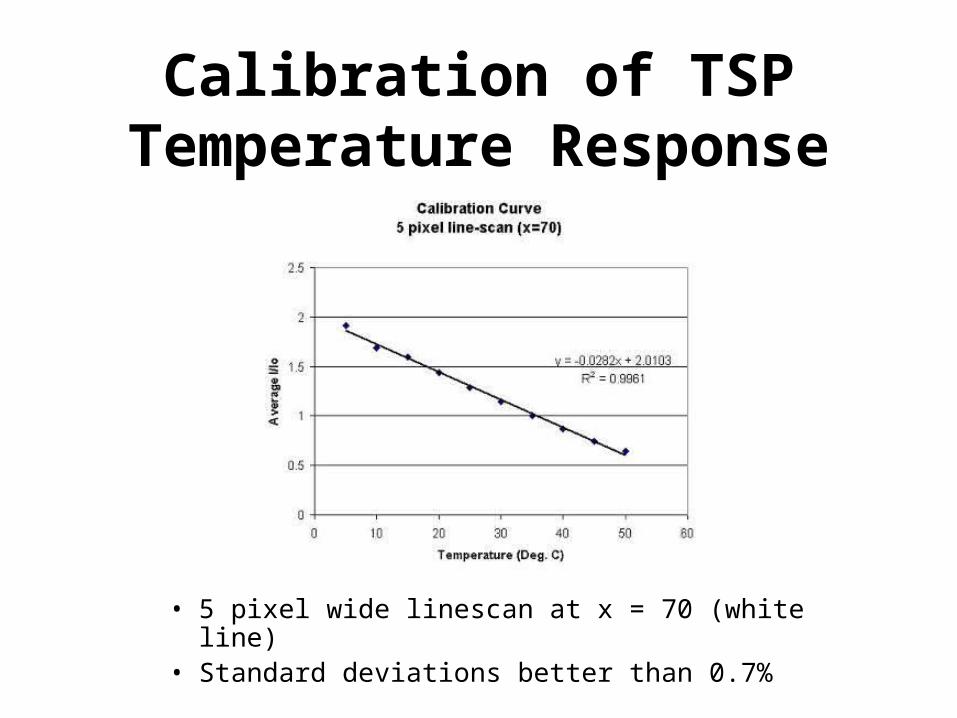
Calibration of TSP Temperature Response
• 5 pixel wide linescan at x = 70 (white line)• Standard deviations better than 0.7%

Calibrated TSP Temperature Response
• 5-pixel wide linescan at x=70.
• Note prominent stagnation point at higher pressures.

TSP-based SSP Theory, cont.
• Consider an airfoil that is heated to a given temperature with a thermal pulse of energy.
The rate of cooling over a given point on the surface of the airfoil will be a function of the velocity of airflow, u, above it.

TSP-based SSP Theory, cont.
Airflow II > Airflow I
Tem
pera
ture
Thermal Pulse
Airflow II
Airflow I
No Airflow
Time
Temperature Profile of a Thermally Pulsed Airfoil Under Varying Airflow Velocities

Experiment Parameters• TSP: 1:200 EuTTA:FIB, 7.5% FIB in TFT• Test surface: steel ribbon (0.5 cm x 2 cm)• Compressed air is directed over the test surface
using a 26-gauge needle.– Airflow is varies from 3 to 7 psig (~180 m/s – 400 m/s,
Re = 8.6 x 10⁴ to 2.0 x 10⁵)
• The ribbon is heated by application of a direct current.– Final temperature varies between 29 and 31 C
• Data acquisition begins when direct current is switched off.– A series of 10 images are acquired at an exposure
time of 100 ms.

Results τw = 2cf ρu2
TSP Response to Varying Airflows
y = -3E-05x + 1.0031
R2 = 0.9977
y = -2E-05x + 1.0022
R2 = 0.9974
y = -1E-05x + 1.0015
R2 = 0.9831
0.965
0.97
0.975
0.98
0.985
0.99
0.995
1
1.005
0 200 400 600 800 1000
Time (ms)
Io/I
No Flow Condition
5 psig
7 psig

Method 2: Dynamic Birefringence-based SSP
• Theory:– Most transparent solids are anisotropic:
• Anisotropic solids have two indices of refraction.– The difference between these axes is known as birefringence.– The birefringence of an anisotropic material will change when a stress
is applied to the object.
lightly sheared liquid crystal molecules
n1 n2
sin n
Kaminsky, W., Proc. R. Soc. Lond. A, 452, pp. 2751-2765, (1996).

Infrastructure Monitoring: Sensor Needs
• Properties of interest in civil engineering:– Oxygen concentration– Moisture content– Metal oxidation– pH
% Oxygen pH (unit) % Moisture
Range 1 - 30 8 – 14 1 - 100
Use life/years: Up to 10
Performance Specifications

Evanescent Field in Optical Fibers
• Light traveling through a waveguide by total internal reflection generates an interface specific, electromagnetic disturbance.
• The transverse component of the reflecting beam generates a standing wave at every point of strike to the interface.
• This harmonic wave, which penetrates the cladding over a small distance is called the evanescent wave.
•400 m
cladding
core •z
•x
dp
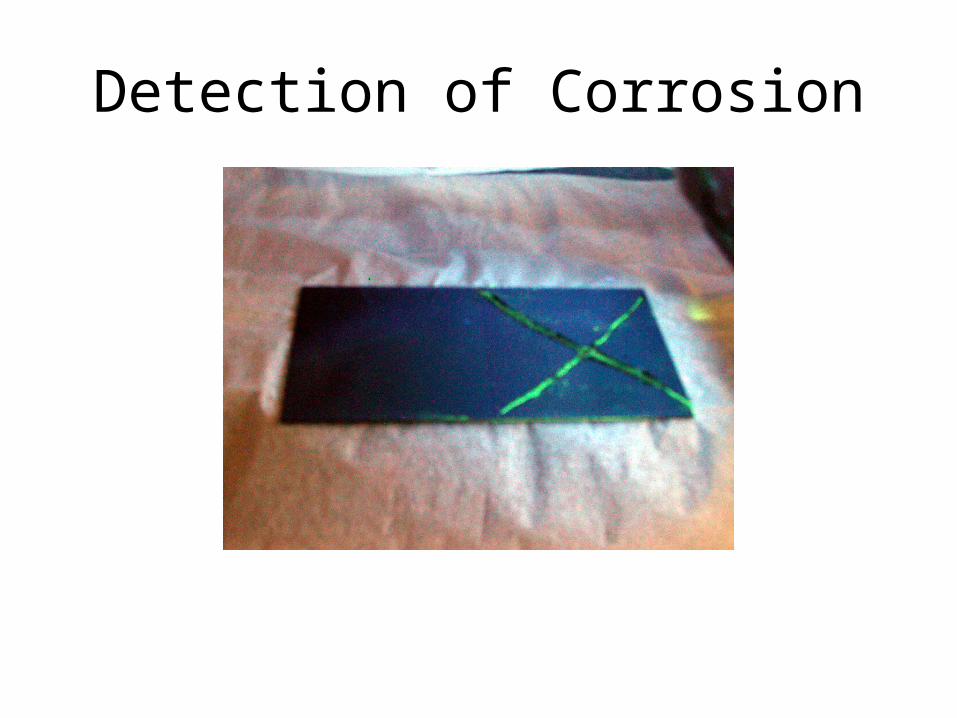
Detection of Corrosion
• Methods of Detection include– Visual– Ultrasonic– X-Ray– Magnetic Flux

The zinc sensor will be integrated into the sacrificial paint layer that contains zinc particles.
Oxidation Process Zn Zn2+
The rate of Zn2+ production is diagnostic for the corrosion process.
Optical chemical sensor that detect the presence of Zn2+ will be the diagnostic tool of detecting corrosion.
Corrosion Sensor Concept

Corrosion Sensor
Monitoring Zinc oxidation
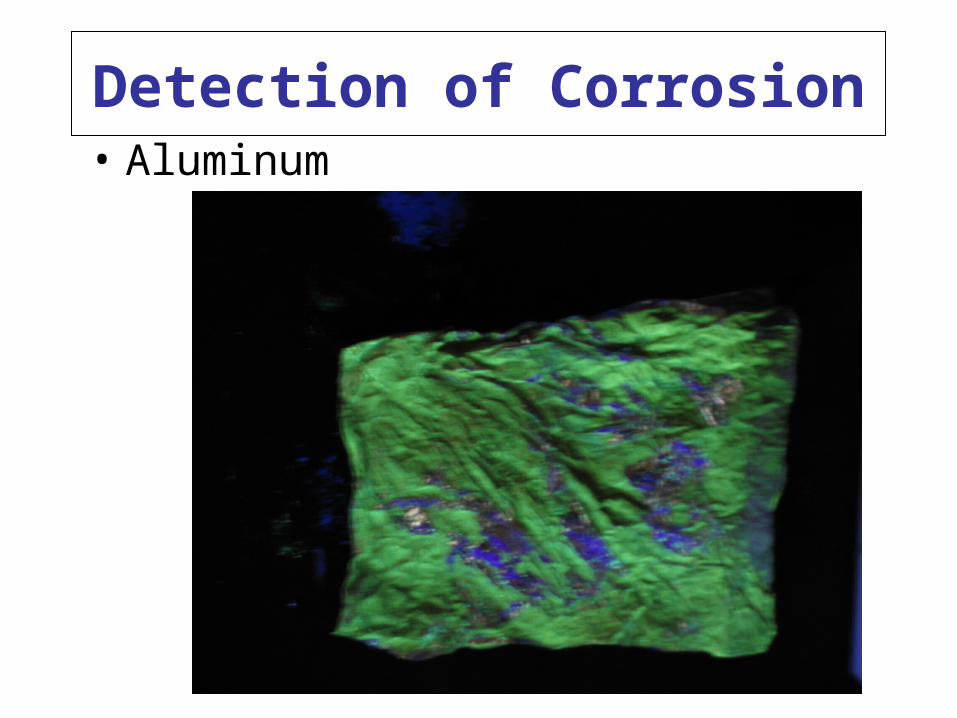
Detection of Corrosion• Aluminum
Detection of Corrosion

Cement pH
Unlike natural rocks and minerals, concrete is a basic material: high [Na+], [K+], and [OH-] create a pH in range 12.5 to 13.5. Reduction in the pH is expected to destabilize the hydration products in the cement. Aqueous acidity is harmful to concrete.

Sensor for high pH environments
Based on luminescence changes

Oxygen Sensor: Cement Curing
• Monitoring of air pocket formation in curing cement– System 1: Ordinary cement– System 2: Cement with surfactant additive
0.0
5.0
10.0
15.0
20.0
25.0
30.0
35.0
40.0
45.0
0 20 40 60 80 100 120 140
Time (hour)
% O
xyge
n
% Oxygen (Cement with Air)
% Oxygen (Cement No Air)
System 2 (Surfactant additive)
System 1 (Cement Only)
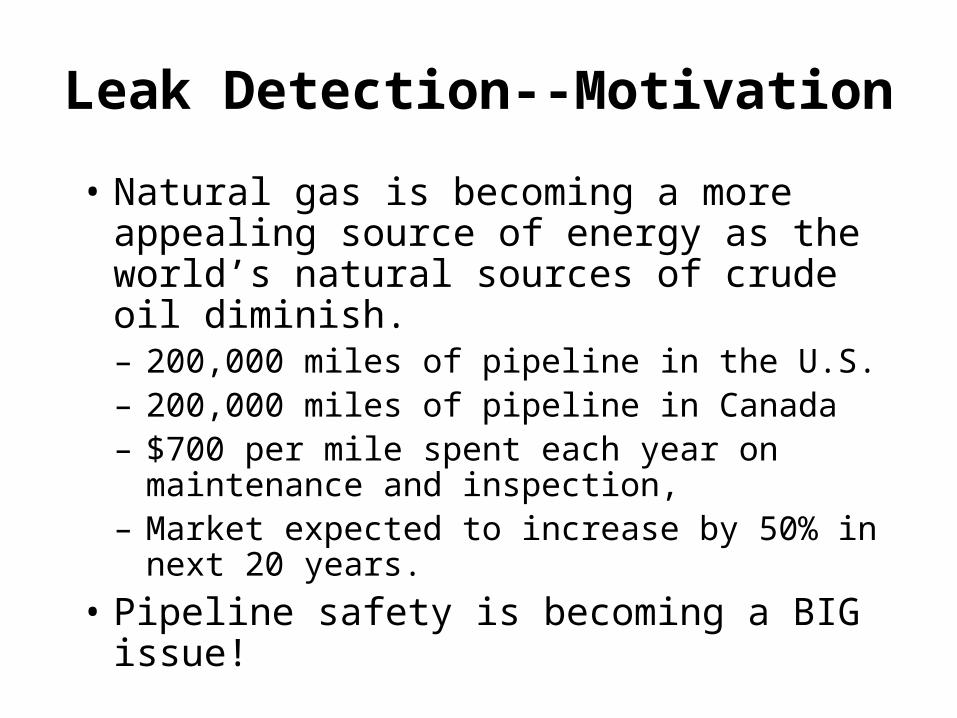
Leak Detection--Motivation
• Natural gas is becoming a more appealing source of energy as the world’s natural sources of crude oil diminish.– 200,000 miles of pipeline in the U.S.– 200,000 miles of pipeline in Canada– $700 per mile spent each year on
maintenance and inspection, – Market expected to increase by 50% in next
20 years.
• Pipeline safety is becoming a BIG issue!

Our Solution• A fiber optic gas leak detection system based
on PSP and evanescent field spectroscopy.
outer cladding/buffer (~150m) inner cladding (~12 m)
core (1mm)
Oxygen sensor film
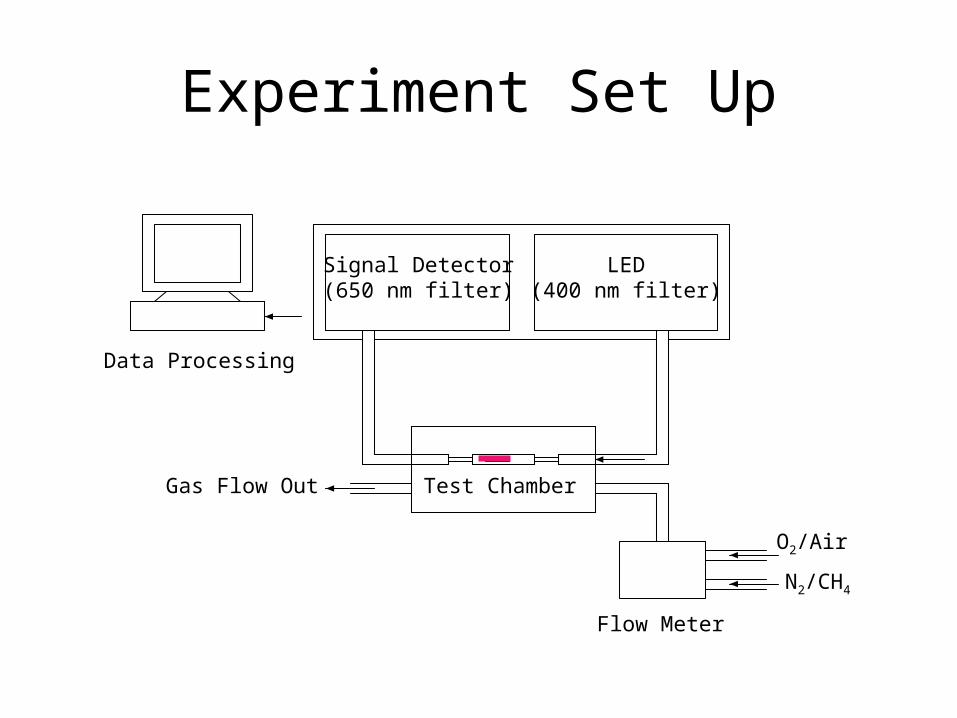
Experiment Set Up
Data Processing
Signal Detector(650 nm filter)
LED(400 nm filter)
Flow Meter
Gas Flow Out
O2/Air
N2/CH4
Test Chamber

Natural Gas Leak Detection

Leak Detection Results
PSP-coated FOC Simulated Methane LeakOpen Air Environment
0.9
1
1.1
1.2
1.3
1.4
1.5
0 10 20 30 40 50 60
Time (min.)
PSP-coated FOC Simulated Methane LeakPipe Buried in Sand
0.9
1
1.1
1.2
1.3
1.4
1.5
0 10 20 30 40 50
Time (min.)