nrmp charting the outcomes in the match - the match ... · pdf filestudents. in 2016, 91...
TRANSCRIPT

Charting Outcomes in the Matchfor U.S. Allopathic SeniorsCharacteristics of U.S. Allopathic Seniors Who Matched to Their Preferred Specialty in the 2016 Main Residency Match
1st Edition
Prepared by:National Resident Matching Programwww.nrmp.org
September 2016

Questions about the contents of this publication may be directed to Mei Liang, Director of Research, National Resident Matching Program, (202) 400-2233 or [email protected].
Questions about the NRMP should be directed to Mona M. Signer, President and CEO, National Resident Matching Program, (202) 400-2233 or [email protected].
Copyright ©2016 National Resident Matching Program, 2121 K Street, NW, Suite 1000, Washington, DC 20037 USA. All rights reserved. Permission to use, copy and/or distribute any documentation and/or related images from this publication shall be expressly obtained from the
NRMP
National Resident Matching Program, Charting Outcomes in the Match for U.S. Allopathic Seniors, 2016. National Resident Matching Program, Washington, DC 2016.

2016 Table of Contents
Introduction ..................................................................................................................................................... ii
Tables and Charts for All Specialties
Chart 1. Active Applicants in the 2016 Main Residency Match ................................................................. 2
Table 1. Number of Applicants and Positions in the 2016 Main Residency Match .................................... 3
Chart 2. Ratio of U.S. Allopathic Seniors Ranking Specialty First / Available Positions ......................... 4
Chart 3. Match Rates of U.S. Allopathic Seniors ....................................................................................... 5
Table 2. Summary Statistics on U.S. Allopathic Seniors ............................................................................ 6
Chart 4. Median Number of Contiguous Ranks of U.S. Allopathic Seniors ............................................... 7
Chart 5. Mean Number of Different Specialties Ranked of U.S. Allopathic Seniors ................................. 8
Chart 6. USMLE Step 1 Scores of U.S. Allopathic Seniors ........................................................................ 9
Chart 7. USMLE Step 2 CK Scores of U.S. Allopathic Seniors ............................................................... 10
Chart 8. Mean Number of Research Experiences of U.S. Allopathic Seniors .......................................... 11
Chart 9. Mean Number of Abstracts, Presentations, and Publications of U.S. Allopathic Seniors ........... 12
Chart 10. Mean Number of Work Experiences of U.S. Allopathic Seniors .............................................. 13
Chart 11. Mean Number of Volunteer Experiences of U.S. Allopathic Seniors ....................................... 14
Chart 12. Percentage of U.S. Allopathic Seniors Who are Members of AOA .......................................... 15
Chart 13. Percentage of U.S. Allopathic Seniors Graduating from One of the 40 Medical Schools
with the Highest NIH Funding .................................................................................................. 16
Chart 14. Percentage of U.S. Allopathic Seniors Who Have a Graduate Degree ..................................... 17
Tables and Charts for Individual Specialties Anesthesiology .......................................................................................................................................... 18 Child Neurology ........................................................................................................................................ 27 Dermatology ............................................................................................................................................. 36 Diagnostic Radiology ............................................................................................................................... 45 Emergency Medicine ................................................................................................................................ 54 Family Medicine ....................................................................................................................................... 63 General Surgery ........................................................................................................................................ 72 Internal Medicine ...................................................................................................................................... 81 Internal Medicine/Pediatrics ..................................................................................................................... 90 Neurological Surgery ................................................................................................................................ 99 Neurology .............................................................................................................................................. 108 Obstetrics and Gynecology ..................................................................................................................... 117 Orthopaedic Surgery ............................................................................................................................... 126 Otolaryngology ....................................................................................................................................... 135 Pathology ................................................................................................................................................ 144 Pediatrics ................................................................................................................................................ 153 Physical Medicine and Rehabilitation .................................................................................................... 162 Plastic Surgery ........................................................................................................................................ 171 Psychiatry ............................................................................................................................................... 180 Radiation Oncology ................................................................................................................................. 189 Vascular Surgery ..................................................................................................................................... 198
iCopyright ©2016 NRMP. Reproduction prohibited without the written permission of the NRMP. Charting Outcomes in the Match
for U.S. Allopathic Seniors, 2016
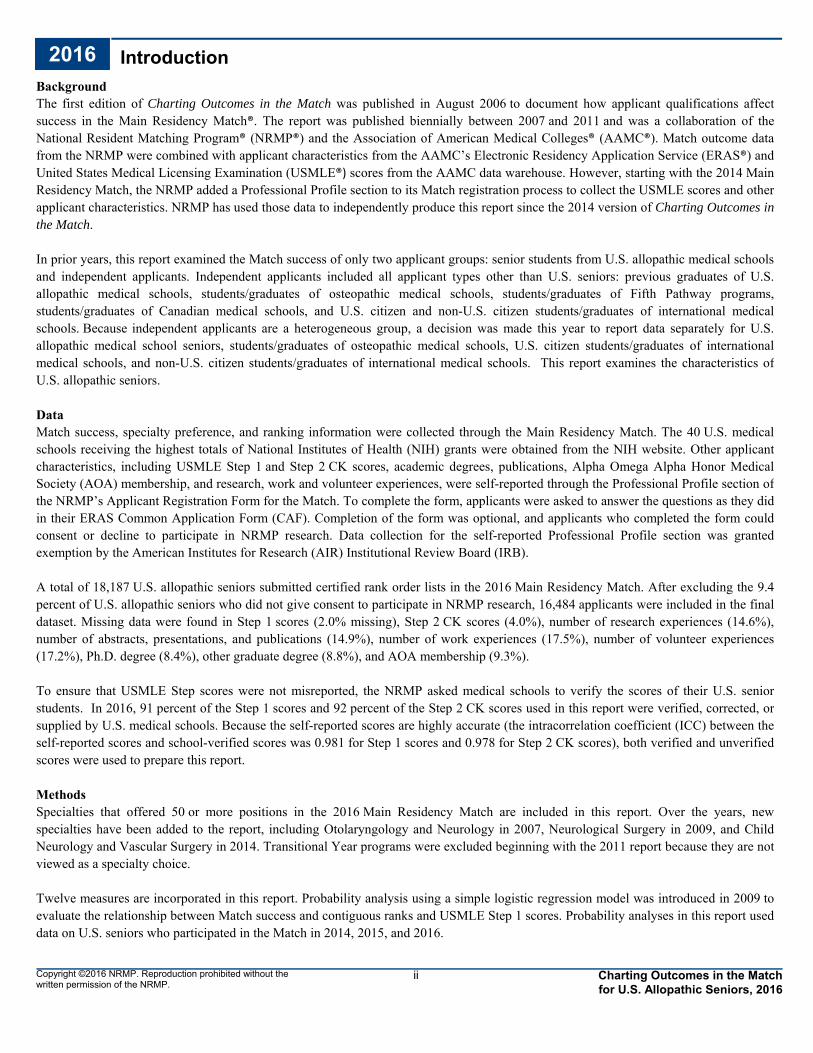
2016 Introduction
iiCopyright ©2016 NRMP. Reproduction prohibited without the written permission of the NRMP.
BackgroundThe first edition of Charting Outcomes in the Match was published in August 2006 to document how applicant qualifications affectsuccess in the Main Residency Match®. The report was published biennially between 2007 and 2011 and was a collaboration of theNational Resident Matching Program® (NRMP®) and the Association of American Medical Colleges® (AAMC®). Match outcome data from the NRMP were combined with applicant characteristics from the AAMC’s Electronic Residency Application Service (ERAS®) and United States Medical Licensing Examination (USMLE®) scores from the AAMC data warehouse. However, starting with the 2014 MainResidency Match, the NRMP added a Professional Profile section to its Match registration process to collect the USMLE scores and otherapplicant characteristics. NRMP has used those data to independently produce this report since the 2014 version of Charting Outcomes inthe Match.
In prior years, this report examined the Match success of only two applicant groups: senior students from U.S. allopathic medical schools and independent applicants. Independent applicants included all applicant types other than U.S. seniors: previous graduates of U.S.allopathic medical schools, students/graduates of osteopathic medical schools, students/graduates of Fifth Pathway programs,students/graduates of Canadian medical schools, and U.S. citizen and non-U.S. citizen students/graduates of international medicalschools. Because independent applicants are a heterogeneous group, a decision was made this year to report data separately for U.S. allopathic medical school seniors, students/graduates of osteopathic medical schools, U.S. citizen students/graduates of international medical schools, and non-U.S. citizen students/graduates of international medical schools. This report examines the characteristics ofU.S. allopathic seniors.
DataMatch success, specialty preference, and ranking information were collected through the Main Residency Match. The 40 U.S. medical schools receiving the highest totals of National Institutes of Health (NIH) grants were obtained from the NIH website. Other applicantcharacteristics, including USMLE Step 1 and Step 2 CK scores, academic degrees, publications, Alpha Omega Alpha Honor MedicalSociety (AOA) membership, and research, work and volunteer experiences, were self-reported through the Professional Profile section ofthe NRMP’s Applicant Registration Form for the Match. To complete the form, applicants were asked to answer the questions as they didin their ERAS Common Application Form (CAF). Completion of the form was optional, and applicants who completed the form couldconsent or decline to participate in NRMP research. Data collection for the self-reported Professional Profile section was grantedexemption by the American Institutes for Research (AIR) Institutional Review Board (IRB).
A total of 18,187 U.S. allopathic seniors submitted certified rank order lists in the 2016 Main Residency Match. After excluding the 9.4percent of U.S. allopathic seniors who did not give consent to participate in NRMP research, 16,484 applicants were included in the finaldataset. Missing data were found in Step 1 scores (2.0% missing), Step 2 CK scores (4.0%), number of research experiences (14.6%), number of abstracts, presentations, and publications (14.9%), number of work experiences (17.5%), number of volunteer experiences(17.2%), Ph.D. degree (8.4%), other graduate degree (8.8%), and AOA membership (9.3%).
To ensure that USMLE Step scores were not misreported, the NRMP asked medical schools to verify the scores of their U.S. seniorstudents. In 2016, 91 percent of the Step 1 scores and 92 percent of the Step 2 CK scores used in this report were verified, corrected, orsupplied by U.S. medical schools. Because the self-reported scores are highly accurate (the intracorrelation coefficient (ICC) between the self-reported scores and school-verified scores was 0.981 for Step 1 scores and 0.978 for Step 2 CK scores), both verified and unverified scores were used to prepare this report.
MethodsSpecialties that offered 50 or more positions in the 2016 Main Residency Match are included in this report. Over the years, newspecialties have been added to the report, including Otolaryngology and Neurology in 2007, Neurological Surgery in 2009, and Child Neurology and Vascular Surgery in 2014. Transitional Year programs were excluded beginning with the 2011 report because they are notviewed as a specialty choice.
Twelve measures are incorporated in this report. Probability analysis using a simple logistic regression model was introduced in 2009 toevaluate the relationship between Match success and contiguous ranks and USMLE Step 1 scores. Probability analyses in this report used data on U.S. seniors who participated in the Match in 2014, 2015, and 2016.
Charting Outcomes in the Matchfor U.S. Allopathic Seniors, 2016

iiiCopyright ©2016 NRMP. Reproduction prohibited without the written permission of the NRMP.
It is important to note that for purposes of this report, Match success is defined as a match to the specialty of the applicant’s first-ranked program, or "preferred specialty," because that is assumed to be the specialty of choice. Lack of success includes matching to another specialty as well as failure to match at all. No distinction was made based on whether applicants matched to the first, second, third, or last choice program.
SummarySome general observations apply to all specialties in this report. U.S. allopathic seniors who are successful in matching to their preferredspecialty are more likely to:
Rank more programs within their preferred specialty Have higher USMLE Step 1 and Step 2 scores Be members of Alpha Omega Alpha
Although other measures seem to be related to Match success for some specialties, the relationships are not consistent enough to drawbroad conclusions across specialties. In addition, the data sources used for Charting Outcomes in the Match do not include other important applicant factors such as course evaluations, reference letters, and the Medical School Performance Evaluation (MSPE).
Despite the fairly strong relationship between USMLE Step scores and Match success, the distributions of scores show that programdirectors consider other qualifications. A high score is not a guarantee of success, and a lower score is not a bar to success. Even in themost competitive specialties a few individuals with higher scores are not successful. In the less competitive specialties, U.S. seniors with scores slightly above passing usually match to their preferred specialties. The data also are reassuring because they indicate that at leastsome programs do not employ an arbitrary cutoff or decline to consider applicants with less than excellent test performance.
The data in this report support the following straightforward advice one should give to an applicant: Rank all of the programs you really want, without regard to your estimate of your chances with those programs. Include a mix of both highly competitive and less competitive programs within your preferred specialty. Include all of the programs on your list where the program has expressed an interest in you and where you would accept a
position. If you are applying to a competitive specialty and you want to have a residency position in the event you are unsuccessful in
matching to a program in your preferred specialty, also rank your most preferred programs in an alternate specialty. Include all of your qualifications in your application, but know that you do not have to be AOA, have the highest USMLE
scores, have publications, or have participated in research projects to match successfully.
Program directors and applicants will find the tables and charts for the specialty of their particular interest later in this report.
For questions, comments or more information, please contact:Mei Liang, Director of ResearchNational Resident Matching Program2121 K Street, NW, Suite 1000Washington, DC 20037Tel: (202) 400-2233Email: [email protected]
2016 Introduction (continued)
Charting Outcomes in the Matchfor U.S. Allopathic Seniors, 2016

Tables and Charts for All Specialties
1Copyright ©2016 NRMP. Reproduction prohibited without the written permission of the NRMP.
Charting Outcomes in the Matchfor U.S. Allopathic Seniors, 2016

2
Chart1
Active Applicants in the 2016 Main Residency Matchby Applicant Type
5,323
U.S. CitizenStudents/Graduates ofInternational Medical
Schools
7,460
Non-U.S. CitizenStudents/Graduates
of InternationalMedical Schools
1,502
Previous Graduates ofU.S. Allopathic
Medical Schools
18,187
Seniors of U.S.Allopathic Medical
Schools
15
Students/Graduates ofCanadian Medical
Schools
7
Students/Graduates ofFifth Pathway
Programs
2,982
Students/Graduates ofOsteopathic Medical
Schools
Chart 1 shows the number of active applicants (applicants who submitted rank order lists of programs) by applicant type in the 2016 Main Residency Match. A total of 35,476 active applicans participated in the 2016 Main Residency Match. U.S. allopathic medical school seniors constituted 51.3 percent of the applicants in the 2016 Match. The next largest group were non-U.S. citizen students and graduates of international medicalschools (21.0%). The numbers of Fifth Pathway (n=7) and Canadian graduates (n=15) are small.
Copyright ©2016 NRMP. Reproduction prohibited without the written permission of the NRMP.
Charting Outcomes in the Matchfor U.S. Allopathic Seniors, 2016

3
Table1
Number of Applicants and Positions in the 2016 Main Residency Matchby Preferred Specialty*
Table 1 provides a summary of the numbers of positions for selected specialties and the numbers of all applicants and U.S. allopathic seniors who preferred each specialty. For example, a total of 1,771 applicants preferred Anesthesiology (orranked an Anesthesiology position first), among whom 1,076 were U.S. allopathic seniors (1,048 matched and 28 not matched to Anesthesiology). For each of the 1,696 Anesthesiology positions there were 1.04 applicants who preferred the specialty, including 0.63 U.S. allopathic seniors.
Only those specialties offering 50 or more positions are included. For those specialties offering both PGY-1 and PGY-2positions (including Physician (R) positions), all position types have been combined.
TotalPositionsOfferedPreferred Specialty
TotalNumber of
All Applicants
Number ofAll ApplicantsPer Position Matched
NotMatched
Number of U.S. Seniors
Total
Number ofU.S. Seniors Per
Position
Anesthesiology 1,696 1,771 1.04 1,048 28 1076 0.63
Child Neurology 170 170 1.00 95 6 101 0.59
Dermatology 440 614 1.40 360 107 467 1.06
Diagnostic Radiology 1,168 1,220 1.04 719 15 734 0.63
Emergency Medicine 1,895 2,270 1.20 1,471 142 1613 0.85
Family Medicine 3,238 4,139 1.28 1,393 84 1477 0.46
General Surgery 1,241 1,845 1.49 897 184 1081 0.87
Internal Medicine 7,352 9,857 1.34 3,422 84 3506 0.48
Internal Medicine/Pediatrics 386 460 1.19 325 44 369 0.96
Neurological Surgery 216 342 1.58 200 64 264 1.22
Neurology 770 985 1.28 434 18 452 0.59
Obstetrics and Gynecology 1,265 1,606 1.27 979 97 1076 0.85
Orthopaedic Surgery 717 1,034 1.44 649 214 863 1.20
Otolaryngology 304 358 1.18 272 34 306 1.01
Pathology 579 755 1.30 246 12 258 0.45
Pediatrics 2,768 3,234 1.17 1,825 64 1889 0.68
Physical Medicine and Rehabilitation 414 538 1.30 219 27 246 0.59
Plastic Surgery 152 206 1.36 133 40 173 1.14
Psychiatry 1,386 2,134 1.54 841 94 935 0.67
Radiation Oncology 186 218 1.17 169 17 186 1.00
Vascular Surgery 56 107 1.91 49 20 69 1.23
* Preferred specialty is the specialty of the first-ranked program on an applicant's rank order list, excluding preliminary programs in specialties.Source: NRMP Data Warehouse.
Copyright ©2016 NRMP. Reproduction prohibited without the written permission of the NRMP.
Charting Outcomes in the Matchfor U.S. Allopathic Seniors, 2016

4
Chart2
Ratio of U.S. Allopathic Seniors Ranking Specialty First / Available Positionsby Preferred Specialty
0.0
0.5
1.0
1.5
2.0
2.5
Anesth
esiol
ogy
Child
Neuro
logy
Derm
atolo
gy
Diagno
stic R
adiol
ogy
Emer
genc
y Med
icine
Family
Med
icine
Gener
al Sur
gery
Inte
rnal
Med
icine
Inte
rnal
Med
icine
/Ped
iatric
s
Neuro
logica
l Sur
gery
Neuro
logy
Obste
trics
and
Gyn
ecolo
gy
Orthop
aedic
Sur
gery
Otolar
yngo
logy
Patho
logy
Pediat
rics
Physic
al M
edici
ne a
nd R
ehab
ilitat
ion
Plastic
Sur
gery
Psych
iatry
Radiat
ion O
ncolo
gy
Vascu
lar S
urge
ry
0.63 0.59
1.06
0.63
0.85
0.46
0.87
0.48
0.96
1.22
0.59
0.85
1.20
1.01
0.45
0.680.59
1.14
0.67
1.00
1.23
0.41 0.41
0.33
0.420.35
0.82
0.620.86
0.24
0.36
0.69 0.420.24
0.170.86
0.490.71 0.22
0.87
0.17
0.68
All Other Applicants U.S. Seniors
Source: NRMP Data Warehouse
Copyright ©2016 NRMP. Reproduction prohibited without the written permission of the NRMP.
Chart 2 shows the ratios of U.S. allopathic seniors and all applicants who preferred each specialty to available positions inthat specialty. All specialties except Dermatology, Neurological Surgery, Orthopaedic Surgery, Plastic Surgery, and Vascular Surgery have enough positions to accommodate all U.S. seniors who preferred that specialty. The ratio was lowest for Pathology, Family Medicine, and Internal Medicine.
Charting Outcomes in the Matchfor U.S. Allopathic Seniors, 2016

5
Chart3
Match Rates of U.S. Allopathic SeniorsPercent Matched by Preferred Specialty
0
20
40
60
80
100
Anesth
esiol
ogy
Child
Neuro
logy
Derm
atolo
gy
Diagno
stic R
adiol
ogy
Emer
genc
y Med
icine
Family
Med
icine
Gener
al Sur
gery
Inte
rnal
Med
icine
Inte
rnal
Med
icine
/Ped
iatric
s
Neuro
logica
l Sur
gery
Neuro
logy
Obste
trics
and
Gyn
ecolo
gy
Orthop
aedic
Sur
gery
Otolar
yngo
logy
Patho
logy
Pediat
rics
Physic
al M
edici
ne a
nd R
ehab
ilitat
ion
Plastic
Sur
gery
Psych
iatry
Radiat
ion O
ncolo
gy
Vascu
lar S
urge
ry
9794
77
9891
94
83
98
88
76
9691
75
8995 97
89
77
90 91
71
Source: NRMP Data Warehouse
Chart 3 shows the percentages of U.S. seniors who matched to their preferred specialty. Overall, 91.9 percent of U.S. seniors matched to their preferred specialty, ranging from a high of 98.0 percent (Diagnostic Radiology) to a low of 71.0 percent (Vascular Surgery).
Copyright ©2016 NRMP. Reproduction prohibited without the written permission of the NRMP.
Charting Outcomes in the Matchfor U.S. Allopathic Seniors, 2016
6
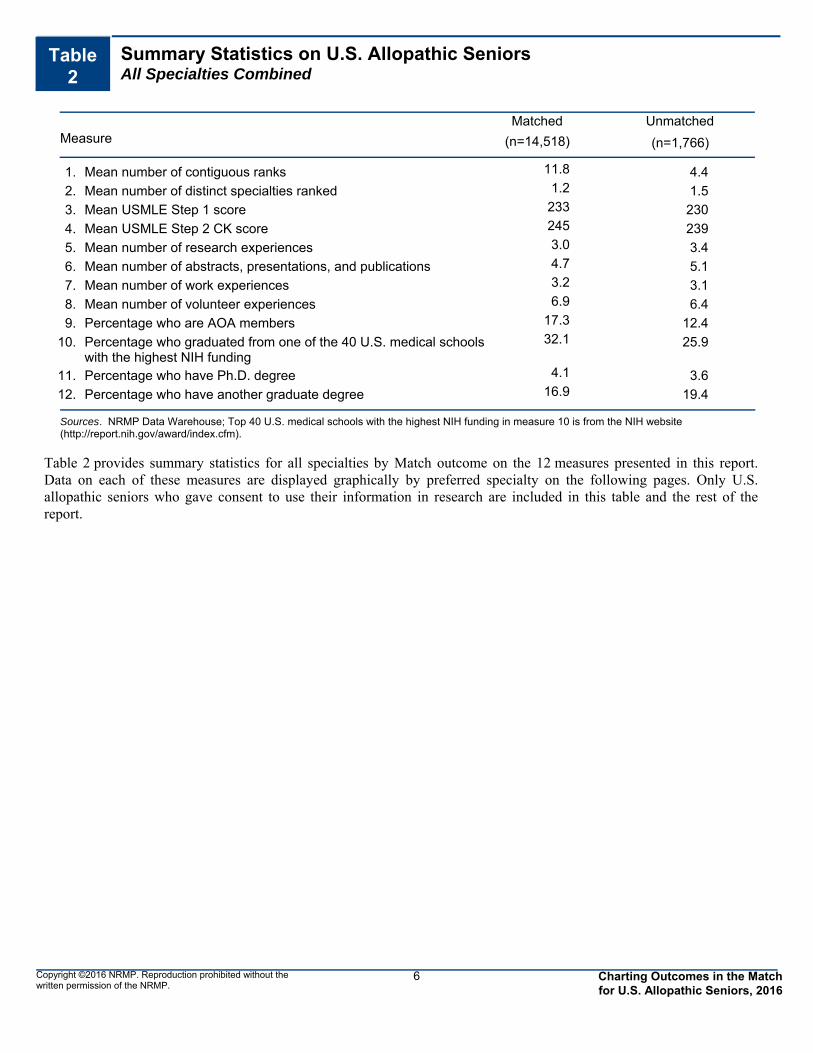
Table2
Summary Statistics on U.S. Allopathic SeniorsAll Specialties Combined
Measure (n=14,518) (n=1,766)
Matched Unmatched
1. 11.8 4.4Mean number of contiguous ranks
2. 1.2 1.5Mean number of distinct specialties ranked
3. 233 230Mean USMLE Step 1 score
4. 245 239Mean USMLE Step 2 CK score
5. 3.0 3.4Mean number of research experiences
6. 4.7 5.1Mean number of abstracts, presentations, and publications
7. 3.2 3.1Mean number of work experiences
8. 6.9 6.4Mean number of volunteer experiences
9. 17.3 12.4Percentage who are AOA members
10. 32.1 25.9Percentage who graduated from one of the 40 U.S. medical schools with the highest NIH funding
11. 4.1 3.6Percentage who have Ph.D. degree
12. 16.9 19.4Percentage who have another graduate degree
Sources. NRMP Data Warehouse; Top 40 U.S. medical schools with the highest NIH funding in measure 10 is from the NIH website (http://report.nih.gov/award/index.cfm).
Copyright ©2016 NRMP. Reproduction prohibited without the written permission of the NRMP.
Table 2 provides summary statistics for all specialties by Match outcome on the 12 measures presented in this report.Data on each of these measures are displayed graphically by preferred specialty on the following pages. Only U.S. allopathic seniors who gave consent to use their information in research are included in this table and the rest of the report.
Charting Outcomes in the Matchfor U.S. Allopathic Seniors, 2016

7
Chart4
Median Number of Contiguous Ranks of U.S. Allopathic Seniorsby Preferred Specialty and Match Status
0
4
8
12
16
Anesth
esiol
ogy
Child
Neuro
logy
Derm
atolo
gy
Diagno
stic R
adiol
ogy
Emer
genc
y Med
icine
Family
Med
icine
Gener
al Sur
gery
Inte
rnal
Med
icine
Inte
rnal
Med
icine
/Ped
iatric
s
Neuro
logica
l Sur
gery
Neuro
logy
Obste
trics
and
Gyn
ecolo
gy
Orthop
aedic
Sur
gery
Otolar
yngo
logy
Patho
logy
Pediat
rics
Physic
al M
edici
ne a
nd R
ehab
ilitat
ion
Plastic
Sur
gery
Psych
iatry
Radiat
ion O
ncolo
gy
Vascu
lar S
urge
ry
14
11
8
1312
10
13
11 11
16
1213
1213
10
12
15
13
9
12
14
32
34 4
3
5
32
11
45
6 6
43 3
65 5
13
Matched Not Matched
Source: NRMP Data Warehouse
In general, applicants are more likely to be successful if they rank more programs in their desired specialty. To quantify thisaspect of applicant behavior, we tallied the number of programs ranked in the first-choice specialty before a program in another specialty appeared on the applicant's rank order list (contiguous ranks).
Chart 4 displays the median number of contiguous ranks by preferred specialty for U.S. allopathic seniors who matched anddid not match to their preferred specialty. The chart shows considerable variation across the specialties for U.S. seniors.Neurological Surgery had the longest average contiguous rank list (16) for matched U.S. seniors and Dermatology had theshortest (8). For all specialties, U.S. seniors who matched to their preferred specialty had median contiguous rank lists thatwere longer than those of U.S. seniors who did not match.
The principal message of these graphs is that applicants with longer rank order lists are more successful than those with shorterones. The NRMP has been recommending longer lists for many years, but some applicants apparently do not heed the advice.Others may have shorter lists because they found only a few programs willing to entertain their applications or because theycould not afford a large number of interview trips.
Copyright ©2016 NRMP. Reproduction prohibited without the written permission of the NRMP.
Charting Outcomes in the Matchfor U.S. Allopathic Seniors, 2016
8
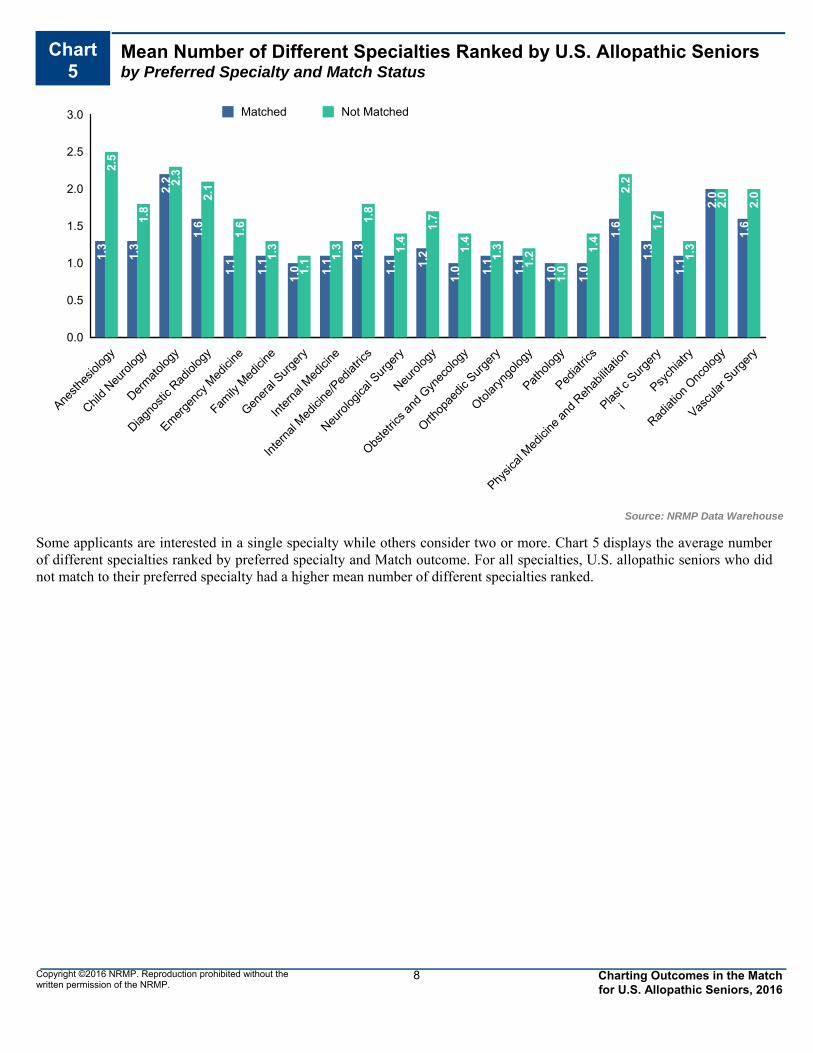
Chart5
Mean Number of Different Specialties Ranked by U.S. Allopathic Seniorsby Preferred Specialty and Match Status
0.0
0.5
1.0
1.5
2.0
2.5
3.0
Anesth
esiol
ogy
Child
Neuro
logy
Derm
atolo
gy
Diagno
stic R
adiol
ogy
Emer
genc
y Med
icine
Family
Med
icine
Gener
al Sur
gery
Inte
rnal
Med
icine
Inte
rnal
Med
icine
/Ped
iatric
s
Neuro
logica
l Sur
gery
Neuro
logy
Obste
trics
and
Gyn
ecolo
gy
Orthop
aedic
Sur
gery
Otolar
yngo
logy
Patho
logy
Pediat
rics
Physic
al M
edici
ne a
nd R
ehab
ilitat
ion
Plastic
Sur
gery
Psych
iatry
Radiat
ion O
ncolo
gy
Vascu
lar S
urge
ry
1.3
1.3
2.2
1.6
1.1
1.1
1.0 1.
1 1.3
1.1 1.
2
1.0 1.
1
1.1
1.0
1.0
1.6
1.3
1.1
2.0
1.6
2.5
1.8
2.3
2.1
1.6
1.3
1.1 1.
3
1.8
1.4
1.7
1.4
1.3
1.2
1.0
1.4
2.2
1.7
1.3
2.0
2.0
Matched Not Matched
Source: NRMP Data Warehouse
Some applicants are interested in a single specialty while others consider two or more. Chart 5 displays the average numberof different specialties ranked by preferred specialty and Match outcome. For all specialties, U.S. allopathic seniors who did not match to their preferred specialty had a higher mean number of different specialties ranked.
Copyright ©2016 NRMP. Reproduction prohibited without the written permission of the NRMP.
Charting Outcomes in the Matchfor U.S. Allopathic Seniors, 2016

9
Chart6
USMLE Step 1 Scores of U.S. Allopathic Seniorsby Preferred Specialty and Match Status
180
190
200
210
220
230
240
250
260
270
Anesth
esiol
ogy
Child
Neuro
logy
Derm
atolo
gy
Diagno
stic R
adiol
ogy
Emer
genc
y Med
icine
Family
Med
icine
Gener
al Sur
gery
Inte
rnal
Med
icine
Inte
rnal
Med
icine
/Ped
iatric
s
Neuro
logica
l Sur
gery
Neuro
logy
Obste
trics
and
Gyn
ecolo
gy
Orthop
aedic
Sur
gery
Otolar
yngo
logy
Patho
logy
Pediat
rics
Physic
al M
edici
ne a
nd R
ehab
ilitat
ion
Plastic
Sur
gery
Psych
iatry
Radiat
ion O
ncolo
gy
Vascu
lar S
urge
ry
Source: NRMP Data Warehouse
USMLE Step 1 scores are a measure of a student’s understanding of important basic science concepts and the ability to applythat knowledge to the practice of medicine. Although such knowledge is only one facet of applicant qualifications consideredby program directors in their selection process, a Step 1 score is the only qualification that is universally available for allapplicants during the interview season and prior to the NRMP’s ranking deadline. Overall, U.S. allopathic seniors who matched to their preferred specialty have mean USMLE Step 1 scores of 233.2 (s.d. = 17.4), well above the 2016 minimum passing score of 192. Step 1 scores were available for 98 percent of U.S. seniors who gave consent to research.
Chart 6 displays the Step 1 scores for U.S. allopathic seniors by specialty and Match status. The horizontal bars are themedian values for successful applicants and the vertical lines show the interquartile ranges (IQR, the range of scores for applicants excluding the top and bottom quarters of the distribution). Scores generally are higher for the more competitive specialties, but there is substantial overlap when specialties are compared.
Across all specialties, the IQR of U.S. seniors who matched to their preferred specialties was higher than those who did notmatch.
Copyright ©2016 NRMP. Reproduction prohibited without the written permission of the NRMP.
Matched Not Matched
Charting Outcomes in the Matchfor U.S. Allopathic Seniors, 2016

10
Chart7
USMLE Step 2 CK Scores of U.S. Allopathic Seniorsby Preferred Specialty and Match Status
180
190
200
210
220
230
240
250
260
270
Anesth
esiol
ogy
Child
Neuro
logy
Derm
atolo
gy
Diagno
stic R
adiol
ogy
Emer
genc
y Med
icine
Family
Med
icine
Gener
al Sur
gery
Inte
rnal
Med
icine
Inte
rnal
Med
icine
/Ped
iatric
s
Neuro
logica
l Sur
gery
Neuro
logy
Obste
trics
and
Gyn
ecolo
gy
Orthop
aedic
Sur
gery
Otolar
yngo
logy
Patho
logy
Pediat
rics
Physic
al M
edici
ne a
nd R
ehab
ilitat
ion
Plastic
Sur
gery
Psych
iatry
Radiat
ion O
ncolo
gy
Vascu
lar S
urge
ry
Source: NRMP Data Warehouse
USMLE Step 2 CK scores are a measure of an applicant's ability to apply the medical knowledge, skills, and understandingof clinical science essential for providing patient care. Overall, U.S. allopathic seniors who matched to their preferred specialty had mean USMLE Step 2 CK scores of 244.8 (s.d. = 14.9), well above the 2016 minimum passing score of 209. Step 2 CK scores were available for 96 percent of U.S. seniors who gave consent to research.
Chart 7 shows the Step 2 CK scores for U.S. seniors by preferred specialty and Match status. The horizontal bars are the median values for successful applicants and the vertical lines show the interquartile ranges. As was the case for the Step 1 scores, the more competitive specialties have higher average Step 2 CK scores, but the overall variation is smaller.
Across all specialties, the IQR of U.S. seniors who matched to their preferred specialties was higher than those who did not match.
Copyright ©2016 NRMP. Reproduction prohibited without the written permission of the NRMP.
Matched Not Matched
Charting Outcomes in the Matchfor U.S. Allopathic Seniors, 2016

11
Chart8
Mean Number of Research Experiences of U.S. Allopathic Seniorsby Preferred Specialty and Match Status
0.0
1.0
2.0
3.0
4.0
5.0
6.0
7.0
Anesth
esiol
ogy
Child
Neuro
logy
Derm
atolo
gy
Diagno
stic R
adiol
ogy
Emer
genc
y Med
icine
Family
Med
icine
Gener
al Sur
gery
Inte
rnal
Med
icine
Inte
rnal
Med
icine
/Ped
iatric
s
Neuro
logica
l Sur
gery
Neuro
logy
Obste
trics
and
Gyn
ecolo
gy
Orthop
aedic
Sur
gery
Otolar
yngo
logy
Patho
logy
Pediat
rics
Physic
al M
edici
ne a
nd R
ehab
ilitat
ion
Plastic
Sur
gery
Psych
iatry
Radiat
ion O
ncolo
gy
Vascu
lar S
urge
ry
2.7 3.
1
4.7
3.1
2.4
2.0
3.2
2.8
2.5
4.8
3.1
3.2
4.0
5.1
2.8
2.5
8.4
4.6
2.5
5.1
4.2
1.8
2.6
3.8
3.3
2.2
1.7
2.7 3.
1
2.8
4.2
1.9
2.8
3.8
4.7
2.4
2.4
2.3
4.5
2.0
3.2
3.9
Matched Not Matched
Source: NRMP Data Warehouse
Applicants were asked to report the number of research experiences entered in their Electronic Residency ApplicationService (ERAS) applications. The experiences are not verified or evaluated and quality may vary greatly. Chart 8 shows theaverage number of research experiences by preferred specialty and Match outcome. U.S. seniors averaged 3.0 research experiences, with 79.6 percent reporting this information. For all specialties except Diagnostic Radiology, InternalMedicine, and Internal Medicine/Pediatrics, matched U.S. seniors had more research experiences on average.
Copyright ©2016 NRMP. Reproduction prohibited without the written permission of the NRMP.
Charting Outcomes in the Matchfor U.S. Allopathic Seniors, 2016
0.0
4.0
8.0
12.0
16.0
20.0
24.0
Anesth
esiol
ogy
Child
Neuro
logy
Derm
atolo
gy
Diagno
stic R
adiol
ogy
Emer
genc
y Med
icine
Family
Med
icine
Gener
al Sur
gery
Inte
rnal
Med
icine
Inte
rnal
Med
icine
/Ped
iatric
s
Neuro
logica
l Sur
gery
Neuro
logy
Obste
trics
and
Gyn
ecolo
gy
Orthop
aedic
Sur
gery
Otolar
yngo
logy
Patho
logy
Pediat
rics
Physic
al M
edici
ne a
nd R
ehab
ilitat
ion
Plastic
Sur
gery
Psych
iatry
Radiat
ion O
ncolo
gy
Vascu
lar S
urge
ry
3.5
6.8
11.7
4.9
3.3
2.6
4.7
4.4
3.5
13.4
5.1
4.2
8.2
8.4
5.9
3.4 3.9
11.9
3.7
12.7
8.3
2.1 3.
6
8.7
2.7
2.2 2.6 3.
3
6.0
4.5
8.4
1.9 2.
9
4.9
6.7 7.
6
4.3
1.2
6.5
2.1
5.9 6.5
Matched Not Matched
Source: NRMP Data Warehouse
12
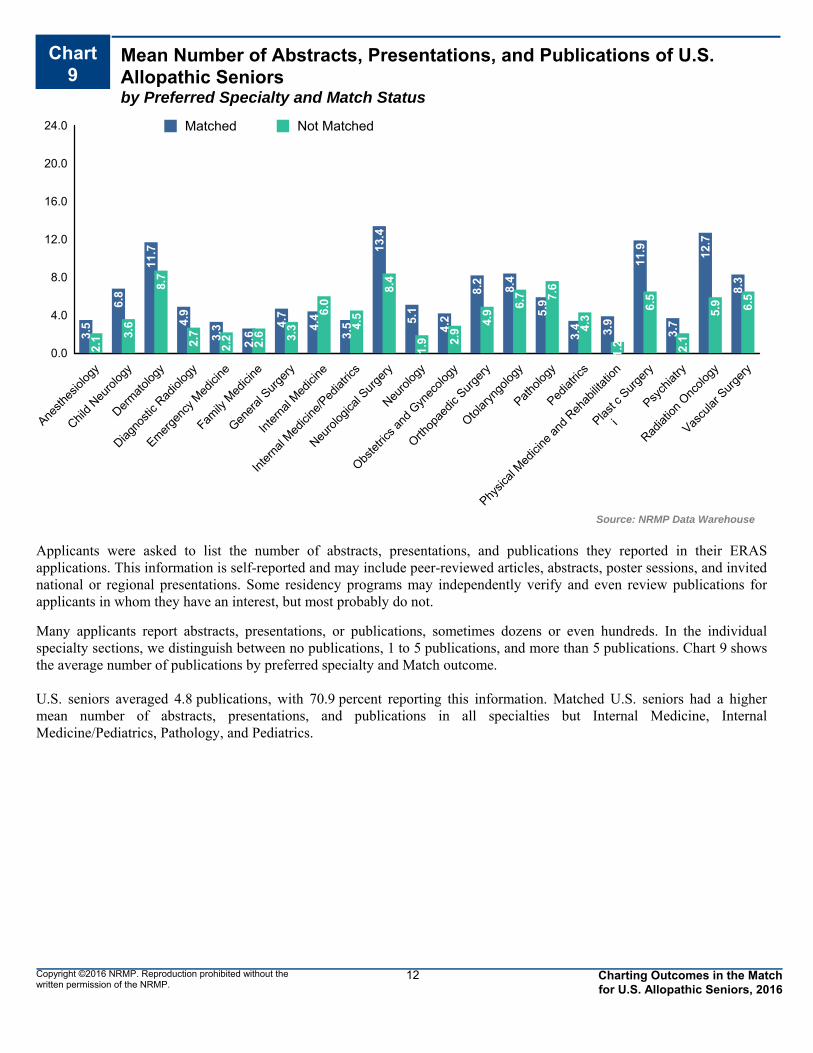
Chart9
Mean Number of Abstracts, Presentations, and Publications of U.S. Allopathic Seniorsby Preferred Specialty and Match Status
Applicants were asked to list the number of abstracts, presentations, and publications they reported in their ERASapplications. This information is self-reported and may include peer-reviewed articles, abstracts, poster sessions, and invited national or regional presentations. Some residency programs may independently verify and even review publications forapplicants in whom they have an interest, but most probably do not.
Many applicants report abstracts, presentations, or publications, sometimes dozens or even hundreds. In the individual specialty sections, we distinguish between no publications, 1 to 5 publications, and more than 5 publications. Chart 9 showsthe average number of publications by preferred specialty and Match outcome.
U.S. seniors averaged 4.8 publications, with 70.9 percent reporting this information. Matched U.S. seniors had a higher mean number of abstracts, presentations, and publications in all specialties but Internal Medicine, InternalMedicine/Pediatrics, Pathology, and Pediatrics.
Copyright ©2016 NRMP. Reproduction prohibited without the written permission of the NRMP.
Charting Outcomes in the Matchfor U.S. Allopathic Seniors, 2016

13
Chart10
Mean Number of Work Experiences of U.S. Allopathic Seniorsby Preferred Specialty and Match Status
0.0
1.0
2.0
3.0
4.0
5.0
Anesth
esiol
ogy
Child
Neuro
logy
Derm
atolo
gy
Diagno
stic R
adiol
ogy
Emer
genc
y Med
icine
Family
Med
icine
Gener
al Sur
gery
Inte
rnal
Med
icine
Inte
rnal
Med
icine
/Ped
iatric
s
Neuro
logica
l Sur
gery
Neuro
logy
Obste
trics
and
Gyn
ecolo
gy
Orthop
aedic
Sur
gery
Otolar
yngo
logy
Patho
logy
Pediat
rics
Physic
al M
edici
ne a
nd R
ehab
ilitat
ion
Plastic
Sur
gery
Psych
iatry
Radiat
ion O
ncolo
gy
Vascu
lar S
urge
ry
3.0
2.8 3.
1
2.9
3.5
4.2
3.3
2.8
3.2
2.9
2.9
3.4
3.2
3.0
3.0
3.0
3.6
3.3
3.2
2.8 3.
1
2.6
2.5
3.2
3.0
3.7
3.3
3.1
3.5
3.3
3.3
1.9
3.4
3.3
2.7
3.4
3.0 3.
2
3.1
2.8
1.7
3.1
Matched Not Matched
Source: NRMP Data Warehouse
Applicants were asked to list the number of work experiences they reported in their ERAS application. Chart 10 shows the average number of work experiences by preferred specialty and Match outcome. There is little variation across specialties or within specialties (matched or not matched) for the U.S. seniors. Three-quarters (75.8%) of U.S. seniors reported work experiences, with an average of 3.2 work experiences for all U.S. seniors. Differences in mean number of work experiences are small in most specialties.
Copyright ©2016 NRMP. Reproduction prohibited without the written permission of the NRMP.
Charting Outcomes in the Matchfor U.S. Allopathic Seniors, 2016

14
Chart11
Mean Number of Volunteer Experiences of U.S. Allopathic Seniorsby Preferred Specialty and Match Status
0.0
2.0
4.0
6.0
8.0
10.0
12.0
Anesth
esiol
ogy
Child
Neuro
logy
Derm
atolo
gy
Diagno
stic R
adiol
ogy
Emer
genc
y Med
icine
Family
Med
icine
Gener
al Sur
gery
Inte
rnal
Med
icine
Inte
rnal
Med
icine
/Ped
iatric
s
Neuro
logica
l Sur
gery
Neuro
logy
Obste
trics
and
Gyn
ecolo
gy
Orthop
aedic
Sur
gery
Otolar
yngo
logy
Patho
logy
Pediat
rics
Physic
al M
edici
ne a
nd R
ehab
ilitat
ion
Plastic
Sur
gery
Psych
iatry
Radiat
ion O
ncolo
gy
Vascu
lar S
urge
ry
6.3 7.
0
10.1
5.7
6.8 7.
4
6.8
6.3
8.0
6.2
6.1
8.0
6.7 7.
4
5.2
7.7 8.0
7.1
6.4
5.5
5.55.7
9.4
7.6
5.8 6.
2
5.8
5.9
5.6
7.3
6.0
4.1
8.3
6.7 6.9
3.6
9.6
3.9
7.6
5.1
4.9
6.3
Matched Not Matched
Source: NRMP Data Warehouse
Applicants were asked to list the number of volunteer experiences they reported in their ERAS applications. Chart 11 displays the average number of volunteer experiences by preferred specialty and Match outcome. Matched U.S. seniors in most specialties averaged more volunteer experiences when compared to unmatched seniors in the same specialties, with severalaveraging at least one more experience. U.S. seniors averaged 6.8 volunteer experiences, with 82 percent reporting at least oneexperience.
Copyright ©2016 NRMP. Reproduction prohibited without the written permission of the NRMP.
Charting Outcomes in the Matchfor U.S. Allopathic Seniors, 2016

15
Chart12
Percentage of U.S. Allopathic Seniors Who Are Members of AOAby Preferred Specialty and Match Status
0
20
40
60
80
100
Anesth
esiol
ogy
Child
Neuro
logy
Derm
atolo
gy
Diagno
stic R
adiol
ogy
Emer
genc
y Med
icine
Family
Med
icine
Gener
al Sur
gery
Inte
rnal
Med
icine
Inte
rnal
Med
icine
/Ped
iatric
s
Neuro
logica
l Sur
gery
Neuro
logy
Obste
trics
and
Gyn
ecolo
gy
Orthop
aedic
Sur
gery
Otolar
yngo
logy
Patho
logy
Pediat
rics
Physic
al M
edici
ne a
nd R
ehab
ilitat
ion
Plastic
Sur
gery
Psych
iatry
Radiat
ion O
ncolo
gy
Vascu
lar S
urge
ry
11 13
53
1813
6
17 1822
33
13 15
34
45
13 16
6
52
6
28
19
50
26
0 1 0 1 2 511
0 2
12 15
0 0 0
15
0 0
12
Matched Not Matched
Source: NRMP Data Warehouse
Membership in Alpha Omega Alpha (AOA) Honor Medical Society is an honor reserved for students with high academicachievement. AOA membership is limited to students in medical schools that sponsor an AOA chapter. Most, but not all,allopathic schools in the United States participate. An analysis of its relationship with success in the Match is limited by therelatively small number of applicants who are members, by the fact that some schools do not have AOA chapters, and by thefact that other schools elect AOA members too late in the academic year for it to be considered in the application process.
Data on AOA membership are self-reported. Overall, 16.9 percent of U.S. seniors included in this report claimed AOAmembership. Among applicants who matched to their preferred specialty, 17.5 percent reported AOA membership,compared to 12.6 percent of unmatched applicants.
As with several of the other measures, the most competitive specialties are able to attract the greatest proportion of AOAmembers. All specialties attract some AOA applicants, but for most specialties AOA members account for fewer than one infour successful applicants.
Copyright ©2016 NRMP. Reproduction prohibited without the written permission of the NRMP.
Charting Outcomes in the Matchfor U.S. Allopathic Seniors, 2016

16
Chart13
Percentage of U.S. Allopathic Seniors Graduating from One of the 40 U.S. Medical Schools with the Highest NIH Funding*by Preferred Specialty and Match Status
0
10
20
30
40
50
27
46
42
29 3
1
30
30
34
31
47
34
31
36
40
38
29
26
37
29
42
30
23
33
17
22 23
19
19
16
39
28
0
30
23
36
13
24
9
33
15
43
47
Anesth
esiol
ogy
Child
Neuro
logy
Derm
atolo
gy
Diagno
stic R
adiol
ogy
Emer
genc
y Med
icine
Family
Med
icine
Gener
al Sur
gery
Inte
rnal
Med
icine
Inte
rnal
Med
icine
/Ped
iatric
s
Neuro
logica
l Sur
gery
Neuro
logy
Obste
trics
and
Gyn
ecolo
gy
Orthop
aedic
Sur
gery
Otolar
yngo
logy
Patho
logy
Pediat
rics
Physic
al M
edici
ne a
nd R
ehab
ilitat
ion
Plastic
Sur
gery
Psych
iatry
Radiat
ion O
ncolo
gy
Vascu
lar S
urge
ry
Matched Not Matched
Source: NRMP Data Warehouse
Some program directors may give preference to applicants with research experience or who graduated from aresearch-intensive medical school. To test that assumption, we obtained data on the amount of NIH grant awards andidentified the 40 schools with the highest NIH funding. This measure, by definition, is limited to students of U.S. medical schools. Overall, 32.6 percent of matched and 26.7 percent of unmatched U.S. seniors were graduates of one of the 40 medical schools with the highest NIH funding.
Chart 13 shows the percentage of U.S. allopathic seniors who graduated from those schools by specialty and Match outcome. For example, 27 percent of U.S. seniors who matched in Anesthesiology were graduates of one of the 40 medical schools with the highest NIH funding, and 23 percent of seniors who did not match in Anesthesiology were graduates of those schools.
Neurological Surgery had the highest percentage of matched U.S. seniors who were graduates of a medical school with the highest NIH funding. Radiation Oncology, Child Neurology, Dermatology, and Otolaryngology also had higher percentages of matched applicants from those schools compared to the other specialties. For all specialties except Internal Medicine/Pediatrics, and Vascular Surgery, smaller percentages of seniors who did not match to their preferred specialty were graduates of a medical school with the highest NIH funding compared to seniors who matched.
*NIH funding information was obtained from NIH website: http://report.nih.gov/award/index.cfm.
Copyright ©2016 NRMP. Reproduction prohibited without the written permission of the NRMP.
Charting Outcomes in the Matchfor U.S. Allopathic Seniors, 2016

17
Chart 14 shows by preferred specialty and Match status the percentage of U.S. allopathic seniors who have a Ph.D. and/or other graduate degrees. Radiation Oncology, Pathology, and Child Neurology had the highest percentages of matched U.S. seniors with a Ph.D. degree. For most specialties, the percentage of unmatched U.S. seniors who have other graduate degrees was higher than that of their matched counterparts.
Chart14
Percentage of U.S. Allopathic Seniors Who Have a Graduate Degreeby Preferred Specialty and Match Status
0
20
40
60
80
100
Anesth
esiol
ogy
Child
Neuro
logy
Derm
atolo
gy
Diagno
stic R
adiol
ogy
Emer
genc
y Med
icine
Family
Med
icine
Gener
al Sur
gery
Inte
rnal
Med
icine
Inte
rnal
Med
icine
/Ped
iatric
s
Neuro
logica
l Sur
gery
Neuro
logy
Obste
trics
and
Gyn
ecolo
gy
Orthop
aedic
Sur
gery
Otolar
yngo
logy
Patho
logy
Pediat
rics
Physic
al M
edici
ne a
nd R
ehab
ilitat
ion
Plastic
Sur
gery
Psych
iatry
Radiat
ion O
ncolo
gy
Vascu
lar S
urge
ry
316
8 5 1 1 1 5 210 10
2 2 3
22
3 2 3 4
25
20
40
211
3 4 3 8 3 70 0 3 3
205 0 5 0 0
7
Matched Not Matched
0
20
40
60
80
100
Anesth
esiol
ogy
Child
Neuro
logy
Derm
atolo
gy
Diagno
stic R
adiol
ogy
Emer
genc
y Med
icine
Family
Med
icine
Gener
al Sur
gery
Inte
rnal
Med
icine
Inte
rnal
Med
icine
/Ped
iatric
s
Neuro
logica
l Sur
gery
Neuro
logy
Obste
trics
and
Gyn
ecolo
gy
Orthop
aedic
Sur
gery
Otolar
yngo
logy
Patho
logy
Pediat
rics
Physic
al M
edici
ne a
nd R
ehab
ilitat
ion
Plastic
Sur
gery
Psych
iatry
Radiat
ion O
ncolo
gy
Vascu
lar S
urge
ry
15 18 13 15 18 19 18 18 20 23 18 16 17 11 16 14 16 21 20 17 242940
1633
25 25 1931
18 23
0
23 18 21 2030
143
170
19
Matched Not Matched
Source: NRMP Data Warehouse
Ph.D.
Other Graduate Degrees
Copyright ©2016 NRMP. Reproduction prohibited without the written permission of the NRMP.
Charting Outcomes in the Matchfor U.S. Allopathic Seniors, 2016

AN Anesthesiology
Copyright ©2016 NRMP. Reproduction prohibited without the written permission of the NRMP.
18 Charting Outcomes in the Matchfor U.S. Allopathic Seniors, 2016

Table AN-1
Summary Statistics on U.S. Allopathic SeniorsAnesthesiology
Measure (n=965) (n=22)
Matched Unmatched
14.7 3.8Mean number of contiguous ranks1.
1.3 2.5Mean number of distinct specialties ranked2.
232 209Mean USMLE Step 1 score3.
242 224Mean USMLE Step 2 score4.
2.7 1.8Mean number of research experiences5.
3.5 2.1Mean number of abstracts, presentations, and publications6.
3.0 2.6Mean number of work experiences7.
6.3 5.7Mean number of volunteer experiences8.
10.6 4.5Percentage who are AOA members9.
26.7 22.7Percentage who graduated from one of the 40 U.S. medical schools with the highest NIH funding
10.
2.9 0.0Percentage who have Ph.D. degree11.
15.2 28.6Percentage who have another graduate degree12.
Note: Only U.S. allopathic seniors who gave consent to use their information in research are included. Sources. NRMP Data Warehouse; Top 40 U.S. medical schools with the highest NIH funding in measure 10 is from the NIH website (http://report.nih.gov/award/index.cfm).
Copyright ©2016 NRMP. Reproduction prohibited without the written permission of the NRMP.
19 Charting Outcomes in the Matchfor U.S. Allopathic Seniors, 2016

0
100
200
300
400
500
600
700
800
1 2 3 4 or More
726
159
7084 7 10 0
Matched Not Matched
Distinct Specialties Ranked
Nu
mb
er o
f A
pp
lican
ts
0
50
100
150
200
250
300
350
400
450
1 2 3 4 5 6 7 8 9 10 11 12 13 14 15 16 orMore
9 17 13 12 24 15 29 29 45 48 55 61 55 63 54
436
6 4 4 3 2 0 0 0 0 0 1 2 0 0 0 0
Matched Not Matched
Contiguous Ranks
Nu
mb
er o
f A
pp
lican
ts
Chart AN-2
Number of Contiguous Ranks of U.S. Allopathic SeniorsAnesthesiology
Source: NRMP Data Warehouse
Copyright ©2016 NRMP. Reproduction prohibited without the written permission of the NRMP.
20
Chart AN-1
Number of Distinct Specialties Ranked by U.S. Allopathic SeniorsAnesthesiology
Charting Outcomes in the Match for U.S. Allopathic Seniors, 2016

Probability of U.S. Allopathic Seniors Matching to Preferred Specialty by Number of Contiguous RanksAnesthesiology
Graph AN-1
0.00
0.10
0.20
0.30
0.40
0.50
0.60
0.70
0.80
0.90
1.00
0 1 2 3 4 5 6 7 8 9 10 11 12 13 14 15 16 17 18 19 20
Number of Contiguous Ranks
Probability of Matching
Source: NRMP Data Warehouse. Note: Probabilities calculated based on 2014-2016 applicants
21Copyright ©2016 NRMP. Reproduction prohibited without the written permission of the NRMP. Charting Outcomes in the Match for U.S. Allopathic Seniors, 2016

Chart AN-3
USMLE Step 1 Scores of U.S. Allopathic SeniorsAnesthesiology
0
40
80
120
160
200
240
<= 180 Between 181and 190
Between 191and 200
Between 201and 210
Between 211and 220
Between 221and 230
Between 231and 240
Between 241and 250
Between 251and 260
>260 ScoreUnknown
0 520
56
134
231221
185
86
17 100 0 8 6 4 0 3 0 1 0 0
Matched Not Matched
Step 1 Scores
Nu
mb
er
of
Ap
pli
ca
nts
Source: NRMP Data Warehouse
22Copyright ©2016 NRMP. Reproduction prohibited without the written permission of the NRMP.
Chart AN-4
USMLE Step 2 CK Scores of U.S. Allopathic SeniorsAnesthesiology
0
40
80
120
160
200
240
280
<= 180 Between 181and 190
Between 191and 200
Between 201and 210
Between 211and 220
Between 221and 230
Between 231and 240
Between 241and 250
Between 251and 260
>260 ScoreUnknown
0 0 0 7
53
137
214
241
197
83
33
0 0 0 3 5 7 6 0 1 0 0
Matched Not Matched
Step 2 CK Scores
Nu
mb
er o
f A
pp
lican
ts
Charting Outcomes in the Match for U.S. Allopathic Seniors, 2016

Graph AN-2
Probability of U.S. Allopathic Seniors Matching to Preferred Specialty by USMLE Step 1 ScoreAnesthesiology
0.00
0.10
0.20
0.30
0.40
0.50
0.60
0.70
0.80
0.90
1.00
180 200 220 240 260 280
Step 1 Score
Probability of Matching
Source: NRMP Data Warehouse. Note: Probabilities calculated based on 2014-2016 applicants.
23Copyright ©2016 NRMP. Reproduction prohibited without the written permission of the NRMP. Charting Outcomes in the Match for U.S. Allopathic Seniors, 2016

0
50
100
150
200
250
300
350
None 1 2 3 4 5 or More
160 157
128110
75
335
9 1 3 2 1 6
Matched Not Matched
Publications
Nu
mb
er o
f A
pp
lican
ts
0
40
80
120
160
200
240
None 1 2 3 4 5 or More
67
146
215
180
119
238
4 5 1 6 2 4
Matched Not Matched
Research Projects
Nu
mb
er o
f A
pp
lican
tsChart AN-5
Number of Research Projects of U.S. Allopathic SeniorsAnesthesiology
Source: NRMP Data Warehouse
24Copyright ©2016 NRMP. Reproduction prohibited without the written permission of the NRMP.
Chart AN-6
Number of Abstracts, Presentations, and Publications of U.S. Allopathic SeniorsAnesthesiology
Charting Outcomes in the Match for U.S. Allopathic Seniors, 2016

0
40
80
120
160
200
240
280
320
None 1 2 3 4 5 6 7 8 9 10 or More
628
51
95117 125
92
56 51 42
302
0 0 4 0 3 4 1 0 2 1 7
Matched Not Matched
Volunteer Experiences
Nu
mb
er o
f A
pp
lican
ts
0
50
100
150
200
250
300
350
None 1 2 3 4 5 or More
69
142
177160
104
313
2 1 6 4 3 6
Matched Not Matched
Work Experiences
Nu
mb
er o
f A
pp
lican
tsChart AN-7
Number of Work Experiences of U.S. Allopathic SeniorsAnesthesiology
Source: NRMP Data Warehouse
25Copyright ©2016 NRMP. Reproduction prohibited without the written permission of the NRMP.
Chart AN-8
Number of Volunteer Experiences of U.S. Allopathic SeniorsAnesthesiology
Charting Outcomes in the Match for U.S. Allopathic Seniors, 2016

Chart AN-9
Other Characteristics of U.S. SeniorsAnesthesiology
Charting Outcomes in the Match for U.S. Allopathic Seniors, 2016 Copyright ©2016 NRMP. Reproduction prohibited without the written permission of the NRMP.
Source: NRMP Data Warehouse. Top 40 U.S. medical schools with the highest NIH funding from NIH: http://report.nih.gov/award/index.cfm
26
0
100
200
300
400
500
600
700
800
Yes No
102
791
1 20
Nu
mb
er
of
Ap
pli
ca
nts
AOA Membership
0
100
200
300
400
500
600
700
800
Yes No
258
707
5 17
Nu
mb
er o
f A
pp
lican
ts
Graduate of One of the 40 U.S. MedicalSchools with the Highest NIH Funding
0
200
400
600
800
1,000
Yes No
26
939
0 22
Nu
mb
er o
f A
pp
lican
ts
Ph.D. Degree
0
200
400
600
800
1,000
Yes No
136
829
6 16
Nu
mb
er o
f A
pp
lican
ts
Other Graduate Degree
Matched Not Matched

CN Child Neurology
Copyright ©2016 NRMP. Reproduction prohibited without the written permission of the NRMP.
27 Charting Outcomes in the Matchfor U.S. Allopathic Seniors, 2016

Table CN-1
Summary Statistics on U.S. Allopathic SeniorsChild Neurology
Measure (n=89) (n=6)
Matched Unmatched
10.7 3.8Mean number of contiguous ranks1.
1.3 1.8Mean number of distinct specialties ranked2.
229 213Mean USMLE Step 1 score3.
242 230Mean USMLE Step 2 score4.
3.1 2.6Mean number of research experiences5.
6.8 3.6Mean number of abstracts, presentations, and publications6.
2.8 2.5Mean number of work experiences7.
7.0 9.4Mean number of volunteer experiences8.
13.5 0.0Percentage who are AOA members9.
46.1 33.3Percentage who graduated from one of the 40 U.S. medical schools with the highest NIH funding
10.
15.7 40.0Percentage who have Ph.D. degree11.
17.5 40.0Percentage who have another graduate degree12.
Note: Only U.S. allopathic seniors who gave consent to use their information in research are included. Sources. NRMP Data Warehouse; Top 40 U.S. medical schools with the highest NIH funding in measure 10 is from the NIH website (http://report.nih.gov/award/index.cfm).
Copyright ©2016 NRMP. Reproduction prohibited without the written permission of the NRMP.
28 Charting Outcomes in the Matchfor U.S. Allopathic Seniors, 2016

0
10
20
30
40
50
60
70
1 2 3 4 or More
67
21
1 015
0 0
Matched Not Matched
Distinct Specialties Ranked
Nu
mb
er o
f A
pp
lican
ts
0
2
4
6
8
10
12
1 2 3 4 5 6 7 8 9 10 11 12 13 14 15 16 orMore
21 1
32 2
4
78
12
10
12
5
7
4
9
21 1
0 0 01
01
0 0 0 0 0 0 0
Matched Not Matched
Contiguous Ranks
Nu
mb
er o
f A
pp
lican
ts
Chart CN-2
Number of Contiguous Ranks of U.S. Allopathic SeniorsChild Neurology
Source: NRMP Data Warehouse
Copyright ©2016 NRMP. Reproduction prohibited without the written permission of the NRMP.
29
Chart CN-1
Number of Distinct Specialties Ranked by U.S. Allopathic SeniorsChild Neurology
Charting Outcomes in the Match for U.S. Allopathic Seniors, 2016
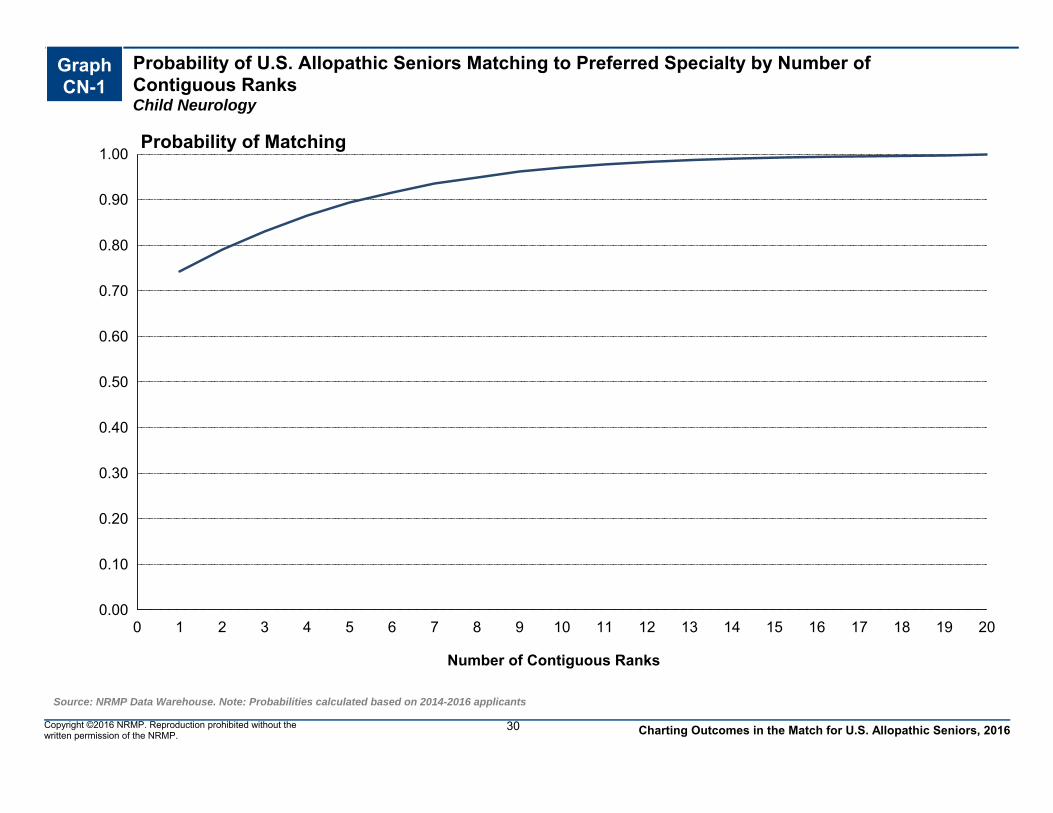
Probability of U.S. Allopathic Seniors Matching to Preferred Specialty by Number of Contiguous RanksChild Neurology
Graph CN-1
0.00
0.10
0.20
0.30
0.40
0.50
0.60
0.70
0.80
0.90
1.00
0 1 2 3 4 5 6 7 8 9 10 11 12 13 14 15 16 17 18 19 20
Number of Contiguous Ranks
Probability of Matching
Source: NRMP Data Warehouse. Note: Probabilities calculated based on 2014-2016 applicants
30Copyright ©2016 NRMP. Reproduction prohibited without the written permission of the NRMP. Charting Outcomes in the Match for U.S. Allopathic Seniors, 2016

Chart CN-3
USMLE Step 1 Scores of U.S. Allopathic SeniorsChild Neurology
0
4
8
12
16
20
24
<= 180 Between 181and 190
Between 191and 200
Between 201and 210
Between 211and 220
Between 221and 230
Between 231and 240
Between 241and 250
Between 251and 260
>260 ScoreUnknown
0 0
3
9
15
1921
12
4 42
0 01
21
01
0 0 01
Matched Not Matched
Step 1 Scores
Nu
mb
er
of
Ap
pli
ca
nts
Source: NRMP Data Warehouse
31Copyright ©2016 NRMP. Reproduction prohibited without the written permission of the NRMP.
Chart CN-4
USMLE Step 2 CK Scores of U.S. Allopathic SeniorsChild Neurology
0
4
8
12
16
20
<= 180 Between 181and 190
Between 191and 200
Between 201and 210
Between 211and 220
Between 221and 230
Between 231and 240
Between 241and 250
Between 251and 260
>260 ScoreUnknown
0 0 0 0
7
11
1920
16
11
5
0 0 0 01 1
3
0 0 01
Matched Not Matched
Step 2 CK Scores
Nu
mb
er o
f A
pp
lican
ts
Charting Outcomes in the Match for U.S. Allopathic Seniors, 2016

Graph CN-2
Probability of U.S. Allopathic Seniors Matching to Preferred Specialty by USMLE Step 1 ScoreChild Neurology
0.00
0.10
0.20
0.30
0.40
0.50
0.60
0.70
0.80
0.90
1.00
180 200 220 240 260 280
Step 1 Score
Probability of Matching
Source: NRMP Data Warehouse. Note: Probabilities calculated based on 2014-2016 applicants.
32Copyright ©2016 NRMP. Reproduction prohibited without the written permission of the NRMP. Charting Outcomes in the Match for U.S. Allopathic Seniors, 2016

0
10
20
30
40
50
None 1 2 3 4 5 or More
46
14
96
50
0 1 02
03
Matched Not Matched
Publications
Nu
mb
er o
f A
pp
lican
ts
0
4
8
12
16
20
24
28
None 1 2 3 4 5 or More
1
6
25
18
11
28
0 02
3
01
Matched Not Matched
Research Projects
Nu
mb
er o
f A
pp
lican
tsChart CN-5
Number of Research Projects of U.S. Allopathic SeniorsChild Neurology
Source: NRMP Data Warehouse
33Copyright ©2016 NRMP. Reproduction prohibited without the written permission of the NRMP.
Chart CN-6
Number of Abstracts, Presentations, and Publications of U.S. Allopathic SeniorsChild Neurology
Charting Outcomes in the Match for U.S. Allopathic Seniors, 2016

0
5
10
15
20
25
30
35
None 1 2 3 4 5 6 7 8 9 10 or More
2 1 1
7
4
11
5
11
5
9
33
0 02
0 0 0 0 0 1 0
3
Matched Not Matched
Volunteer Experiences
Nu
mb
er o
f A
pp
lican
ts
0
5
10
15
20
25
30
35
None 1 2 3 4 5 or More
6
13
1715
7
31
0 1 20 0
3
Matched Not Matched
Work Experiences
Nu
mb
er o
f A
pp
lican
tsChart CN-7
Number of Work Experiences of U.S. Allopathic SeniorsChild Neurology
Source: NRMP Data Warehouse
34Copyright ©2016 NRMP. Reproduction prohibited without the written permission of the NRMP.
Chart CN-8
Number of Volunteer Experiences of U.S. Allopathic SeniorsChild Neurology
Charting Outcomes in the Match for U.S. Allopathic Seniors, 2016

Chart CN-9
Other Characteristics of U.S. SeniorsChild Neurology
Charting Outcomes in the Match for U.S. Allopathic Seniors, 2016 Copyright ©2016 NRMP. Reproduction prohibited without the written permission of the NRMP.
Source: NRMP Data Warehouse. Top 40 U.S. medical schools with the highest NIH funding from NIH: http://report.nih.gov/award/index.cfm
35
0
10
20
30
40
50
60
70
80
Yes No
12
71
05
Nu
mb
er
of
Ap
pli
ca
nts
AOA Membership
0
10
20
30
40
50
Yes No
41
48
24
Nu
mb
er o
f A
pp
lican
ts
Graduate of One of the 40 U.S. MedicalSchools with the Highest NIH Funding
0
10
20
30
40
50
60
70
80
Yes No
13
76
2 4
Nu
mb
er o
f A
pp
lican
ts
Ph.D. Degree
0
10
20
30
40
50
60
70
80
Yes No
14
75
2 4
Nu
mb
er o
f A
pp
lican
ts
Other Graduate Degree
Matched Not Matched

DM Dermatology
Copyright ©2016 NRMP. Reproduction prohibited without the written permission of the NRMP.
36 Charting Outcomes in the Matchfor U.S. Allopathic Seniors, 2016

Table DM-1
Summary Statistics on U.S. Allopathic SeniorsDermatology
Measure (n=339) (n=93)
Matched Unmatched
8.9 4.2Mean number of contiguous ranks1.
2.2 2.3Mean number of distinct specialties ranked2.
249 239Mean USMLE Step 1 score3.
257 246Mean USMLE Step 2 score4.
4.7 3.8Mean number of research experiences5.
11.7 8.7Mean number of abstracts, presentations, and publications6.
3.1 3.2Mean number of work experiences7.
10.1 7.6Mean number of volunteer experiences8.
52.8 25.8Percentage who are AOA members9.
41.9 17.2Percentage who graduated from one of the 40 U.S. medical schools with the highest NIH funding
10.
8.0 2.4Percentage who have Ph.D. degree11.
12.8 15.7Percentage who have another graduate degree12.
Note: Only U.S. allopathic seniors who gave consent to use their information in research are included. Sources. NRMP Data Warehouse; Top 40 U.S. medical schools with the highest NIH funding in measure 10 is from the NIH website (http://report.nih.gov/award/index.cfm).
Copyright ©2016 NRMP. Reproduction prohibited without the written permission of the NRMP.
37 Charting Outcomes in the Matchfor U.S. Allopathic Seniors, 2016

0
20
40
60
80
100
120
140
160
1 2 3 4 or More
74
144
106
1516
38 33
5
Matched Not Matched
Distinct Specialties Ranked
Nu
mb
er o
f A
pp
lican
ts
0
5
10
15
20
25
30
35
40
1 2 3 4 5 6 7 8 9 10 11 12 13 14 15 16 orMore
7 8
2119
16
3836
32
26
2124
15
24
16
10
26
14 1518
16
7
3
86
30 0 1 0
20 0
Matched Not Matched
Contiguous Ranks
Nu
mb
er o
f A
pp
lican
ts
Chart DM-2
Number of Contiguous Ranks of U.S. Allopathic SeniorsDermatology
Source: NRMP Data Warehouse
Copyright ©2016 NRMP. Reproduction prohibited without the written permission of the NRMP.
38
Chart DM-1
Number of Distinct Specialties Ranked by U.S. Allopathic SeniorsDermatology
Charting Outcomes in the Match for U.S. Allopathic Seniors, 2016

Probability of U.S. Allopathic Seniors Matching to Preferred Specialty by Number of Contiguous RanksDermatology
Graph DM-1
0.00
0.10
0.20
0.30
0.40
0.50
0.60
0.70
0.80
0.90
1.00
0 1 2 3 4 5 6 7 8 9 10 11 12 13 14 15 16 17 18 19 20
Number of Contiguous Ranks
Probability of Matching
Source: NRMP Data Warehouse. Note: Probabilities calculated based on 2014-2016 applicants
39Copyright ©2016 NRMP. Reproduction prohibited without the written permission of the NRMP. Charting Outcomes in the Match for U.S. Allopathic Seniors, 2016

Chart DM-3
USMLE Step 1 Scores of U.S. Allopathic SeniorsDermatology
0
20
40
60
80
100
120
140
<= 180 Between 181and 190
Between 191and 200
Between 201and 210
Between 211and 220
Between 221and 230
Between 231and 240
Between 241and 250
Between 251and 260
>260 ScoreUnknown
0 0 1 4 313
36
106
128
43
50 1 2 4 6 7
2129
20
2 1
Matched Not Matched
Step 1 Scores
Nu
mb
er
of
Ap
pli
ca
nts
Source: NRMP Data Warehouse
40Copyright ©2016 NRMP. Reproduction prohibited without the written permission of the NRMP.
Chart DM-4
USMLE Step 2 CK Scores of U.S. Allopathic SeniorsDermatology
0
20
40
60
80
100
120
140
<= 180 Between 181and 190
Between 191and 200
Between 201and 210
Between 211and 220
Between 221and 230
Between 231and 240
Between 241and 250
Between 251and 260
>260 ScoreUnknown
0 0 0 0 3 4
21
51
120126
14
0 0 1 0 212 13
23 2315
4
Matched Not Matched
Step 2 CK Scores
Nu
mb
er o
f A
pp
lican
ts
Charting Outcomes in the Match for U.S. Allopathic Seniors, 2016

Graph DM-2
Probability of U.S. Allopathic Seniors Matching to Preferred Specialty by USMLE Step 1 ScoreDermatology
0.00
0.10
0.20
0.30
0.40
0.50
0.60
0.70
0.80
0.90
1.00
180 200 220 240 260 280
Step 1 Score
Probability of Matching
Source: NRMP Data Warehouse. Note: Probabilities calculated based on 2014-2016 applicants.
41Copyright ©2016 NRMP. Reproduction prohibited without the written permission of the NRMP. Charting Outcomes in the Match for U.S. Allopathic Seniors, 2016

0
40
80
120
160
200
240
280
320
None 1 2 3 4 5 or More
3 10 9 15 13
289
3 7 10 8 4
61
Matched Not Matched
Publications
Nu
mb
er o
f A
pp
lican
ts
0
40
80
120
160
200
None 1 2 3 4 5 or More
514
3247
55
186
310 12 13 11
44
Matched Not Matched
Research Projects
Nu
mb
er o
f A
pp
lican
tsChart DM-5
Number of Research Projects of U.S. Allopathic SeniorsDermatology
Source: NRMP Data Warehouse
42Copyright ©2016 NRMP. Reproduction prohibited without the written permission of the NRMP.
Chart DM-6
Number of Abstracts, Presentations, and Publications of U.S. Allopathic SeniorsDermatology
Charting Outcomes in the Match for U.S. Allopathic Seniors, 2016

0
20
40
60
80
100
120
140
160
180
None 1 2 3 4 5 6 7 8 9 10 or More
0 2 5 917
42
23 21
3623
161
0 08 8 7 5 9 9 4 3
40
Matched Not Matched
Volunteer Experiences
Nu
mb
er o
f A
pp
lican
ts
0
20
40
60
80
100
120
140
None 1 2 3 4 5 or More
29
4149 48
43
129
312 14 14 18
32
Matched Not Matched
Work Experiences
Nu
mb
er o
f A
pp
lican
tsChart DM-7
Number of Work Experiences of U.S. Allopathic SeniorsDermatology
Source: NRMP Data Warehouse
43Copyright ©2016 NRMP. Reproduction prohibited without the written permission of the NRMP.
Chart DM-8
Number of Volunteer Experiences of U.S. Allopathic SeniorsDermatology
Charting Outcomes in the Match for U.S. Allopathic Seniors, 2016

Chart DM-9
Other Characteristics of U.S. SeniorsDermatology
Charting Outcomes in the Match for U.S. Allopathic Seniors, 2016 Copyright ©2016 NRMP. Reproduction prohibited without the written permission of the NRMP.
Source: NRMP Data Warehouse. Top 40 U.S. medical schools with the highest NIH funding from NIH: http://report.nih.gov/award/index.cfm
44
20
40
60
80
100
120
140
160
180
Yes No
179
136
24
61
Nu
mb
er
of
Ap
pli
ca
nts
AOA Membership
0
40
80
120
160
200
Yes No
142
197
16
77
Nu
mb
er o
f A
pp
lican
ts
Graduate of One of the 40 U.S. MedicalSchools with the Highest NIH Funding
0
50
100
150
200
250
300
350
Yes No
25
314
2
91
Nu
mb
er o
f A
pp
lican
ts
Ph.D. Degree
0
40
80
120
160
200
240
280
320
Yes No
40
299
13
80
Nu
mb
er o
f A
pp
lican
ts
Other Graduate Degree
Matched Not Matched

DR Diagnostic Radiology
Copyright ©2016 NRMP. Reproduction prohibited without the written permission of the NRMP.
45 Charting Outcomes in the Matchfor U.S. Allopathic Seniors, 2016

Table DR-1
Summary Statistics on U.S. Allopathic SeniorsDiagnostic Radiology
Measure (n=652) (n=9)
Matched Unmatched
12.2 4.3Mean number of contiguous ranks1.
1.6 2.1Mean number of distinct specialties ranked2.
240 221Mean USMLE Step 1 score3.
247 229Mean USMLE Step 2 score4.
3.1 3.3Mean number of research experiences5.
4.9 2.7Mean number of abstracts, presentations, and publications6.
2.9 3.0Mean number of work experiences7.
5.7 5.8Mean number of volunteer experiences8.
18.4 0.0Percentage who are AOA members9.
29.3 22.2Percentage who graduated from one of the 40 U.S. medical schools with the highest NIH funding
10.
5.0 11.1Percentage who have Ph.D. degree11.
15.4 33.3Percentage who have another graduate degree12.
Note: Only U.S. allopathic seniors who gave consent to use their information in research are included. Sources. NRMP Data Warehouse; Top 40 U.S. medical schools with the highest NIH funding in measure 10 is from the NIH website (http://report.nih.gov/award/index.cfm).
Copyright ©2016 NRMP. Reproduction prohibited without the written permission of the NRMP.
46 Charting Outcomes in the Matchfor U.S. Allopathic Seniors, 2016

0
50
100
150
200
250
300
350
400
450
1 2 3 4 or More
417
136
78
153 4 1 0
Matched Not Matched
Distinct Specialties Ranked
Nu
mb
er o
f A
pp
lican
ts
0
20
40
60
80
100
120
140
160
180
1 2 3 4 5 6 7 8 9 10 11 12 13 14 15 16 orMore
2711 14 16 20 13 17
2837
4739
51 4959
47
177
4 1 0 0 0 1 1 1 0 0 0 1 0 0 0 0
Matched Not Matched
Contiguous Ranks
Nu
mb
er o
f A
pp
lican
ts
Chart DR-2
Number of Contiguous Ranks of U.S. Allopathic SeniorsDiagnostic Radiology
Source: NRMP Data Warehouse
Copyright ©2016 NRMP. Reproduction prohibited without the written permission of the NRMP.
47
Chart DR-1
Number of Distinct Specialties Ranked by U.S. Allopathic SeniorsDiagnostic Radiology
Charting Outcomes in the Match for U.S. Allopathic Seniors, 2016

Probability of U.S. Allopathic Seniors Matching to Preferred Specialty by Number of Contiguous RanksDiagnostic Radiology
Graph DR-1
0.00
0.10
0.20
0.30
0.40
0.50
0.60
0.70
0.80
0.90
1.00
0 1 2 3 4 5 6 7 8 9 10 11 12 13 14 15 16 17 18 19 20
Number of Contiguous Ranks
Probability of Matching
Source: NRMP Data Warehouse. Note: Probabilities calculated based on 2014-2016 applicants
48Copyright ©2016 NRMP. Reproduction prohibited without the written permission of the NRMP. Charting Outcomes in the Match for U.S. Allopathic Seniors, 2016

Chart DR-3
USMLE Step 1 Scores of U.S. Allopathic SeniorsDiagnostic Radiology
0
20
40
60
80
100
120
140
160
180
<= 180 Between 181and 190
Between 191and 200
Between 201and 210
Between 211and 220
Between 221and 230
Between 231and 240
Between 241and 250
Between 251and 260
>260 ScoreUnknown
0 1 724
40
88
148
170
138
30
60 0 1 2 2 1 1 1 1 0 0
Matched Not Matched
Step 1 Scores
Nu
mb
er
of
Ap
pli
ca
nts
Source: NRMP Data Warehouse
49Copyright ©2016 NRMP. Reproduction prohibited without the written permission of the NRMP.
Chart DR-4
USMLE Step 2 CK Scores of U.S. Allopathic SeniorsDiagnostic Radiology
0
20
40
60
80
100
120
140
160
180
<= 180 Between 181and 190
Between 191and 200
Between 201and 210
Between 211and 220
Between 221and 230
Between 231and 240
Between 241and 250
Between 251and 260
>260 ScoreUnknown
0 0 0 2
23
62
119
156165
97
28
0 0 0 0 2 2 4 1 0 0 0
Matched Not Matched
Step 2 CK Scores
Nu
mb
er o
f A
pp
lican
ts
Charting Outcomes in the Match for U.S. Allopathic Seniors, 2016

Graph DR-2
Probability of U.S. Allopathic Seniors Matching to Preferred Specialty by USMLE Step 1 ScoreDiagnostic Radiology
0.00
0.10
0.20
0.30
0.40
0.50
0.60
0.70
0.80
0.90
1.00
190 200 210 220 230 240 250 260 270
Step 1 Score
Probability of Matching
Source: NRMP Data Warehouse. Note: Probabilities calculated based on 2014-2016 applicants.
50Copyright ©2016 NRMP. Reproduction prohibited without the written permission of the NRMP. Charting Outcomes in the Match for U.S. Allopathic Seniors, 2016

0
40
80
120
160
200
240
280
320
None 1 2 3 4 5 or More
65
91
6484
44
304
0 2 2 2 3 0
Matched Not Matched
Publications
Nu
mb
er o
f A
pp
lican
ts
0
40
80
120
160
200
None 1 2 3 4 5 or More
20
81
129139
90
193
0 1 1 4 2 1
Matched Not Matched
Research Projects
Nu
mb
er o
f A
pp
lican
tsChart DR-5
Number of Research Projects of U.S. Allopathic SeniorsDiagnostic Radiology
Source: NRMP Data Warehouse
51Copyright ©2016 NRMP. Reproduction prohibited without the written permission of the NRMP.
Chart DR-6
Number of Abstracts, Presentations, and Publications of U.S. Allopathic SeniorsDiagnostic Radiology
Charting Outcomes in the Match for U.S. Allopathic Seniors, 2016

0
20
40
60
80
100
120
140
160
180
None 1 2 3 4 5 6 7 8 9 10 or More
6
26
56
78 75 72
5647
40
23
173
0 0 0 1 2 2 1 2 0 0 1
Matched Not Matched
Volunteer Experiences
Nu
mb
er o
f A
pp
lican
ts
0
40
80
120
160
200
None 1 2 3 4 5 or More
40
109125
113
74
191
1 0 3 1 3 1
Matched Not Matched
Work Experiences
Nu
mb
er o
f A
pp
lican
tsChart DR-7
Number of Work Experiences of U.S. Allopathic SeniorsDiagnostic Radiology
Source: NRMP Data Warehouse
52Copyright ©2016 NRMP. Reproduction prohibited without the written permission of the NRMP.
Chart DR-8
Number of Volunteer Experiences of U.S. Allopathic SeniorsDiagnostic Radiology
Charting Outcomes in the Match for U.S. Allopathic Seniors, 2016

Chart DR-9
Other Characteristics of U.S. SeniorsDiagnostic Radiology
Charting Outcomes in the Match for U.S. Allopathic Seniors, 2016 Copyright ©2016 NRMP. Reproduction prohibited without the written permission of the NRMP.
Source: NRMP Data Warehouse. Top 40 U.S. medical schools with the highest NIH funding from NIH: http://report.nih.gov/award/index.cfm
53
0
100
200
300
400
500
Yes No
120
478
0 9
Nu
mb
er
of
Ap
pli
ca
nts
AOA Membership
0
50
100
150
200
250
300
350
400
450
500
Yes No
191
461
2 7
Nu
mb
er o
f A
pp
lican
ts
Graduate of One of the 40 U.S. MedicalSchools with the Highest NIH Funding
0
100
200
300
400
500
600
700
Yes No
30
622
1 8
Nu
mb
er o
f A
pp
lican
ts
Ph.D. Degree
0
100
200
300
400
500
600
Yes No
92
560
3 6
Nu
mb
er o
f A
pp
lican
ts
Other Graduate Degree
Matched Not Matched

EM Emergency Medicine
Copyright ©2016 NRMP. Reproduction prohibited without the written permission of the NRMP.
54 Charting Outcomes in the Matchfor U.S. Allopathic Seniors, 2016

Table EM-1
Summary Statistics on U.S. Allopathic SeniorsEmergency Medicine
Measure (n=1,372) (n=124)
Matched Unmatched
12.3 5.4Mean number of contiguous ranks1.
1.1 1.6Mean number of distinct specialties ranked2.
233 220Mean USMLE Step 1 score3.
245 232Mean USMLE Step 2 score4.
2.4 2.2Mean number of research experiences5.
3.3 2.2Mean number of abstracts, presentations, and publications6.
3.5 3.7Mean number of work experiences7.
6.8 6.2Mean number of volunteer experiences8.
13.0 0.8Percentage who are AOA members9.
30.8 22.6Percentage who graduated from one of the 40 U.S. medical schools with the highest NIH funding
10.
1.5 2.5Percentage who have Ph.D. degree11.
18.0 25.2Percentage who have another graduate degree12.
Note: Only U.S. allopathic seniors who gave consent to use their information in research are included. Sources. NRMP Data Warehouse; Top 40 U.S. medical schools with the highest NIH funding in measure 10 is from the NIH website (http://report.nih.gov/award/index.cfm).
Copyright ©2016 NRMP. Reproduction prohibited without the written permission of the NRMP.
55 Charting Outcomes in the Matchfor U.S. Allopathic Seniors, 2016

0
200
400
600
800
1,000
1,200
1,400
1 2 3 4 or More
1,269
8814 0
72 40 8 3
Matched Not Matched
Distinct Specialties Ranked
Nu
mb
er o
f A
pp
lican
ts
0
40
80
120
160
200
240
280
1 2 3 4 5 6 7 8 9 10 11 12 13 14 15 16 orMore
13 9 16 13 2034 40
7588
109127
171
121
156129
251
16 17 11 18 10 5 11 11 6 6 4 6 0 2 0 1
Matched Not Matched
Contiguous Ranks
Nu
mb
er o
f A
pp
lican
ts
Chart EM-2
Number of Contiguous Ranks of U.S. Allopathic SeniorsEmergency Medicine
Source: NRMP Data Warehouse
Copyright ©2016 NRMP. Reproduction prohibited without the written permission of the NRMP.
56
Chart EM-1
Number of Distinct Specialties Ranked by U.S. Allopathic SeniorsEmergency Medicine
Charting Outcomes in the Match for U.S. Allopathic Seniors, 2016

Probability of U.S. Allopathic Seniors Matching to Preferred Specialty by Number of Contiguous RanksEmergency Medicine
Graph EM-1
0.00
0.10
0.20
0.30
0.40
0.50
0.60
0.70
0.80
0.90
1.00
0 1 2 3 4 5 6 7 8 9 10 11 12 13 14 15 16 17 18 19 20
Number of Contiguous Ranks
Probability of Matching
Source: NRMP Data Warehouse. Note: Probabilities calculated based on 2014-2016 applicants
57Copyright ©2016 NRMP. Reproduction prohibited without the written permission of the NRMP. Charting Outcomes in the Match for U.S. Allopathic Seniors, 2016

Chart EM-3
USMLE Step 1 Scores of U.S. Allopathic SeniorsEmergency Medicine
0
50
100
150
200
250
300
350
<= 180 Between 181and 190
Between 191and 200
Between 201and 210
Between 211and 220
Between 221and 230
Between 231and 240
Between 241and 250
Between 251and 260
>260 ScoreUnknown
0 023
79
180
309323
251
163
3014
0 1 1430 20 21 19 15 2 1 1
Matched Not Matched
Step 1 Scores
Nu
mb
er
of
Ap
pli
ca
nts
Source: NRMP Data Warehouse
58Copyright ©2016 NRMP. Reproduction prohibited without the written permission of the NRMP.
Chart EM-4
USMLE Step 2 CK Scores of U.S. Allopathic SeniorsEmergency Medicine
0
50
100
150
200
250
300
350
400
<= 180 Between 181and 190
Between 191and 200
Between 201and 210
Between 211and 220
Between 221and 230
Between 231and 240
Between 241and 250
Between 251and 260
>260 ScoreUnknown
0 0 0 3
58
126
297
359
314
190
250 0 0 3
24 28 33 257 2 2
Matched Not Matched
Step 2 CK Scores
Nu
mb
er o
f A
pp
lican
ts
Charting Outcomes in the Match for U.S. Allopathic Seniors, 2016

Graph EM-2
Probability of U.S. Allopathic Seniors Matching to Preferred Specialty by USMLE Step 1 ScoreEmergency Medicine
0.00
0.10
0.20
0.30
0.40
0.50
0.60
0.70
0.80
0.90
1.00
180 200 220 240 260 280
Step 1 Score
Probability of Matching
Source: NRMP Data Warehouse. Note: Probabilities calculated based on 2014-2016 applicants.
59Copyright ©2016 NRMP. Reproduction prohibited without the written permission of the NRMP. Charting Outcomes in the Match for U.S. Allopathic Seniors, 2016

0
50
100
150
200
250
300
350
400
450
None 1 2 3 4 5 or More
298
209
169 160
107
429
4324 13 12 8
24
Matched Not Matched
Publications
Nu
mb
er o
f A
pp
lican
ts
0
50
100
150
200
250
300
350
None 1 2 3 4 5 or More
122
263
337
259
132
259
1232 28 25
9 18
Matched Not Matched
Research Projects
Nu
mb
er o
f A
pp
lican
tsChart EM-5
Number of Research Projects of U.S. Allopathic SeniorsEmergency Medicine
Source: NRMP Data Warehouse
60Copyright ©2016 NRMP. Reproduction prohibited without the written permission of the NRMP.
Chart EM-6
Number of Abstracts, Presentations, and Publications of U.S. Allopathic SeniorsEmergency Medicine
Charting Outcomes in the Match for U.S. Allopathic Seniors, 2016

0
50
100
150
200
250
300
350
400
450
None 1 2 3 4 5 6 7 8 9 10 or More
731
103133 138
162
102 97 8764
448
1 8 11 14 15 10 19 6 7 429
Matched Not Matched
Volunteer Experiences
Nu
mb
er o
f A
pp
lican
ts
0
100
200
300
400
500
600
None 1 2 3 4 5 or More
63
164
245 240
142
518
14 13 15 14 1850
Matched Not Matched
Work Experiences
Nu
mb
er o
f A
pp
lican
tsChart EM-7
Number of Work Experiences of U.S. Allopathic SeniorsEmergency Medicine
Source: NRMP Data Warehouse
61Copyright ©2016 NRMP. Reproduction prohibited without the written permission of the NRMP.
Chart EM-8
Number of Volunteer Experiences of U.S. Allopathic SeniorsEmergency Medicine
Charting Outcomes in the Match for U.S. Allopathic Seniors, 2016

Chart EM-9
Other Characteristics of U.S. SeniorsEmergency Medicine
Charting Outcomes in the Match for U.S. Allopathic Seniors, 2016 Copyright ©2016 NRMP. Reproduction prohibited without the written permission of the NRMP.
Source: NRMP Data Warehouse. Top 40 U.S. medical schools with the highest NIH funding from NIH: http://report.nih.gov/award/index.cfm
62
0
200
400
600
800
1,000
1,200
Yes No
178
1,102
1
118
Nu
mb
er
of
Ap
pli
ca
nts
AOA Membership
0
200
400
600
800
1,000
Yes No
422
950
2896
Nu
mb
er o
f A
pp
lican
ts
Graduate of One of the 40 U.S. MedicalSchools with the Highest NIH Funding
0
200
400
600
800
1,000
1,200
1,400
Yes No
19
1,353
3
121
Nu
mb
er o
f A
pp
lican
ts
Ph.D. Degree
0
200
400
600
800
1,000
1,200
Yes No
231
1,141
3094
Nu
mb
er o
f A
pp
lican
ts
Other Graduate Degree
Matched Not Matched

FM Family Medicine
Copyright ©2016 NRMP. Reproduction prohibited without the written permission of the NRMP.
63 Charting Outcomes in the Matchfor U.S. Allopathic Seniors, 2016

Table FM-1
Summary Statistics on U.S. Allopathic SeniorsFamily Medicine
Measure (n=1,254) (n=59)
Matched Unmatched
10.7 4.5Mean number of contiguous ranks1.
1.1 1.3Mean number of distinct specialties ranked2.
221 208Mean USMLE Step 1 score3.
237 223Mean USMLE Step 2 score4.
2.0 1.7Mean number of research experiences5.
2.6 2.6Mean number of abstracts, presentations, and publications6.
4.2 3.3Mean number of work experiences7.
7.4 5.8Mean number of volunteer experiences8.
6.1 0.0Percentage who are AOA members9.
30.3 18.6Percentage who graduated from one of the 40 U.S. medical schools with the highest NIH funding
10.
1.0 4.0Percentage who have Ph.D. degree11.
18.9 25.5Percentage who have another graduate degree12.
Note: Only U.S. allopathic seniors who gave consent to use their information in research are included. Sources. NRMP Data Warehouse; Top 40 U.S. medical schools with the highest NIH funding in measure 10 is from the NIH website (http://report.nih.gov/award/index.cfm).
Copyright ©2016 NRMP. Reproduction prohibited without the written permission of the NRMP.
64 Charting Outcomes in the Matchfor U.S. Allopathic Seniors, 2016

0
200
400
600
800
1,000
1,200
1 2 3 4 or More
1,152
8911 2
46 10 3 0
Matched Not Matched
Distinct Specialties Ranked
Nu
mb
er o
f A
pp
lican
ts
0
40
80
120
160
200
240
1 2 3 4 5 6 7 8 9 10 11 12 13 14 15 16 orMore
51
27 29 3243
57
82 91 84
137
11088 93
71
45
214
14 11 7 3 6 5 3 1 3 3 0 0 1 0 0 2
Matched Not Matched
Contiguous Ranks
Nu
mb
er o
f A
pp
lican
ts
Chart FM-2
Number of Contiguous Ranks of U.S. Allopathic SeniorsFamily Medicine
Source: NRMP Data Warehouse
Copyright ©2016 NRMP. Reproduction prohibited without the written permission of the NRMP.
65
Chart FM-1
Number of Distinct Specialties Ranked by U.S. Allopathic SeniorsFamily Medicine
Charting Outcomes in the Match for U.S. Allopathic Seniors, 2016

Probability of U.S. Allopathic Seniors Matching to Preferred Specialty by Number of Contiguous RanksFamily Medicine
Graph FM-1
0.00
0.10
0.20
0.30
0.40
0.50
0.60
0.70
0.80
0.90
1.00
0 1 2 3 4 5 6 7 8 9 10 11 12 13 14 15 16 17 18 19 20
Number of Contiguous Ranks
Probability of Matching
Source: NRMP Data Warehouse. Note: Probabilities calculated based on 2014-2016 applicants
66Copyright ©2016 NRMP. Reproduction prohibited without the written permission of the NRMP. Charting Outcomes in the Match for U.S. Allopathic Seniors, 2016

Chart FM-3
USMLE Step 1 Scores of U.S. Allopathic SeniorsFamily Medicine
0
40
80
120
160
200
240
280
<= 180 Between 181and 190
Between 191and 200
Between 201and 210
Between 211and 220
Between 221and 230
Between 231and 240
Between 241and 250
Between 251and 260
>260 ScoreUnknown
0 10
151
199
247 255
186
112
51
1429
0 317 16 7 8 1 2 1 0 4
Matched Not Matched
Step 1 Scores
Nu
mb
er
of
Ap
pli
ca
nts
Source: NRMP Data Warehouse
67Copyright ©2016 NRMP. Reproduction prohibited without the written permission of the NRMP.
Chart FM-4
USMLE Step 2 CK Scores of U.S. Allopathic SeniorsFamily Medicine
0
40
80
120
160
200
240
280
320
<= 180 Between 181and 190
Between 191and 200
Between 201and 210
Between 211and 220
Between 221and 230
Between 231and 240
Between 241and 250
Between 251and 260
>260 ScoreUnknown
0 0 0
31
165
237
295
259
149
81
37
0 0 0 720 14 3 4 3 0 8
Matched Not Matched
Step 2 CK Scores
Nu
mb
er o
f A
pp
lican
ts
Charting Outcomes in the Match for U.S. Allopathic Seniors, 2016
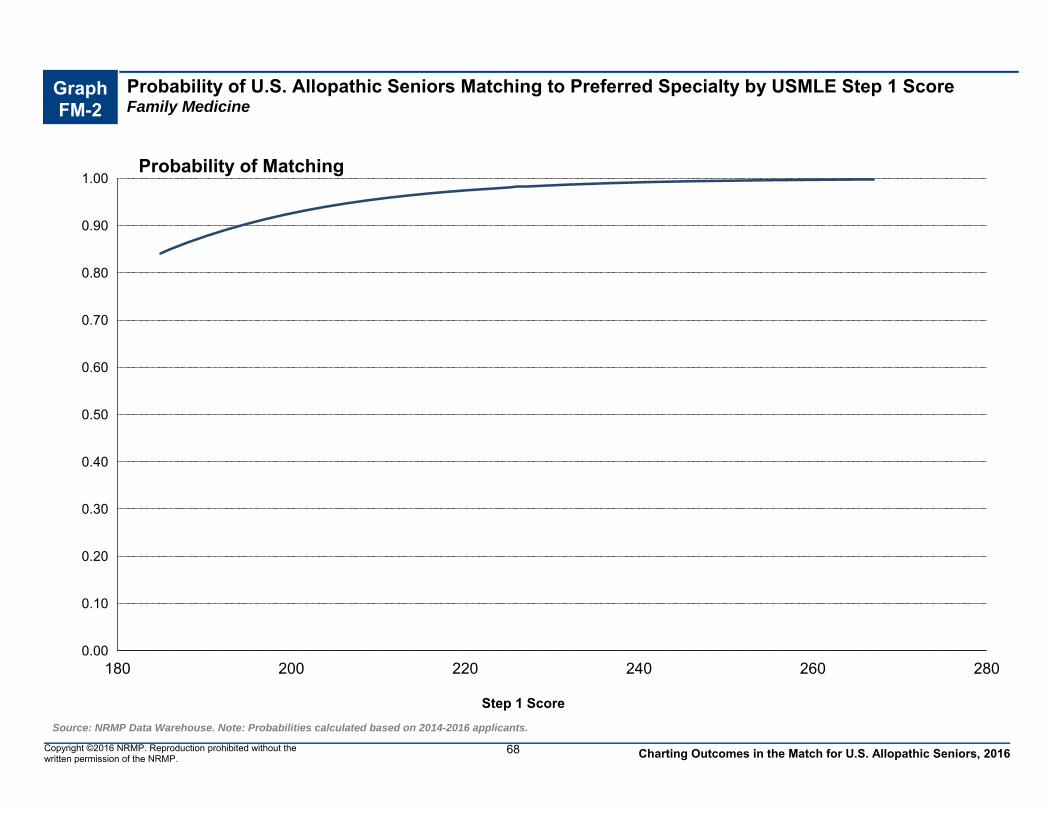
Graph FM-2
Probability of U.S. Allopathic Seniors Matching to Preferred Specialty by USMLE Step 1 ScoreFamily Medicine
0.00
0.10
0.20
0.30
0.40
0.50
0.60
0.70
0.80
0.90
1.00
180 200 220 240 260 280
Step 1 Score
Probability of Matching
Source: NRMP Data Warehouse. Note: Probabilities calculated based on 2014-2016 applicants.
68Copyright ©2016 NRMP. Reproduction prohibited without the written permission of the NRMP. Charting Outcomes in the Match for U.S. Allopathic Seniors, 2016

0
50
100
150
200
250
300
350
400
None 1 2 3 4 5 or More
305
224
135
10387
400
16 9 6 3 124
Matched Not Matched
Publications
Nu
mb
er o
f A
pp
lican
ts
0
40
80
120
160
200
240
280
320
None 1 2 3 4 5 or More
176
286260
193
88
251
9 14 10 3 221
Matched Not Matched
Research Projects
Nu
mb
er o
f A
pp
lican
tsChart FM-5
Number of Research Projects of U.S. Allopathic SeniorsFamily Medicine
Source: NRMP Data Warehouse
69Copyright ©2016 NRMP. Reproduction prohibited without the written permission of the NRMP.
Chart FM-6
Number of Abstracts, Presentations, and Publications of U.S. Allopathic SeniorsFamily Medicine
Charting Outcomes in the Match for U.S. Allopathic Seniors, 2016

0
100
200
300
400
500
None 1 2 3 4 5 6 7 8 9 10 or More
827
48
90 89
130 11597 105
55
490
0 4 5 9 2 6 3 4 1 025
Matched Not Matched
Volunteer Experiences
Nu
mb
er o
f A
pp
lican
ts
0
100
200
300
400
500
600
None 1 2 3 4 5 or More
80
158202 191
116
507
4 7 8 11 128
Matched Not Matched
Work Experiences
Nu
mb
er o
f A
pp
lican
tsChart FM-7
Number of Work Experiences of U.S. Allopathic SeniorsFamily Medicine
Source: NRMP Data Warehouse
70Copyright ©2016 NRMP. Reproduction prohibited without the written permission of the NRMP.
Chart FM-8
Number of Volunteer Experiences of U.S. Allopathic SeniorsFamily Medicine
Charting Outcomes in the Match for U.S. Allopathic Seniors, 2016

Chart FM-9
Other Characteristics of U.S. SeniorsFamily Medicine
Charting Outcomes in the Match for U.S. Allopathic Seniors, 2016 Copyright ©2016 NRMP. Reproduction prohibited without the written permission of the NRMP.
Source: NRMP Data Warehouse. Top 40 U.S. medical schools with the highest NIH funding from NIH: http://report.nih.gov/award/index.cfm
71
0
200
400
600
800
1,000
1,200
Yes No
77
1,068
051
Nu
mb
er
of
Ap
pli
ca
nts
AOA Membership
0
200
400
600
800
1,000
Yes No
380
874
1148
Nu
mb
er o
f A
pp
lican
ts
Graduate of One of the 40 U.S. MedicalSchools with the Highest NIH Funding
0
200
400
600
800
1,000
1,200
1,400
Yes No
12
1,242
257
Nu
mb
er o
f A
pp
lican
ts
Ph.D. Degree
0
200
400
600
800
1,000
1,200
Yes No
217
1,037
13 46
Nu
mb
er o
f A
pp
lican
ts
Other Graduate Degree
Matched Not Matched

GS General Surgery
Copyright ©2016 NRMP. Reproduction prohibited without the written permission of the NRMP.
72 Charting Outcomes in the Matchfor U.S. Allopathic Seniors, 2016

Table GS-1
Summary Statistics on U.S. Allopathic SeniorsGeneral Surgery
Measure (n=816) (n=149)
Matched Unmatched
12.9 6.5Mean number of contiguous ranks1.
1.0 1.1Mean number of distinct specialties ranked2.
235 218Mean USMLE Step 1 score3.
247 231Mean USMLE Step 2 score4.
3.2 2.7Mean number of research experiences5.
4.7 3.3Mean number of abstracts, presentations, and publications6.
3.3 3.1Mean number of work experiences7.
6.8 5.9Mean number of volunteer experiences8.
17.4 1.3Percentage who are AOA members9.
29.5 18.8Percentage who graduated from one of the 40 U.S. medical schools with the highest NIH funding
10.
1.5 3.0Percentage who have Ph.D. degree11.
17.9 18.7Percentage who have another graduate degree12.
Note: Only U.S. allopathic seniors who gave consent to use their information in research are included. Sources. NRMP Data Warehouse; Top 40 U.S. medical schools with the highest NIH funding in measure 10 is from the NIH website (http://report.nih.gov/award/index.cfm).
Copyright ©2016 NRMP. Reproduction prohibited without the written permission of the NRMP.
73 Charting Outcomes in the Matchfor U.S. Allopathic Seniors, 2016

0
100
200
300
400
500
600
700
800
1 2 3 4 or More
782
322 0
129
19 1 0
Matched Not Matched
Distinct Specialties Ranked
Nu
mb
er o
f A
pp
lican
ts
0
40
80
120
160
200
240
1 2 3 4 5 6 7 8 9 10 11 12 13 14 15 16 orMore
12 9 7 6 13 18 24 30 33
6377
6787 86
76
208
2712 15 10 9 10 12 5 7 7 8 6 4 7 4 6
Matched Not Matched
Contiguous Ranks
Nu
mb
er o
f A
pp
lican
ts
Chart GS-2
Number of Contiguous Ranks of U.S. Allopathic SeniorsGeneral Surgery
Source: NRMP Data Warehouse
Copyright ©2016 NRMP. Reproduction prohibited without the written permission of the NRMP.
74
Chart GS-1
Number of Distinct Specialties Ranked by U.S. Allopathic SeniorsGeneral Surgery
Charting Outcomes in the Match for U.S. Allopathic Seniors, 2016

Probability of U.S. Allopathic Seniors Matching to Preferred Specialty by Number of Contiguous RanksGeneral Surgery
Graph GS-1
0.00
0.10
0.20
0.30
0.40
0.50
0.60
0.70
0.80
0.90
1.00
0 1 2 3 4 5 6 7 8 9 10 11 12 13 14 15 16 17 18 19 20
Number of Contiguous Ranks
Probability of Matching
Source: NRMP Data Warehouse. Note: Probabilities calculated based on 2014-2016 applicants
75Copyright ©2016 NRMP. Reproduction prohibited without the written permission of the NRMP. Charting Outcomes in the Match for U.S. Allopathic Seniors, 2016

Chart GS-3
USMLE Step 1 Scores of U.S. Allopathic SeniorsGeneral Surgery
0
40
80
120
160
200
240
<= 180 Between 181and 190
Between 191and 200
Between 201and 210
Between 211and 220
Between 221and 230
Between 231and 240
Between 241and 250
Between 251and 260
>260 ScoreUnknown
0 0 7
30
93
183202
168
91
3111
0 113
3247
22 16 7 3 1 7
Matched Not Matched
Step 1 Scores
Nu
mb
er
of
Ap
pli
ca
nts
Source: NRMP Data Warehouse
76Copyright ©2016 NRMP. Reproduction prohibited without the written permission of the NRMP.
Chart GS-4
USMLE Step 2 CK Scores of U.S. Allopathic SeniorsGeneral Surgery
0
40
80
120
160
200
240
<= 180 Between 181and 190
Between 191and 200
Between 201and 210
Between 211and 220
Between 221and 230
Between 231and 240
Between 241and 250
Between 251and 260
>260 ScoreUnknown
0 0 0 123
72
168
221
187
128
160 0 0 7
2435 40
242 3
14
Matched Not Matched
Step 2 CK Scores
Nu
mb
er o
f A
pp
lican
ts
Charting Outcomes in the Match for U.S. Allopathic Seniors, 2016

Graph GS-2
Probability of U.S. Allopathic Seniors Matching to Preferred Specialty by USMLE Step 1 ScoreGeneral Surgery
0.00
0.10
0.20
0.30
0.40
0.50
0.60
0.70
0.80
0.90
1.00
180 200 220 240 260 280
Step 1 Score
Probability of Matching
Source: NRMP Data Warehouse. Note: Probabilities calculated based on 2014-2016 applicants.
77Copyright ©2016 NRMP. Reproduction prohibited without the written permission of the NRMP. Charting Outcomes in the Match for U.S. Allopathic Seniors, 2016

0
50
100
150
200
250
300
350
400
None 1 2 3 4 5 or More
8499
11383
67
370
28 28 17 9 10
57
Matched Not Matched
Publications
Nu
mb
er o
f A
pp
lican
ts
0
40
80
120
160
200
240
None 1 2 3 4 5 or More
31
92
156170
129
238
12 17
44
209
47
Matched Not Matched
Research Projects
Nu
mb
er o
f A
pp
lican
tsChart GS-5
Number of Research Projects of U.S. Allopathic SeniorsGeneral Surgery
Source: NRMP Data Warehouse
78Copyright ©2016 NRMP. Reproduction prohibited without the written permission of the NRMP.
Chart GS-6
Number of Abstracts, Presentations, and Publications of U.S. Allopathic SeniorsGeneral Surgery
Charting Outcomes in the Match for U.S. Allopathic Seniors, 2016
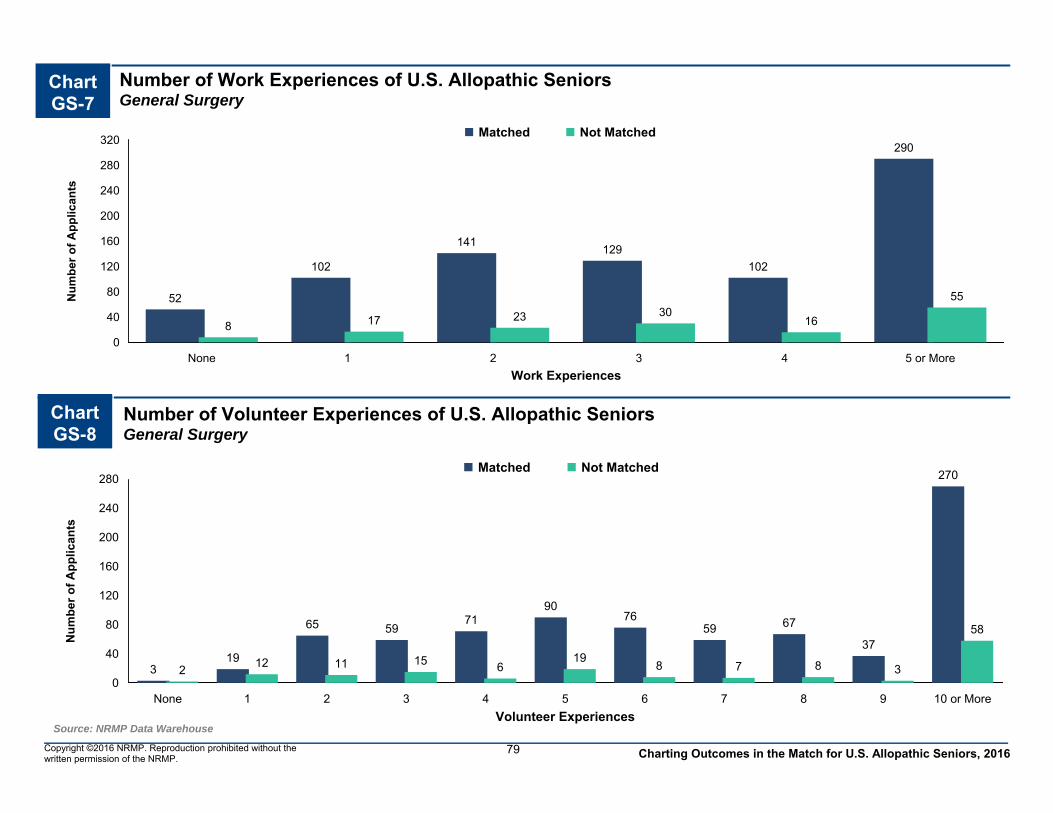
0
40
80
120
160
200
240
280
None 1 2 3 4 5 6 7 8 9 10 or More
319
65 5971
9076
59 67
37
270
212 11 15 6
198 7 8 3
58
Matched Not Matched
Volunteer Experiences
Nu
mb
er o
f A
pp
lican
ts
0
40
80
120
160
200
240
280
320
None 1 2 3 4 5 or More
52
102
141129
102
290
8 17 23 3016
55
Matched Not Matched
Work Experiences
Nu
mb
er o
f A
pp
lican
tsChart GS-7
Number of Work Experiences of U.S. Allopathic SeniorsGeneral Surgery
Source: NRMP Data Warehouse
79Copyright ©2016 NRMP. Reproduction prohibited without the written permission of the NRMP.
Chart GS-8
Number of Volunteer Experiences of U.S. Allopathic SeniorsGeneral Surgery
Charting Outcomes in the Match for U.S. Allopathic Seniors, 2016

Chart GS-9
Other Characteristics of U.S. SeniorsGeneral Surgery
Charting Outcomes in the Match for U.S. Allopathic Seniors, 2016 Copyright ©2016 NRMP. Reproduction prohibited without the written permission of the NRMP.
Source: NRMP Data Warehouse. Top 40 U.S. medical schools with the highest NIH funding from NIH: http://report.nih.gov/award/index.cfm
80
0
100
200
300
400
500
600
700
Yes No
142
609
2
131Nu
mb
er
of
Ap
pli
ca
nts
AOA Membership
0
100
200
300
400
500
600
Yes No
241
575
28
121Nu
mb
er o
f A
pp
lican
ts
Graduate of One of the 40 U.S. MedicalSchools with the Highest NIH Funding
0
100
200
300
400
500
600
700
800
900
Yes No
11
805
4
145Nu
mb
er o
f A
pp
lican
ts
Ph.D. Degree
0
100
200
300
400
500
600
700
Yes No
135
681
25
124Nu
mb
er o
f A
pp
lican
ts
Other Graduate Degree
Matched Not Matched

IM Internal Medicine
Copyright ©2016 NRMP. Reproduction prohibited without the written permission of the NRMP.
81 Charting Outcomes in the Matchfor U.S. Allopathic Seniors, 2016

Table IM-1
Summary Statistics on U.S. Allopathic SeniorsInternal Medicine
Measure (n=3,051) (n=62)
Matched Unmatched
11.7 4.1Mean number of contiguous ranks1.
1.1 1.3Mean number of distinct specialties ranked2.
233 210Mean USMLE Step 1 score3.
246 225Mean USMLE Step 2 score4.
2.8 3.1Mean number of research experiences5.
4.4 6.0Mean number of abstracts, presentations, and publications6.
2.8 3.5Mean number of work experiences7.
6.3 5.6Mean number of volunteer experiences8.
18.1 1.6Percentage who are AOA members9.
34.4 16.1Percentage who graduated from one of the 40 U.S. medical schools with the highest NIH funding
10.
5.0 8.0Percentage who have Ph.D. degree11.
17.9 31.3Percentage who have another graduate degree12.
Note: Only U.S. allopathic seniors who gave consent to use their information in research are included. Sources. NRMP Data Warehouse; Top 40 U.S. medical schools with the highest NIH funding in measure 10 is from the NIH website (http://report.nih.gov/award/index.cfm).
Copyright ©2016 NRMP. Reproduction prohibited without the written permission of the NRMP.
82 Charting Outcomes in the Matchfor U.S. Allopathic Seniors, 2016

0
400
800
1,200
1,600
2,000
2,400
2,800
3,200
1 2 3 4 or More
2,912
12512 244 16 2 0
Matched Not Matched
Distinct Specialties Ranked
Nu
mb
er o
f A
pp
lican
ts
0
100
200
300
400
500
600
1 2 3 4 5 6 7 8 9 10 11 12 13 14 15 16 orMore
47 34 55 4978 98
158194
233
293267
297
235 249201
563
14 10 10 3 10 4 3 1 4 1 1 0 0 0 0 1
Matched Not Matched
Contiguous Ranks
Nu
mb
er o
f A
pp
lican
ts
Chart IM-2
Number of Contiguous Ranks of U.S. Allopathic SeniorsInternal Medicine
Source: NRMP Data Warehouse
Copyright ©2016 NRMP. Reproduction prohibited without the written permission of the NRMP.
83
Chart IM-1
Number of Distinct Specialties Ranked by U.S. Allopathic SeniorsInternal Medicine
Charting Outcomes in the Match for U.S. Allopathic Seniors, 2016

Probability of U.S. Allopathic Seniors Matching to Preferred Specialty by Number of Contiguous RanksInternal Medicine
Graph IM-1
0.00
0.10
0.20
0.30
0.40
0.50
0.60
0.70
0.80
0.90
1.00
0 1 2 3 4 5 6 7 8 9 10 11 12 13 14 15 16 17 18 19 20
Number of Contiguous Ranks
Probability of Matching
Source: NRMP Data Warehouse. Note: Probabilities calculated based on 2014-2016 applicants
84Copyright ©2016 NRMP. Reproduction prohibited without the written permission of the NRMP. Charting Outcomes in the Match for U.S. Allopathic Seniors, 2016

Chart IM-3
USMLE Step 1 Scores of U.S. Allopathic SeniorsInternal Medicine
0
100
200
300
400
500
600
<= 180 Between 181and 190
Between 191and 200
Between 201and 210
Between 211and 220
Between 221and 230
Between 231and 240
Between 241and 250
Between 251and 260
>260 ScoreUnknown
0 9
98
237
377
526
592 581
418
12687
0 5 14 15 10 7 3 2 2 0 4
Matched Not Matched
Step 1 Scores
Nu
mb
er
of
Ap
pli
ca
nts
Source: NRMP Data Warehouse
85Copyright ©2016 NRMP. Reproduction prohibited without the written permission of the NRMP.
Chart IM-4
USMLE Step 2 CK Scores of U.S. Allopathic SeniorsInternal Medicine
0
100
200
300
400
500
600
700
<= 180 Between 181and 190
Between 191and 200
Between 201and 210
Between 211and 220
Between 221and 230
Between 231and 240
Between 241and 250
Between 251and 260
>260 ScoreUnknown
0 0 0 15
171
352
534
671 662
516
130
0 1 0 4 20 15 8 3 2 2 7
Matched Not Matched
Step 2 CK Scores
Nu
mb
er o
f A
pp
lican
ts
Charting Outcomes in the Match for U.S. Allopathic Seniors, 2016

Graph IM-2
Probability of U.S. Allopathic Seniors Matching to Preferred Specialty by USMLE Step 1 ScoreInternal Medicine
0.00
0.10
0.20
0.30
0.40
0.50
0.60
0.70
0.80
0.90
1.00
180 200 220 240 260 280
Step 1 Score
Probability of Matching
Source: NRMP Data Warehouse. Note: Probabilities calculated based on 2014-2016 applicants.
86Copyright ©2016 NRMP. Reproduction prohibited without the written permission of the NRMP. Charting Outcomes in the Match for U.S. Allopathic Seniors, 2016

0
200
400
600
800
1,000
1,200
1,400
None 1 2 3 4 5 or More
402349 370
315234
1,381
9 8 6 6 3 30
Matched Not Matched
Publications
Nu
mb
er o
f A
pp
lican
ts
0
200
400
600
800
1,000
None 1 2 3 4 5 or More
156
427
648586
365
869
2 9 14 5 6 26
Matched Not Matched
Research Projects
Nu
mb
er o
f A
pp
lican
tsChart IM-5
Number of Research Projects of U.S. Allopathic SeniorsInternal Medicine
Source: NRMP Data Warehouse
87Copyright ©2016 NRMP. Reproduction prohibited without the written permission of the NRMP.
Chart IM-6
Number of Abstracts, Presentations, and Publications of U.S. Allopathic SeniorsInternal Medicine
Charting Outcomes in the Match for U.S. Allopathic Seniors, 2016
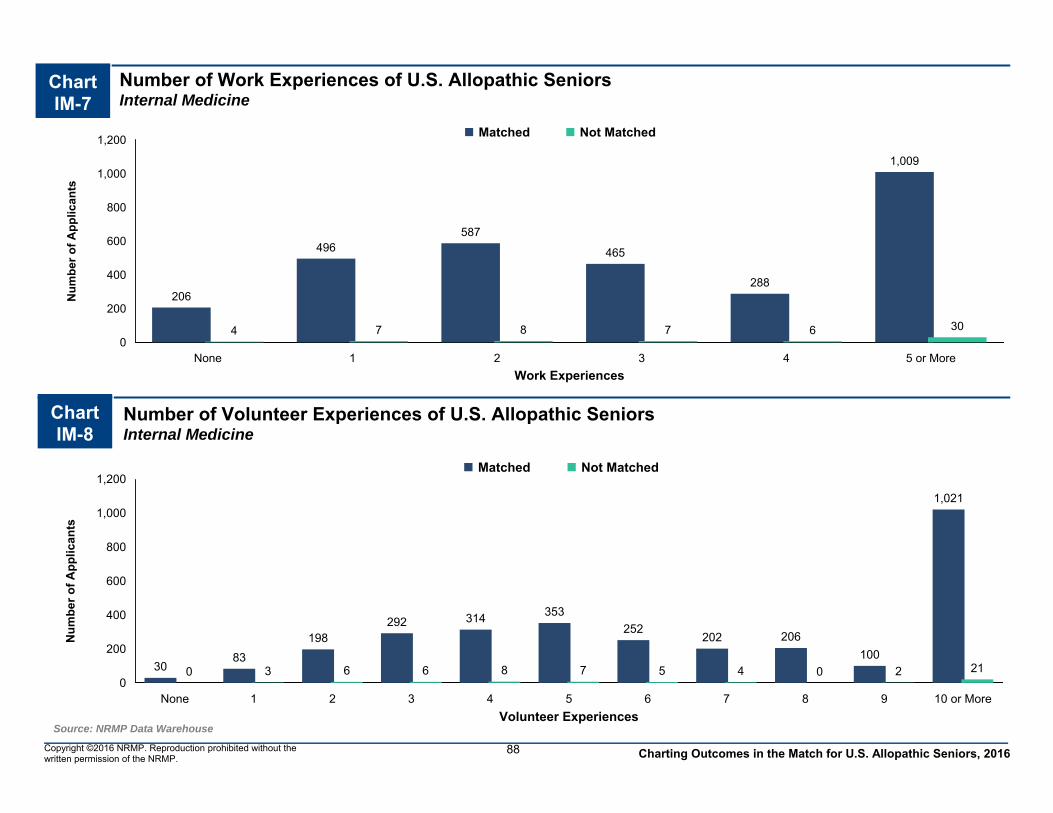
0
200
400
600
800
1,000
1,200
None 1 2 3 4 5 6 7 8 9 10 or More
3083
198292 314 353
252202 206
100
1,021
0 3 6 6 8 7 5 4 0 2 21
Matched Not Matched
Volunteer Experiences
Nu
mb
er o
f A
pp
lican
ts
0
200
400
600
800
1,000
1,200
None 1 2 3 4 5 or More
206
496587
465
288
1,009
4 7 8 7 6 30
Matched Not Matched
Work Experiences
Nu
mb
er o
f A
pp
lican
tsChart IM-7
Number of Work Experiences of U.S. Allopathic SeniorsInternal Medicine
Source: NRMP Data Warehouse
88Copyright ©2016 NRMP. Reproduction prohibited without the written permission of the NRMP.
Chart IM-8
Number of Volunteer Experiences of U.S. Allopathic SeniorsInternal Medicine
Charting Outcomes in the Match for U.S. Allopathic Seniors, 2016

Chart IM-9
Other Characteristics of U.S. SeniorsInternal Medicine
Charting Outcomes in the Match for U.S. Allopathic Seniors, 2016 Copyright ©2016 NRMP. Reproduction prohibited without the written permission of the NRMP.
Source: NRMP Data Warehouse. Top 40 U.S. medical schools with the highest NIH funding from NIH: http://report.nih.gov/award/index.cfm
89
0
400
800
1,200
1,600
2,000
2,400
Yes No
553
2,175
1 49
Nu
mb
er
of
Ap
pli
ca
nts
AOA Membership
0
400
800
1,200
1,600
2,000
2,400
Yes No
1,049
2,002
10 52
Nu
mb
er o
f A
pp
lican
ts
Graduate of One of the 40 U.S. MedicalSchools with the Highest NIH Funding
0
400
800
1,200
1,600
2,000
2,400
2,800
3,200
Yes No
138
2,913
4 58
Nu
mb
er o
f A
pp
lican
ts
Ph.D. Degree
0
400
800
1,200
1,600
2,000
2,400
2,800
Yes No
488
2,563
15 47
Nu
mb
er o
f A
pp
lican
ts
Other Graduate Degree
Matched Not Matched

IP Internal Medicine/Pediatrics
Copyright ©2016 NRMP. Reproduction prohibited without the written permission of the NRMP.
90 Charting Outcomes in the Matchfor U.S. Allopathic Seniors, 2016

Table IP-1
Summary Statistics on U.S. Allopathic SeniorsInternal Medicine/Pediatrics
Measure (n=314) (n=38)
Matched Unmatched
10.4 4.1Mean number of contiguous ranks1.
1.3 1.8Mean number of distinct specialties ranked2.
236 227Mean USMLE Step 1 score3.
249 238Mean USMLE Step 2 score4.
2.5 2.8Mean number of research experiences5.
3.5 4.5Mean number of abstracts, presentations, and publications6.
3.2 3.3Mean number of work experiences7.
8.0 7.3Mean number of volunteer experiences8.
22.0 5.3Percentage who are AOA members9.
30.6 39.5Percentage who graduated from one of the 40 U.S. medical schools with the highest NIH funding
10.
2.3 2.9Percentage who have Ph.D. degree11.
19.7 17.6Percentage who have another graduate degree12.
Note: Only U.S. allopathic seniors who gave consent to use their information in research are included. Sources. NRMP Data Warehouse; Top 40 U.S. medical schools with the highest NIH funding in measure 10 is from the NIH website (http://report.nih.gov/award/index.cfm).
Copyright ©2016 NRMP. Reproduction prohibited without the written permission of the NRMP.
91 Charting Outcomes in the Matchfor U.S. Allopathic Seniors, 2016

0
40
80
120
160
200
240
1 2 3 4 or More
236
76
2 09
27
2 0
Matched Not Matched
Distinct Specialties Ranked
Nu
mb
er o
f A
pp
lican
ts
0
5
10
15
20
25
30
35
40
1 2 3 4 5 6 7 8 9 10 11 12 13 14 15 16 orMore
12
6
13
8 911 11
17
29
36
26
31 3027
20
28
13
9
1 2 2 13 2
0 13
0 0 0 0 1
Matched Not Matched
Contiguous Ranks
Nu
mb
er o
f A
pp
lican
ts
Chart IP-2
Number of Contiguous Ranks of U.S. Allopathic SeniorsInternal Medicine/Pediatrics
Source: NRMP Data Warehouse
Copyright ©2016 NRMP. Reproduction prohibited without the written permission of the NRMP.
92
Chart IP-1
Number of Distinct Specialties Ranked by U.S. Allopathic SeniorsInternal Medicine/Pediatrics
Charting Outcomes in the Match for U.S. Allopathic Seniors, 2016

Probability of U.S. Allopathic Seniors Matching to Preferred Specialty by Number of Contiguous RanksInternal Medicine/Pediatrics
Graph IP-1
0.00
0.10
0.20
0.30
0.40
0.50
0.60
0.70
0.80
0.90
1.00
0 1 2 3 4 5 6 7 8 9 10 11 12 13 14 15 16 17 18 19 20
Number of Contiguous Ranks
Probability of Matching
Source: NRMP Data Warehouse. Note: Probabilities calculated based on 2014-2016 applicants
93Copyright ©2016 NRMP. Reproduction prohibited without the written permission of the NRMP. Charting Outcomes in the Match for U.S. Allopathic Seniors, 2016

Chart IP-3
USMLE Step 1 Scores of U.S. Allopathic SeniorsInternal Medicine/Pediatrics
0
10
20
30
40
50
60
70
80
<= 180 Between 181and 190
Between 191and 200
Between 201and 210
Between 211and 220
Between 221and 230
Between 231and 240
Between 241and 250
Between 251and 260
>260 ScoreUnknown
0 0 2
15
34
50
77 79
37
18
20 0 37 5 7
38
3 1 1
Matched Not Matched
Step 1 Scores
Nu
mb
er
of
Ap
pli
ca
nts
Source: NRMP Data Warehouse
94Copyright ©2016 NRMP. Reproduction prohibited without the written permission of the NRMP.
Chart IP-4
USMLE Step 2 CK Scores of U.S. Allopathic SeniorsInternal Medicine/Pediatrics
0
20
40
60
80
100
120
<= 180 Between 181and 190
Between 191and 200
Between 201and 210
Between 211and 220
Between 221and 230
Between 231and 240
Between 241and 250
Between 251and 260
>260 ScoreUnknown
0 0 0 06
15
54
101
73
57
80 0 0 4 3
94
92 6
1
Matched Not Matched
Step 2 CK Scores
Nu
mb
er o
f A
pp
lican
ts
Charting Outcomes in the Match for U.S. Allopathic Seniors, 2016

Graph IP-2
Probability of U.S. Allopathic Seniors Matching to Preferred Specialty by USMLE Step 1 ScoreInternal Medicine/Pediatrics
0.00
0.10
0.20
0.30
0.40
0.50
0.60
0.70
0.80
0.90
1.00
180 200 220 240 260 280
Step 1 Score
Probability of Matching
Source: NRMP Data Warehouse. Note: Probabilities calculated based on 2014-2016 applicants.
95Copyright ©2016 NRMP. Reproduction prohibited without the written permission of the NRMP. Charting Outcomes in the Match for U.S. Allopathic Seniors, 2016

0
20
40
60
80
100
120
None 1 2 3 4 5 or More
4756
41 39
25
106
6 4 37
1
17
Matched Not Matched
Publications
Nu
mb
er o
f A
pp
lican
ts
0
10
20
30
40
50
60
70
None 1 2 3 4 5 or More
22
65 64 66
31
66
2
115 7
2
11
Matched Not Matched
Research Projects
Nu
mb
er o
f A
pp
lican
tsChart IP-5
Number of Research Projects of U.S. Allopathic SeniorsInternal Medicine/Pediatrics
Source: NRMP Data Warehouse
96Copyright ©2016 NRMP. Reproduction prohibited without the written permission of the NRMP.
Chart IP-6
Number of Abstracts, Presentations, and Publications of U.S. Allopathic SeniorsInternal Medicine/Pediatrics
Charting Outcomes in the Match for U.S. Allopathic Seniors, 2016

0
20
40
60
80
100
120
140
None 1 2 3 4 5 6 7 8 9 10 or More
1 2
1523
16
2837
24 2620
122
0 2 1 2 4 5 5 2 0 1
16
Matched Not Matched
Volunteer Experiences
Nu
mb
er o
f A
pp
lican
ts
0
20
40
60
80
100
None 1 2 3 4 5 or More
18
4651
59
43
97
15 6 9 10 7
Matched Not Matched
Work Experiences
Nu
mb
er o
f A
pp
lican
tsChart IP-7
Number of Work Experiences of U.S. Allopathic SeniorsInternal Medicine/Pediatrics
Source: NRMP Data Warehouse
97Copyright ©2016 NRMP. Reproduction prohibited without the written permission of the NRMP.
Chart IP-8
Number of Volunteer Experiences of U.S. Allopathic SeniorsInternal Medicine/Pediatrics
Charting Outcomes in the Match for U.S. Allopathic Seniors, 2016

Chart IP-9
Other Characteristics of U.S. SeniorsInternal Medicine/Pediatrics
Charting Outcomes in the Match for U.S. Allopathic Seniors, 2016 Copyright ©2016 NRMP. Reproduction prohibited without the written permission of the NRMP.
Source: NRMP Data Warehouse. Top 40 U.S. medical schools with the highest NIH funding from NIH: http://report.nih.gov/award/index.cfm
98
0
40
80
120
160
200
240
Yes No
69
228
2
32
Nu
mb
er
of
Ap
pli
ca
nts
AOA Membership
0
40
80
120
160
200
240
Yes No
96
218
1523
Nu
mb
er o
f A
pp
lican
ts
Graduate of One of the 40 U.S. MedicalSchools with the Highest NIH Funding
0
40
80
120
160
200
240
280
320
Yes No
7
307
1
37
Nu
mb
er o
f A
pp
lican
ts
Ph.D. Degree
0
40
80
120
160
200
240
280
Yes No
59
255
6
32
Nu
mb
er o
f A
pp
lican
ts
Other Graduate Degree
Matched Not Matched

NS Neurological Surgery
Copyright ©2016 NRMP. Reproduction prohibited without the written permission of the NRMP.
99 Charting Outcomes in the Matchfor U.S. Allopathic Seniors, 2016

Table NS-1
Summary Statistics on U.S. Allopathic SeniorsNeurological Surgery
Measure (n=183) (n=61)
Matched Unmatched
15.7 10.2Mean number of contiguous ranks1.
1.1 1.4Mean number of distinct specialties ranked2.
249 238Mean USMLE Step 1 score3.
251 241Mean USMLE Step 2 score4.
4.8 4.2Mean number of research experiences5.
13.4 8.4Mean number of abstracts, presentations, and publications6.
2.9 3.3Mean number of work experiences7.
6.2 6.0Mean number of volunteer experiences8.
32.8 11.5Percentage who are AOA members9.
47.0 27.9Percentage who graduated from one of the 40 U.S. medical schools with the highest NIH funding
10.
9.5 7.0Percentage who have Ph.D. degree11.
23.2 22.8Percentage who have another graduate degree12.
Note: Only U.S. allopathic seniors who gave consent to use their information in research are included. Sources. NRMP Data Warehouse; Top 40 U.S. medical schools with the highest NIH funding in measure 10 is from the NIH website (http://report.nih.gov/award/index.cfm).
Copyright ©2016 NRMP. Reproduction prohibited without the written permission of the NRMP.
100 Charting Outcomes in the Matchfor U.S. Allopathic Seniors, 2016

0
20
40
60
80
100
120
140
160
180
1 2 3 4 or More
172
110 0
46
7 5 3
Matched Not Matched
Distinct Specialties Ranked
Nu
mb
er o
f A
pp
lican
ts
0
20
40
60
80
100
1 2 3 4 5 6 7 8 9 10 11 12 13 14 15 16 orMore
0 1 1 1 1 4 17
3 39 9
13 14 17
99
4 4 2 2 5 3 15
1 3 4 3 6 3 2
13
Matched Not Matched
Contiguous Ranks
Nu
mb
er o
f A
pp
lican
ts
Chart NS-2
Number of Contiguous Ranks of U.S. Allopathic SeniorsNeurological Surgery
Source: NRMP Data Warehouse
Copyright ©2016 NRMP. Reproduction prohibited without the written permission of the NRMP.
101
Chart NS-1
Number of Distinct Specialties Ranked by U.S. Allopathic SeniorsNeurological Surgery
Charting Outcomes in the Match for U.S. Allopathic Seniors, 2016

Probability of U.S. Allopathic Seniors Matching to Preferred Specialty by Number of Contiguous RanksNeurological Surgery
Graph NS-1
0.00
0.10
0.20
0.30
0.40
0.50
0.60
0.70
0.80
0.90
1.00
0 1 2 3 4 5 6 7 8 9 10 11 12 13 14 15 16 17 18 19 20
Number of Contiguous Ranks
Probability of Matching
Source: NRMP Data Warehouse. Note: Probabilities calculated based on 2014-2016 applicants
102Copyright ©2016 NRMP. Reproduction prohibited without the written permission of the NRMP. Charting Outcomes in the Match for U.S. Allopathic Seniors, 2016

Chart NS-3
USMLE Step 1 Scores of U.S. Allopathic SeniorsNeurological Surgery
0
10
20
30
40
50
60
<= 180 Between 181and 190
Between 191and 200
Between 201and 210
Between 211and 220
Between 221and 230
Between 231and 240
Between 241and 250
Between 251and 260
>260 ScoreUnknown
0 0 0 1 3
11
29
52 50
32
50 0 1 0
5
11
1916
63
0
Matched Not Matched
Step 1 Scores
Nu
mb
er
of
Ap
pli
ca
nts
Source: NRMP Data Warehouse
103Copyright ©2016 NRMP. Reproduction prohibited without the written permission of the NRMP.
Chart NS-4
USMLE Step 2 CK Scores of U.S. Allopathic SeniorsNeurological Surgery
0
10
20
30
40
50
<= 180 Between 181and 190
Between 191and 200
Between 201and 210
Between 211and 220
Between 221and 230
Between 231and 240
Between 241and 250
Between 251and 260
>260 ScoreUnknown
0 0 0 1 2
7
19
48 48
43
15
0 0 02
58
12
18
4
9
3
Matched Not Matched
Step 2 CK Scores
Nu
mb
er o
f A
pp
lican
ts
Charting Outcomes in the Match for U.S. Allopathic Seniors, 2016

Graph NS-2
Probability of U.S. Allopathic Seniors Matching to Preferred Specialty by USMLE Step 1 ScoreNeurological Surgery
0.00
0.10
0.20
0.30
0.40
0.50
0.60
0.70
0.80
0.90
1.00
190 200 210 220 230 240 250 260 270
Step 1 Score
Probability of Matching
Source: NRMP Data Warehouse. Note: Probabilities calculated based on 2014-2016 applicants.
104Copyright ©2016 NRMP. Reproduction prohibited without the written permission of the NRMP. Charting Outcomes in the Match for U.S. Allopathic Seniors, 2016

0
20
40
60
80
100
120
140
160
None 1 2 3 4 5 or More
1 310 6 9
154
2 4 5 5 6
39
Matched Not Matched
Publications
Nu
mb
er o
f A
pp
lican
ts
0
20
40
60
80
100
None 1 2 3 4 5 or More
05
18
31 33
96
2 4
146 5
30
Matched Not Matched
Research Projects
Nu
mb
er o
f A
pp
lican
tsChart NS-5
Number of Research Projects of U.S. Allopathic SeniorsNeurological Surgery
Source: NRMP Data Warehouse
105Copyright ©2016 NRMP. Reproduction prohibited without the written permission of the NRMP.
Chart NS-6
Number of Abstracts, Presentations, and Publications of U.S. Allopathic SeniorsNeurological Surgery
Charting Outcomes in the Match for U.S. Allopathic Seniors, 2016

0
10
20
30
40
50
60
None 1 2 3 4 5 6 7 8 9 10 or More
0
7
21
1416
1917 18
9
3
59
04
84
610
4 37
1
14
Matched Not Matched
Volunteer Experiences
Nu
mb
er o
f A
pp
lican
ts
0
10
20
30
40
50
60
None 1 2 3 4 5 or More
13
27 26
41
20
56
3
1115
46
22
Matched Not Matched
Work Experiences
Nu
mb
er o
f A
pp
lican
tsChart NS-7
Number of Work Experiences of U.S. Allopathic SeniorsNeurological Surgery
Source: NRMP Data Warehouse
106Copyright ©2016 NRMP. Reproduction prohibited without the written permission of the NRMP.
Chart NS-8
Number of Volunteer Experiences of U.S. Allopathic SeniorsNeurological Surgery
Charting Outcomes in the Match for U.S. Allopathic Seniors, 2016

Chart NS-9
Other Characteristics of U.S. SeniorsNeurological Surgery
Charting Outcomes in the Match for U.S. Allopathic Seniors, 2016 Copyright ©2016 NRMP. Reproduction prohibited without the written permission of the NRMP.
Source: NRMP Data Warehouse. Top 40 U.S. medical schools with the highest NIH funding from NIH: http://report.nih.gov/award/index.cfm
107
0
20
40
60
80
100
120
Yes No
60
102
7
50
Nu
mb
er
of
Ap
pli
ca
nts
AOA Membership
10
20
30
40
50
60
70
80
90
100
Yes No
86
97
17
44
Nu
mb
er o
f A
pp
lican
ts
Graduate of One of the 40 U.S. MedicalSchools with the Highest NIH Funding
0
20
40
60
80
100
120
140
160
180
Yes No
16
167
4
57
Nu
mb
er o
f A
pp
lican
ts
Ph.D. Degree
0
20
40
60
80
100
120
140
160
Yes No
39
144
13
48
Nu
mb
er o
f A
pp
lican
ts
Other Graduate Degree
Matched Not Matched
N Neurology
Copyright ©2016 NRMP. Reproduction prohibited without the written permission of the NRMP.
108 Charting Outcomes in the Matchfor U.S. Allopathic Seniors, 2016

Table N-1
Summary Statistics on U.S. Allopathic SeniorsNeurology
Measure (n=391) (n=12)
Matched Unmatched
11.5 6.8Mean number of contiguous ranks1.
1.2 1.7Mean number of distinct specialties ranked2.
231 216Mean USMLE Step 1 score3.
243 223Mean USMLE Step 2 score4.
3.1 1.9Mean number of research experiences5.
5.1 1.9Mean number of abstracts, presentations, and publications6.
2.9 1.9Mean number of work experiences7.
6.1 4.1Mean number of volunteer experiences8.
12.5 0.0Percentage who are AOA members9.
34.0 0.0Percentage who graduated from one of the 40 U.S. medical schools with the highest NIH funding
10.
10.3 0.0Percentage who have Ph.D. degree11.
17.6 0.0Percentage who have another graduate degree12.
Note: Only U.S. allopathic seniors who gave consent to use their information in research are included. Sources. NRMP Data Warehouse; Top 40 U.S. medical schools with the highest NIH funding in measure 10 is from the NIH website (http://report.nih.gov/award/index.cfm).
Copyright ©2016 NRMP. Reproduction prohibited without the written permission of the NRMP.
109 Charting Outcomes in the Matchfor U.S. Allopathic Seniors, 2016

0
50
100
150
200
250
300
350
1 2 3 4 or More
323
62
6 07 3 1 1
Matched Not Matched
Distinct Specialties Ranked
Nu
mb
er o
f A
pp
lican
ts
0
10
20
30
40
50
60
70
1 2 3 4 5 6 7 8 9 10 11 12 13 14 15 16 orMore
8
17 6
12
27
14
22 2428
3945
24
40
27
67
1 3 1 0 2 0 1 1 0 0 1 0 0 0 1 1
Matched Not Matched
Contiguous Ranks
Nu
mb
er o
f A
pp
lican
ts
Chart N-2
Number of Contiguous Ranks of U.S. Allopathic SeniorsNeurology
Source: NRMP Data Warehouse
Copyright ©2016 NRMP. Reproduction prohibited without the written permission of the NRMP.
110
Chart N-1
Number of Distinct Specialties Ranked by U.S. Allopathic SeniorsNeurology
Charting Outcomes in the Match for U.S. Allopathic Seniors, 2016

Probability of U.S. Allopathic Seniors Matching to Preferred Specialty by Number of Contiguous RanksNeurology
Graph N-1
0.00
0.10
0.20
0.30
0.40
0.50
0.60
0.70
0.80
0.90
1.00
0 1 2 3 4 5 6 7 8 9 10 11 12 13 14 15 16 17 18 19 20
Number of Contiguous Ranks
Probability of Matching
Source: NRMP Data Warehouse. Note: Probabilities calculated based on 2014-2016 applicants
111Copyright ©2016 NRMP. Reproduction prohibited without the written permission of the NRMP. Charting Outcomes in the Match for U.S. Allopathic Seniors, 2016
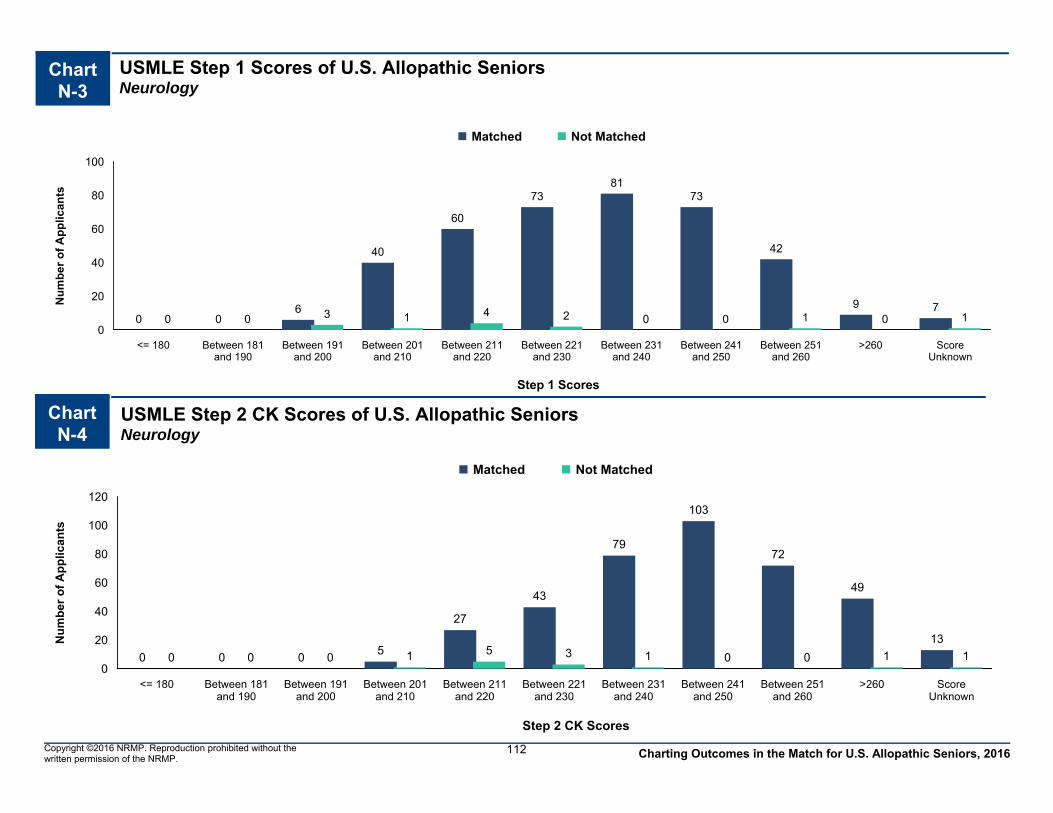
Chart N-3
USMLE Step 1 Scores of U.S. Allopathic SeniorsNeurology
0
20
40
60
80
100
<= 180 Between 181and 190
Between 191and 200
Between 201and 210
Between 211and 220
Between 221and 230
Between 231and 240
Between 241and 250
Between 251and 260
>260 ScoreUnknown
0 06
40
60
7381
73
42
9 70 0 3 1 4 2 0 0 1 0 1
Matched Not Matched
Step 1 Scores
Nu
mb
er
of
Ap
pli
ca
nts
Source: NRMP Data Warehouse
112Copyright ©2016 NRMP. Reproduction prohibited without the written permission of the NRMP.
Chart N-4
USMLE Step 2 CK Scores of U.S. Allopathic SeniorsNeurology
0
20
40
60
80
100
120
<= 180 Between 181and 190
Between 191and 200
Between 201and 210
Between 211and 220
Between 221and 230
Between 231and 240
Between 241and 250
Between 251and 260
>260 ScoreUnknown
0 0 05
27
43
79
103
72
49
13
0 0 0 1 5 3 1 0 0 1 1
Matched Not Matched
Step 2 CK Scores
Nu
mb
er o
f A
pp
lican
ts
Charting Outcomes in the Match for U.S. Allopathic Seniors, 2016

Graph N-2
Probability of U.S. Allopathic Seniors Matching to Preferred Specialty by USMLE Step 1 ScoreNeurology
0.00
0.10
0.20
0.30
0.40
0.50
0.60
0.70
0.80
0.90
1.00
180 200 220 240 260 280
Step 1 Score
Probability of Matching
Source: NRMP Data Warehouse. Note: Probabilities calculated based on 2014-2016 applicants.
113Copyright ©2016 NRMP. Reproduction prohibited without the written permission of the NRMP. Charting Outcomes in the Match for U.S. Allopathic Seniors, 2016

0
20
40
60
80
100
120
140
160
180
None 1 2 3 4 5 or More
45 47 46 4737
169
5 2 0 0 3 2
Matched Not Matched
Publications
Nu
mb
er o
f A
pp
lican
ts
0
20
40
60
80
100
120
None 1 2 3 4 5 or More
10
52
73 76
65
115
2 4 1 2 1 2
Matched Not Matched
Research Projects
Nu
mb
er o
f A
pp
lican
tsChart N-5
Number of Research Projects of U.S. Allopathic SeniorsNeurology
Source: NRMP Data Warehouse
114Copyright ©2016 NRMP. Reproduction prohibited without the written permission of the NRMP.
Chart N-6
Number of Abstracts, Presentations, and Publications of U.S. Allopathic SeniorsNeurology
Charting Outcomes in the Match for U.S. Allopathic Seniors, 2016

0
20
40
60
80
100
120
140
None 1 2 3 4 5 6 7 8 9 10 or More
7 7
33 35 37 41 41
26 26
14
124
0 2 2 0 1 2 0 3 0 0 2
Matched Not Matched
Volunteer Experiences
Nu
mb
er o
f A
pp
lican
ts
0
20
40
60
80
100
120
140
None 1 2 3 4 5 or More
35
56
7160
39
130
3 1 3 1 1 3
Matched Not Matched
Work Experiences
Nu
mb
er o
f A
pp
lican
tsChart N-7
Number of Work Experiences of U.S. Allopathic SeniorsNeurology
Source: NRMP Data Warehouse
115Copyright ©2016 NRMP. Reproduction prohibited without the written permission of the NRMP.
Chart N-8
Number of Volunteer Experiences of U.S. Allopathic SeniorsNeurology
Charting Outcomes in the Match for U.S. Allopathic Seniors, 2016

Chart N-9
Other Characteristics of U.S. SeniorsNeurology
Charting Outcomes in the Match for U.S. Allopathic Seniors, 2016 Copyright ©2016 NRMP. Reproduction prohibited without the written permission of the NRMP.
Source: NRMP Data Warehouse. Top 40 U.S. medical schools with the highest NIH funding from NIH: http://report.nih.gov/award/index.cfm
116
0
40
80
120
160
200
240
280
320
Yes No
49
304
011
Nu
mb
er
of
Ap
pli
ca
nts
AOA Membership
0
40
80
120
160
200
240
280
Yes No
133
258
012
Nu
mb
er o
f A
pp
lican
ts
Graduate of One of the 40 U.S. MedicalSchools with the Highest NIH Funding
0
50
100
150
200
250
300
350
400
Yes No
37
354
0 12
Nu
mb
er o
f A
pp
lican
ts
Ph.D. Degree
0
50
100
150
200
250
300
350
Yes No
63
328
012
Nu
mb
er o
f A
pp
lican
ts
Other Graduate Degree
Matched Not Matched

OB Obstetrics and Gynecology
Copyright ©2016 NRMP. Reproduction prohibited without the written permission of the NRMP.
117 Charting Outcomes in the Matchfor U.S. Allopathic Seniors, 2016

Table OB-1
Summary Statistics on U.S. Allopathic SeniorsObstetrics and Gynecology
Measure (n=921) (n=84)
Matched Unmatched
12.5 6.7Mean number of contiguous ranks1.
1.0 1.4Mean number of distinct specialties ranked2.
229 214Mean USMLE Step 1 score3.
244 230Mean USMLE Step 2 score4.
3.2 2.8Mean number of research experiences5.
4.2 2.9Mean number of abstracts, presentations, and publications6.
3.4 3.4Mean number of work experiences7.
8.0 8.3Mean number of volunteer experiences8.
14.8 2.4Percentage who are AOA members9.
31.2 29.8Percentage who graduated from one of the 40 U.S. medical schools with the highest NIH funding
10.
2.0 0.0Percentage who have Ph.D. degree11.
15.9 23.2Percentage who have another graduate degree12.
Note: Only U.S. allopathic seniors who gave consent to use their information in research are included. Sources. NRMP Data Warehouse; Top 40 U.S. medical schools with the highest NIH funding in measure 10 is from the NIH website (http://report.nih.gov/award/index.cfm).
Copyright ©2016 NRMP. Reproduction prohibited without the written permission of the NRMP.
118 Charting Outcomes in the Matchfor U.S. Allopathic Seniors, 2016

0
200
400
600
800
1,000
1 2 3 4 or More
888
330 0
54 26 3 1
Matched Not Matched
Distinct Specialties Ranked
Nu
mb
er o
f A
pp
lican
ts
0
40
80
120
160
200
240
1 2 3 4 5 6 7 8 9 10 11 12 13 14 15 16 orMore
7 8 6 10 19 1736 30
6485 87
71
98 103
79
201
16 11 6 6 7 1 6 3 3 3 4 4 2 1 7 4
Matched Not Matched
Contiguous Ranks
Nu
mb
er o
f A
pp
lican
ts
Chart OB-2
Number of Contiguous Ranks of U.S. Allopathic SeniorsObstetrics and Gynecology
Source: NRMP Data Warehouse
Copyright ©2016 NRMP. Reproduction prohibited without the written permission of the NRMP.
119
Chart OB-1
Number of Distinct Specialties Ranked by U.S. Allopathic SeniorsObstetrics and Gynecology
Charting Outcomes in the Match for U.S. Allopathic Seniors, 2016

Probability of U.S. Allopathic Seniors Matching to Preferred Specialty by Number of Contiguous RanksObstetrics and Gynecology
Graph OB-1
0.00
0.10
0.20
0.30
0.40
0.50
0.60
0.70
0.80
0.90
1.00
0 1 2 3 4 5 6 7 8 9 10 11 12 13 14 15 16 17 18 19 20
Number of Contiguous Ranks
Probability of Matching
Source: NRMP Data Warehouse. Note: Probabilities calculated based on 2014-2016 applicants
120Copyright ©2016 NRMP. Reproduction prohibited without the written permission of the NRMP. Charting Outcomes in the Match for U.S. Allopathic Seniors, 2016

Chart OB-3
USMLE Step 1 Scores of U.S. Allopathic SeniorsObstetrics and Gynecology
0
40
80
120
160
200
240
<= 180 Between 181and 190
Between 191and 200
Between 201and 210
Between 211and 220
Between 221and 230
Between 231and 240
Between 241and 250
Between 251and 260
>260 ScoreUnknown
0 1
40
82
164
215
187
148
63
10 110 1
15 22 14 13 10 3 0 0 6
Matched Not Matched
Step 1 Scores
Nu
mb
er
of
Ap
pli
ca
nts
Source: NRMP Data Warehouse
121Copyright ©2016 NRMP. Reproduction prohibited without the written permission of the NRMP.
Chart OB-4
USMLE Step 2 CK Scores of U.S. Allopathic SeniorsObstetrics and Gynecology
0
40
80
120
160
200
240
<= 180 Between 181and 190
Between 191and 200
Between 201and 210
Between 211and 220
Between 221and 230
Between 231and 240
Between 241and 250
Between 251and 260
>260 ScoreUnknown
0 0 0 6
42
115
197
228205
105
230 0 1 2
20 18 16 11 5 2 9
Matched Not Matched
Step 2 CK Scores
Nu
mb
er o
f A
pp
lican
ts
Charting Outcomes in the Match for U.S. Allopathic Seniors, 2016
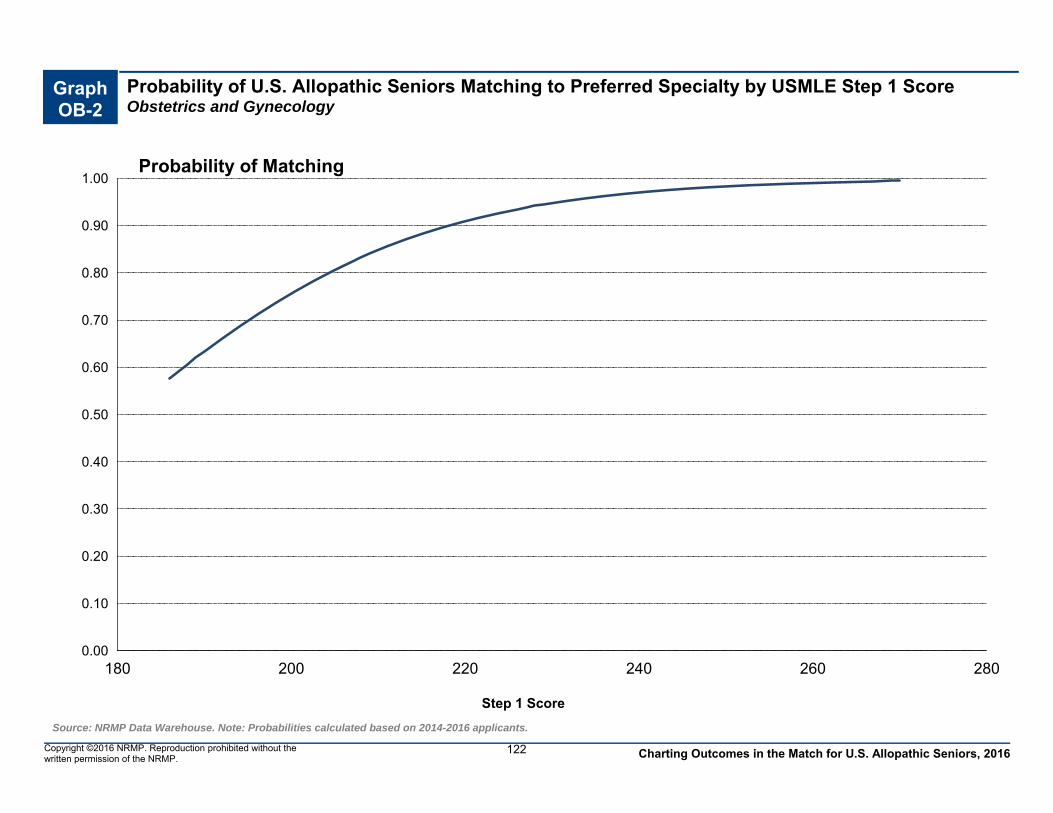
Graph OB-2
Probability of U.S. Allopathic Seniors Matching to Preferred Specialty by USMLE Step 1 ScoreObstetrics and Gynecology
0.00
0.10
0.20
0.30
0.40
0.50
0.60
0.70
0.80
0.90
1.00
180 200 220 240 260 280
Step 1 Score
Probability of Matching
Source: NRMP Data Warehouse. Note: Probabilities calculated based on 2014-2016 applicants.
122Copyright ©2016 NRMP. Reproduction prohibited without the written permission of the NRMP. Charting Outcomes in the Match for U.S. Allopathic Seniors, 2016

0
50
100
150
200
250
300
350
400
None 1 2 3 4 5 or More
119 121 111 119
73
378
14 6 12 13 2
37
Matched Not Matched
Publications
Nu
mb
er o
f A
pp
lican
ts
0
40
80
120
160
200
240
280
None 1 2 3 4 5 or More
34
109
173
200
138
267
7 719 14 10
27
Matched Not Matched
Research Projects
Nu
mb
er o
f A
pp
lican
tsChart OB-5
Number of Research Projects of U.S. Allopathic SeniorsObstetrics and Gynecology
Source: NRMP Data Warehouse
123Copyright ©2016 NRMP. Reproduction prohibited without the written permission of the NRMP.
Chart OB-6
Number of Abstracts, Presentations, and Publications of U.S. Allopathic SeniorsObstetrics and Gynecology
Charting Outcomes in the Match for U.S. Allopathic Seniors, 2016

0
50
100
150
200
250
300
350
400
None 1 2 3 4 5 6 7 8 9 10 or More
1 1039 43
75 83 96
63 7153
387
1 1 2 3 4 5 3 11 3 4
47
Matched Not Matched
Volunteer Experiences
Nu
mb
er o
f A
pp
lican
ts
0
50
100
150
200
250
300
350
None 1 2 3 4 5 or More
67
112
169
138
103
332
6 5 16 9 9
39
Matched Not Matched
Work Experiences
Nu
mb
er o
f A
pp
lican
tsChart OB-7
Number of Work Experiences of U.S. Allopathic SeniorsObstetrics and Gynecology
Source: NRMP Data Warehouse
124Copyright ©2016 NRMP. Reproduction prohibited without the written permission of the NRMP.
Chart OB-8
Number of Volunteer Experiences of U.S. Allopathic SeniorsObstetrics and Gynecology
Charting Outcomes in the Match for U.S. Allopathic Seniors, 2016

Chart OB-9
Other Characteristics of U.S. SeniorsObstetrics and Gynecology
Charting Outcomes in the Match for U.S. Allopathic Seniors, 2016 Copyright ©2016 NRMP. Reproduction prohibited without the written permission of the NRMP.
Source: NRMP Data Warehouse. Top 40 U.S. medical schools with the highest NIH funding from NIH: http://report.nih.gov/award/index.cfm
125
0
100
200
300
400
500
600
700
800
Yes No
136
709
2
67
Nu
mb
er
of
Ap
pli
ca
nts
AOA Membership
0
100
200
300
400
500
600
700
Yes No
287
634
2559
Nu
mb
er o
f A
pp
lican
ts
Graduate of One of the 40 U.S. MedicalSchools with the Highest NIH Funding
0
200
400
600
800
1,000
Yes No
17
904
0
84
Nu
mb
er o
f A
pp
lican
ts
Ph.D. Degree
0
100
200
300
400
500
600
700
800
Yes No
135
786
1668
Nu
mb
er o
f A
pp
lican
ts
Other Graduate Degree
Matched Not Matched

ORS Orthopaedic Surgery
Copyright ©2016 NRMP. Reproduction prohibited without the written permission of the NRMP.
126 Charting Outcomes in the Matchfor U.S. Allopathic Seniors, 2016

Table ORS-1
Summary Statistics on U.S. Allopathic SeniorsOrthopaedic Surgery
Measure (n=622) (n=188)
Matched Unmatched
12.1 6.8Mean number of contiguous ranks1.
1.1 1.3Mean number of distinct specialties ranked2.
247 238Mean USMLE Step 1 score3.
253 245Mean USMLE Step 2 score4.
4.0 3.8Mean number of research experiences5.
8.2 4.9Mean number of abstracts, presentations, and publications6.
3.2 3.3Mean number of work experiences7.
6.7 6.7Mean number of volunteer experiences8.
34.4 12.2Percentage who are AOA members9.
35.7 23.4Percentage who graduated from one of the 40 U.S. medical schools with the highest NIH funding
10.
2.1 2.9Percentage who have Ph.D. degree11.
16.9 18.5Percentage who have another graduate degree12.
Note: Only U.S. allopathic seniors who gave consent to use their information in research are included. Sources. NRMP Data Warehouse; Top 40 U.S. medical schools with the highest NIH funding in measure 10 is from the NIH website (http://report.nih.gov/award/index.cfm).
Copyright ©2016 NRMP. Reproduction prohibited without the written permission of the NRMP.
127 Charting Outcomes in the Matchfor U.S. Allopathic Seniors, 2016

0
100
200
300
400
500
600
1 2 3 4 or More
586
332 1
141
406 0
Matched Not Matched
Distinct Specialties Ranked
Nu
mb
er o
f A
pp
lican
ts
0
20
40
60
80
100
120
140
160
1 2 3 4 5 6 7 8 9 10 11 12 13 14 15 16 orMore
4 3 1
1730 32 36 34
4939
4654
39 3952
147
11 14 19 19 2417 12 16
8 12 11 8 4 2 3 8
Matched Not Matched
Contiguous Ranks
Nu
mb
er o
f A
pp
lican
ts
Chart ORS-2
Number of Contiguous Ranks of U.S. Allopathic SeniorsOrthopaedic Surgery
Source: NRMP Data Warehouse
Copyright ©2016 NRMP. Reproduction prohibited without the written permission of the NRMP.
128
Chart ORS-1
Number of Distinct Specialties Ranked by U.S. Allopathic SeniorsOrthopaedic Surgery
Charting Outcomes in the Match for U.S. Allopathic Seniors, 2016

Probability of U.S. Allopathic Seniors Matching to Preferred Specialty by Number of Contiguous RanksOrthopaedic Surgery
Graph ORS-1
0.00
0.10
0.20
0.30
0.40
0.50
0.60
0.70
0.80
0.90
1.00
0 1 2 3 4 5 6 7 8 9 10 11 12 13 14 15 16 17 18 19 20
Number of Contiguous Ranks
Probability of Matching
Source: NRMP Data Warehouse. Note: Probabilities calculated based on 2014-2016 applicants
129Copyright ©2016 NRMP. Reproduction prohibited without the written permission of the NRMP. Charting Outcomes in the Match for U.S. Allopathic Seniors, 2016

Chart ORS-3
USMLE Step 1 Scores of U.S. Allopathic SeniorsOrthopaedic Surgery
0
40
80
120
160
200
<= 180 Between 181and 190
Between 191and 200
Between 201and 210
Between 211and 220
Between 221and 230
Between 231and 240
Between 241and 250
Between 251and 260
>260 ScoreUnknown
0 0 0 4 10
42
108
199
180
74
50 0 5 514
2744
5236
5 0
Matched Not Matched
Step 1 Scores
Nu
mb
er
of
Ap
pli
ca
nts
Source: NRMP Data Warehouse
130Copyright ©2016 NRMP. Reproduction prohibited without the written permission of the NRMP.
Chart ORS-4
USMLE Step 2 CK Scores of U.S. Allopathic SeniorsOrthopaedic Surgery
0
40
80
120
160
200
<= 180 Between 181and 190
Between 191and 200
Between 201and 210
Between 211and 220
Between 221and 230
Between 231and 240
Between 241and 250
Between 251and 260
>260 ScoreUnknown
0 0 0 0 4
26
63
147
191
158
33
0 0 0 1 520
3653
43
228
Matched Not Matched
Step 2 CK Scores
Nu
mb
er o
f A
pp
lican
ts
Charting Outcomes in the Match for U.S. Allopathic Seniors, 2016

Graph ORS-2
Probability of U.S. Allopathic Seniors Matching to Preferred Specialty by USMLE Step 1 ScoreOrthopaedic Surgery
0.00
0.10
0.20
0.30
0.40
0.50
0.60
0.70
0.80
0.90
1.00
180 200 220 240 260 280
Step 1 Score
Probability of Matching
Source: NRMP Data Warehouse. Note: Probabilities calculated based on 2014-2016 applicants.
131Copyright ©2016 NRMP. Reproduction prohibited without the written permission of the NRMP. Charting Outcomes in the Match for U.S. Allopathic Seniors, 2016

0
50
100
150
200
250
300
350
400
None 1 2 3 4 5 or More
3650 47 59 64
366
21 28 22 24 14
79
Matched Not Matched
Publications
Nu
mb
er o
f A
pp
lican
ts
0
40
80
120
160
200
240
None 1 2 3 4 5 or More
5
47
103
128108
231
318
43 3521
68
Matched Not Matched
Research Projects
Nu
mb
er o
f A
pp
lican
tsChart ORS-5
Number of Research Projects of U.S. Allopathic SeniorsOrthopaedic Surgery
Source: NRMP Data Warehouse
132Copyright ©2016 NRMP. Reproduction prohibited without the written permission of the NRMP.
Chart ORS-6
Number of Abstracts, Presentations, and Publications of U.S. Allopathic SeniorsOrthopaedic Surgery
Charting Outcomes in the Match for U.S. Allopathic Seniors, 2016

0
40
80
120
160
200
240
None 1 2 3 4 5 6 7 8 9 10 or More
5 12
3857 63 62 56
45 52
26
206
1 5 12 13 16 2210
2513 8
63
Matched Not Matched
Volunteer Experiences
Nu
mb
er o
f A
pp
lican
ts
0
40
80
120
160
200
240
None 1 2 3 4 5 or More
32
84
11496 93
203
1223
34 27 23
69
Matched Not Matched
Work Experiences
Nu
mb
er o
f A
pp
lican
tsChart ORS-7
Number of Work Experiences of U.S. Allopathic SeniorsOrthopaedic Surgery
Source: NRMP Data Warehouse
133Copyright ©2016 NRMP. Reproduction prohibited without the written permission of the NRMP.
Chart ORS-8
Number of Volunteer Experiences of U.S. Allopathic SeniorsOrthopaedic Surgery
Charting Outcomes in the Match for U.S. Allopathic Seniors, 2016

Chart ORS-9
Other Characteristics of U.S. SeniorsOrthopaedic Surgery
Charting Outcomes in the Match for U.S. Allopathic Seniors, 2016 Copyright ©2016 NRMP. Reproduction prohibited without the written permission of the NRMP.
Source: NRMP Data Warehouse. Top 40 U.S. medical schools with the highest NIH funding from NIH: http://report.nih.gov/award/index.cfm
134
0
50
100
150
200
250
300
350
400
Yes No
214
356
23
142
Nu
mb
er
of
Ap
pli
ca
nts
AOA Membership
0
50
100
150
200
250
300
350
400
Yes No
222
400
44
144
Nu
mb
er o
f A
pp
lican
ts
Graduate of One of the 40 U.S. MedicalSchools with the Highest NIH Funding
0
100
200
300
400
500
600
700
Yes No
12
610
5
183
Nu
mb
er o
f A
pp
lican
ts
Ph.D. Degree
0
100
200
300
400
500
600
Yes No
98
524
32
156
Nu
mb
er o
f A
pp
lican
ts
Other Graduate Degree
Matched Not Matched

OTO Otolaryngology
Copyright ©2016 NRMP. Reproduction prohibited without the written permission of the NRMP.
135 Charting Outcomes in the Matchfor U.S. Allopathic Seniors, 2016

Table OTO-1
Summary Statistics on U.S. Allopathic SeniorsOtolaryngology
Measure (n=257) (n=33)
Matched Unmatched
12.7 7.5Mean number of contiguous ranks1.
1.1 1.2Mean number of distinct specialties ranked2.
248 240Mean USMLE Step 1 score3.
253 247Mean USMLE Step 2 score4.
5.1 4.7Mean number of research experiences5.
8.4 6.7Mean number of abstracts, presentations, and publications6.
3.0 2.7Mean number of work experiences7.
7.4 6.9Mean number of volunteer experiences8.
44.7 15.2Percentage who are AOA members9.
40.1 36.4Percentage who graduated from one of the 40 U.S. medical schools with the highest NIH funding
10.
3.3 3.3Percentage who have Ph.D. degree11.
11.3 20.7Percentage who have another graduate degree12.
Note: Only U.S. allopathic seniors who gave consent to use their information in research are included. Sources. NRMP Data Warehouse; Top 40 U.S. medical schools with the highest NIH funding in measure 10 is from the NIH website (http://report.nih.gov/award/index.cfm).
Copyright ©2016 NRMP. Reproduction prohibited without the written permission of the NRMP.
136 Charting Outcomes in the Matchfor U.S. Allopathic Seniors, 2016

0
40
80
120
160
200
240
1 2 3 4 or More
229
25
3 0
26
6 1 0
Matched Not Matched
Distinct Specialties Ranked
Nu
mb
er o
f A
pp
lican
ts
0
10
20
30
40
50
60
70
80
1 2 3 4 5 6 7 8 9 10 11 12 13 14 15 16 orMore
3 2 38 6 7 9 8
17 2016
25
17 20 19
77
3 1 2 2 5 3 2 3 2 1 3 3 1 0 0 2
Matched Not Matched
Contiguous Ranks
Nu
mb
er o
f A
pp
lican
ts
Chart OTO-2
Number of Contiguous Ranks of U.S. Allopathic SeniorsOtolaryngology
Source: NRMP Data Warehouse
Copyright ©2016 NRMP. Reproduction prohibited without the written permission of the NRMP.
137
Chart OTO-1
Number of Distinct Specialties Ranked by U.S. Allopathic SeniorsOtolaryngology
Charting Outcomes in the Match for U.S. Allopathic Seniors, 2016

Probability of U.S. Allopathic Seniors Matching to Preferred Specialty by Number of Contiguous RanksOtolaryngology
Graph OTO-1
0.00
0.10
0.20
0.30
0.40
0.50
0.60
0.70
0.80
0.90
1.00
0 1 2 3 4 5 6 7 8 9 10 11 12 13 14 15 16 17 18 19 20
Number of Contiguous Ranks
Probability of Matching
Source: NRMP Data Warehouse. Note: Probabilities calculated based on 2014-2016 applicants
138Copyright ©2016 NRMP. Reproduction prohibited without the written permission of the NRMP. Charting Outcomes in the Match for U.S. Allopathic Seniors, 2016

Chart OTO-3
USMLE Step 1 Scores of U.S. Allopathic SeniorsOtolaryngology
0
20
40
60
80
100
<= 180 Between 181and 190
Between 191and 200
Between 201and 210
Between 211and 220
Between 221and 230
Between 231and 240
Between 241and 250
Between 251and 260
>260 ScoreUnknown
0 0 2 1 412
38
73
98
27
20 0 0 0 2 2
12 125
0 0
Matched Not Matched
Step 1 Scores
Nu
mb
er
of
Ap
pli
ca
nts
Source: NRMP Data Warehouse
139Copyright ©2016 NRMP. Reproduction prohibited without the written permission of the NRMP.
Chart OTO-4
USMLE Step 2 CK Scores of U.S. Allopathic SeniorsOtolaryngology
0
20
40
60
80
100
<= 180 Between 181and 190
Between 191and 200
Between 201and 210
Between 211and 220
Between 221and 230
Between 231and 240
Between 241and 250
Between 251and 260
>260 ScoreUnknown
0 0 0 0 28
26
56
87
67
11
0 0 0 0 1 18 11
7 50
Matched Not Matched
Step 2 CK Scores
Nu
mb
er o
f A
pp
lican
ts
Charting Outcomes in the Match for U.S. Allopathic Seniors, 2016

Graph OTO-2
Probability of U.S. Allopathic Seniors Matching to Preferred Specialty by USMLE Step 1 ScoreOtolaryngology
0.00
0.10
0.20
0.30
0.40
0.50
0.60
0.70
0.80
0.90
1.00
180 200 220 240 260 280
Step 1 Score
Probability of Matching
Source: NRMP Data Warehouse. Note: Probabilities calculated based on 2014-2016 applicants.
140Copyright ©2016 NRMP. Reproduction prohibited without the written permission of the NRMP. Charting Outcomes in the Match for U.S. Allopathic Seniors, 2016

0
40
80
120
160
200
None 1 2 3 4 5 or More
5 11 1017 21
193
1 1 1 2 5
23
Matched Not Matched
Publications
Nu
mb
er o
f A
pp
lican
ts
0
20
40
60
80
100
120
140
160
None 1 2 3 4 5 or More
0 415
27
57
154
1 0 2 5 5
20
Matched Not Matched
Research Projects
Nu
mb
er o
f A
pp
lican
tsChart OTO-5
Number of Research Projects of U.S. Allopathic SeniorsOtolaryngology
Source: NRMP Data Warehouse
141Copyright ©2016 NRMP. Reproduction prohibited without the written permission of the NRMP.
Chart OTO-6
Number of Abstracts, Presentations, and Publications of U.S. Allopathic SeniorsOtolaryngology
Charting Outcomes in the Match for U.S. Allopathic Seniors, 2016

0
20
40
60
80
100
None 1 2 3 4 5 6 7 8 9 10 or More
0 311
17 20
29 3025
1913
90
1 2 04 1
5 3 3 0 1
13
Matched Not Matched
Volunteer Experiences
Nu
mb
er o
f A
pp
lican
ts
0
20
40
60
80
100
None 1 2 3 4 5 or More
24
4335
3931
85
2 38 6 6 8
Matched Not Matched
Work Experiences
Nu
mb
er o
f A
pp
lican
tsChart OTO-7
Number of Work Experiences of U.S. Allopathic SeniorsOtolaryngology
Source: NRMP Data Warehouse
142Copyright ©2016 NRMP. Reproduction prohibited without the written permission of the NRMP.
Chart OTO-8
Number of Volunteer Experiences of U.S. Allopathic SeniorsOtolaryngology
Charting Outcomes in the Match for U.S. Allopathic Seniors, 2016

Chart OTO-9
Other Characteristics of U.S. SeniorsOtolaryngology
Charting Outcomes in the Match for U.S. Allopathic Seniors, 2016 Copyright ©2016 NRMP. Reproduction prohibited without the written permission of the NRMP.
Source: NRMP Data Warehouse. Top 40 U.S. medical schools with the highest NIH funding from NIH: http://report.nih.gov/award/index.cfm
143
0
20
40
60
80
100
120
140
Yes No
115123
5
23Nu
mb
er
of
Ap
pli
ca
nts
AOA Membership
0
20
40
60
80
100
120
140
160
Yes No
103
154
1221
Nu
mb
er o
f A
pp
lican
ts
Graduate of One of the 40 U.S. MedicalSchools with the Highest NIH Funding
0
40
80
120
160
200
240
280
Yes No
8
249
1
32
Nu
mb
er o
f A
pp
lican
ts
Ph.D. Degree
0
40
80
120
160
200
240
Yes No
27
230
6
27
Nu
mb
er o
f A
pp
lican
ts
Other Graduate Degree
Matched Not Matched

PTH Pathology
Copyright ©2016 NRMP. Reproduction prohibited without the written permission of the NRMP.
144 Charting Outcomes in the Matchfor U.S. Allopathic Seniors, 2016

Table PTH-1
Summary Statistics on U.S. Allopathic SeniorsPathology
Measure (n=218) (n=8)
Matched Unmatched
9.9 5.1Mean number of contiguous ranks1.
1.0 1.0Mean number of distinct specialties ranked2.
233 210Mean USMLE Step 1 score3.
243 225Mean USMLE Step 2 score4.
2.8 2.4Mean number of research experiences5.
5.9 7.6Mean number of abstracts, presentations, and publications6.
3.0 3.4Mean number of work experiences7.
5.2 3.6Mean number of volunteer experiences8.
13.3 0.0Percentage who are AOA members9.
37.6 12.5Percentage who graduated from one of the 40 U.S. medical schools with the highest NIH funding
10.
22.4 20.0Percentage who have Ph.D. degree11.
16.0 20.0Percentage who have another graduate degree12.
Note: Only U.S. allopathic seniors who gave consent to use their information in research are included. Sources. NRMP Data Warehouse; Top 40 U.S. medical schools with the highest NIH funding in measure 10 is from the NIH website (http://report.nih.gov/award/index.cfm).
Copyright ©2016 NRMP. Reproduction prohibited without the written permission of the NRMP.
145 Charting Outcomes in the Matchfor U.S. Allopathic Seniors, 2016

0
40
80
120
160
200
240
1 2 3 4 or More
216
2 0 08
0 0 0
Matched Not Matched
Distinct Specialties Ranked
Nu
mb
er o
f A
pp
lican
ts
0
4
8
12
16
20
24
1 2 3 4 5 6 7 8 9 10 11 12 13 14 15 16 orMore
65
45
8
18
13
19
23 23
2018
13
17
9
17
1 10
13
0 0 01 1
0 0 0 0 0 0
Matched Not Matched
Contiguous Ranks
Nu
mb
er o
f A
pp
lican
ts
Chart PTH-2
Number of Contiguous Ranks of U.S. Allopathic SeniorsPathology
Source: NRMP Data Warehouse
Copyright ©2016 NRMP. Reproduction prohibited without the written permission of the NRMP.
146
Chart PTH-1
Number of Distinct Specialties Ranked by U.S. Allopathic SeniorsPathology
Charting Outcomes in the Match for U.S. Allopathic Seniors, 2016
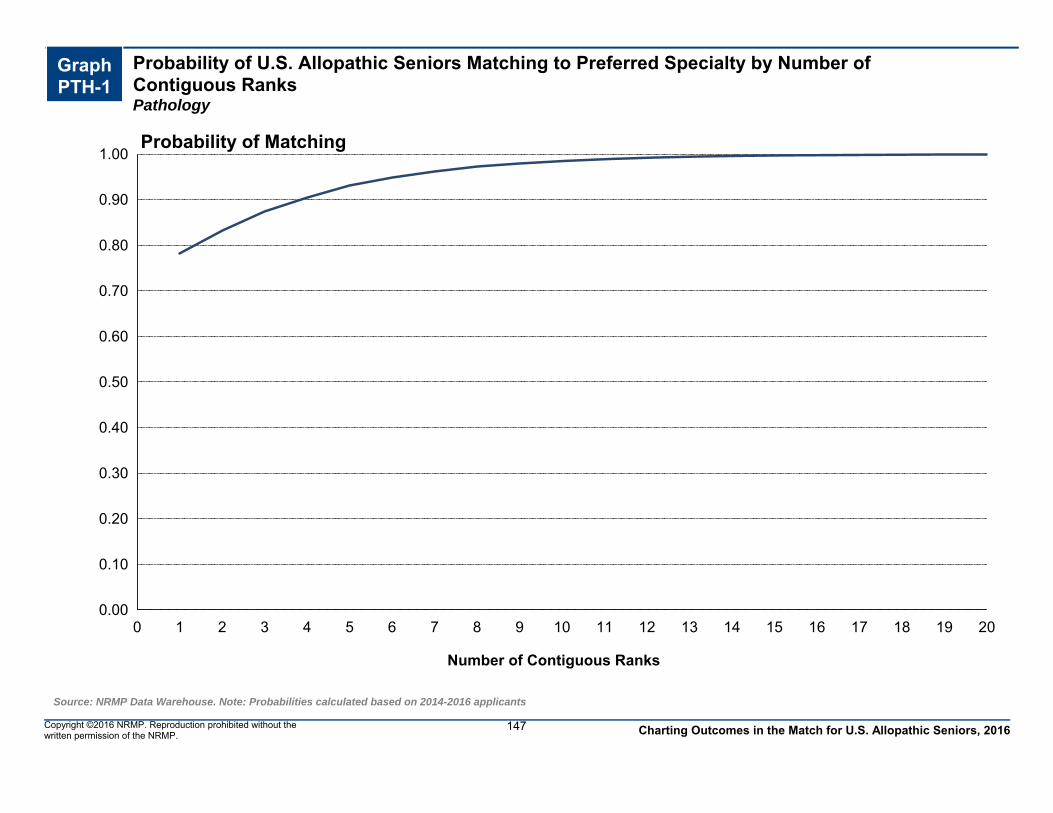
Probability of U.S. Allopathic Seniors Matching to Preferred Specialty by Number of Contiguous RanksPathology
Graph PTH-1
0.00
0.10
0.20
0.30
0.40
0.50
0.60
0.70
0.80
0.90
1.00
0 1 2 3 4 5 6 7 8 9 10 11 12 13 14 15 16 17 18 19 20
Number of Contiguous Ranks
Probability of Matching
Source: NRMP Data Warehouse. Note: Probabilities calculated based on 2014-2016 applicants
147Copyright ©2016 NRMP. Reproduction prohibited without the written permission of the NRMP. Charting Outcomes in the Match for U.S. Allopathic Seniors, 2016

Chart PTH-3
USMLE Step 1 Scores of U.S. Allopathic SeniorsPathology
0
5
10
15
20
25
30
35
40
<= 180 Between 181and 190
Between 191and 200
Between 201and 210
Between 211and 220
Between 221and 230
Between 231and 240
Between 241and 250
Between 251and 260
>260 ScoreUnknown
0 0
9
21
28
34
40
36
31
14
5
0 1 2 2 20 0 1 0 0 0
Matched Not Matched
Step 1 Scores
Nu
mb
er
of
Ap
pli
ca
nts
Source: NRMP Data Warehouse
148Copyright ©2016 NRMP. Reproduction prohibited without the written permission of the NRMP.
Chart PTH-4
USMLE Step 2 CK Scores of U.S. Allopathic SeniorsPathology
0
5
10
15
20
25
30
35
40
45
<= 180 Between 181and 190
Between 191and 200
Between 201and 210
Between 211and 220
Between 221and 230
Between 231and 240
Between 241and 250
Between 251and 260
>260 ScoreUnknown
0 0 1 2
14
35 35
45
39
32
15
0 0 0 03
1 2 1 0 0 1
Matched Not Matched
Step 2 CK Scores
Nu
mb
er o
f A
pp
lican
ts
Charting Outcomes in the Match for U.S. Allopathic Seniors, 2016

Graph PTH-2
Probability of U.S. Allopathic Seniors Matching to Preferred Specialty by USMLE Step 1 ScorePathology
0.00
0.10
0.20
0.30
0.40
0.50
0.60
0.70
0.80
0.90
1.00
180 200 220 240 260 280
Step 1 Score
Probability of Matching
Source: NRMP Data Warehouse. Note: Probabilities calculated based on 2014-2016 applicants.
149Copyright ©2016 NRMP. Reproduction prohibited without the written permission of the NRMP. Charting Outcomes in the Match for U.S. Allopathic Seniors, 2016

0
20
40
60
80
100
120
None 1 2 3 4 5 or More
3526
2014 12
111
1 1 0 0 15
Matched Not Matched
Publications
Nu
mb
er o
f A
pp
lican
ts
0
10
20
30
40
50
60
None 1 2 3 4 5 or More
16
3936
41
26
60
0 1 2 1 1 3
Matched Not Matched
Research Projects
Nu
mb
er o
f A
pp
lican
tsChart PTH-5
Number of Research Projects of U.S. Allopathic SeniorsPathology
Source: NRMP Data Warehouse
150Copyright ©2016 NRMP. Reproduction prohibited without the written permission of the NRMP.
Chart PTH-6
Number of Abstracts, Presentations, and Publications of U.S. Allopathic SeniorsPathology
Charting Outcomes in the Match for U.S. Allopathic Seniors, 2016

0
10
20
30
40
50
60
70
None 1 2 3 4 5 6 7 8 9 10 or More
4
15
2125 24
1916
1013
2
69
0 0 1 2 1 0 1 0 0 03
Matched Not Matched
Volunteer Experiences
Nu
mb
er o
f A
pp
lican
ts
0
10
20
30
40
50
60
70
80
None 1 2 3 4 5 or More
14
35
28
43
18
80
0 1 1 2 04
Matched Not Matched
Work Experiences
Nu
mb
er o
f A
pp
lican
tsChart PTH-7
Number of Work Experiences of U.S. Allopathic SeniorsPathology
Source: NRMP Data Warehouse
151Copyright ©2016 NRMP. Reproduction prohibited without the written permission of the NRMP.
Chart PTH-8
Number of Volunteer Experiences of U.S. Allopathic SeniorsPathology
Charting Outcomes in the Match for U.S. Allopathic Seniors, 2016

Chart PTH-9
Other Characteristics of U.S. SeniorsPathology
Charting Outcomes in the Match for U.S. Allopathic Seniors, 2016 Copyright ©2016 NRMP. Reproduction prohibited without the written permission of the NRMP.
Source: NRMP Data Warehouse. Top 40 U.S. medical schools with the highest NIH funding from NIH: http://report.nih.gov/award/index.cfm
152
0
20
40
60
80
100
120
140
160
Yes No
29
160
05
Nu
mb
er
of
Ap
pli
ca
nts
AOA Membership
0
20
40
60
80
100
120
140
Yes No
82
136
17
Nu
mb
er o
f A
pp
lican
ts
Graduate of One of the 40 U.S. MedicalSchools with the Highest NIH Funding
0
20
40
60
80
100
120
140
160
180
Yes No
44
174
17
Nu
mb
er o
f A
pp
lican
ts
Ph.D. Degree
0
40
80
120
160
200
Yes No
31
187
1 7
Nu
mb
er o
f A
pp
lican
ts
Other Graduate Degree
Matched Not Matched

PD Pediatrics
Copyright ©2016 NRMP. Reproduction prohibited without the written permission of the NRMP.
153 Charting Outcomes in the Matchfor U.S. Allopathic Seniors, 2016

Table PD-1
Summary Statistics on U.S. Allopathic SeniorsPediatrics
Measure (n=1,686) (n=49)
Matched Unmatched
11.9 4.0Mean number of contiguous ranks1.
1.0 1.4Mean number of distinct specialties ranked2.
230 207Mean USMLE Step 1 score3.
244 224Mean USMLE Step 2 score4.
2.5 2.4Mean number of research experiences5.
3.4 4.3Mean number of abstracts, presentations, and publications6.
3.0 3.0Mean number of work experiences7.
7.7 9.6Mean number of volunteer experiences8.
16.0 0.0Percentage who are AOA members9.
29.3 24.5Percentage who graduated from one of the 40 U.S. medical schools with the highest NIH funding
10.
3.4 5.1Percentage who have Ph.D. degree11.
13.6 30.0Percentage who have another graduate degree12.
Note: Only U.S. allopathic seniors who gave consent to use their information in research are included. Sources. NRMP Data Warehouse; Top 40 U.S. medical schools with the highest NIH funding in measure 10 is from the NIH website (http://report.nih.gov/award/index.cfm).
Copyright ©2016 NRMP. Reproduction prohibited without the written permission of the NRMP.
154 Charting Outcomes in the Matchfor U.S. Allopathic Seniors, 2016

0
200
400
600
800
1,000
1,200
1,400
1,600
1,800
1 2 3 4 or More
1,647
34 5 032 15 0 2
Matched Not Matched
Distinct Specialties Ranked
Nu
mb
er o
f A
pp
lican
ts
0
40
80
120
160
200
240
280
320
1 2 3 4 5 6 7 8 9 10 11 12 13 14 15 16 orMore
21 18 12 1441 43
57
104 115
166197 209
144 144118
283
13 9 6 9 2 3 0 3 0 1 1 0 1 0 0 1
Matched Not Matched
Contiguous Ranks
Nu
mb
er o
f A
pp
lican
ts
Chart PD-2
Number of Contiguous Ranks of U.S. Allopathic SeniorsPediatrics
Source: NRMP Data Warehouse
Copyright ©2016 NRMP. Reproduction prohibited without the written permission of the NRMP.
155
Chart PD-1
Number of Distinct Specialties Ranked by U.S. Allopathic SeniorsPediatrics
Charting Outcomes in the Match for U.S. Allopathic Seniors, 2016

Probability of U.S. Allopathic Seniors Matching to Preferred Specialty by Number of Contiguous RanksPediatrics
Graph PD-1
0.00
0.10
0.20
0.30
0.40
0.50
0.60
0.70
0.80
0.90
1.00
0 1 2 3 4 5 6 7 8 9 10 11 12 13 14 15 16 17 18 19 20
Number of Contiguous Ranks
Probability of Matching
Source: NRMP Data Warehouse. Note: Probabilities calculated based on 2014-2016 applicants
156Copyright ©2016 NRMP. Reproduction prohibited without the written permission of the NRMP. Charting Outcomes in the Match for U.S. Allopathic Seniors, 2016

Chart PD-3
USMLE Step 1 Scores of U.S. Allopathic SeniorsPediatrics
0
50
100
150
200
250
300
350
<= 180 Between 181and 190
Between 191and 200
Between 201and 210
Between 211and 220
Between 221and 230
Between 231and 240
Between 241and 250
Between 251and 260
>260 ScoreUnknown
0 4
67
180
251
343321
289
152
39 40
0 418 8 8 3 1 2 2 0 3
Matched Not Matched
Step 1 Scores
Nu
mb
er
of
Ap
pli
ca
nts
Source: NRMP Data Warehouse
157Copyright ©2016 NRMP. Reproduction prohibited without the written permission of the NRMP.
Chart PD-4
USMLE Step 2 CK Scores of U.S. Allopathic SeniorsPediatrics
0
50
100
150
200
250
300
350
400
<= 180 Between 181and 190
Between 191and 200
Between 201and 210
Between 211and 220
Between 221and 230
Between 231and 240
Between 241and 250
Between 251and 260
>260 ScoreUnknown
0 0 1 16
99
200
353 366 359
237
55
0 0 1 4 16 12 5 1 2 1 7
Matched Not Matched
Step 2 CK Scores
Nu
mb
er o
f A
pp
lican
ts
Charting Outcomes in the Match for U.S. Allopathic Seniors, 2016

Graph PD-2
Probability of U.S. Allopathic Seniors Matching to Preferred Specialty by USMLE Step 1 ScorePediatrics
0.00
0.10
0.20
0.30
0.40
0.50
0.60
0.70
0.80
0.90
1.00
180 200 220 240 260 280
Step 1 Score
Probability of Matching
Source: NRMP Data Warehouse. Note: Probabilities calculated based on 2014-2016 applicants.
158Copyright ©2016 NRMP. Reproduction prohibited without the written permission of the NRMP. Charting Outcomes in the Match for U.S. Allopathic Seniors, 2016

0
100
200
300
400
500
600
700
None 1 2 3 4 5 or More
284255 235
169131
612
9 8 5 2 3 22
Matched Not Matched
Publications
Nu
mb
er o
f A
pp
lican
ts
0
50
100
150
200
250
300
350
400
450
None 1 2 3 4 5 or More
106
299
387
297
177
420
6 8 7 6 319
Matched Not Matched
Research Projects
Nu
mb
er o
f A
pp
lican
tsChart PD-5
Number of Research Projects of U.S. Allopathic SeniorsPediatrics
Source: NRMP Data Warehouse
159Copyright ©2016 NRMP. Reproduction prohibited without the written permission of the NRMP.
Chart PD-6
Number of Abstracts, Presentations, and Publications of U.S. Allopathic SeniorsPediatrics
Charting Outcomes in the Match for U.S. Allopathic Seniors, 2016

0
100
200
300
400
500
600
700
None 1 2 3 4 5 6 7 8 9 10 or More
5 22 43
103134
183147 139 147
79
684
1 1 0 2 3 3 1 3 1 529
Matched Not Matched
Volunteer Experiences
Nu
mb
er o
f A
pp
lican
ts
0
100
200
300
400
500
600
None 1 2 3 4 5 or More
123
250
300252
175
586
4 6 3 8 8 20
Matched Not Matched
Work Experiences
Nu
mb
er o
f A
pp
lican
tsChart PD-7
Number of Work Experiences of U.S. Allopathic SeniorsPediatrics
Source: NRMP Data Warehouse
160Copyright ©2016 NRMP. Reproduction prohibited without the written permission of the NRMP.
Chart PD-8
Number of Volunteer Experiences of U.S. Allopathic SeniorsPediatrics
Charting Outcomes in the Match for U.S. Allopathic Seniors, 2016

Chart PD-9
Other Characteristics of U.S. SeniorsPediatrics
Charting Outcomes in the Match for U.S. Allopathic Seniors, 2016 Copyright ©2016 NRMP. Reproduction prohibited without the written permission of the NRMP.
Source: NRMP Data Warehouse. Top 40 U.S. medical schools with the highest NIH funding from NIH: http://report.nih.gov/award/index.cfm
161
0
200
400
600
800
1,000
1,200
1,400
Yes No
269
1,267
0 39
Nu
mb
er
of
Ap
pli
ca
nts
AOA Membership
0
200
400
600
800
1,000
1,200
Yes No
494
1,192
12 37
Nu
mb
er o
f A
pp
lican
ts
Graduate of One of the 40 U.S. MedicalSchools with the Highest NIH Funding
0
200
400
600
800
1,000
1,200
1,400
1,600
1,800
Yes No
52
1,634
2 47
Nu
mb
er o
f A
pp
lican
ts
Ph.D. Degree
0
200
400
600
800
1,000
1,200
1,400
1,600
Yes No
207
1,479
12 37
Nu
mb
er o
f A
pp
lican
ts
Other Graduate Degree
Matched Not Matched

PM Physical Medicine and Rehabilitation
Copyright ©2016 NRMP. Reproduction prohibited without the written permission of the NRMP.
162 Charting Outcomes in the Matchfor U.S. Allopathic Seniors, 2016

Table PM-1
Summary Statistics on U.S. Allopathic SeniorsPhysical Medicine and Rehabilitation
Measure (n=194) (n=23)
Matched Unmatched
14.2 5.6Mean number of contiguous ranks1.
1.6 2.2Mean number of distinct specialties ranked2.
226 210Mean USMLE Step 1 score3.
238 221Mean USMLE Step 2 score4.
8.4 2.3Mean number of research experiences5.
3.9 1.2Mean number of abstracts, presentations, and publications6.
3.6 3.2Mean number of work experiences7.
8.0 3.9Mean number of volunteer experiences8.
6.2 0.0Percentage who are AOA members9.
25.8 8.7Percentage who graduated from one of the 40 U.S. medical schools with the highest NIH funding
10.
2.2 0.0Percentage who have Ph.D. degree11.
15.6 13.6Percentage who have another graduate degree12.
Note: Only U.S. allopathic seniors who gave consent to use their information in research are included. Sources. NRMP Data Warehouse; Top 40 U.S. medical schools with the highest NIH funding in measure 10 is from the NIH website (http://report.nih.gov/award/index.cfm).
Copyright ©2016 NRMP. Reproduction prohibited without the written permission of the NRMP.
163 Charting Outcomes in the Matchfor U.S. Allopathic Seniors, 2016

0
20
40
60
80
100
120
1 2 3 4 or More
108
56
26
46 9 70
Matched Not Matched
Distinct Specialties Ranked
Nu
mb
er o
f A
pp
lican
ts
0
20
40
60
80
100
1 2 3 4 5 6 7 8 9 10 11 12 13 14 15 16 orMore
3 4 2 16 8
15 4 7 8
14 14 15 15
87
7 4 1 0 2 0 1 2 2 0 1 0 0 0 0 3
Matched Not Matched
Contiguous Ranks
Nu
mb
er o
f A
pp
lican
ts
Chart PM-2
Number of Contiguous Ranks of U.S. Allopathic SeniorsPhysical Medicine and Rehabilitation
Source: NRMP Data Warehouse
Copyright ©2016 NRMP. Reproduction prohibited without the written permission of the NRMP.
164
Chart PM-1
Number of Distinct Specialties Ranked by U.S. Allopathic SeniorsPhysical Medicine and Rehabilitation
Charting Outcomes in the Match for U.S. Allopathic Seniors, 2016

Probability of U.S. Allopathic Seniors Matching to Preferred Specialty by Number of Contiguous RanksPhysical Medicine and Rehabilitation
Graph PM-1
0.00
0.10
0.20
0.30
0.40
0.50
0.60
0.70
0.80
0.90
1.00
0 1 2 3 4 5 6 7 8 9 10 11 12 13 14 15 16 17 18 19 20
Number of Contiguous Ranks
Probability of Matching
Source: NRMP Data Warehouse. Note: Probabilities calculated based on 2014-2016 applicants
165Copyright ©2016 NRMP. Reproduction prohibited without the written permission of the NRMP. Charting Outcomes in the Match for U.S. Allopathic Seniors, 2016

Chart PM-3
USMLE Step 1 Scores of U.S. Allopathic SeniorsPhysical Medicine and Rehabilitation
0
5
10
15
20
25
30
35
40
45
<= 180 Between 181and 190
Between 191and 200
Between 201and 210
Between 211and 220
Between 221and 230
Between 231and 240
Between 241and 250
Between 251and 260
>260 ScoreUnknown
0 0
10
24
45
3936
26
10
04
0 0
9
36
2 2 1 0 0 0
Matched Not Matched
Step 1 Scores
Nu
mb
er
of
Ap
pli
ca
nts
Source: NRMP Data Warehouse
166Copyright ©2016 NRMP. Reproduction prohibited without the written permission of the NRMP.
Chart PM-4
USMLE Step 2 CK Scores of U.S. Allopathic SeniorsPhysical Medicine and Rehabilitation
0
5
10
15
20
25
30
35
40
45
<= 180 Between 181and 190
Between 191and 200
Between 201and 210
Between 211and 220
Between 221and 230
Between 231and 240
Between 241and 250
Between 251and 260
>260 ScoreUnknown
0 0 0 1
21
42 4240
29
13
6
0 0 02
8 74
0 0 02
Matched Not Matched
Step 2 CK Scores
Nu
mb
er o
f A
pp
lican
ts
Charting Outcomes in the Match for U.S. Allopathic Seniors, 2016

Graph PM-2
Probability of U.S. Allopathic Seniors Matching to Preferred Specialty by USMLE Step 1 ScorePhysical Medicine and Rehabilitation
0.00
0.10
0.20
0.30
0.40
0.50
0.60
0.70
0.80
0.90
1.00
180 190 200 210 220 230 240 250 260
Step 1 Score
Probability of Matching
Source: NRMP Data Warehouse. Note: Probabilities calculated based on 2014-2016 applicants.
167Copyright ©2016 NRMP. Reproduction prohibited without the written permission of the NRMP. Charting Outcomes in the Match for U.S. Allopathic Seniors, 2016
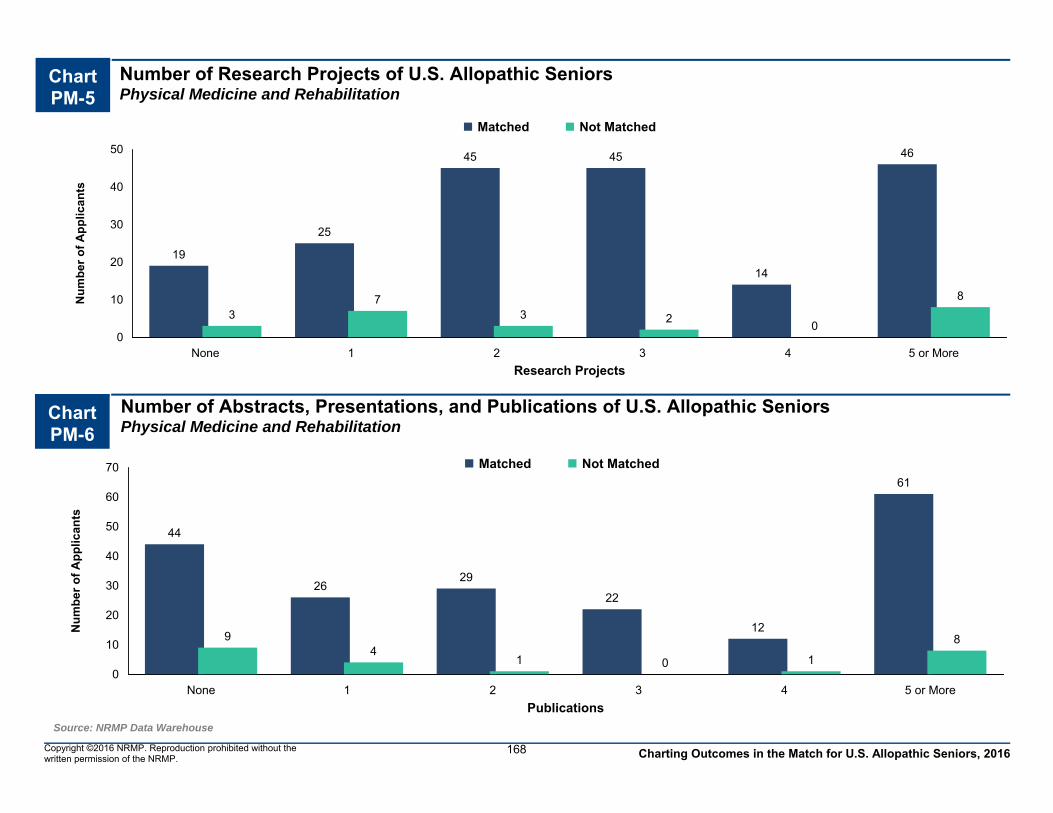
0
10
20
30
40
50
60
70
None 1 2 3 4 5 or More
44
2629
22
12
61
94
1 0 1
8
Matched Not Matched
Publications
Nu
mb
er o
f A
pp
lican
ts
0
10
20
30
40
50
None 1 2 3 4 5 or More
19
25
45 45
14
46
37
3 20
8
Matched Not Matched
Research Projects
Nu
mb
er o
f A
pp
lican
tsChart PM-5
Number of Research Projects of U.S. Allopathic SeniorsPhysical Medicine and Rehabilitation
Source: NRMP Data Warehouse
168Copyright ©2016 NRMP. Reproduction prohibited without the written permission of the NRMP.
Chart PM-6
Number of Abstracts, Presentations, and Publications of U.S. Allopathic SeniorsPhysical Medicine and Rehabilitation
Charting Outcomes in the Match for U.S. Allopathic Seniors, 2016

0
10
20
30
40
50
60
70
80
None 1 2 3 4 5 6 7 8 9 10 or More
17 5
21
1420
10
17 1512
72
0 2 4 52 4
0 1 0 05
Matched Not Matched
Volunteer Experiences
Nu
mb
er o
f A
pp
lican
ts
0
10
20
30
40
50
60
70
80
None 1 2 3 4 5 or More
14
37
30 28
14
71
26
3 2 28
Matched Not Matched
Work Experiences
Nu
mb
er o
f A
pp
lican
tsChart PM-7
Number of Work Experiences of U.S. Allopathic SeniorsPhysical Medicine and Rehabilitation
Source: NRMP Data Warehouse
169Copyright ©2016 NRMP. Reproduction prohibited without the written permission of the NRMP.
Chart PM-8
Number of Volunteer Experiences of U.S. Allopathic SeniorsPhysical Medicine and Rehabilitation
Charting Outcomes in the Match for U.S. Allopathic Seniors, 2016

Chart PM-9
Other Characteristics of U.S. SeniorsPhysical Medicine and Rehabilitation
Charting Outcomes in the Match for U.S. Allopathic Seniors, 2016 Copyright ©2016 NRMP. Reproduction prohibited without the written permission of the NRMP.
Source: NRMP Data Warehouse. Top 40 U.S. medical schools with the highest NIH funding from NIH: http://report.nih.gov/award/index.cfm
170
0
20
40
60
80
100
120
140
160
180
Yes No
12
164
0
22
Nu
mb
er
of
Ap
pli
ca
nts
AOA Membership
0
20
40
60
80
100
120
140
160
Yes No
50
144
2
21
Nu
mb
er o
f A
pp
lican
ts
Graduate of One of the 40 U.S. MedicalSchools with the Highest NIH Funding
0
40
80
120
160
200
Yes No
4
190
0
23
Nu
mb
er o
f A
pp
lican
ts
Ph.D. Degree
0
20
40
60
80
100
120
140
160
180
Yes No
28
166
3
20
Nu
mb
er o
f A
pp
lican
ts
Other Graduate Degree
Matched Not Matched

PS Plastic Surgery
Copyright ©2016 NRMP. Reproduction prohibited without the written permission of the NRMP.
171 Charting Outcomes in the Matchfor U.S. Allopathic Seniors, 2016

Table PS-1
Summary Statistics on U.S. Allopathic SeniorsPlastic Surgery
Measure (n=124) (n=39)
Matched Unmatched
12.6 5.9Mean number of contiguous ranks1.
1.3 1.7Mean number of distinct specialties ranked2.
250 240Mean USMLE Step 1 score3.
256 245Mean USMLE Step 2 score4.
4.6 4.5Mean number of research experiences5.
11.9 6.5Mean number of abstracts, presentations, and publications6.
3.3 3.1Mean number of work experiences7.
7.1 7.6Mean number of volunteer experiences8.
52.4 15.4Percentage who are AOA members9.
37.1 33.3Percentage who graduated from one of the 40 U.S. medical schools with the highest NIH funding
10.
3.4 5.4Percentage who have Ph.D. degree11.
21.0 2.7Percentage who have another graduate degree12.
Note: Only U.S. allopathic seniors who gave consent to use their information in research are included. Sources. NRMP Data Warehouse; Top 40 U.S. medical schools with the highest NIH funding in measure 10 is from the NIH website (http://report.nih.gov/award/index.cfm).
Copyright ©2016 NRMP. Reproduction prohibited without the written permission of the NRMP.
172 Charting Outcomes in the Matchfor U.S. Allopathic Seniors, 2016

0
20
40
60
80
100
1 2 3 4 or More
93
31
0 0
10
29
0 0
Matched Not Matched
Distinct Specialties Ranked
Nu
mb
er o
f A
pp
lican
ts
0
5
10
15
20
25
30
35
40
1 2 3 4 5 6 7 8 9 10 11 12 13 14 15 16 orMore
0 02 3
57
47 6
810
3
9
13
7
40
74
6
1 14 3 3 3 3
0 0 1 1 1 1
Matched Not Matched
Contiguous Ranks
Nu
mb
er o
f A
pp
lican
ts
Chart PS-2
Number of Contiguous Ranks of U.S. Allopathic SeniorsPlastic Surgery
Source: NRMP Data Warehouse
Copyright ©2016 NRMP. Reproduction prohibited without the written permission of the NRMP.
173
Chart PS-1
Number of Distinct Specialties Ranked by U.S. Allopathic SeniorsPlastic Surgery
Charting Outcomes in the Match for U.S. Allopathic Seniors, 2016

Probability of U.S. Allopathic Seniors Matching to Preferred Specialty by Number of Contiguous RanksPlastic Surgery
Graph PS-1
0.00
0.10
0.20
0.30
0.40
0.50
0.60
0.70
0.80
0.90
1.00
0 1 2 3 4 5 6 7 8 9 10 11 12 13 14 15 16 17 18 19 20
Number of Contiguous Ranks
Probability of Matching
Source: NRMP Data Warehouse. Note: Probabilities calculated based on 2014-2016 applicants
174Copyright ©2016 NRMP. Reproduction prohibited without the written permission of the NRMP. Charting Outcomes in the Match for U.S. Allopathic Seniors, 2016

Chart PS-3
USMLE Step 1 Scores of U.S. Allopathic SeniorsPlastic Surgery
0
10
20
30
40
50
<= 180 Between 181and 190
Between 191and 200
Between 201and 210
Between 211and 220
Between 221and 230
Between 231and 240
Between 241and 250
Between 251and 260
>260 ScoreUnknown
0 0 0 02
4
14
37
49
17
10 1 02 3
63
12
75
0
Matched Not Matched
Step 1 Scores
Nu
mb
er
of
Ap
pli
ca
nts
Source: NRMP Data Warehouse
175Copyright ©2016 NRMP. Reproduction prohibited without the written permission of the NRMP.
Chart PS-4
USMLE Step 2 CK Scores of U.S. Allopathic SeniorsPlastic Surgery
0
5
10
15
20
25
30
35
40
45
<= 180 Between 181and 190
Between 191and 200
Between 201and 210
Between 211and 220
Between 221and 230
Between 231and 240
Between 241and 250
Between 251and 260
>260 ScoreUnknown
0 0 0 0 04
8
21
43 44
40 0 0 0
42
69
7 6 5
Matched Not Matched
Step 2 CK Scores
Nu
mb
er o
f A
pp
lican
ts
Charting Outcomes in the Match for U.S. Allopathic Seniors, 2016

Graph PS-2
Probability of U.S. Allopathic Seniors Matching to Preferred Specialty by USMLE Step 1 ScorePlastic Surgery
0.00
0.10
0.20
0.30
0.40
0.50
0.60
0.70
0.80
0.90
1.00
180 190 200 210 220 230 240 250 260 270
Step 1 Score
Probability of Matching
Source: NRMP Data Warehouse. Note: Probabilities calculated based on 2014-2016 applicants.
176Copyright ©2016 NRMP. Reproduction prohibited without the written permission of the NRMP. Charting Outcomes in the Match for U.S. Allopathic Seniors, 2016

0
20
40
60
80
100
120
None 1 2 3 4 5 or More
0 2 5 6 8
103
1 3 5 3 6
21
Matched Not Matched
Publications
Nu
mb
er o
f A
pp
lican
ts
0
10
20
30
40
50
60
70
None 1 2 3 4 5 or More
04
13
20 22
65
1 25 7
4
20
Matched Not Matched
Research Projects
Nu
mb
er o
f A
pp
lican
tsChart PS-5
Number of Research Projects of U.S. Allopathic SeniorsPlastic Surgery
Source: NRMP Data Warehouse
177Copyright ©2016 NRMP. Reproduction prohibited without the written permission of the NRMP.
Chart PS-6
Number of Abstracts, Presentations, and Publications of U.S. Allopathic SeniorsPlastic Surgery
Charting Outcomes in the Match for U.S. Allopathic Seniors, 2016

0
5
10
15
20
25
30
35
40
None 1 2 3 4 5 6 7 8 9 10 or More
14
7 811 12 12 13
10
6
40
0 1 2 2 1 25
3 4 3
16
Matched Not Matched
Volunteer Experiences
Nu
mb
er o
f A
pp
lican
ts
0
5
10
15
20
25
30
35
40
None 1 2 3 4 5 or More
10
17
22 21
15
39
1
9
4 4
912
Matched Not Matched
Work Experiences
Nu
mb
er o
f A
pp
lican
tsChart PS-7
Number of Work Experiences of U.S. Allopathic SeniorsPlastic Surgery
Source: NRMP Data Warehouse
178Copyright ©2016 NRMP. Reproduction prohibited without the written permission of the NRMP.
Chart PS-8
Number of Volunteer Experiences of U.S. Allopathic SeniorsPlastic Surgery
Charting Outcomes in the Match for U.S. Allopathic Seniors, 2016

Chart PS-9
Other Characteristics of U.S. SeniorsPlastic Surgery
Charting Outcomes in the Match for U.S. Allopathic Seniors, 2016 Copyright ©2016 NRMP. Reproduction prohibited without the written permission of the NRMP.
Source: NRMP Data Warehouse. Top 40 U.S. medical schools with the highest NIH funding from NIH: http://report.nih.gov/award/index.cfm
179
0
10
20
30
40
50
60
70
Yes No
65
51
6
30
Nu
mb
er
of
Ap
pli
ca
nts
AOA Membership
10
20
30
40
50
60
70
80
Yes No
46
78
13
26
Nu
mb
er o
f A
pp
lican
ts
Graduate of One of the 40 U.S. MedicalSchools with the Highest NIH Funding
0
20
40
60
80
100
120
Yes No
4
120
2
37
Nu
mb
er o
f A
pp
lican
ts
Ph.D. Degree
0
20
40
60
80
100
Yes No
25
99
1
38
Nu
mb
er o
f A
pp
lican
ts
Other Graduate Degree
Matched Not Matched

P Psychiatry
Copyright ©2016 NRMP. Reproduction prohibited without the written permission of the NRMP.
180 Charting Outcomes in the Matchfor U.S. Allopathic Seniors, 2016

Table P-1
Summary Statistics on U.S. Allopathic SeniorsPsychiatry
Measure (n=737) (n=78)
Matched Unmatched
9.6 5.6Mean number of contiguous ranks1.
1.1 1.3Mean number of distinct specialties ranked2.
224 214Mean USMLE Step 1 score3.
238 226Mean USMLE Step 2 score4.
2.5 2.0Mean number of research experiences5.
3.7 2.1Mean number of abstracts, presentations, and publications6.
3.2 2.8Mean number of work experiences7.
6.4 5.1Mean number of volunteer experiences8.
6.2 0.0Percentage who are AOA members9.
29.4 15.4Percentage who graduated from one of the 40 U.S. medical schools with the highest NIH funding
10.
4.4 0.0Percentage who have Ph.D. degree11.
19.7 16.7Percentage who have another graduate degree12.
Note: Only U.S. allopathic seniors who gave consent to use their information in research are included. Sources. NRMP Data Warehouse; Top 40 U.S. medical schools with the highest NIH funding in measure 10 is from the NIH website (http://report.nih.gov/award/index.cfm).
Copyright ©2016 NRMP. Reproduction prohibited without the written permission of the NRMP.
181 Charting Outcomes in the Matchfor U.S. Allopathic Seniors, 2016

0
100
200
300
400
500
600
700
1 2 3 4 or More
693
421 1
6212 3 1
Matched Not Matched
Distinct Specialties Ranked
Nu
mb
er o
f A
pp
lican
ts
0
10
20
30
40
50
60
70
80
1 2 3 4 5 6 7 8 9 10 11 12 13 14 15 16 orMore
1522
16
28
39 40
60
79
71 7468
55 56
29 32
53
10 10 9 711
4 7 5 4 3 2 1 2 0 0 3
Matched Not Matched
Contiguous Ranks
Nu
mb
er o
f A
pp
lican
ts
Chart P-2
Number of Contiguous Ranks of U.S. Allopathic SeniorsPsychiatry
Source: NRMP Data Warehouse
Copyright ©2016 NRMP. Reproduction prohibited without the written permission of the NRMP.
182
Chart P-1
Number of Distinct Specialties Ranked by U.S. Allopathic SeniorsPsychiatry
Charting Outcomes in the Match for U.S. Allopathic Seniors, 2016

Probability of U.S. Allopathic Seniors Matching to Preferred Specialty by Number of Contiguous RanksPsychiatry
Graph P-1
0.00
0.10
0.20
0.30
0.40
0.50
0.60
0.70
0.80
0.90
1.00
0 1 2 3 4 5 6 7 8 9 10 11 12 13 14 15 16 17 18 19 20
Number of Contiguous Ranks
Probability of Matching
Source: NRMP Data Warehouse. Note: Probabilities calculated based on 2014-2016 applicants
183Copyright ©2016 NRMP. Reproduction prohibited without the written permission of the NRMP. Charting Outcomes in the Match for U.S. Allopathic Seniors, 2016

Chart P-3
USMLE Step 1 Scores of U.S. Allopathic SeniorsPsychiatry
0
20
40
60
80
100
120
140
160
<= 180 Between 181and 190
Between 191and 200
Between 201and 210
Between 211and 220
Between 221and 230
Between 231and 240
Between 241and 250
Between 251and 260
>260 ScoreUnknown
0 3
59
111
139149
120
70
51
1025
0 1
18 14 10 156 5 0 0
9
Matched Not Matched
Step 1 Scores
Nu
mb
er
of
Ap
pli
ca
nts
Source: NRMP Data Warehouse
184Copyright ©2016 NRMP. Reproduction prohibited without the written permission of the NRMP.
Chart P-4
USMLE Step 2 CK Scores of U.S. Allopathic SeniorsPsychiatry
0
20
40
60
80
100
120
140
160
180
<= 180 Between 181and 190
Between 191and 200
Between 201and 210
Between 211and 220
Between 221and 230
Between 231and 240
Between 241and 250
Between 251and 260
>260 ScoreUnknown
0 0 07
85
144
176
138
91
57
39
0 0 2 618 15 12 8 3 1
13
Matched Not Matched
Step 2 CK Scores
Nu
mb
er o
f A
pp
lican
ts
Charting Outcomes in the Match for U.S. Allopathic Seniors, 2016
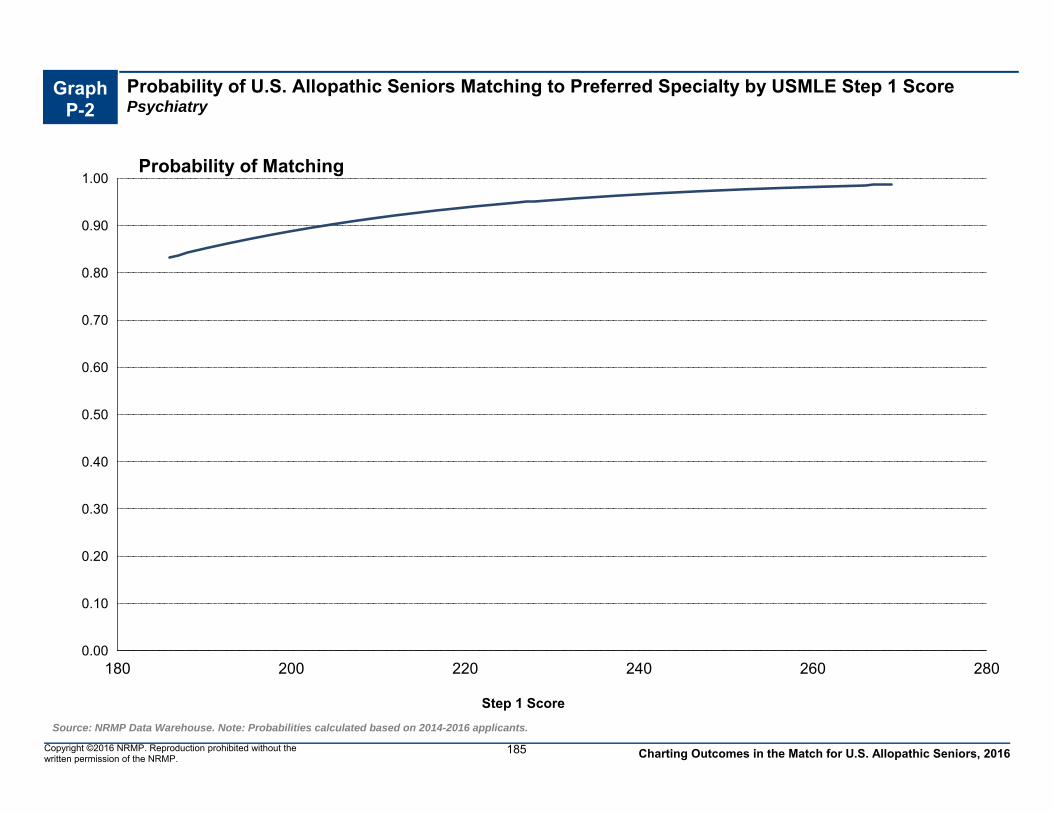
Graph P-2
Probability of U.S. Allopathic Seniors Matching to Preferred Specialty by USMLE Step 1 ScorePsychiatry
0.00
0.10
0.20
0.30
0.40
0.50
0.60
0.70
0.80
0.90
1.00
180 200 220 240 260 280
Step 1 Score
Probability of Matching
Source: NRMP Data Warehouse. Note: Probabilities calculated based on 2014-2016 applicants.
185Copyright ©2016 NRMP. Reproduction prohibited without the written permission of the NRMP. Charting Outcomes in the Match for U.S. Allopathic Seniors, 2016

0
40
80
120
160
200
240
280
320
None 1 2 3 4 5 or More
141
10286
61 51
296
17 13 5 1 4
38
Matched Not Matched
Publications
Nu
mb
er o
f A
pp
lican
ts
0
40
80
120
160
200
240
None 1 2 3 4 5 or More
74
109
164
109
75
206
9 14 16 8 2
29
Matched Not Matched
Research Projects
Nu
mb
er o
f A
pp
lican
tsChart P-5
Number of Research Projects of U.S. Allopathic SeniorsPsychiatry
Source: NRMP Data Warehouse
186Copyright ©2016 NRMP. Reproduction prohibited without the written permission of the NRMP.
Chart P-6
Number of Abstracts, Presentations, and Publications of U.S. Allopathic SeniorsPsychiatry
Charting Outcomes in the Match for U.S. Allopathic Seniors, 2016

0
40
80
120
160
200
240
280
None 1 2 3 4 5 6 7 8 9 10 or More
920
59 63 64 6954 49
61
19
270
3 5 313
3 7 4 4 1 0
35
Matched Not Matched
Volunteer Experiences
Nu
mb
er o
f A
pp
lican
ts
0
40
80
120
160
200
240
280
320
None 1 2 3 4 5 or More
48
92
123 118
63
293
9 6 11 8 8
36
Matched Not Matched
Work Experiences
Nu
mb
er o
f A
pp
lican
tsChart P-7
Number of Work Experiences of U.S. Allopathic SeniorsPsychiatry
Source: NRMP Data Warehouse
187Copyright ©2016 NRMP. Reproduction prohibited without the written permission of the NRMP.
Chart P-8
Number of Volunteer Experiences of U.S. Allopathic SeniorsPsychiatry
Charting Outcomes in the Match for U.S. Allopathic Seniors, 2016

Chart P-9
Other Characteristics of U.S. SeniorsPsychiatry
Charting Outcomes in the Match for U.S. Allopathic Seniors, 2016 Copyright ©2016 NRMP. Reproduction prohibited without the written permission of the NRMP.
Source: NRMP Data Warehouse. Top 40 U.S. medical schools with the highest NIH funding from NIH: http://report.nih.gov/award/index.cfm
188
0
100
200
300
400
500
600
700
Yes No
46
603
0
62
Nu
mb
er
of
Ap
pli
ca
nts
AOA Membership
0
100
200
300
400
500
600
Yes No
217
520
12
66
Nu
mb
er o
f A
pp
lican
ts
Graduate of One of the 40 U.S. MedicalSchools with the Highest NIH Funding
0
100
200
300
400
500
600
700
800
Yes No
29
708
0
78
Nu
mb
er o
f A
pp
lican
ts
Ph.D. Degree
0
100
200
300
400
500
600
700
Yes No
130
607
10
68
Nu
mb
er o
f A
pp
lican
ts
Other Graduate Degree
Matched Not Matched

RO Radiation Oncology
Copyright ©2016 NRMP. Reproduction prohibited without the written permission of the NRMP.
189 Charting Outcomes in the Matchfor U.S. Allopathic Seniors, 2016

Table RO-1
Summary Statistics on U.S. Allopathic SeniorsRadiation Oncology
Measure (n=149) (n=14)
Matched Unmatched
11.6 7.4Mean number of contiguous ranks1.
2.0 2.0Mean number of distinct specialties ranked2.
247 238Mean USMLE Step 1 score3.
251 238Mean USMLE Step 2 score4.
5.1 3.2Mean number of research experiences5.
12.7 5.9Mean number of abstracts, presentations, and publications6.
2.8 1.7Mean number of work experiences7.
5.5 4.9Mean number of volunteer experiences8.
27.5 0.0Percentage who are AOA members9.
41.6 42.9Percentage who graduated from one of the 40 U.S. medical schools with the highest NIH funding
10.
24.8 0.0Percentage who have Ph.D. degree11.
16.7 0.0Percentage who have another graduate degree12.
Note: Only U.S. allopathic seniors who gave consent to use their information in research are included. Sources. NRMP Data Warehouse; Top 40 U.S. medical schools with the highest NIH funding in measure 10 is from the NIH website (http://report.nih.gov/award/index.cfm).
Copyright ©2016 NRMP. Reproduction prohibited without the written permission of the NRMP.
190 Charting Outcomes in the Matchfor U.S. Allopathic Seniors, 2016

0
10
20
30
40
50
60
1 2 3 4 or More
60
39
46
46
3 41
Matched Not Matched
Distinct Specialties Ranked
Nu
mb
er o
f A
pp
lican
ts
0
4
8
12
16
20
24
1 2 3 4 5 6 7 8 9 10 11 12 13 14 15 16 orMore
21
3 32
6
9
13
9 97
21
15
11
14
24
20 0
2 2 20 0 0
20
21 1
0 0
Matched Not Matched
Contiguous Ranks
Nu
mb
er o
f A
pp
lican
ts
Chart RO-2
Number of Contiguous Ranks of U.S. Allopathic SeniorsRadiation Oncology
Source: NRMP Data Warehouse
Copyright ©2016 NRMP. Reproduction prohibited without the written permission of the NRMP.
191
Chart RO-1
Number of Distinct Specialties Ranked by U.S. Allopathic SeniorsRadiation Oncology
Charting Outcomes in the Match for U.S. Allopathic Seniors, 2016

Probability of U.S. Allopathic Seniors Matching to Preferred Specialty by Number of Contiguous RanksRadiation Oncology
Graph RO-1
0.00
0.10
0.20
0.30
0.40
0.50
0.60
0.70
0.80
0.90
1.00
0 1 2 3 4 5 6 7 8 9 10 11 12 13 14 15 16 17 18 19 20
Number of Contiguous Ranks
Probability of Matching
Source: NRMP Data Warehouse. Note: Probabilities calculated based on 2014-2016 applicants
192Copyright ©2016 NRMP. Reproduction prohibited without the written permission of the NRMP. Charting Outcomes in the Match for U.S. Allopathic Seniors, 2016

Chart RO-3
USMLE Step 1 Scores of U.S. Allopathic SeniorsRadiation Oncology
0
10
20
30
40
50
<= 180 Between 181and 190
Between 191and 200
Between 201and 210
Between 211and 220
Between 221and 230
Between 231and 240
Between 241and 250
Between 251and 260
>260 ScoreUnknown
0 0 02 3
1316
50
45
19
10 0 0 1 0 15 5
20 0
Matched Not Matched
Step 1 Scores
Nu
mb
er
of
Ap
pli
ca
nts
Source: NRMP Data Warehouse
193Copyright ©2016 NRMP. Reproduction prohibited without the written permission of the NRMP.
Chart RO-4
USMLE Step 2 CK Scores of U.S. Allopathic SeniorsRadiation Oncology
0
10
20
30
40
50
<= 180 Between 181and 190
Between 191and 200
Between 201and 210
Between 211and 220
Between 221and 230
Between 231and 240
Between 241and 250
Between 251and 260
>260 ScoreUnknown
0 0 0 02
10
23
30
48
32
40 0 0 0 1 2
5 42
0 0
Matched Not Matched
Step 2 CK Scores
Nu
mb
er o
f A
pp
lican
ts
Charting Outcomes in the Match for U.S. Allopathic Seniors, 2016

Graph RO-2
Probability of U.S. Allopathic Seniors Matching to Preferred Specialty by USMLE Step 1 ScoreRadiation Oncology
0.00
0.10
0.20
0.30
0.40
0.50
0.60
0.70
0.80
0.90
1.00
190 200 210 220 230 240 250 260 270
Step 1 Score
Probability of Matching
Source: NRMP Data Warehouse. Note: Probabilities calculated based on 2014-2016 applicants.
194Copyright ©2016 NRMP. Reproduction prohibited without the written permission of the NRMP. Charting Outcomes in the Match for U.S. Allopathic Seniors, 2016

0
20
40
60
80
100
120
140
None 1 2 3 4 5 or More
1 4 411
2
127
1 2 1 0 010
Matched Not Matched
Publications
Nu
mb
er o
f A
pp
lican
ts
0
20
40
60
80
100
None 1 2 3 4 5 or More
04
8
26 26
85
0 05 3 2 4
Matched Not Matched
Research Projects
Nu
mb
er o
f A
pp
lican
tsChart RO-5
Number of Research Projects of U.S. Allopathic SeniorsRadiation Oncology
Source: NRMP Data Warehouse
195Copyright ©2016 NRMP. Reproduction prohibited without the written permission of the NRMP.
Chart RO-6
Number of Abstracts, Presentations, and Publications of U.S. Allopathic SeniorsRadiation Oncology
Charting Outcomes in the Match for U.S. Allopathic Seniors, 2016

0
5
10
15
20
25
30
35
None 1 2 3 4 5 6 7 8 9 10 or More
2
11 12
18
15 14
20
6
13
4
34
1 02 2 1 1 0 1
31 2
Matched Not Matched
Volunteer Experiences
Nu
mb
er o
f A
pp
lican
ts
0
5
10
15
20
25
30
35
40
None 1 2 3 4 5 or More
5
27
39
25
15
38
3 24
2 1 2
Matched Not Matched
Work Experiences
Nu
mb
er o
f A
pp
lican
tsChart RO-7
Number of Work Experiences of U.S. Allopathic SeniorsRadiation Oncology
Source: NRMP Data Warehouse
196Copyright ©2016 NRMP. Reproduction prohibited without the written permission of the NRMP.
Chart RO-8
Number of Volunteer Experiences of U.S. Allopathic SeniorsRadiation Oncology
Charting Outcomes in the Match for U.S. Allopathic Seniors, 2016
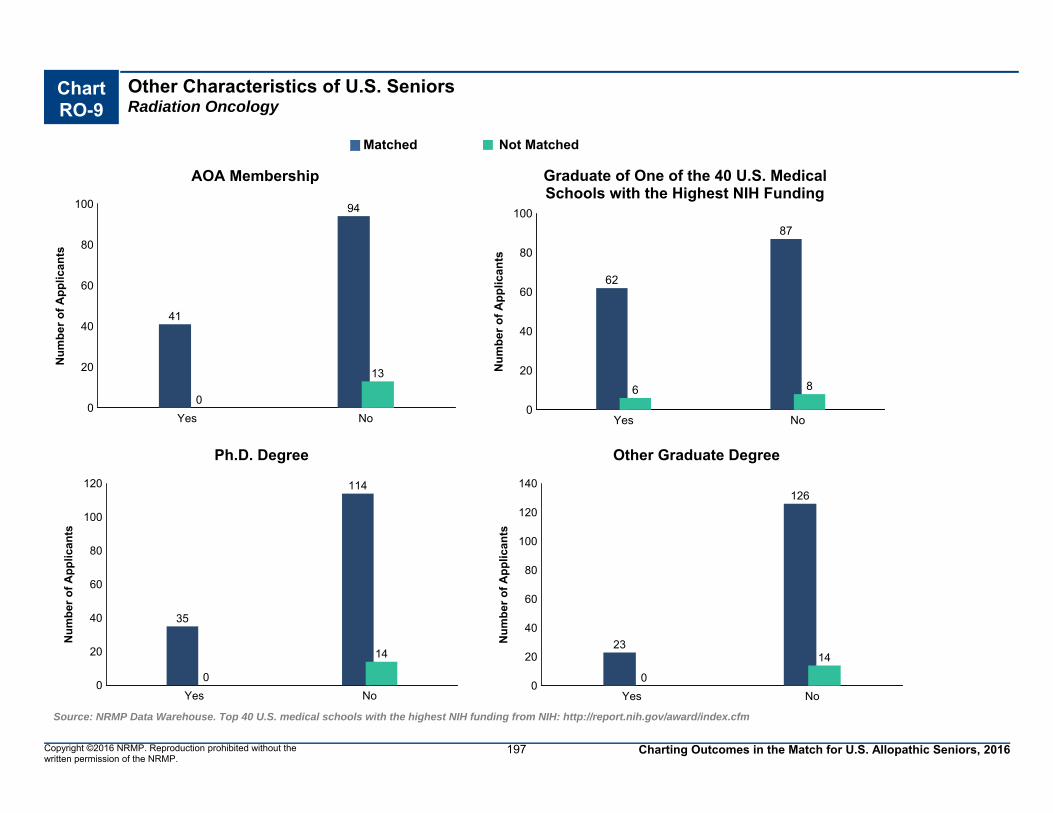
Chart RO-9
Other Characteristics of U.S. SeniorsRadiation Oncology
Charting Outcomes in the Match for U.S. Allopathic Seniors, 2016 Copyright ©2016 NRMP. Reproduction prohibited without the written permission of the NRMP.
Source: NRMP Data Warehouse. Top 40 U.S. medical schools with the highest NIH funding from NIH: http://report.nih.gov/award/index.cfm
197
0
20
40
60
80
100
Yes No
41
94
0
13
Nu
mb
er
of
Ap
pli
ca
nts
AOA Membership
0
20
40
60
80
100
Yes No
62
87
6 8
Nu
mb
er o
f A
pp
lican
ts
Graduate of One of the 40 U.S. MedicalSchools with the Highest NIH Funding
0
20
40
60
80
100
120
Yes No
35
114
0
14
Nu
mb
er o
f A
pp
lican
ts
Ph.D. Degree
0
20
40
60
80
100
120
140
Yes No
23
126
0
14
Nu
mb
er o
f A
pp
lican
ts
Other Graduate Degree
Matched Not Matched

VS Vascular Surgery
Copyright ©2016 NRMP. Reproduction prohibited without the written permission of the NRMP.
198 Charting Outcomes in the Matchfor U.S. Allopathic Seniors, 2016
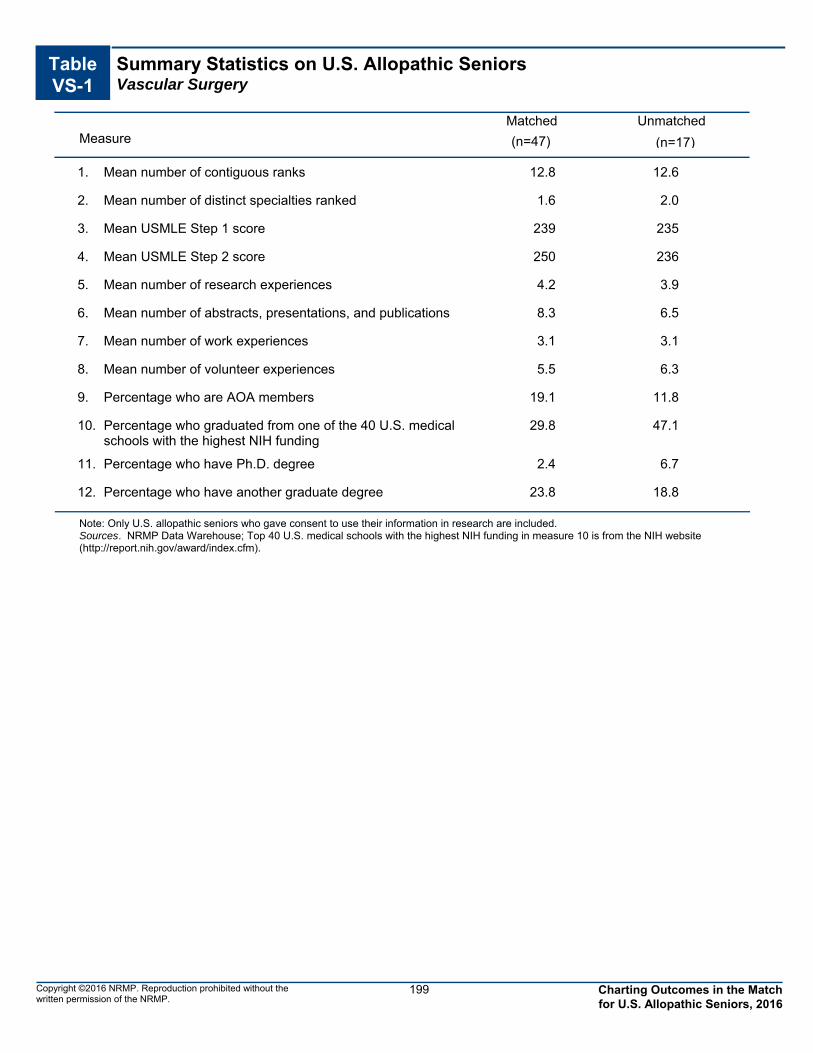
Table VS-1
Summary Statistics on U.S. Allopathic SeniorsVascular Surgery
Measure (n=47) (n=17)
Matched Unmatched
12.8 12.6Mean number of contiguous ranks1.
1.6 2.0Mean number of distinct specialties ranked2.
239 235Mean USMLE Step 1 score3.
250 236Mean USMLE Step 2 score4.
4.2 3.9Mean number of research experiences5.
8.3 6.5Mean number of abstracts, presentations, and publications6.
3.1 3.1Mean number of work experiences7.
5.5 6.3Mean number of volunteer experiences8.
19.1 11.8Percentage who are AOA members9.
29.8 47.1Percentage who graduated from one of the 40 U.S. medical schools with the highest NIH funding
10.
2.4 6.7Percentage who have Ph.D. degree11.
23.8 18.8Percentage who have another graduate degree12.
Note: Only U.S. allopathic seniors who gave consent to use their information in research are included. Sources. NRMP Data Warehouse; Top 40 U.S. medical schools with the highest NIH funding in measure 10 is from the NIH website (http://report.nih.gov/award/index.cfm).
Copyright ©2016 NRMP. Reproduction prohibited without the written permission of the NRMP.
199 Charting Outcomes in the Matchfor U.S. Allopathic Seniors, 2016

0
4
8
12
16
20
24
28
1 2 3 4 or More
19
27
10
3
11
3
0
Matched Not Matched
Distinct Specialties Ranked
Nu
mb
er o
f A
pp
lican
ts
0
2
4
6
8
10
12
14
16
1 2 3 4 5 6 7 8 9 10 11 12 13 14 15 16 orMore
12
01
4
12
12
01
32
8
4
15
2
0 0 01
01
2
0 0 0 01 1 1
8
Matched Not Matched
Contiguous Ranks
Nu
mb
er o
f A
pp
lican
ts
Chart VS-2
Number of Contiguous Ranks of U.S. Allopathic SeniorsVascular Surgery
Source: NRMP Data Warehouse
Copyright ©2016 NRMP. Reproduction prohibited without the written permission of the NRMP.
200
Chart VS-1
Number of Distinct Specialties Ranked by U.S. Allopathic SeniorsVascular Surgery
Charting Outcomes in the Match for U.S. Allopathic Seniors, 2016

Probability of U.S. Allopathic Seniors Matching to Preferred Specialty by Number of Contiguous RanksVascular Surgery
Graph VS-1
0.00
0.10
0.20
0.30
0.40
0.50
0.60
0.70
0.80
0.90
1.00
0 1 2 3 4 5 6 7 8 9 10 11 12 13 14 15 16 17 18 19 20
Number of Contiguous Ranks
Probability of Matching
Source: NRMP Data Warehouse. Note: Probabilities calculated based on 2014-2016 applicants
201Copyright ©2016 NRMP. Reproduction prohibited without the written permission of the NRMP. Charting Outcomes in the Match for U.S. Allopathic Seniors, 2016

Chart VS-3
USMLE Step 1 Scores of U.S. Allopathic SeniorsVascular Surgery
0
2
4
6
8
10
12
14
16
18
<= 180 Between 181and 190
Between 191and 200
Between 201and 210
Between 211and 220
Between 221and 230
Between 231and 240
Between 241and 250
Between 251and 260
>260 ScoreUnknown
0 01 1
54
17
7
56
10 0 0 0
2
5
3
6
10 0
Matched Not Matched
Step 1 Scores
Nu
mb
er
of
Ap
pli
ca
nts
Source: NRMP Data Warehouse
202Copyright ©2016 NRMP. Reproduction prohibited without the written permission of the NRMP.
Chart VS-4
USMLE Step 2 CK Scores of U.S. Allopathic SeniorsVascular Surgery
0
2
4
6
8
10
12
14
<= 180 Between 181and 190
Between 191and 200
Between 201and 210
Between 211and 220
Between 221and 230
Between 231and 240
Between 241and 250
Between 251and 260
>260 ScoreUnknown
0 0 0 0
34
3
9
14
12
2
0 0 01
3 3 3 34
0 0
Matched Not Matched
Step 2 CK Scores
Nu
mb
er o
f A
pp
lican
ts
Charting Outcomes in the Match for U.S. Allopathic Seniors, 2016

Graph VS-2
Probability of U.S. Allopathic Seniors Matching to Preferred Specialty by USMLE Step 1 ScoreVascular Surgery
0.00
0.10
0.20
0.30
0.40
0.50
0.60
0.70
0.80
0.90
1.00
190 200 210 220 230 240 250 260 270
Step 1 Score
Probability of Matching
Source: NRMP Data Warehouse. Note: Probabilities calculated based on 2014-2016 applicants.
203Copyright ©2016 NRMP. Reproduction prohibited without the written permission of the NRMP. Charting Outcomes in the Match for U.S. Allopathic Seniors, 2016

0
5
10
15
20
25
30
35
None 1 2 3 4 5 or More
13 2 3
5
33
02 3
13
8
Matched Not Matched
Publications
Nu
mb
er o
f A
pp
lican
ts
0
4
8
12
16
20
None 1 2 3 4 5 or More
12
6
910
19
0 0
3 3
7
4
Matched Not Matched
Research Projects
Nu
mb
er o
f A
pp
lican
tsChart VS-5
Number of Research Projects of U.S. Allopathic SeniorsVascular Surgery
Source: NRMP Data Warehouse
204Copyright ©2016 NRMP. Reproduction prohibited without the written permission of the NRMP.
Chart VS-6
Number of Abstracts, Presentations, and Publications of U.S. Allopathic SeniorsVascular Surgery
Charting Outcomes in the Match for U.S. Allopathic Seniors, 2016

0
4
8
12
16
20
24
None 1 2 3 4 5 6 7 8 9 10 or More
0
8
10
12
14
6
10
2
6
2
24
0
2 2
0
4
8
6
0
2 2
8
Matched Not Matched
Volunteer Experiences
Nu
mb
er o
f A
pp
lican
ts
0
2
4
6
8
10
12
14
16
None 1 2 3 4 5 or More
4
7
10
56
15
1 1
34
6
2
Matched Not Matched
Work Experiences
Nu
mb
er o
f A
pp
lican
tsChart VS-7
Number of Work Experiences of U.S. Allopathic SeniorsVascular Surgery
Source: NRMP Data Warehouse
205Copyright ©2016 NRMP. Reproduction prohibited without the written permission of the NRMP.
Chart VS-8
Number of Volunteer Experiences of U.S. Allopathic SeniorsVascular Surgery
Charting Outcomes in the Match for U.S. Allopathic Seniors, 2016

Chart VS-9
Other Characteristics of U.S. SeniorsVascular Surgery
Charting Outcomes in the Match for U.S. Allopathic Seniors, 2016 Copyright ©2016 NRMP. Reproduction prohibited without the written permission of the NRMP.
Source: NRMP Data Warehouse. Top 40 U.S. medical schools with the highest NIH funding from NIH: http://report.nih.gov/award/index.cfm
206
0
5
10
15
20
25
30
35
Yes No
9
33
2
14
Nu
mb
er
of
Ap
pli
ca
nts
AOA Membership
8
12
16
20
24
28
32
36
Yes No
14
33
89
Nu
mb
er o
f A
pp
lican
ts
Graduate of One of the 40 U.S. MedicalSchools with the Highest NIH Funding
0
5
10
15
20
25
30
35
40
45
50
Yes No
1
46
1
16
Nu
mb
er o
f A
pp
lican
ts
Ph.D. Degree
0
5
10
15
20
25
30
35
40
Yes No
10
37
3
14
Nu
mb
er o
f A
pp
lican
ts
Other Graduate Degree
Matched Not Matched