nps learning in place afda - npsk12.com
TRANSCRIPT

NPS Learning in Place
AFDA
Name ___________________________ School ______________ Teacher _______________
May 18 – June 5
Week 1
Properties of Normal Distribution
Box-and-Whisker Plot
Standard Deviation
Interpreting Z-score
Week 2
Z-Score
Probability Density
Week 3
Sample size and Reporting

Week 1- Day 1
Example: Find the mean, median, mode, and range of the data set. {3, 5, 7, 10, 13, 1, 3}
Step 1: Place numbers in order from least to greatest: 1, 3, 3, 5, 7, 10, 13
*be sure to count to make sure it’s the same amount of numbers*
Step 2: Mode is the number that appears most often: 3
Step 3: Median is the number in the middle of the data set: 1, 3, 3, 5, 7, 10, 13
*if it’s two numbers add them and divide by 2*
Step 4: Range, subtract biggest number by the smallest: 13 – 1 = 12
Step 5: Mean(average), add all numbers up and divide by the number of entries you have:
1+3+3+5+7+10+13 = 42 ÷ 7 = 6

Day 1 Practice: Find the mean, median, mode, and range for each data set.
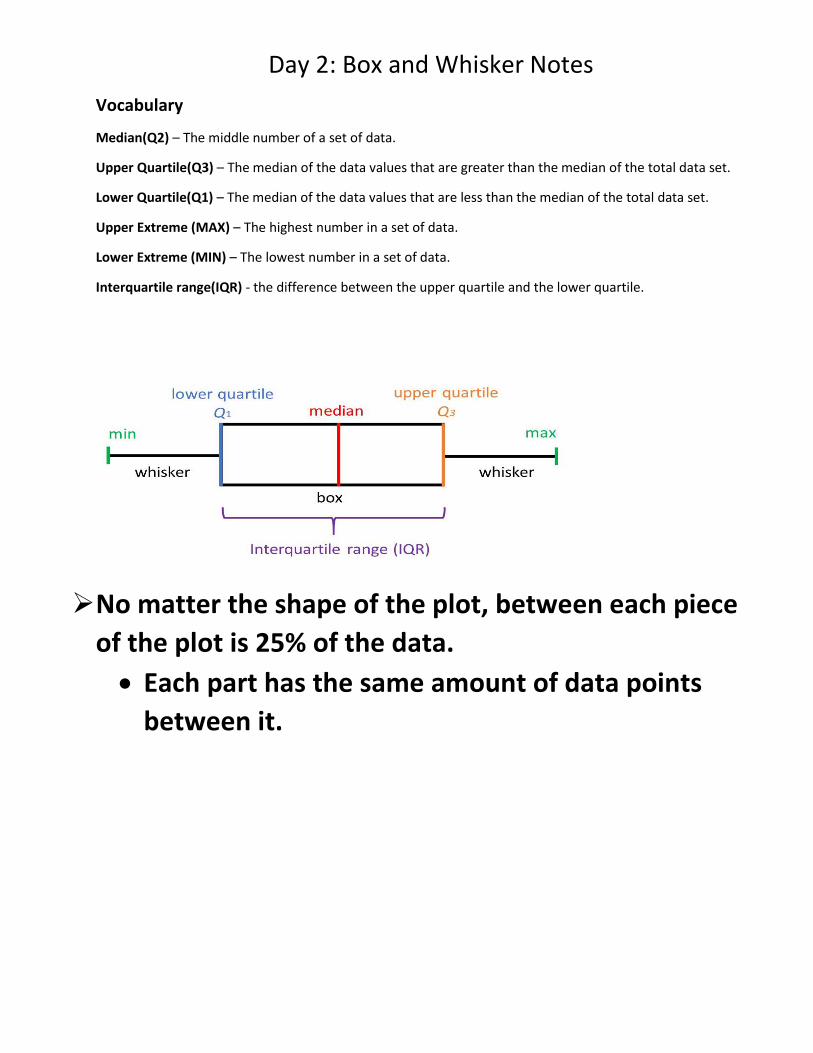
Day 2: Box and Whisker Notes
Vocabulary
Median(Q2) – The middle number of a set of data.
Upper Quartile(Q3) – The median of the data values that are greater than the median of the total data set.
Lower Quartile(Q1) – The median of the data values that are less than the median of the total data set.
Upper Extreme (MAX) – The highest number in a set of data.
Lower Extreme (MIN) – The lowest number in a set of data.
Interquartile range(IQR) - the difference between the upper quartile and the lower quartile.
No matter the shape of the plot, between each piece
of the plot is 25% of the data.
Each part has the same amount of data points
between it.

Use the following box-and-whisker plot to answer questions the next four questions. 1. Write the value that represents the median.
2. Find the range of the values.
3. What is the interquartile range of this data? 4. What percent of the population is between 25 and 35? A 25% B 50% C 75% D 100%
5. Use this data display to answer the question. Which statement is true?
A The youngest male player is older than the youngest female player. B Twenty-five percent of the males are between 10 and 25 years of age. C There is a forty-year range in age for the female team. D As a group, the female team has older members than the male team. 6. Which score represents the median score?
A 70 B 94 C 132 D 151 7. Place an X next to the data that has a median of 17.
______
0 25 35 50 60
10 20 30 40 50
10
20
40
50
20
40 35 28
25 33
Males
Females
Ages of Tennis Team Members
70 208 94 132 151

Day 3: Standard Deviation Notes Vocabulary
Standard Deviation (s or σ) – shows the variation in the data, how spread out the data points are. The bigger the standard deviation the more spread out the data points are. The smaller the standard deviation the closer the data points are together
Variance (σ2) – the standard deviation squared. Mean (x or μ) – the average of the data points.
How to create a normal distribution curve using the mean and standard deviation Step 1: Find the mean (μ) Step 2: Find the standard deviation (you may not have a calculator so we are going to give you the standard deviation)
Step 3: Add the standard deviation to the mean (μ) once, twice and three times to create the right side of the normal curve. Step 4: Subtract the standard deviation from the mean (μ) once, twice and three times to create the left side.
Example 1: Given the quiz scores 30, 50, 60, 70, 90. Draw a normal distribution curve.
Step 1: 𝟑𝟎+𝟓𝟎+𝟔𝟎+𝟕𝟎+𝟗𝟎
𝟓= 𝟔𝟎 = (μ)
Step 2: Standard deviation: 𝜎= 20
Step 3: 60 + 20 = 80 (1 standard deviation to the right from the mean:1𝝈) 80 + 20 = 100 (2 standard deviations to the right from the mean:2𝝈) 100 + 20 = 120 (3 standard deviations to the right from the mean:3𝝈)
Step 4: 60 - 20 = 40 (1 standard deviation to the left from the mean: -1𝝈) 40 - 20 = 20 (2 standard deviations to the right from the mean: -2𝝈) 20 - 20 = 0 (3 standard deviations to the right from the mean: -3𝝈)
Let’s create the normal distribution curve
-3𝝈 = 𝟎 -2𝝈 = 𝟐𝟎 -1𝝈 = 𝟒𝟎 μ = 60 1𝝈 = 𝟖𝟎 2𝝈 = 𝟏𝟎𝟎 3𝝈 = 𝟏𝟐𝟎

Day 3 Practice:Normal Distribution Cruve

Day 4: Z-score Notes
Vocabulary Z-score (z) – the number of standard deviations a data point is from the mean(average) of the data.
A negative z-score means below the mean. A positive z-score means above the mean.
Finding Z-score
1. Subtract the mean (average: 𝜇 ) from the given data point. 2. Divide the solution from step 1 by the standard deviation. 3. The final answer is the number of standard deviations from the mean (Z-score).
Example: Find the z-score of the test scores of 82, 91, 73, if the average score is 82 with a standard deviation of 4.
Step 1: 82 – 82 = 0 Step 1: 91 – 82 = 9 Step 1: 73 – 82 = -9
Step 2: 0 ÷ 4 = 0 Step 2: 9 ÷ 4 = 2.25 Step 2: -9 ÷ 4 = -2.25
Step 3: 0 Step 3: 2.25 Step 3: -2.25 Z-score of 82: 0 Z-score of 91: 2.25 Z-score of 73: -2.25
Let’s create the normal distribution curve

Day 4: Z- Score Practice Problems
1) A population has a mean of 45 and a standard deviation of 5. Find the z-scores of the following raw
scores:
a) score = 47
b) score = 48
c) score = 40
d) score = 39
2) The following table shows the scores of a person on six different scales of an aptitude test. Also shown
are the means and standard deviations of these scales.
Test Mean Standard
Deviation
Score Z-Score
Clerical Ability 50 15 41
Logical Reasoning 40 4 47
Mechanical Ability 120 25 100
Numerical Reasoning 100 10 105
Spatial Relations 70 20 90
Verbal Fluency 60 6 70
a) Calculate the z-scores for each.
b) How many scores are below the mean? Explain your answer
c) How many scores are above the mean? Explain your answer
d) On which test did subject 1 score the highest? Which did subject 1 score the lowest?
e) Label the approximate location of each score on the normal distribution curve below.

3) Convert the following test scores to z-scores and then decide which is the student’s best and worst area
of performance. Label the approximate location of each score in the normal distribution curves below.
a) Best:________________________________ Worst:_____________________________
Test Score Mean Standard
Deviation
Z-Score
MATH 87 80 5
SCIENCE 90 92 16
ENGLISH 75 55 18
b) Best:___________________________________ Worst:_____________________________
Test Score Mean Standard
Deviation
Z-Score
BUSSINESS 205 38 50 18
SOCIOLOGY 201 28 15 21
ACCOUNTING 101 45 20 16
c) Best:___________________________________ Worst:_____________________________
Test Score Mean Standard
Deviation
Z-Score
HISTORY 100 48 35 20
WRITING 100 38 22 30
PSYCHOLOGY 100 55 19 15
3a)
3b)
3c)

Day 5: More Z-score Practice


Day 2
Using the 2007 Quarterback Salary Data from the previous page, answer the following questions:
1. a) What information does the mean provide?
b) How many salaries are above the mean? ________ c) How many salaries are below the mean? ________ d) Which quarterback salaries are within one standard deviation of the mean? e) Which quarterback salaries are not within two standard deviations of the mean? 2. a) Find which team’s quarterback has a salary farthest from the mean. What was the corresponding z-score? b) Find which team’s quarterback has a salary closest to the mean. What was the corresponding z-score? c) What information does each z-score provide? d) Determine how many of the z-scores are positive and how many are negative. Then, explain why that makes sense. e) What is the sum of all of the z-scores? Explain why this makes sense.

Day 3 PERCENT OF DATA NOTES
To label a normal curve.
1. The mean(average) is the middle number.
2. Add standard deviation to the mean for the first line to the right.
3. Add standard deviation to the solution of step 2 for the next line on the right.
4. Add standard deviation to the solution of step 3 for the next line on the right
5. Subtract standard deviation from the mean for the first line to the left.
6. Subtract standard deviation from the solution of step 5 for the next left line.
7. Subtract standard deviation from the solution of step 6 for the next left line.
Follow steps 1 through 7 2.) 13.5% 3.) 2.5% 4.) 68% 5.) 16%
You Try It!

Day 3 Practice

Day 4 Probability Density Notes
How to read the Table of Standard Nomal Probabilities

Table of Standard Normal Probabilities for Negative Z-Scores

Table of Standard Normal Probabilities for Positive Z-Scores

Day 4 Probability Density Practice

Day 5 Probability Density Additional Notes
If an experiment generates outcomes that are normally distributed, the standard normal curve can be used to calculate probabilities of specific outcomes.
For example, the life span of a particular machine gasket is normally distributed, with a mean of 750 hours with a standard deviation of 25 hours.
The accumulated area up to 775 represents the probability that the gasket will last 775 or fewer hours.
The shaded area below represents the probability that the gasket will last 775 or fewer hours. The corresponding numerical probability is determined using a z-score.
With z
775 750
251 and using the Standard Normal Table (previous page) , we can see
P(x < 775) = 0.841
750 775 725 700 800
750 775 725 700 800

Day 5 Probability Density Practice Using the same machine gasket example, shade the region representing the given probability and then determine the numerical probability using the table of Standard Normal Probabilities for Z-scores
1. The probability the gasket will last more than 730 hours.
P(x > 730)
2. The probability the gasket will last more than 730 hours.
P(x > 730)
3. The probability the gasket will last less than 785 hours.
P(x < 785)
4. The probability the gasket will last between 730 and 785 hours. P(730 < x < 785)
750
0
775
0
725 700
0
800
0
750 775725 700 800750 775725 700 800
750 775725 700 800

Day 1
Notes Remember….. the types of Sampling:
1. Simple random sampling (SRS)
Everyone has an equal chance at selection
What statisticians strive for 2. Stratified sampling
Some of all
Divide into strata (groups), then SRS within groups 3. Cluster sampling
All of some
Divide into clusters (groups), then census within groups
YOU TRY: Read and respond using your understanding of bias and sampling.
Review Identify the types of surveys and any problems used in the following:
1. Radio call-in survey on the state of the economy
2. Forty workers are selected randomly at the Wytheville Pepsi plant
3. All teachers in Smyth county are surveyed on a pay issue
4. Every 10th customer at Food City is surveyed about food prices
5. Two English classes are random selected from each grade and every student in that class is surveyed on school uniforms
Activity: In your capacity as an administrative assistant for your county government, you need to assess the attitude of your community for a new highway proposal. Some people will favor the highway in the belief it will provide a greater mobility and promote business. Others will argue that it will bring even more congestion and will negatively impact the environment. You need to submit a preliminary report as soon as possible and someone suggests doing a sample from calling 50 random people from the phone book. Describe how you would do it. Do you think your method results in a simple random sample? Why or Why not?

Day 2
Writing Activity: Suppose you county executive decides that you should survey only registered voters in your community, to determine whether the majority of county residents favor a new highway proposal. You do have a complete list of registered voters, with their party affiliation (34% are Republicans, 45% are Democrats and 21% are independent). Use complete sentences to record your design for this sample survey. You can save money by using a sample of size 100, instead of doing a census. Record a plan for this sample survey:
a) State what you need to know b) Identify the population that is to be measured, and the sampling frame sampling? c) Which sampling method, simple random sample or stratified sample, do you think would be best? Give a reason for your
choice. d) How would do the sampling?
Notes
Design of Experiments Only a well-designed experiment can determine a cause and effect relationship The three primary areas of an experimental design are
• Control – Overall effort to minimize variability in the way the experimental units are obtained and treated – Attempts to eliminate the confounding effects of extraneous variables (those not being measured or controlled in
the experiment, aka lurking variables) • Randomization
– Rules used to assign the experimental units to the treatments – Uses impersonal chance to assign experimental units to treatments – Increases chances that there are no systematic differences between treatment groups
• Replication – Use enough subjects to reduce chance variation – Increases the sensitivity of the experiment to differences between treatments
Activity: In an early activity, we learned to recognize a linear relationship between two variables. Recall that finding a correlation does not necessarily establish a cause-and-effect relationship between two variables. Suppose a survey of elementary school students in our county results in the following scatterplot of reading level versus shoe size. How would you describe the association between reading level and shoe size? Based upon your response above, would you be willing to conclude that an increase in shoe size causes a higher reading level? Why or why not? If your answer was no, can you think of a lurking variable (one that mentioned) that might explain the correlation?

YOU TRY: (on another sheet of paper) Example 1: A baby-food producer claims that her product is superior to that of her leading competitor, in that babies gain weight faster with her product. As an experiment, 30 healthy babies are randomly selected. For two months, 15 are fed her product and 15 are feed the competitor’s product. Each baby’s weight gain (in ounces) was recorded. A) How will subjects be assigned to treatments? B) What is the response variable (y-variable)? C) What is the explanatory variable (x-variable)? Example 2: Two toothpastes are being studied for effectiveness in reducing the number of cavities in children. There are 100 children available for the study. A) How do you assign the subjects? B) What do you measure? C) What baseline data should you know about? D) What factors might confound this experiment? E) What would be the purpose of a randomization in this problem?
Day 3
Notes Vocabulary:
Experimental unit – an individual upon which an experiment is performed; (subject is term used for human beings) Control Group – a group that does not receive a real treatment Treatment – a specific experimental condition applied to the experimental units Statistically significant – a term applied to an observed effect so large that it would rarely occur by chance Double-blind – neither the subjects nor the observers know which treatments any of the subjects had received in an experiment Design of Experiments – DOE, a course unto itself Placebo – a treatment that has no effect Placebo Effect – the ability of the human mind to respond positively to perceived medicine or attention
Replication – the number of units receiving the same treatment
YOU TRY:
1. What type of an experiment is it when neither the patient nor the doctor knows what type of pill is being given?
2. List the three major components of any experimental design
3. A “sugar pill” is also known as a ________________.
4. What is the only thing that can establish cause and effect?
5. What do we call a group in the experiment which treatments are measured against?
6. To help assess student learning in his literature class, an English teacher implemented pre lesson and post-lesson tests for his students. A knowledge-gained score was recorded after the lesson was taught by taking the difference of the two test scores for each student.
a) What type of experimental design was this? b) What was measured (response variable) in this experiment? c) What treatment was applied to the subjects?

Days 4-5
Apply it!
Plan and conduct a survey dealing with the current school closures due to COVID-19. Be safe – use technology to get responses outside of your household.
The experimental design should address control, randomization, and minimization of experimental error.
Write a report describing the experiment/survey and the resulting data and analysis.