november 9, 2012 introducing electricity load level detail into a cge model renato dias bleasby...
TRANSCRIPT

November 9, 2012
Introducing electricity load level detail into a CGE model
Renato Dias Bleasby RodriguesPedro Linares Llamas
2Instituto de Investigación TecnológicaEscuela Técnica Superior de Ingeniería ICAI
6th Annual Trans-Atlantic INFRADAY - Renato Dias Bleasby RodriguesNovember 9, 2012
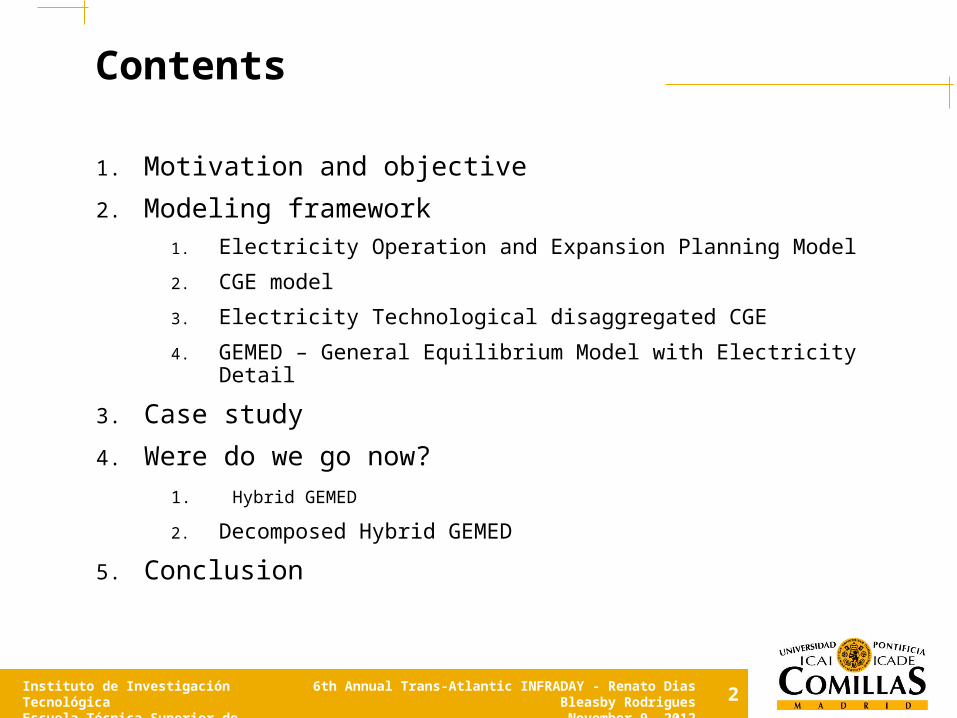
1. Motivation and objective
2. Modeling framework1. Electricity Operation and Expansion Planning Model
2. CGE model
3. Electricity Technological disaggregated CGE
4. GEMED – General Equilibrium Model with Electricity Detail
3. Case study
4. Were do we go now?1. Hybrid GEMED
2. Decomposed Hybrid GEMED
5. Conclusion
Contents
Motivation and Objective
1

4Instituto de Investigación TecnológicaEscuela Técnica Superior de Ingeniería ICAI
6th Annual Trans-Atlantic INFRADAY - Renato Dias Bleasby RodriguesNovember 9, 2012
Necessity for ex-ant assessments on energy policies with economy-wide consequences: Cost benefit analysis, identification of economic agents affected, evaluation of
technology alternatives, allocation of the economic burden, … Take into account multiple production sectors and demanding agents Have the electricity technological and production specific time behavior
Case study examples:
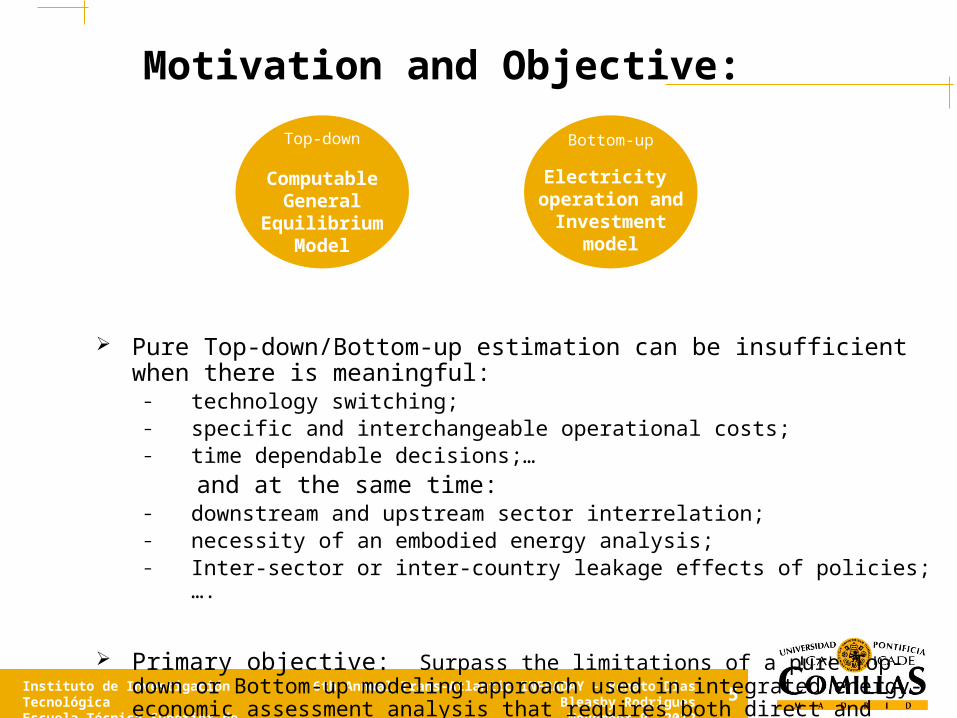
Motivation and Objective:
Renewable intermittence and reserve margin requirements
Active demand response
Transmission and distribution tariffs differentiated by consumption profile
Electric vehicles as storage units
Elasticity evaluations
5Instituto de Investigación TecnológicaEscuela Técnica Superior de Ingeniería ICAI
6th Annual Trans-Atlantic INFRADAY - Renato Dias Bleasby RodriguesNovember 9, 2012
Pure Top-down/Bottom-up estimation can be insufficient when there is meaningful:
– technology switching;– specific and interchangeable operational costs;– time dependable decisions;…
and at the same time:– downstream and upstream sector interrelation;– necessity of an embodied energy analysis;– Inter-sector or inter-country leakage effects of policies;….
Primary objective: Surpass the limitations of a pure Top-down or Bottom-up modeling approach used in integrated energy-economic assessment analysis that requires both direct and indirect effects evaluations.
Motivation and Objective:
Bottom-up
Electricity operation and
Investmentmodel
Top-down
ComputableGeneral
EquilibriumModel

2
Modeling framework

7Instituto de Investigación TecnológicaEscuela Técnica Superior de Ingeniería ICAI
6th Annual Trans-Atlantic INFRADAY - Renato Dias Bleasby RodriguesNovember 9, 2012
Bottom-up Electricity Expansion Lineal Model (and MCP version)
Top-down Pure CGE Model (traditional or with technological disaggregation)
GEMED - Electricity Extended Top-down Pure CGE Model• load block, location and electricity producing technologies detail• SAM disaggregation model (to make compatible technological and statistical
data)
Hybrid GEMED and Decomposed Hybrid GEMED
Modeling framework
Direct sector related effects
Indirect economy wide effects
BU - electricity model Very good noneTD - CGE model Very limited goodTD - CGE with technology Limited goodTD - CGE with tech and time Good Very goodHybrid model Very good Very good

8Instituto de Investigación TecnológicaEscuela Técnica Superior de Ingeniería ICAI
6th Annual Trans-Atlantic INFRADAY - Renato Dias Bleasby RodriguesNovember 9, 2012
What is the difference?
• It still follows a CGE production function structure but:
Electricity is treated as a time heterogeneous commodity:
One electricity product for each different load level.
Electricity activity is disaggregated according regional transmission restrictions (zonal prices and different technologies portfolios).
Different load profiles represented for each one of the different electricity demanders.
Load block dependable generation technology portfolios, with disaggregated capital, labor, taxes and intermediary inputs expenses.
Representation of thermodynamic efficiency, technologies production capacity, overnight costs, construction time,… inserted into the CGE model as parameters.
General Equilibrium Model with Electricity Detail
9Instituto de Investigación TecnológicaEscuela Técnica Superior de Ingeniería ICAI
6th Annual Trans-Atlantic INFRADAY - Renato Dias Bleasby RodriguesNovember 9, 2012
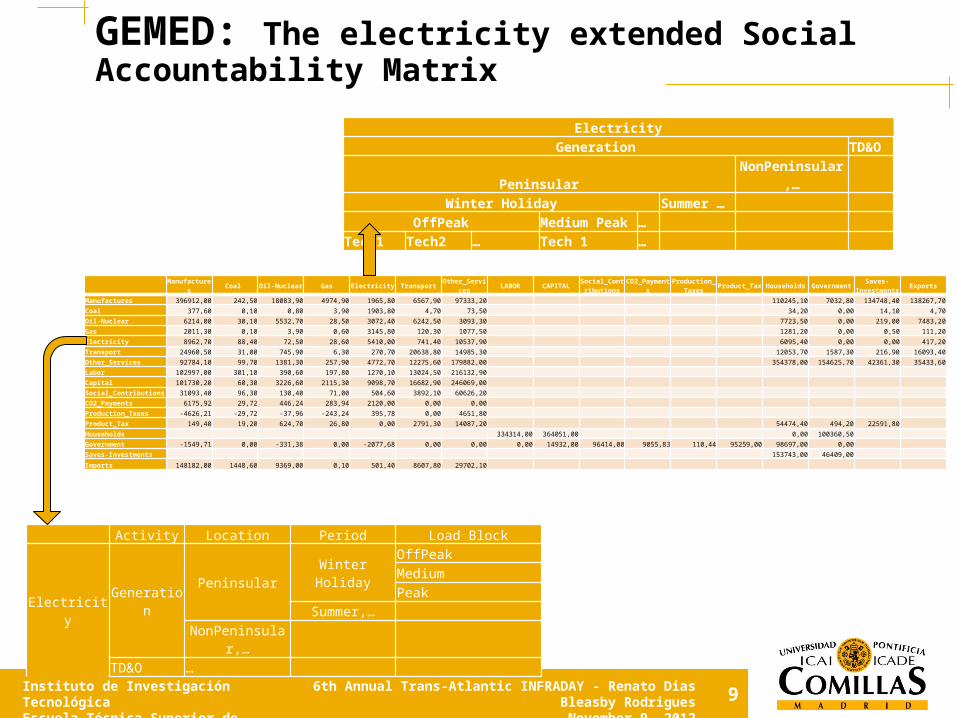
GEMED: The electricity extended Social Accountability Matrix
Manufactur
esCoal Oil-Nuclear Gas Electricity Transport
Other_Services
LABOR CAPITALSocial_Cont
ributionsCO2_Payme
ntsProduction_
TaxesProduct_Ta
x Households
Government
Saves-Investment
sExports
Manufactures 396912,00 242,50 18083,90 4974,90 1965,80 6567,90 97333,20 110245,10 7032,80 134748,40 138267,70
Coal 377,60 0,10 0,80 3,90 1903,80 4,70 73,50 34,20 0,00 14,10 4,70
Oil-Nuclear 6214,00 30,10 5532,70 28,50 3072,40 6242,50 3093,30 7723,50 0,00 219,00 7483,20
Gas 2011,30 0,10 3,90 0,60 3145,80 120,30 1077,50 1281,20 0,00 0,50 111,20
Electricity 8962,70 88,40 72,50 28,60 5410,00 741,40 10537,90 6095,40 0,00 0,00 417,20
Transport 24960,50 31,00 745,90 6,30 270,70 20638,80 14985,30 12053,70 1587,30 216,90 16093,40
Other_Services 92784,10 99,70 1381,30 257,90 4772,70 12275,60 179882,00 354378,00 154625,70 42361,30 35433,60
Labor 102997,00 301,10 390,60 197,80 1270,10 13024,50 216132,90
Capital 101730,20 60,30 3226,60 2115,30 9098,70 16682,90 246069,00
Social_Contributions 31093,40 96,30 130,40 71,00 504,60 3892,10 60626,20
CO2_Payments 6175,92 29,72 446,24 283,94 2120,00 0,00 0,00
Production_Taxes -4626,21 -29,72 -37,96 -243,24 395,78 0,00 4651,80
Product_Tax 149,40 19,20 624,70 26,80 0,00 2791,30 14087,20 54474,40 494,20 22591,80
Households 334314,00 364051,00 0,00 100360,50
Government -1549,71 0,00 -331,38 0,00 -2077,68 0,00 0,00 0,00 14932,00 96414,00 9055,83 110,44 95259,00 98697,00 0,00
Saves-Investments 153743,00 46409,00
Imports 148182,00 1448,60 9369,00 0,10 501,40 8607,80 29702,10
Activity Location Period Load Block
ElectricityGeneratio
n
PeninsularWinter Holiday
OffPeakMediumPeak
Summer,…NonPeninsular,
…
TD&O …
ElectricityGeneration TD&O
PeninsularNonPeninsular
,…
Winter HolidaySummer …
OffPeakMedium Peak …
Tech1 Tech2 … Tech 1 …

10Instituto de Investigación TecnológicaEscuela Técnica Superior de Ingeniería ICAI
6th Annual Trans-Atlantic INFRADAY - Renato Dias Bleasby RodriguesNovember 9, 2012
GEMED: The production structure

11Instituto de Investigación TecnológicaEscuela Técnica Superior de Ingeniería ICAI
6th Annual Trans-Atlantic INFRADAY - Renato Dias Bleasby RodriguesNovember 9, 2012
Identify costs in the BU model and associated parameters:
CGE
GEMED: How do we do it?
power generation operation and expansion
Cost type Associated technology parametersFuel Thermodynamic efficiency, generated power, fuel price Variable O&M Variable O&M costs by technology, generated powerFixed O&M Fixed O&M costs by technology, installed capacityCapital Overnight costs, construction time, years of amortization, real discount rate, interest rate , installed capacityLabor labor use by technology, installed capacity, social contributionsTaxes Direct and indirect taxes, renewable subsidies,…Own consumption electricity own consumption by technology, electricity priceLosses electricity losses in the grid, electricity pricePumping pumping efficiency an generated power, electricity price

12Instituto de Investigación TecnológicaEscuela Técnica Superior de Ingeniería ICAI
6th Annual Trans-Atlantic INFRADAY - Renato Dias Bleasby RodriguesNovember 9, 2012
Fixed costs, non accounted costs and market failures distribution by load blocks:
Nuclear
p
q
CCGT Fuel oil
Carbon
Fixed costs: Annual O&M; installed capacity amortization;new capacity installation;…
Non accounted costs:Ramp and Startup costs;…
Market failures:Presence of non competitive market power rents.
Nuclear
p
q
CCGT Fuel oil
Carbon
GEMED: How do we do it?

13Instituto de Investigación TecnológicaEscuela Técnica Superior de Ingeniería ICAI
6th Annual Trans-Atlantic INFRADAY - Renato Dias Bleasby RodriguesNovember 9, 2012
Min Max Deviation
power generation operation and expansion
Electricity prices Fixed costs distribution by load blocks Non accounted costs and market imperfections rents
Adjusted technology parameters
Extended SAMwith technology and load block disaggregation
GEMED: How do we do it?

Case Study
3

15Instituto de Investigación TecnológicaEscuela Técnica Superior de Ingeniería ICAI
6th Annual Trans-Atlantic INFRADAY - Renato Dias Bleasby RodriguesNovember 9, 2012
Household active demand response potential savings in Spain
1 2 3 4 5 6 7 8 9 10
11
12
13
14
15
16
17
18
19
20
21
22
23
24
0
2000
4000
6000
8000
10000
12000
14000
Efficiency effect
Original domestic demand DR domestic demand
1 2 3 4 5 6 7 8 9 10
11
12
13
14
15
16
17
18
19
20
21
22
23
24
0
2000
4000
6000
8000
10000
12000
14000
Load displacement effect
Original domestic demand DR domestic demand
Consumption variation with ADRAppliance Displacement Reduction ADR actionsWashing machine 100% 40% · Full shutdownDishwasher 100% 40% · ECO programDryer 100% 20% · LimitationsWater heating 50% 30% · stop / partial shutdownHeating - 50% · Unacceptable shutdown
Air-conditioner - 50%· Power limitations, thermostat, time zones ...
Others - - Non manageable
Case study: Household Demand Response Simulation

16Instituto de Investigación TecnológicaEscuela Técnica Superior de Ingeniería ICAI
6th Annual Trans-Atlantic INFRADAY - Renato Dias Bleasby RodriguesNovember 9, 2012
Active demand response demand balance:
Maximum displacement:
Displacement balance:
Potency conservation limit:
Minimal savings requirement:
Case study: Household Demand Response Simulation
17Instituto de Investigación TecnológicaEscuela Técnica Superior de Ingeniería ICAI
6th Annual Trans-Atlantic INFRADAY - Renato Dias Bleasby RodriguesNovember 9, 2012
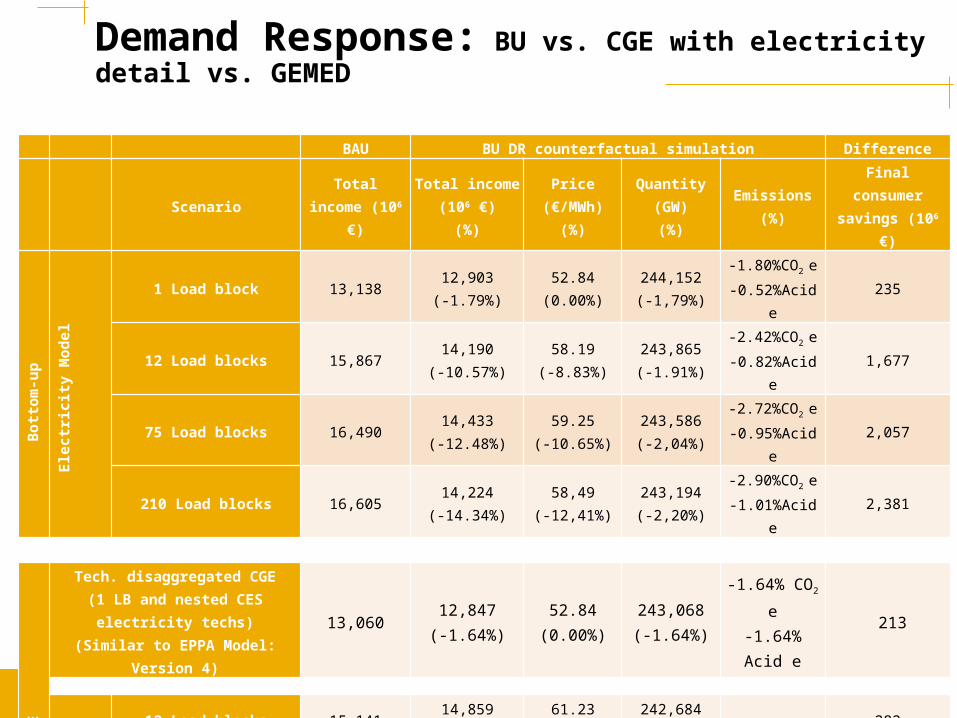
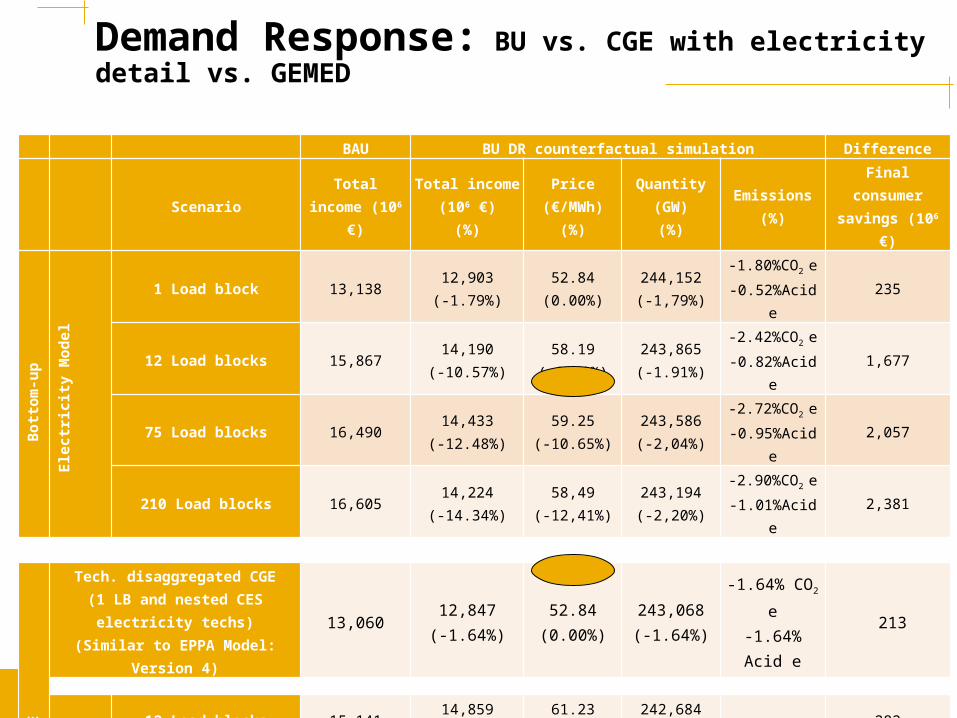
Demand Response: BU vs. CGE with electricity detail vs. GEMED
BAU BU DR counterfactual simulation Difference
ScenarioTotal
income (106 €)
Total income(106 €)
(%)
Price (€/MWh)
(%)
Quantity(GW)(%)
Emissions(%)
Final consumer
savings (106 €)
Botto
m-up
Electricity
Model
1 Load block 13,13812,903
(-1.79%)52.84
(0.00%)244,152(-1,79%)
-1.80%CO2 e
-0.52%Acid e235
12 Load blocks 15,86714,190
(-10.57%)58.19
(-8.83%)243,865(-1.91%)
-2.42%CO2 e
-0.82%Acid e1,677
75 Load blocks 16,49014,433
(-12.48%)59.25
(-10.65%)243,586(-2,04%)
-2.72%CO2 e
-0.95%Acid e2,057
210 Load blocks 16,60514,224
(-14.34%)58,49
(-12,41%)243,194(-2,20%)
-2.90%CO2 e
-1.01%Acid e2,381
Top-down CGE
Tech. disaggregated CGE(1 LB and nested CES
electricity techs)(Similar to EPPA Model:
Version 4)
13,060 12,847(-1.64%)
52.84(0.00%)
243,068(-1.64%)
-1.64% CO2 e-1.64% Acid e
213
GEMED
(tech and time disaggregation)
12 Load blocks 15,14114,859
(-1.86%)61.23
(-0.06%)242,684(-1.80%)
282
75 load blocks 15,53815,226
(-2.01%)62.81
(-0.07%)242,399(-1.94%)
312
210 load blocks 15,61315,238
(-2.40%)63.03
(-0.21%)241,762(-2.20%)
375

18Instituto de Investigación TecnológicaEscuela Técnica Superior de Ingeniería ICAI
6th Annual Trans-Atlantic INFRADAY - Renato Dias Bleasby RodriguesNovember 9, 2012
Demand Response: BU vs. CGE with electricity detail vs. GEMED
BAU BU DR counterfactual simulation Difference
ScenarioTotal
income (106 €)
Total income(106 €)
(%)
Price (€/MWh)
(%)
Quantity(GW)(%)
Emissions(%)
Final consumer
savings (106 €)
Botto
m-up
Electricity
Model
1 Load block 13,13812,903
(-1.79%)52.84
(0.00%)244,152(-1,79%)
-1.80%CO2 e
-0.52%Acid e235
12 Load blocks 15,86714,190
(-10.57%)58.19
(-8.83%)243,865(-1.91%)
-2.42%CO2 e
-0.82%Acid e1,677
75 Load blocks 16,49014,433
(-12.48%)59.25
(-10.65%)243,586(-2,04%)
-2.72%CO2 e
-0.95%Acid e2,057
210 Load blocks 16,60514,224
(-14.34%)58,49
(-12,41%)243,194(-2,20%)
-2.90%CO2 e
-1.01%Acid e2,381
Top-down CGE
Tech. disaggregated CGE(1 LB and nested CES
electricity techs)(Similar to EPPA Model:
Version 4)
13,060 12,847(-1.64%)
52.84(0.00%)
243,068(-1.64%)
-1.64% CO2 e-1.64% Acid e
213
GEMED
(tech and time disaggregation)
12 Load blocks 15,14114,859
(-1.86%)61.23
(-0.06%)242,684(-1.80%)
282
75 load blocks 15,53815,226
(-2.01%)62.81
(-0.07%)242,399(-1.94%)
312
210 load blocks 15,61315,238
(-2.40%)63.03
(-0.21%)241,762(-2.20%)
375

19Instituto de Investigación TecnológicaEscuela Técnica Superior de Ingeniería ICAI
6th Annual Trans-Atlantic INFRADAY - Renato Dias Bleasby RodriguesNovember 9, 2012
Demand Response: BU vs. CGE with electricity detail vs. GEMED
BAU BU DR counterfactual simulation Difference
ScenarioTotal
income (106 €)
Total income(106 €)
(%)
Price (€/MWh)
(%)
Quantity(GW)(%)
Emissions(%)
Final consumer
savings (106 €)
Botto
m-up
Electricity
Model
1 Load block 13,13812,903
(-1.79%)52.84
(0.00%)244,152(-1,79%)
-1.80%CO2 e
-0.52%Acid e235
12 Load blocks 15,86714,190
(-10.57%)58.19
(-8.83%)243,865(-1.91%)
-2.42%CO2 e
-0.82%Acid e1,677
75 Load blocks 16,49014,433
(-12.48%)59.25
(-10.65%)243,586(-2,04%)
-2.72%CO2 e
-0.95%Acid e2,057
210 Load blocks 16,60514,224
(-14.34%)58,49
(-12,41%)243,194(-2,20%)
-2.90%CO2 e
-1.01%Acid e2,381
Top-down CGE
Tech. disaggregated CGE(1 LB and nested CES
electricity techs)(Similar to EPPA Model:
Version 4)
13,060 12,847(-1.64%)
52.84(0.00%)
243,068(-1.64%)
-1.64% CO2 e-1.64% Acid e
213
GEMED
(tech and time disaggregation)
12 Load blocks 15,14114,859
(-1.86%)61.23
(-0.06%)242,684(-1.80%)
282
75 load blocks 15,53815,226
(-2.01%)62.81
(-0.07%)242,399(-1.94%)
312
210 load blocks 15,61315,238
(-2.40%)63.03
(-0.21%)241,762(-2.20%)
375

20Instituto de Investigación TecnológicaEscuela Técnica Superior de Ingeniería ICAI
6th Annual Trans-Atlantic INFRADAY - Renato Dias Bleasby RodriguesNovember 9, 2012
Demand Response: BU vs. CGE with electricity detail vs. GEMED
BAU BU DR counterfactual simulation Difference
ScenarioTotal
income (106 €)
Total income(106 €)
(%)
Price (€/MWh)
(%)
Quantity(GW)(%)
Emissions(%)
Final consumer
savings (106 €)
Botto
m-up
Electricity
Model
1 Load block 13,13812,903
(-1.79%)52.84
(0.00%)244,152(-1,79%)
-1.80%CO2 e
-0.52%Acid e235
12 Load blocks 15,86714,190
(-10.57%)58.19
(-8.83%)243,865(-1.91%)
-2.42%CO2 e
-0.82%Acid e1,677
75 Load blocks 16,49014,433
(-12.48%)59.25
(-10.65%)243,586(-2,04%)
-2.72%CO2 e
-0.95%Acid e2,057
210 Load blocks 16,60514,224
(-14.34%)58,49
(-12,41%)243,194(-2,20%)
-2.90%CO2 e
-1.01%Acid e2,381
Top-down CGE
Tech. disaggregated CGE(1 LB and nested CES
electricity techs)(Similar to EPPA Model:
Version 4)
13,060 12,847(-1.64%)
52.84(0.00%)
243,068(-1.64%)
-1.64% CO2 e-1.64% Acid e
213
GEMED
(tech and time disaggregation)
12 Load blocks 15,14114,859
(-1.86%)61.23
(-0.06%)242,684(-1.80%)
282
75 load blocks 15,53815,226
(-2.01%)62.81
(-0.07%)242,399(-1.94%)
312
210 load blocks 15,61315,238
(-2.40%)63.03
(-0.21%)241,762(-2.20%)
375
21Instituto de Investigación TecnológicaEscuela Técnica Superior de Ingeniería ICAI
6th Annual Trans-Atlantic INFRADAY - Renato Dias Bleasby RodriguesNovember 9, 2012
Demand Response: BU vs. CGE with electricity detail vs. GEMED
BAU BU DR counterfactual simulation Difference
ScenarioTotal
income (106 €)
Total income(106 €)
(%)
Price (€/MWh)
(%)
Quantity(GW)(%)
Emissions(%)
Final consumer
savings (106 €)
Botto
m-up
Electricity
Model
1 Load block 13,13812,903
(-1.79%)52.84
(0.00%)244,152(-1,79%)
-1.80%CO2 e
-0.52%Acid e235
12 Load blocks 15,86714,190
(-10.57%)58.19
(-8.83%)243,865(-1.91%)
-2.42%CO2 e
-0.82%Acid e1,677
75 Load blocks 16,49014,433
(-12.48%)59.25
(-10.65%)243,586(-2,04%)
-2.72%CO2 e
-0.95%Acid e2,057
210 Load blocks 16,60514,224
(-14.34%)58,49
(-12,41%)243,194(-2,20%)
-2.90%CO2 e
-1.01%Acid e2,381
Top-down CGE
Tech. disaggregated CGE(1 LB and nested CES
electricity techs)(Similar to EPPA Model:
Version 4)
13,060 12,847(-1.64%)
52.84(0.00%)
243,068(-1.64%)
-1.64% CO2 e-1.64% Acid e
213
GEMED
(tech and time disaggregation)
12 Load blocks 15,14114,859
(-1.86%)61.23
(-0.06%)242,684(-1.80%)
282
75 load blocks 15,53815,226
(-2.01%)62.81
(-0.07%)242,399(-1.94%)
312
210 load blocks 15,61315,238
(-2.40%)63.03
(-0.21%)241,762(-2.20%)
375

22Instituto de Investigación TecnológicaEscuela Técnica Superior de Ingeniería ICAI
6th Annual Trans-Atlantic INFRADAY - Renato Dias Bleasby RodriguesNovember 9, 2012
4. GEMED - General Equilibrium Model with Electricity Detail
Verdict on the GEMED model:
Good at: Capable of addressing displacement effects, and consequently much better
quantities representation. Indirect effects evaluation enriched by agents electricity load profiles
representation. Much better representation of technologies portfolio choices, and consequently
better representation of fuel and other suppliers policy consequences.
Bad at: Technological substitution and backstop technologies still limited by the
production function structure. Direction of marginal settlement prices better represented however their
magnitude is still highly underestimated because the lack of expensive peak unit technologies retirement.

1. Were do we go now?
4
24Instituto de Investigación TecnológicaEscuela Técnica Superior de Ingeniería ICAI
6th Annual Trans-Atlantic INFRADAY - Renato Dias Bleasby RodriguesNovember 9, 2012
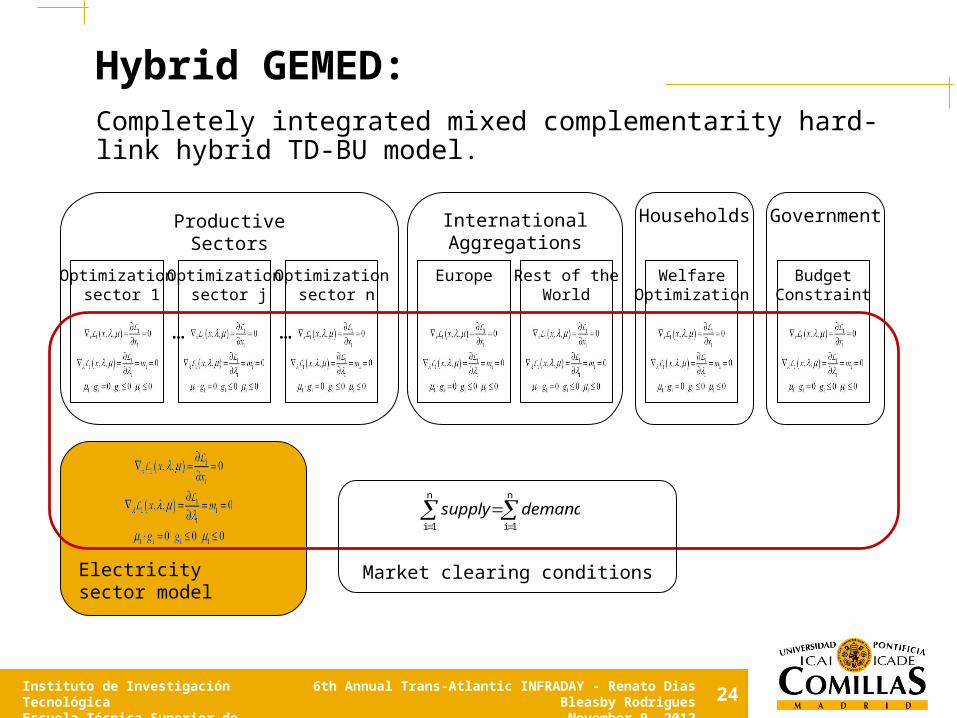
Electricitysector model
ProductiveSectors
Optimization sector 1
Optimization sector j
Optimization sector n
… …
InternationalAggregations
Europe
Households
WelfareOptimization
Rest of theWorld
Government
BudgetConstraint
n
1i
n
1i
demandsupply
Market clearing conditions
Hybrid GEMED:Completely integrated mixed complementarity hard-link hybrid TD-BU model.
25Instituto de Investigación TecnológicaEscuela Técnica Superior de Ingeniería ICAI
6th Annual Trans-Atlantic INFRADAY - Renato Dias Bleasby RodriguesNovember 9, 2012
• The Hybrid model adds complexity in number of variables and equations.• Work around:
– Decompose the electricity investment decision (or even the entire electricity production decision) from the Hybrid GEMED model using benders decomposition or similar solution space constraint techniques.
• Research is currently under way to determine feasibility, calibration procedures, equation formulations and decomposition techniques for such a model, and in particular, to using it in a real-world setting.
• How it is different from the iterative process of solving a bottom-up model and feeding the Top-down model with its results until a convergence is reached.
– It is based on making optimal cuts to the feasible region of the master problem, what gives a much more robust result without underestimating the indirect effects consequences (avoiding the rabbit-and-elephant analogy).
– Not only prices are sent and quantities are received as in most of the iterative model solutions using CGE and Bottom-up models. Dual and primal information are shared between models.
Decomposed Hybrid GEMED
Conclusions
5

27Instituto de Investigación TecnológicaEscuela Técnica Superior de Ingeniería ICAI
6th Annual Trans-Atlantic INFRADAY - Renato Dias Bleasby RodriguesNovember 9, 2012
Conclusions: (1/4) Electricity technology detail in CGE models can be insufficient to address
specific electricity issues such as: Active demand response potential; Electric vehicles impacts; Demand, price and cross elasticity evaluations; Environmental effects, carbon tax, electricity tariffs, fuel subsidies,…
We presented the first attempt to our knowledge at building temporal disaggregation into a CGE model, while keeping technological detail. The GEMED model is capable of addressing:
Time differentiation at the electricity level reflecting: electricity load block approximated marginal prices behavior; distribution of capital amortization and fixed costs payments between different
load blocks; market power rents and other sources of costs represent at the aggregated
national accountability data of the electricity sector. Electricity generation technology detail Location specific detail,…

28Instituto de Investigación TecnológicaEscuela Técnica Superior de Ingeniería ICAI
6th Annual Trans-Atlantic INFRADAY - Renato Dias Bleasby RodriguesNovember 9, 2012
Conclusions: (2/4)
A calibration method was developed to reconcialiate the large amount of bottom-up parameters details to either a CGE model with electricity load blocks and technologies detail and also to a completely integrated hybrid Top-down CGE and Bottom-up electricity operation and planning model.
The addition of load block disaggregation allowed the CGE model to assess endogenously the effects of load shifts, impossible to represent under a single load block assumption.
The resulting TD model mimics the rich description of the electricity sector production decisions present in the BU electricity models without overlooking the indirect effects and inter-sectorial and institutional consequences of the energy policies.
29Instituto de Investigación TecnológicaEscuela Técnica Superior de Ingeniería ICAI
6th Annual Trans-Atlantic INFRADAY - Renato Dias Bleasby RodriguesNovember 9, 2012
Conclusions: (3/4) This improved representation of electricity activity enriches the evaluation
of indirect and rebound effects by the CGE modeling approach. The direct consequence of such extension is a better representation of the policy consequences on other sectors, most specially fuel suppliers and high capital demanders .
In addition, we have shown the feasibility of applying the GEMED model to:
– A real-world policy assessment, the assessment of a household demand response program;
– A real-world economy and all dimensionalities problems associated with that.
• The case study took into account the actual Spanish electricity facilities and technology availability, the operation and future investments decision, and the national accounting data of the Spanish economy.
– The presence of distinct electricity markets with different market structures and conditions (the peninsular and the extra-peninsular Spanish markets).

30Instituto de Investigación TecnológicaEscuela Técnica Superior de Ingeniería ICAI
6th Annual Trans-Atlantic INFRADAY - Renato Dias Bleasby RodriguesNovember 9, 2012
Conclusions: (4/4)
Nevertheless, the results obtained by this work are still susceptible to improvements.
– The CGE statistical production function structure limits the representation of important market dynamics effects like:
• the retirement of non competitive technologies;• the inclusion of backstop technologies;• The representation of start-up costs;• the simulation of penetration and consequences of intermittent
sources.
Developing a completely integrated mixed complementarity hard-link hybrid TD-BU model and a decomposed hybrid model are the normal path improvements for such policy assessments.

Thank you for your attention!Questions and comments are welcome!
Contact info: [email protected]://www.iit.upcomillas.es/rdias/
?
32Instituto de Investigación TecnológicaEscuela Técnica Superior de Ingeniería ICAI
6th Annual Trans-Atlantic INFRADAY - Renato Dias Bleasby RodriguesNovember 9, 2012
References
RODRIGUES, R.; PEDRO, L.. Introducing electricity load level detail into a CGE model – The GEMED model. Under review in Energy Economics. July, 2012.
RODRIGUES, R.; PEDRO, L.. GEMED report version 0.1. http://www.iit.upcomillas.es/rdias/Static_GEMED.html