november 2006 copyright © 2006 mississippi department of education 1 where are we? where do we want...
TRANSCRIPT
November 2006 Copyright © 2006 Mississippi Department of Education 1
Where are We?Where do we want to be?
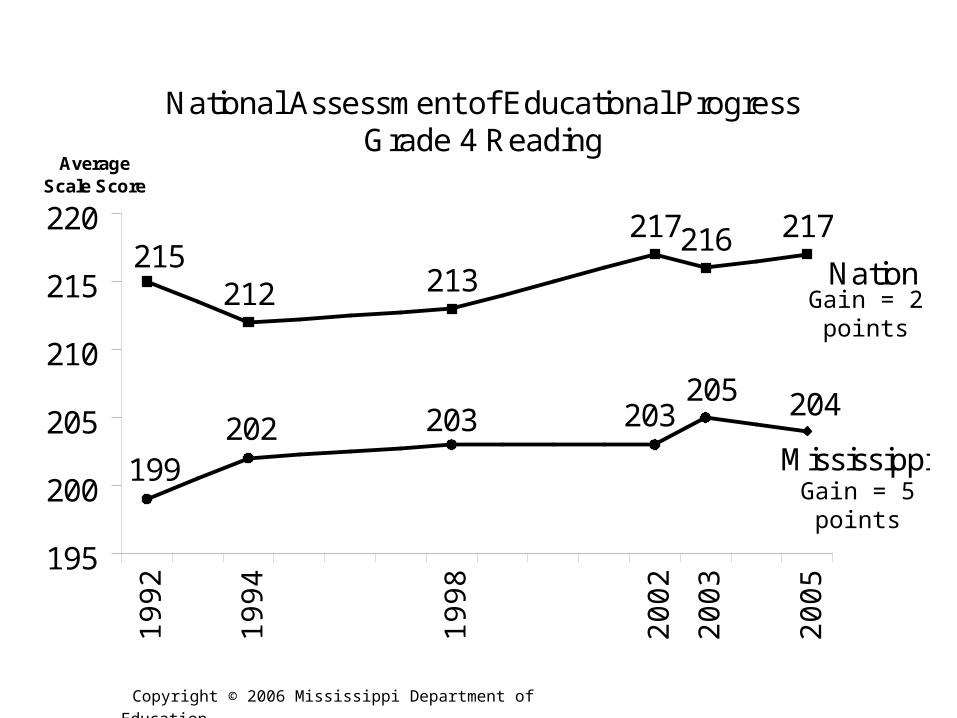
Gain = 2 points
Gain = 5 points
National Assessment of Educational ProgressGrade 4 Reading
204
199202 203
205203
217216217
213212215
195
200
205
210
215
220
1992
1994
1998
2002
2003
2005
Average Scale Score
Nation
Mississippi
Copyright © 2006 Mississippi Department of Education
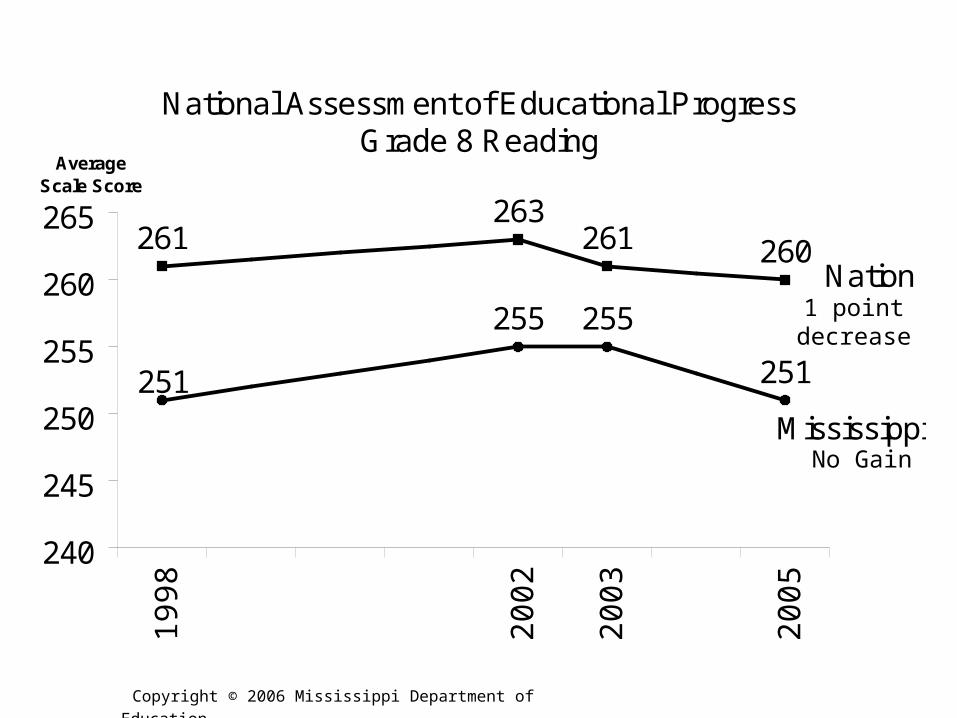
1 point decrease
No Gain
National Assessment of Educational ProgressGrade 8 Reading
255
251
261263
261 260
251
255
240
245
250
255
260
265
1998
2002
2003
2005
Average Scale Score
Nation
Mississippi
Copyright © 2006 Mississippi Department of Education
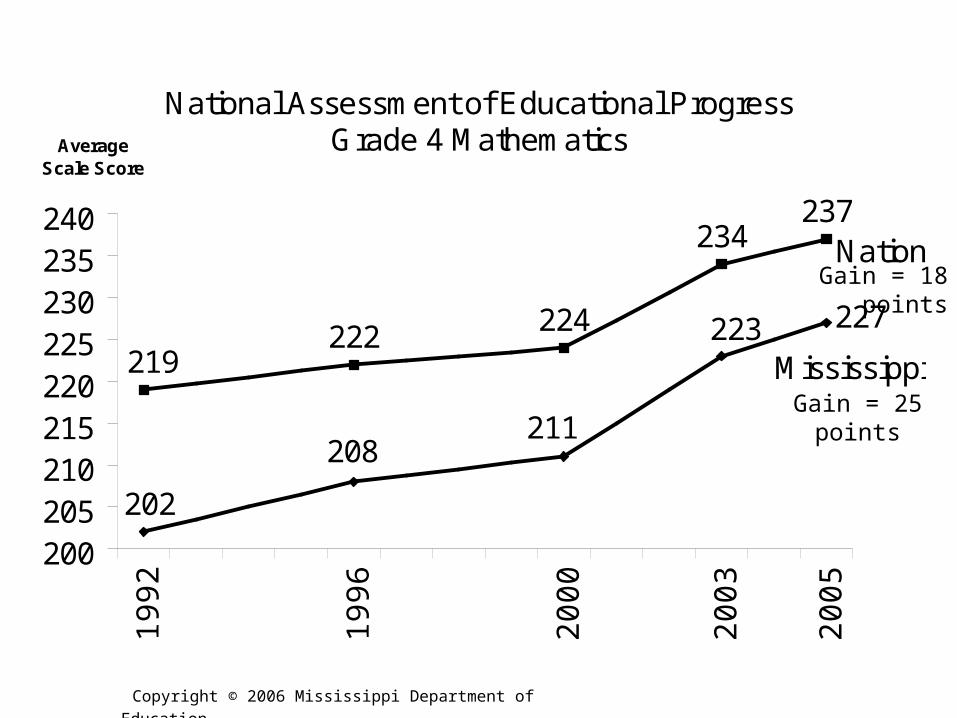
Gain = 25 points
Gain = 18 points
National Assessment of Educational ProgressGrade 4 Mathematics
222 224
234237
227223
211208
202
219
200205210215220225230235240
1992
1996
2000
2003
2005
Average Scale Score
Nation
Mississippi
Copyright © 2006 Mississippi Department of Education
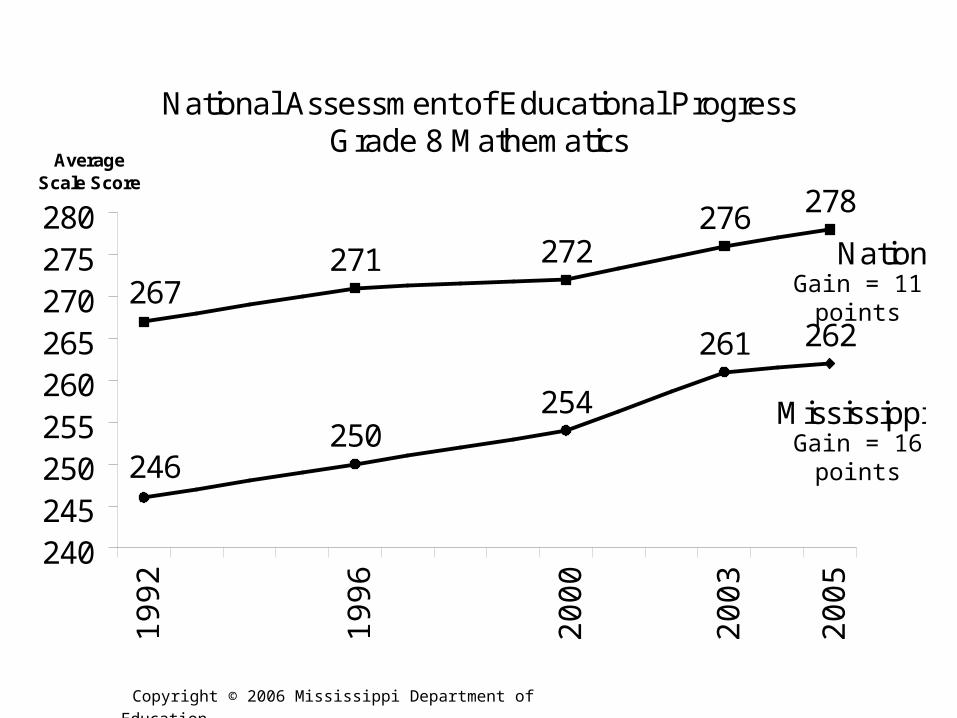
Gain = 16 points
Gain = 11 points
National Assessment of Educational ProgressGrade 8 Mathematics
250254
261 262
271 272276 278
246
267
240245250255260265270275280
1992
1996
2000
2003
2005
Average Scale Score
Nation
Mississippi
Copyright © 2006 Mississippi Department of Education

NAEP Proficiency Levels
Proficiency Level Description
Advanced Superior performance.
Proficient
Solid academic performance for each grade assessed. Students reaching this level have demonstrated competency over challenging subject matter, including subject-matter knowledge, application of such knowledge to real-world situations, and analytical skills appropriate to the subject matter.
BasicPartial mastery of prerequisite knowledge and skills that are fundamental for proficient work at each grade.
Minimal Below Basic.
November 2006 Copyright © 2006 Mississippi Department of Education 7
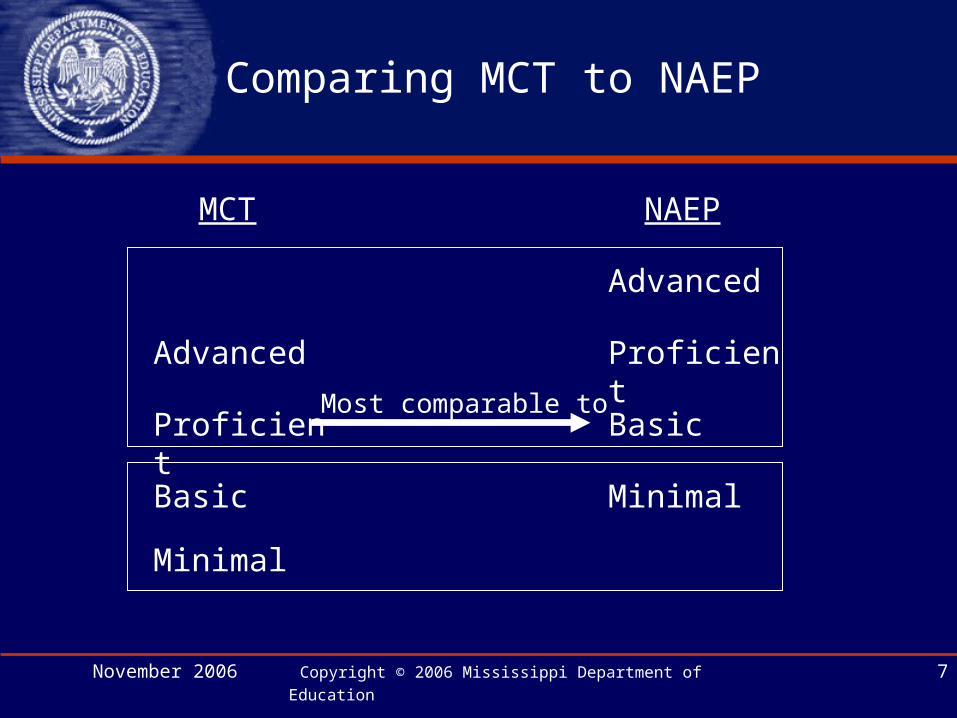
Comparing MCT to NAEP
MCT
Advanced
Proficient
Basic
Minimal
NAEP
Advanced
Proficient
Basic
Minimal
Most comparable to
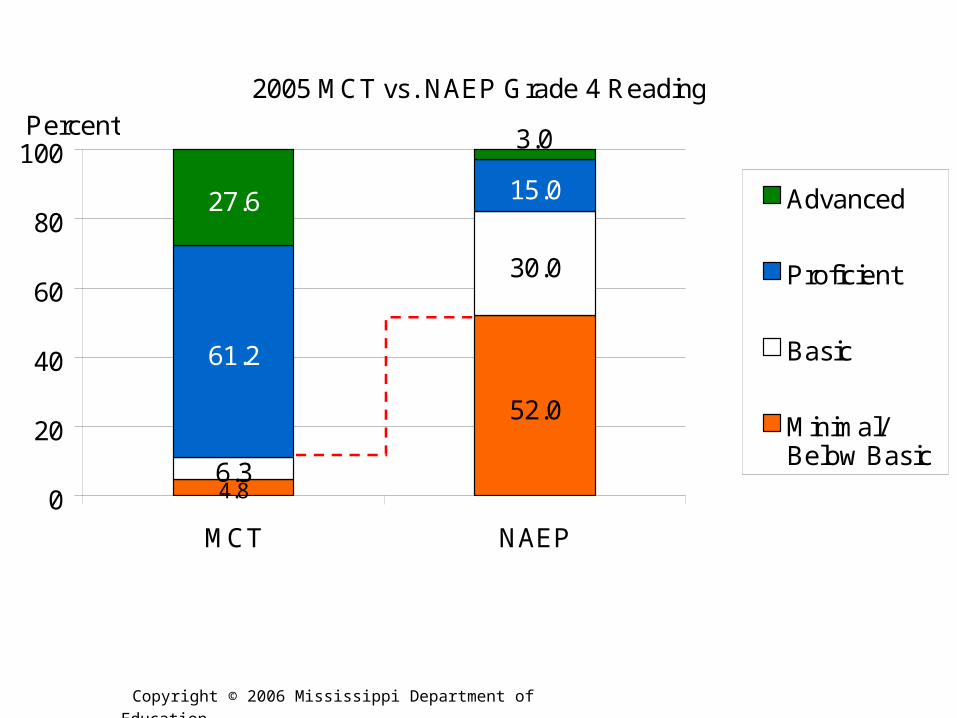
2005 MCT vs. NAEP Grade 4 Reading
52.0
6.3
30.0
61.2
15.0
4.8
3.0
27.6
0
20
40
60
80
100
MCT NAEP
Percent
Advanced
Proficient
Basic
Minimal/Below Basic
Copyright © 2006 Mississippi Department of Education

2005 MCT vs. NAEP Grade 8 Reading
19.040.0
24.2
42.045.2
18.011.6
1.0
0
20
40
60
80
100
MCT NAEP
Percent
Advanced
Proficient
Basic
Minimal/Below Basic
Copyright © 2006 Mississippi Department of Education

2005 MCT vs. NAEP Grade 4 Mathematics
7.2
31.014.0
50.0
40.1
18.038.8
1.0
0
20
40
60
80
100
MCT NAEP
Percent
Advanced
Proficient
Basic
Minimal/Below Basic
Copyright © 2006 Mississippi Department of Education

2005 MCT vs. NAEP Grade 8 Mathematics
22.4
48.024.5
38.029.2
12.023.9
1.0
0
20
40
60
80
100
MCT NAEP
Percent
Advanced
Proficient
Basic
Minimal/Below Basic
Copyright © 2006 Mississippi Department of Education
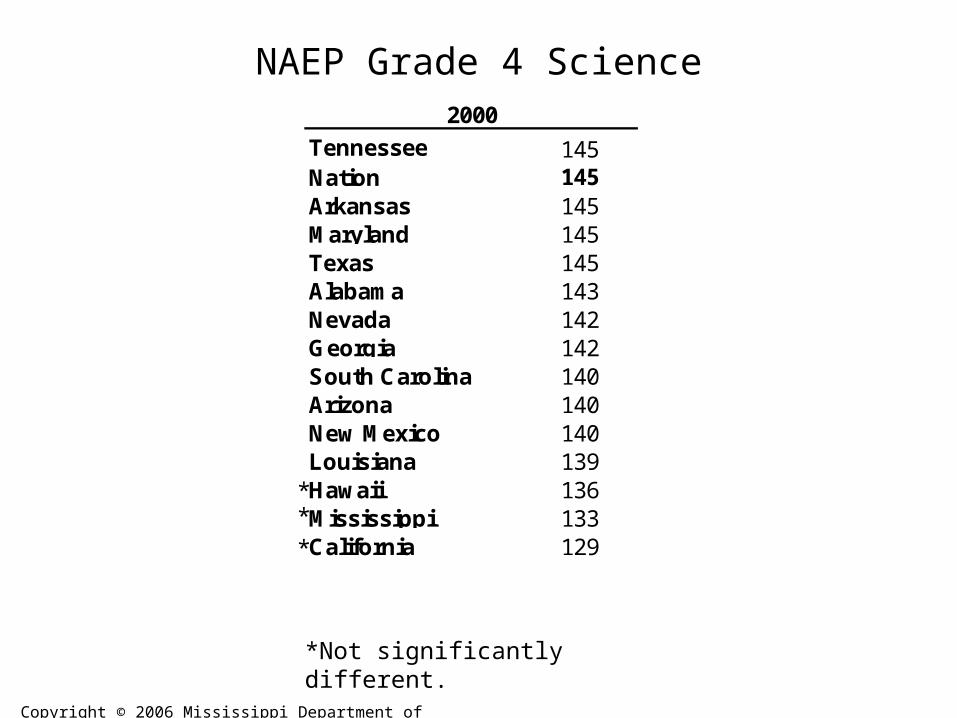
NAEP Grade 4 Science
Tennessee 145 Tennessee 150Nation 145 Florida 150Arkansas 145 Oklahoma 150Maryland 145 Texas 150Texas 145 Nation 149Alabama 143 Maryland 149Nevada 142 North Carolina 149Georgia 142 South Carolina 148South Carolina 140 Illinois 148Arizona 140 Georgia 148New Mexico 140 Arkansas 147Louisiana 139 Rhode Island 146Hawaii 136 Louisiana 143Mississippi 133 Alabama 142California 129 Hawaii 142
New Mexico 141Nevada 140Arizona 139California 137Mississippi 133
2005 2000
*Not significantly different.
***
Copyright © 2006 Mississippi Department of Education

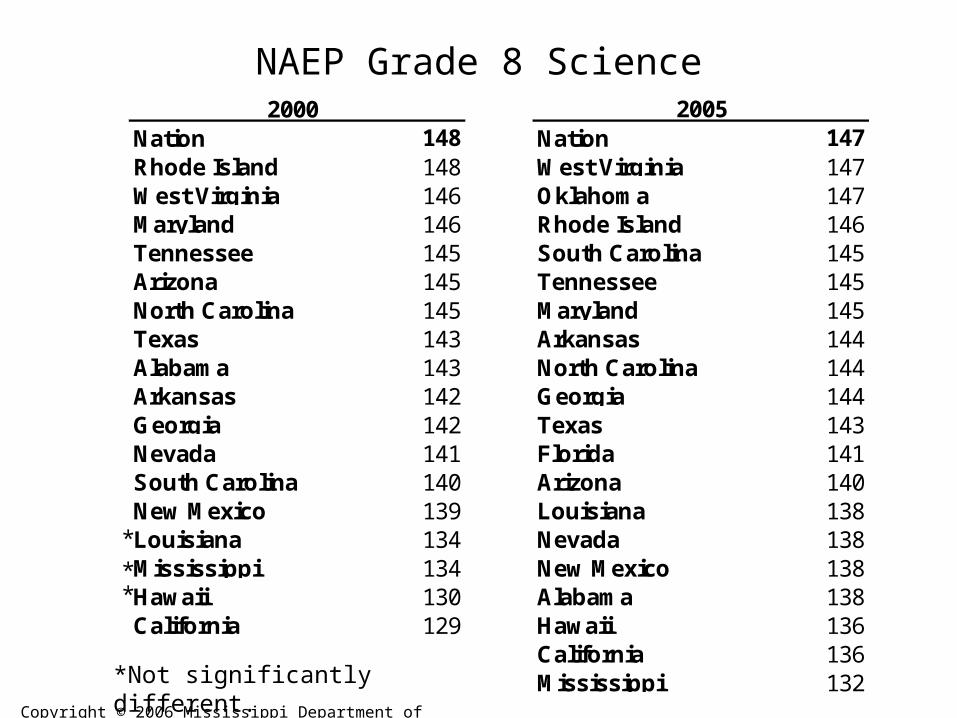
*Not significantly different.
***
Nation 148 Nation 147Rhode Island 148 West Virginia 147West Virginia 146 Oklahoma 147Maryland 146 Rhode Island 146Tennessee 145 South Carolina 145Arizona 145 Tennessee 145North Carolina 145 Maryland 145Texas 143 Arkansas 144Alabama 143 North Carolina 144Arkansas 142 Georgia 144Georgia 142 Texas 143Nevada 141 Florida 141South Carolina 140 Arizona 140New Mexico 139 Louisiana 138Louisiana 134 Nevada 138Mississippi 134 New Mexico 138Hawaii 130 Alabama 138California 129 Hawaii 136
California 136Mississippi 132
2000 2005
NAEP Grade 8 Science
Copyright © 2006 Mississippi Department of Education
NAEP Grade 8 Science
*Not significantly different.
***
Nation 148 Nation 147Rhode Island 148 West Virginia 147West Virginia 146 Oklahoma 147Maryland 146 Rhode Island 146Tennessee 145 South Carolina 145Arizona 145 Tennessee 145North Carolina 145 Maryland 145Texas 143 Arkansas 144Alabama 143 North Carolina 144Arkansas 142 Georgia 144Georgia 142 Texas 143Nevada 141 Florida 141South Carolina 140 Arizona 140New Mexico 139 Louisiana 138Louisiana 134 Nevada 138Mississippi 134 New Mexico 138Hawaii 130 Alabama 138California 129 Hawaii 136
California 136Mississippi 132
2000 2005
Copyright © 2006 Mississippi Department of Education

November 2006 Copyright © 2006 Mississippi Department of Education 16
How many of our students are college ready?
November 2006 Copyright © 2006 Mississippi Department of Education 17
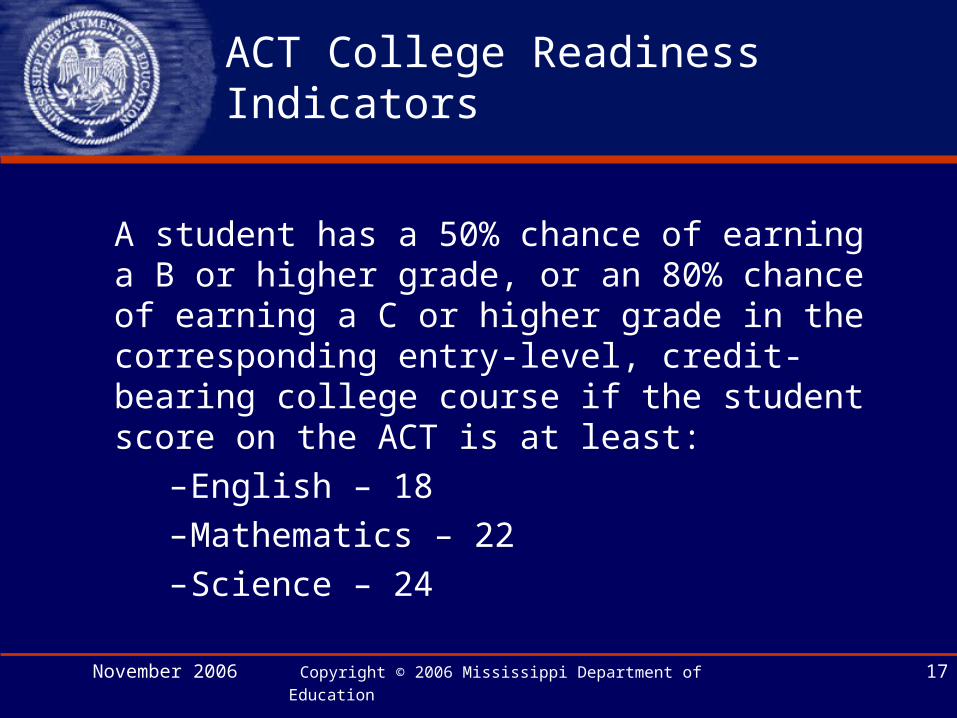
ACT College Readiness Indicators
A student has a 50% chance of earning a B or higher grade, or an 80% chance of earning a C or higher grade in the corresponding entry-level, credit-bearing college course if the student score on the ACT is at least:
–English – 18–Mathematics – 22–Science – 24

2005 ACT Tested High School Graduates Meeting College English Composition Readiness by English Course Sequence
Mississippi
43
54
63
0
10
20
30
40
50
60
70
80
Less than 4 years English 9-12 English 9-12 & Speech
Per
cent
Dem
onst
ratin
g R
eadi
ness
Copyright © 2006 Mississippi Department of Education

2005 ACT Tested High School Graduates Meeting College English Composition Readiness by English Course Sequence
43
54
6359
6871
0
10
20
30
40
50
60
70
80
Less than 4 years English 9-12 English 9-12 & Speech
Per
cent
Dem
onst
ratin
g R
eadi
ness
Mississippi Nation
Copyright © 2006 Mississippi Department of Education
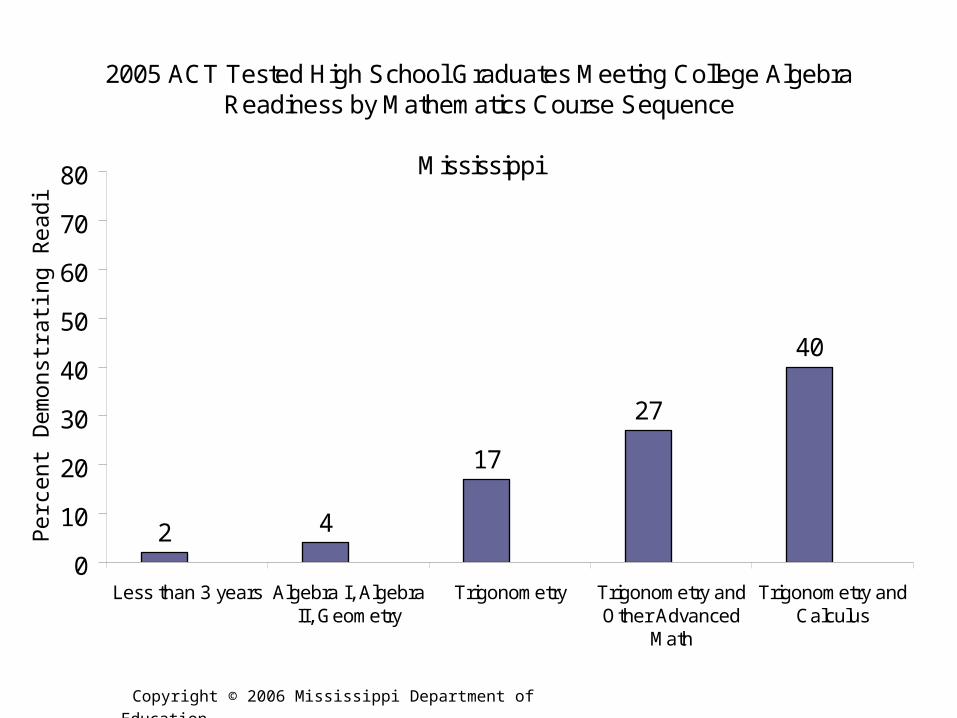
2005 ACT Tested High School Graduates Meeting College Algebra Readiness by Mathematics Course Sequence
Mississippi
2 4
17
27
40
0
10
20
30
40
50
60
70
80
Less than 3 years Algebra I, AlgebraII, Geometry
Trigonometry Trigonometry andOther Advanced
Math
Trigonometry andCalculus
Per
cent
Dem
onst
ratin
g R
eadi
ness
Copyright © 2006 Mississippi Department of Education

2005 ACT Tested High School Graduates Meeting College Algebra Readiness by Mathematics Course Sequence
2 4
17
27
40
15 14
38
56
73
0
10
20
30
40
50
60
70
80
Less than 3 years Algebra I, AlgebraII, Geometry
Trigonometry Trigonometry andOther Advanced
Math
Trigonometry andCalculus
Per
cent
Dem
onst
ratin
g R
eadi
ness
Mississippi Nation
Copyright © 2006 Mississippi Department of Education
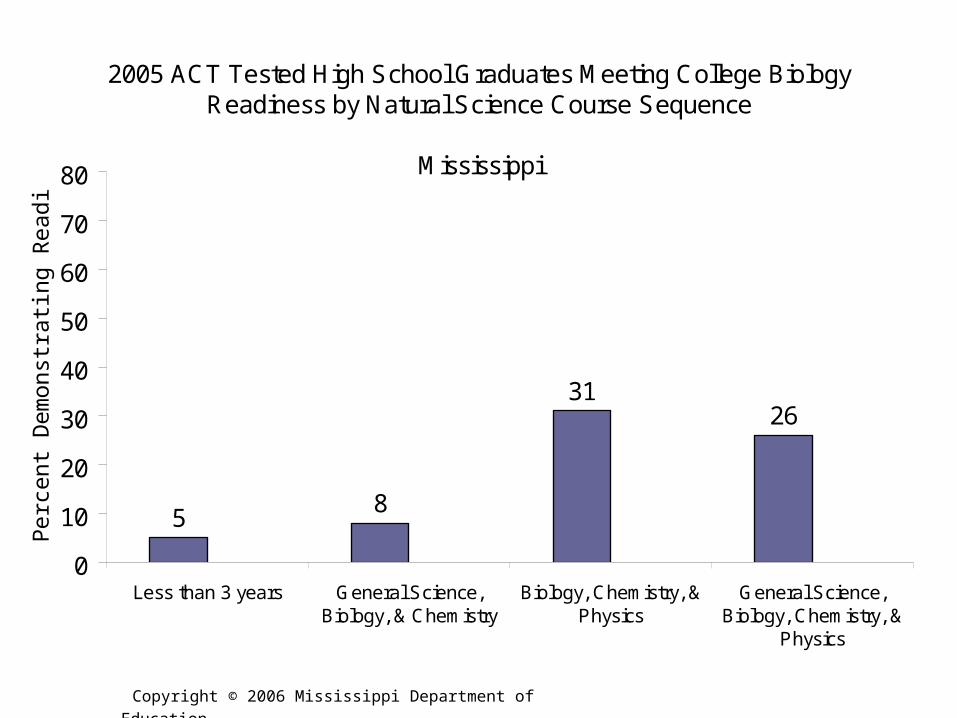
2005 ACT Tested High School Graduates Meeting College Biology Readiness by Natural Science Course Sequence
Mississippi
58
3126
0
10
20
30
40
50
60
70
80
Less than 3 years General Science,Biology, & Chemistry
Biology, Chemistry, &Physics
General Science,Biology, Chemistry, &
Physics
Per
cent
Dem
onst
ratin
g R
eadi
ness
Copyright © 2006 Mississippi Department of Education

2005 ACT Tested High School Graduates Meeting College Biology Readiness by Natural Science Course Sequence
58
3126
1319
4538
0
10
20
30
40
50
60
70
80
Less than 3 years General Science,Biology, & Chemistry
Biology, Chemistry, &Physics
General Science,Biology, Chemistry, &
Physics
Per
cent
Dem
onst
ratin
g R
eadi
ness
Mississippi Nation
Copyright © 2006 Mississippi Department of Education

2005 ACT Tested High School Graduates Meeting College Reading Readiness by Social Studies Course Sequence
Mississippi
18 20
36
0
10
20
30
40
50
60
70
80
Less than 3 years U.S. History, World History,and American Government
U.S. History, World History,American Government, &
Other
Per
cent
Dem
onst
ratin
g R
eadi
ness
Copyright © 2006 Mississippi Department of Education

2005 ACT Tested High School Graduates Meeting College Reading Readiness by Social Studies Course Sequence
18 20
36
4448
58
0
10
20
30
40
50
60
70
80
Less than 3 years U.S. History, World History,and American Government
U.S. History, World History,American Government, &
Other
Per
cent
Dem
onst
ratin
g R
eadi
ness
Mississippi Nation
Copyright © 2006 Mississippi Department of Education

November 2006 Copyright © 2006 Mississippi Department of Education 26
There is a gap between where our students are and where we want them to be.

November 2006 Copyright © 2006 Mississippi Department of Education 27
Where do we want to be?
November 2006 Copyright © 2006 Mississippi Department of Education 28
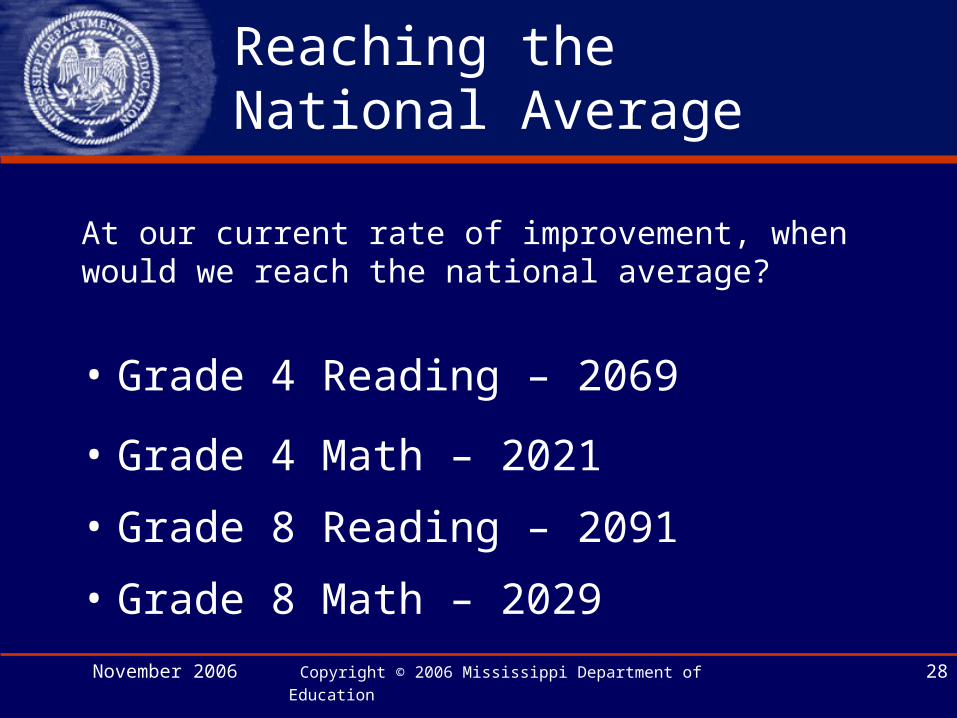
Reaching the National Average
At our current rate of improvement, when would we reach the national average?
• Grade 4 Reading – 2069
• Grade 4 Math – 2021
• Grade 8 Reading – 2091
• Grade 8 Math – 2029

215217
225222
216213
207210
219
199204
190200210220230240250260270
19
92
19
94
19
98
Average Scale Score
Nation
Mississippi's fastest rate of improvement
1.5 points/yearNational average reached by 2015.
20
05
National Assessment of Educational ProgressGrade 4 Reading - Reaching the National Average
20
07
20
09
20
11
20
13
20
15
20
17
20
19
Mississippi
Copyright © 2006 Mississippi Department of Education
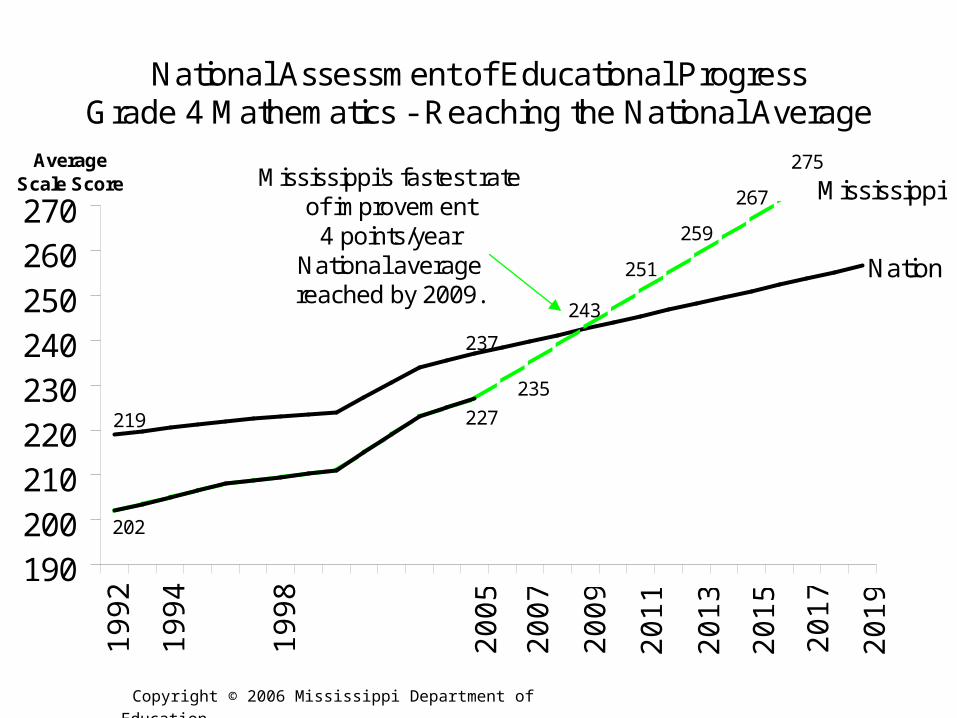
219
237
275
259
251
235
243
267
202
227
190200210220230240250260270
19
92
19
94
19
98
Average Scale Score
Nation
20
05
National Assessment of Educational ProgressGrade 4 Mathematics - Reaching the National Average
20
07
20
09
20
11
20
13
20
15
20
17
20
19
Mississippi's fastest rate of improvement
4 points/yearNational average reached by 2009.
Mississippi
Copyright © 2006 Mississippi Department of Education
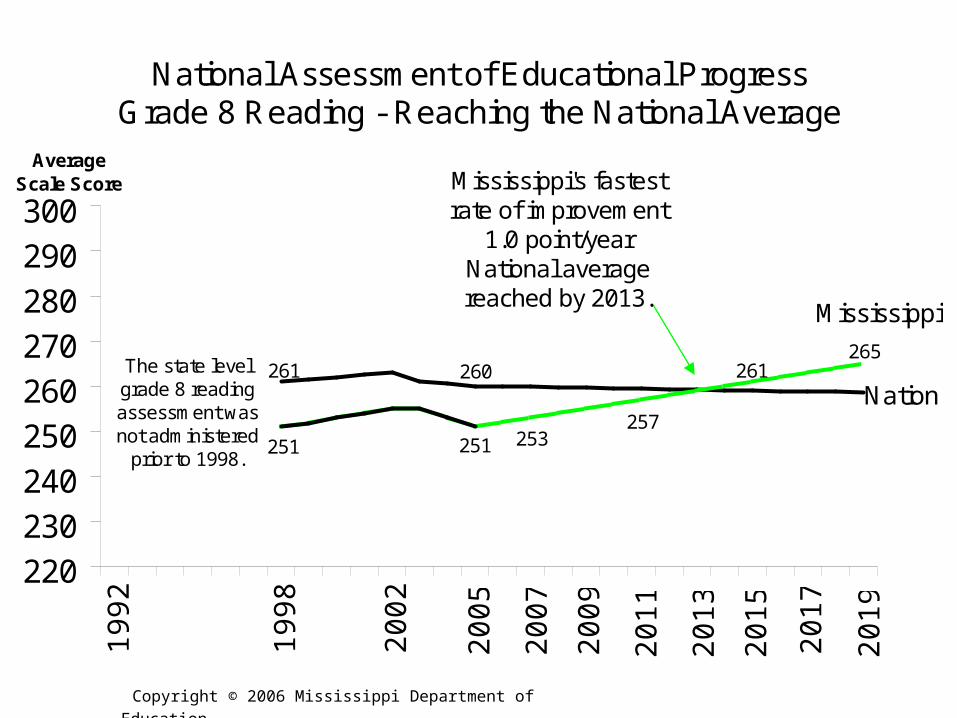
260261265
261
257253251 251
220230240
250260270280
290300
19
92
19
98
20
02
Average Scale Score
Nation
Mississippi
Mississippi's fastest rate of improvement
1.0 point/yearNational average reached by 2013.
National Assessment of Educational ProgressGrade 8 Reading - Reaching the National Average
20
05
20
07
20
09
20
11
20
13
20
15
20
17
20
19
The state level grade 8 reading assessment was not administered
prior to 1998.
Copyright © 2006 Mississippi Department of Education

267278
294
285280
276271
267
290
246
262
240250260
270280290300
310320
19
92
19
96
20
00
Average Scale Score
Nation
Mississippi's fastest rate of improvement
2.3 points/yearNational average reached by 2017.
National Assessment of Educational ProgressGrade 8 Mathematics - Reaching the National Average
20
05
20
07
20
09
20
11
20
13
20
15
20
17
20
19
Mississippi
Copyright © 2006 Mississippi Department of Education

November 2006 Copyright © 2006 Mississippi Department of Education 33
How will we get there?

November 2006 Copyright © 2006 Mississippi Department of Education 34
How will we get there?
• Improved alignment between curriculum, assessment, and instruction
• Increase expectations for student learning
November 2006 Copyright © 2006 Mississippi Department of Education 35
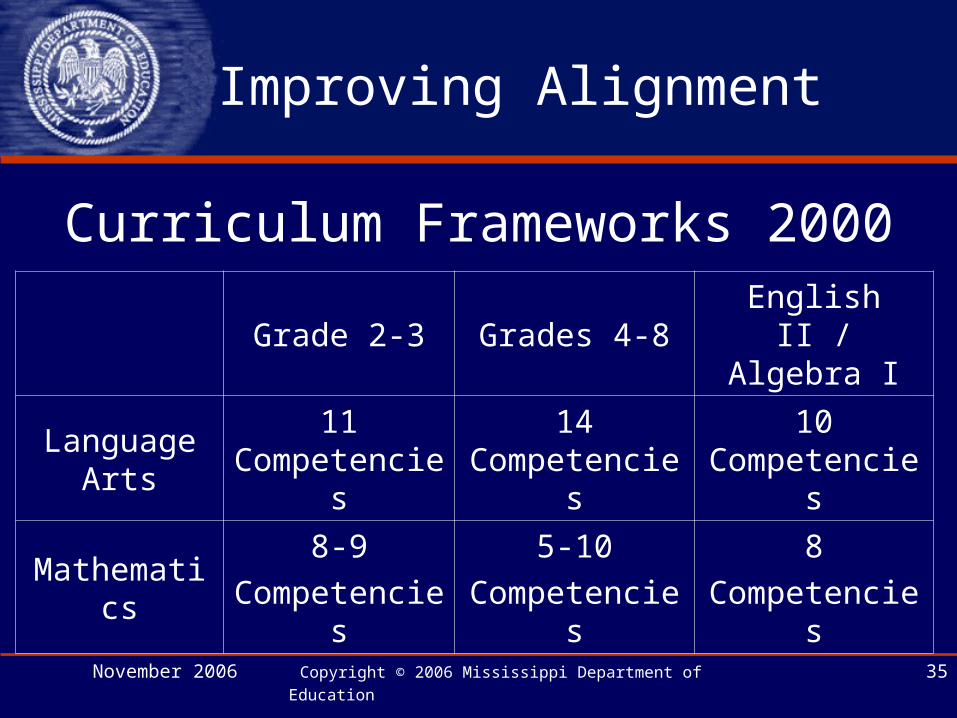
Improving Alignment
Grade 2-3 Grades 4-8English II / Algebra I
Language Arts
11 Competencies
14 Competencies
10 Competencies
Mathematics8-9
Competencies
5-10
Competencies
8
Competencies
Curriculum Frameworks 2000
November 2006 Copyright © 2006 Mississippi Department of Education 36
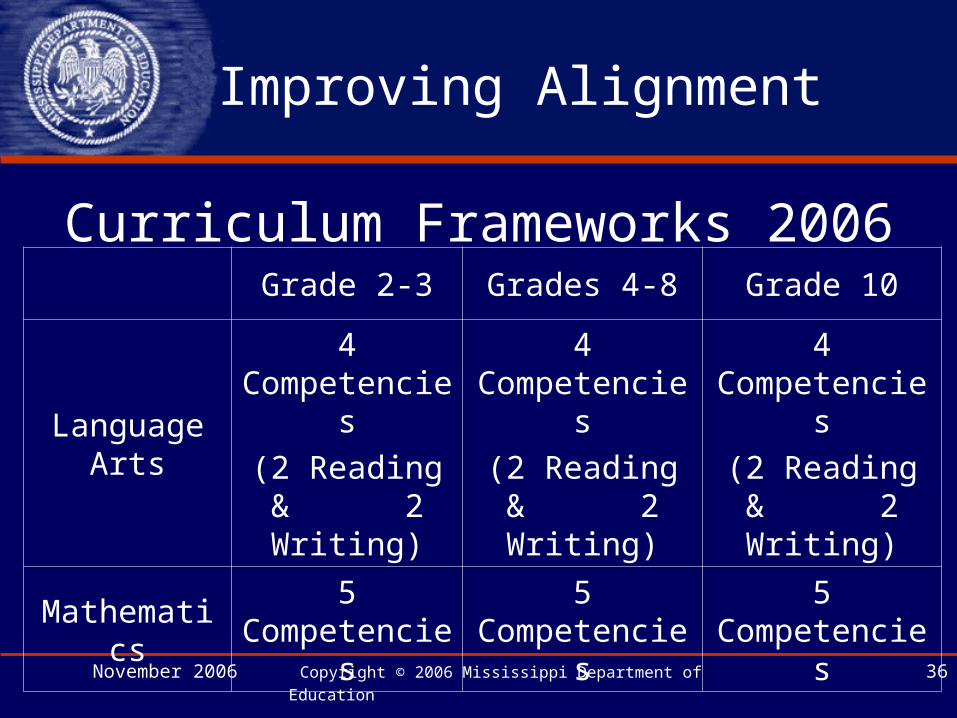
Grade 2-3 Grades 4-8 Grade 10
Language Arts
4 Competencies
(2 Reading & 2 Writing)
4 Competencies
(2 Reading & 2 Writing)
4 Competencies
(2 Reading & 2 Writing)
Mathematics5
Competencies5
Competencies5
Competencies
Improving Alignment
Curriculum Frameworks 2006
November 2006 Copyright © 2006 Mississippi Department of Education 37
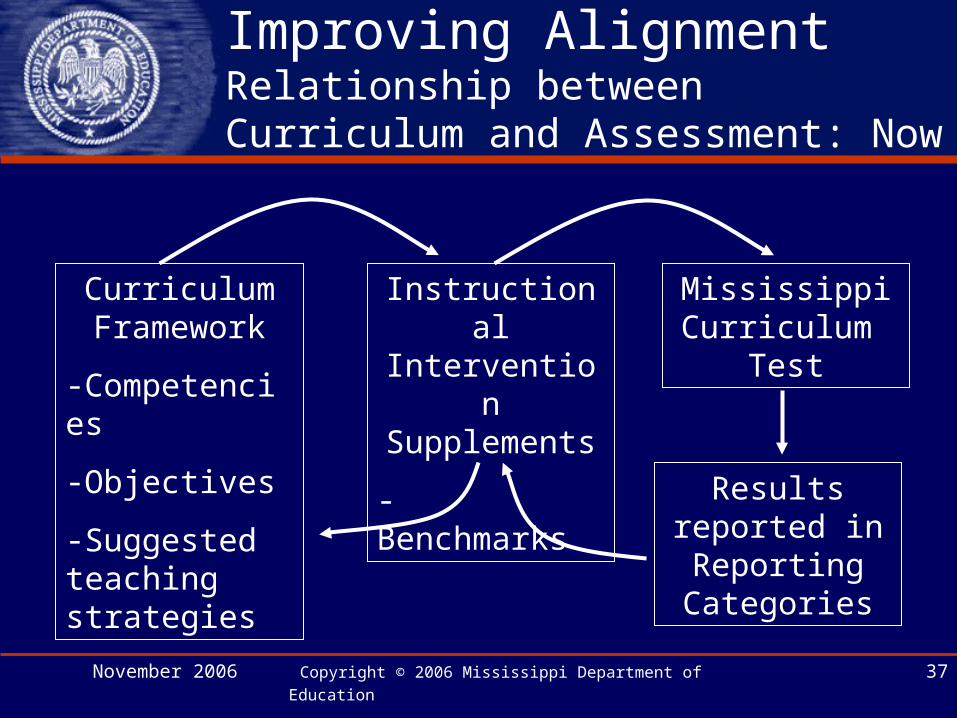
Improving Alignment Relationship between Curriculum and Assessment: Now
Curriculum Framework
-Competencies
-Objectives
-Suggested teaching strategies
Instructional Intervention
Supplements
- Benchmarks
Mississippi Curriculum
Test
Results reported in Reporting Categories

November 2006 Copyright © 2006 Mississippi Department of Education 38
Improving Alignment Relationship between Curriculum and Assessment: Future
Curriculum Framework
-Competencies
-Objectives/ Benchmarks
-Suggested teaching strategies
Mississippi Curriculum
Test
Results reported by Competency

November 2006 Copyright © 2006 Mississippi Department of Education 39
Increasing Expectations
• How do you define “rigorous” academic experience? Higher level courses More challenging, complex, “real-world”
content

November 2006 Copyright © 2006 Mississippi Department of Education 40
Increasing Expectations
• What makes the content more challenging? A focus on conceptual understanding
(beyond the basic facts and simple procedures) – Why learn about this content?
A focus on critical thinking skills, problem-solving, and understanding connections between present learning and previous learning or experience
November 2006 Copyright © 2006 Mississippi Department of Education 41
Reaching the National Average
• It will take everyone—the state, school
districts, schools, teachers,
administrators, and students giving
their best every year to accomplish
this goal.