novel single stage water mitigation treatment final ... library/research/oil-gas/enhanced oil... ·...
TRANSCRIPT

Novel Single Stage Water Mitigation Treatment
Final Technical Report For time period:
1 April 2006 to 31 December 2007
by Principal Author:
Kenneth D. Oglesby, PE
Dated: 28 January 2008
DOE Prime Cooperative Agreement to Penn State University/ Stripper Well Consortium:
DE-FC26-04NT42098 Sub-Contract to Impact Technologies LLC:
3180-IT-USDOE-2098 Submitting Organization: Impact Technologies LLC P. O. Box 35505 Tulsa, Oklahoma 74153-0505 918.627.8035
And, RTA Systems, Inc. JAG Enhanced Recovery, LLC
1

DISCLAIMER PAGE: This report was prepared as an account of work sponsored by an agency of the United States Government. Neither the United States Government nor any agency thereof, nor any of their employees, makes any warranty, express or implied, or assumes any legal liability or responsibility for the accuracy, completeness, or usefulness of any information, apparatus, product, or process disclosed, or represents that its use would not infringe privately owned rights. Reference herein to any specific commercial product, process, or service by trade name, trademark, manufacturer, or otherwise does not necessarily constitute or imply its endorsement, recommendation, or favoring by the United States Government or any agency thereof. The views and opinions of authors expressed herein do not necessarily state or reflect those of the United States Government or any agency thereof.
2

ABSTRACT: This project is a continuation of a SWC project (sub-contract #3022-IT-DOE-2098) entitled “Field Application of a Low-Cost Water Mitigation Treatment”. That first project discovered and began lab development of a new gel system that is now the patent-pending SPI gel system. The SPI technology is a silicate based, multi-component gel system that can have controlled delayed gelation of minutes to days and form hard, “ringing” to soft, weak gels. The pre-gelled SPI system has a low viscosity for deep penetration of leaks and tight formations. It can be designed for special applications. This second SWC project performed well over 1000 lab tests and finalized the lab matrix, developed a strong understanding of the gelation process chemistry mechanism, developed sufficient data to control the gelation process (timing and type gel), developed field support lab tests, constructed a pre-mixing facility, constructed a portable trailer mounted onsite mixing and pumping system, contracted for preliminary 3rd party lab testing at the University of Kansas- Tertiary Oil Recovery Project and began field testing. Nine (9) in-depth water mitigation field treatments in two (2) Bartlesville fields were performed for a technical success rate of 100% - defined as the ability to inject and place the gel. Half the in-depth treatments showed immediate pressure and rate responses with only 200 barrels of SPI gel utilized. All treatments’ economic successes were unknown due to the small volumes of treatment and the short time period of evaluation. Normal such conventional treatments are 5000 – 10,000 barrels in size. Twelve (12) casing repair treatments in 5 fields (Oklahoma and Kansas) were performed under this project for a success rate of 57%, which included one partial success (reduced 300+ down to 50 BPD) and did not count one well with downhole problems. SPI gel volumes as little as 6.25 barrels were successfully utilized and multiple formulations were tested.
3
TABLE OF CONTENTS: ABSTRACT………………………………………………………….……3 TABLE OF CONTENTS………………………………………….……..4 LIST OF GRAPHICAL MATERIALS…………………………………5 EXECUTIVE SUMMARY……………………………………………….6 INTRODUCTION………………………………………………….……..7 EXPERIMENTAL WORK………………………………………………11 RTA LAB TESTS UK LAB TESTS FIELD TESTS RESULTS AND DISCUSSION………………………………………….31 CONCLUSIONS………………………………………………………….37 REFERENCES…………………………………………………….…….40 BIBLIOGRAPHY………………………………………………………..41 APPENDICES…………………………………………………………….41
A. SPE paper 113490 (draft 5) B. Summary Table of Field Tests C. University of Kansas-Tertiary Oil Recovery Projects Lab Tests (preliminary reports) D. Pictures of Field Testing
4

LIST OF GRAPHICAL MATERIALS: Figures Figure 1- Initiator Concentration vs Gel time at fixed Polymer conc 0.10% Figure 2- Initiator Concentration vs Gel Time at fixed Polymer conc 0.10% Figure 3- pH Values as Function of Time for Selected g21 Samples Figure 4- Viscosity as Function of Time for Selected G21 Samples Figure 5- Viscosity Readings as Function of Time for Gel Containing
3%Sodium Silicate, 2.4% Initiator and 0.10% Polymer Figure 6- Gel Time as Function of Initiator Concentration for Samples
Containing a Fixed 1.0% Sodium Silicate and 0.20% Polymer Figure 7- SPI Gel Technology (picture of gel in a jar) Tables Table 1- Effect of Polymer Type on the Silica-Polymer-Initiator Gel System Table 2- Effect of Polyacrylamide Anionicity on Gel Formation w/ SPI Gels Table 3- Example SPI Weak Gel for Permeability Correction Table 4- Example SPI Firm Ringing Gel For Casing Leak Correction Table 5- Gel Strength of SPI Gel Compared With Chromium Gel Table 6- Gelant Composition and Properties of Water Shutoff Systems Table 7- Gel Composition and Properties of Water Conformance Systems Table 8- Gel Composition of SPI Systems for Casing Leak Table 9- Gel Composition of SPI Systems for Casing Leak-Steady Shear
Tests
5
EXECUTIVE SUMMARY: This project is a continuation of a SWC project (sub-contract #3022-IT-DOE-2098) entitled “Field Application of a Low-Cost Water Mitigation Treatment”. That first project discovered and began lab development of a new patent-pending SPI gel system. The SPI technology is a silicate based, multi-component gel system that can have controlled delayed gelation from minutes to days of hard, “ringing” to soft, weak gels. This second SWC project further developed the SPI gel technology and finalized the lab matrix (over 1000 lab tests) by testing combinations of different silicates (2), polymers (28) and initiators (24), understanding of the gel mechanism, developed sufficient data to control the gelation process (timing and type gel), developed field support lab tests, constructed a pre-mixing facility, constructed a portable trailer mounted onsite mixing and pumping system, and performed field tests for in-depth water conformance (9 treatments) for a 100 % success rate (defined as ability to inject and place gels into the formation, economic success not determinable in treatment size and time) and casing repair (12 treatments) for a 57% success rate. Third party laboratory testing (continuing) was contracted to University of Kansas-Tertiary Oil Recovery Projects. All tasks proposed have been completed. Those tasks were-
• Task 1 Development of Laboratory Matrix Formulation • Task 2 Gel Characterization in the Laboratory Matrix
(only continuing for new avenues and field support) • Task 3 Static Brine and multivalent impact • Task 4 Dynamic Laboratory Simulation Modeling (optional) • Task 5 Development of Field Application Techniques • Task 6 Perform Field Tests (6) and Evaluations • Task 7 Reporting and Tech Transfer
A Society of Petroleum Engineers (SPE) technical paper (SPE 113490) of the laboratory testing has been prepared, shown as Draft 5 in Attachment A. This final paper will be presented at the April 2008 SPE Improved Oil Recovery (IOR) Symposium in Tulsa, Oklahoma and published in the SPE records. A later paper will be prepared for the field testing results.
6
INTRODUCTION: Permeability and reservoir heterogeneity variations significantly affect the sweep efficiency or reservoir conformance of oil recovery processes. Over the last 40 years, several methods1-4 were proposed for improving reservoir conformance using crosslinked polymers to mitigate the problems associated with reservoir heterogeneity. Two methods are commercially used to crosslink polyacrylamides based on the controlled availability of multivalent metal ions (generally chromium) resulting in the crosslinked polyacrylamide. Key issues with the crosslinked polyacrylamide systems include-
(1) Environmental and safety issues over the heavy metal crosslinking agent chromium,
(2) Limited penetration depth, (3) Polymer shear degradation, (4) Polymer absorption on the reservoir surface, (4) Polymer gel time, (5) Polymer precipitation under harsh reservoir conditions.
Application of silicates in different industrial areas is enormous and well documented. Injection of silicate solutions into reservoirs with the aim at enhancing the recovery factor through a diverting effect was first proposed in 1922 (5). Acidic gel systems are the oldest and most commonly employed techniques that employ silicates. These gels are more accurately described as precipitation type gels since they are extremely brittle with no elasticity. In the early 1960’s, sodium silicate and glyoxal were combined to make various hard cement-like coatings on substrates. At low concentrations, a firm gel was obtained that lacked cohesiveness and was not as hard as cement. In 1964, Gandon (6) took the mission one step further citing sodium silicate reactions with other organic compounds to make cement like substances used to create very hard consolidated soils for constructing bridge and dam structures. In the last 50 years, numerous inventors (7-9) patented various sodium silicate systems to make gels for use in plugging high permeability areas of oil and gas producing reservoirs. Krumrine and Boyce’s paper (10) compiles numerous papers and patents on sodium silicate chemistry as applied to oil field and grouting applications. They also drew attention to a controversial fact that the silicate use was inequitably neglected in commercial applications in favor of polymer treatments in practice at the time.
7

Many chemicals can serve as sodium silicate initiators. An initiator can be defined as a chemical that causes a sodium silicate solution to gel in a delayed fashion. It should be noted that the gel is not simply a precipitate. Metal ions such as calcium, can cause immediate precipitation of a water-insoluble metal silicate. Many initiators are acidic, water-soluble chemicals which lower the pH of the silicate solution to a point at least below about (11). Most ammonium salts of strong acids such as ammonium sulfate are effective gelants (11, 12). Methods of delaying rapid reactions in the prior art involve multiple stage treatments such as pumping alternating slugs of sodium silicate and the initiator separated with inactive slugs of fresh water when the initiator reacts rapidly. This complexity allows for delayed gelation in the formation after the placement of the two reactants; however, this does not allow for full control of the in-depth placement of the silicate gels. Although the sodium silicate technology was the first plugging and permeability modification technology largely put to practice, the use of gelled polymers based on polyacrylamide and chromium VI salts with reducing agents or organochromium compounds became more popular in the 1970’s and 1980’s because of their unique versatility to make hard and soft elastic gels rather than the inelastic gels formed using the original sodium silicate chemistry. Phillips Petroleum Company was the pioneer in this area and later followed by Marathon Oil Company with similar technology using polyacrylamide-chromium gelled systems. For example, Clampitt, Hessert, and Gall (13-16) are among the many inventors proposing various gelled cellulose and acrylamide polymers that could be placed in a high permeability formation and crosslinked into a chromium gel. Mumallah (17 ) patented the concept of chromium proprionate as a delayed gel complexing agent for polyacrylamide. Later, Falk (18) at Marathon patented chromium acetate for use in gelling polyacrylamides. Casing repairs and water reduction are important because they can save well profitability, prevent premature well plugging, loss of oil and gas reserves and allow regulatory compliance. Casing leaks occur primarily over time from steel casing exposed to corrosive formation waters. In wells with bad casing, water influx through casing leaks can cause scale formation and excess water production possibly leading to abandonment or premature plugging of the well. As our oil and gas wells continue to age, casing leaks will become more of a problem.
8

Competitive polymer gel systems are used successfully as an alternative to cement, or in combination with cement, to squeeze casing leaks and improve mechanical well integrity. They also are used instead of mechanical methods of cupped packers. Hard gels are used to hold a solid pressure in the casing or to block encroachment of foreign water into a producing well or block pressure leak off into the formation. Advantages of using gels are two-fold. They can be washed out of the wellbore after a leak is squeezed, preventing the costly rig time necessary to drill out cement. Second, since such solutions exert a much lower hydrostatic pressure than a cement slurry, there is less possibility of breaking down the formation and losing the squeeze seal. In this work, sodium silicate gels made with an organic initiator in the presence of a polymer, such as a polyacrylamide derivative, were evaluated for conformance control and casing leak plugging. Historically, uniform silicate gels were almost impossible to prepare because the reaction is rapid between sodium silicate and an acidic setting agent. Therefore, most silicates form very rigid, non-uniform gels subject to fracturing or syneresis with concomitant shrinkage. Certain organic initiators can form delayed gels with sodium silicate as an improvement, but the gels are brittle without elasticity and the gels require high material concentrations. Sodium silicate is a complicated system of various molecular weight silica polymers in an alkaline solution. Aside from requiring a certain minimum amount of buffered alkalinity, sodium silicate has no definite chemical combining numbers. When sodium silicate is acidified to a pH of less than about 10, then the sodium silicate is converted partially to silicic acid. Silicic acid exists at these alkaline pH’s as it is such a weak acid. Instead of precipitating and making silica, SiO2, the silicic acid remains hydrated and forms a three-dimensional network in trapping the solvent water. This network is a gel since both phases are continuous. A slight lowering of the pH brings about radical changes in gel time. Consequently, gel times are difficult to control, and lumping from local acid concentrations during large scale mixing frequently occurs. On the other hand polyacrylamide gels with the dichromate ion and a reducing agent such as sodium hydrosulfite form an elastic gel without the brittleness and other disadvantages of the early silicate systems. Polyacrylamide and certain organic initiators such as aldehydes are known
9
to form gels at low pH and high concentrations of the reagents, but as reported, gels do not form at neutral pH and above. In the laboratory, when very low concentrations of a partially hydrolyzed polyacrylamide was added to sodium silicate in the presence of an organic initiator, varying types of gels were formed ranging from soft gels to very hard, ringing gels with gel times of minutes to days. The Silica Polymer Initiator (SPI) gels formed in this manner are more elastic in behavior like a polyacrylamide gel instead of possessing the characteristic brittleness of sodium silicate gels with the same initiator. In the absence of sodium silicate, neutral pH polyacrylamide solutions do not react with the organic substrates. In the absence of an organic initiator, sodium silicate does not react with polyacrylamide. The presence of the polyacrylamide in the formulation is unique and novel resulting in a more elastic gel. Without polyacrylamide in the SPI formulation, a delayed silica precipitation occurs to generate a very opaque brittle gel. Silica precipitations of this type have been known for years. The Initiator does not appreciably react with the polyacrylamide. The Initiator serves as a source of protons allowing the silica to form a silica hydrogel that may be weakly bound by hydrostatic forces to the polyacrylamide molecules. These hydrostatic forces between the silicate hydrogel and the polymer tend to wrap around the polyacrylamide and also bind two or more polymer chains together in a weak crosslink. As gelation occurs, the pH drops from approximately 12 to the 10 – 7 range. Although a considerable amount of effort has been directed at the SPI gels to determine the proper balance between the components, component concentrations, gel time, and the gel strengths, there is still a significant amount of work to be completed to fully commercialize these SPI systems. The original Glass silicate treatment has been utilized since the 1970’s in the oilfield. The first SWC funded project (sub-contract #3022-IT-DOE-2098) entitled “Field Application of a Low-Cost Water Mitigation Treatment” discovered a new gel system and concentrated on lab development. That system is now the new patent-pending SPI gel system. Lab tests were conducted on the matrix parameters outlined and further defining the benefits and limitations of SPI gels for water mitigation. The Oklahoma Center for Advancement of Science and Technology (OCAST) approved additional funding for evaluating SPI gels toward casing repair applications.
10

EXPERIMENTAL WORK: The original proposed tasks were:
• Task 1 Development of Laboratory Matrix Formulation • Task 2 Gel Characterization in the Laboratory Matrix • Task 3 Static Brine and multivalent impact • Task 4 Dynamic Laboratory Simulation Modeling (optional) • Task 5 Development of Field Application Techniques • Task 6 Perform Field Tests (6) and Evaluations • Task 7 Reporting and Tech Transfer
Over 1,000 gel tests were performed evaluating silicate types and concentrations, polymer types and concentrations, initiator types and concentrations, temperature, mixing methods, shear, gelation times and gel types. Two silicates were evaluated for gel testing: N-Sodium silicate, the most common and cost effective silicate and potassium silicate. The plan is to focus on N-sodium silicate since potassium silicate is more expensive and provides little gain in oilfield applications. This effort is complete. Twenty eight different commercial water soluble polymers were screened, but focused mostly around polyacrylamide (PAM) of varying levels of hydrolysis. Some of these polymers were blended demonstrating performance improvements. Four cellulose polymers, EC, HPC, HEC, CMC, and Xanthan biopolymer were evaluated as well as a PAM-cellulose blends. They did not contribute to gel performance as much as the non-ionic PAM’s. Polyethyleneimine (PEI) was not impressive. One particular polymer (confidential), when added to a PAM based SPI gel system unexpectedly reduced syneresis of the weaker gels for permeability control and provided more “ringing” to the hard, yet semi-elastic casing leak gels. Polymer screening is complete. Over 24 Initiators were screened. Six Initiators were tested at length and three are the main focus but their identity is withheld for patent protection purposes. Initiator screening is complete. A very consistent temperature relationship was discovered across the SPI concentration matrix . For every 10 oF above 70 oF the gel is aged, a
11
corresponding multiple factor can be used to accurately estimate the gel time. This is a linear relationship whether at 150 or 200 oF. For example, after aging at 150 oF for one hour and the SPI mixture gels, this corresponds to an 8 hour gel time at 70 oF. A finding that exposing the pre-gelled materials to high regimes of shear only slightly decreases the gel time, but does affect the quality of the final gel. Once gelled, the gels are stable to crude oils, connate water, strong acids and bases over a wide temperature range. Pressure extrusion rheometer tests were performed as a measure of gel strength. The tests were performed in a pressurized cylinder with air pressure used to push a piston to force the gel through a 3/16th inch hole at the other end. While is it not an industry standard, it is felt that it strongly represents gel behavior in large fractures and fissures in the rocks. SPI gels were found to be approximately three (3) times stronger than commercial chromium crosslinked gels. Preliminary shear tests were done to determine shear forces required to release equipment from strongly formed SPI gels left in the annulus (space between the inner tubing and outer casing). Brine and CO2 testing are continuing. A laboratory testing agreement with Kansas University in Lawrence, Kansas at the Tertiary Oil Recovery Project lab has been signed and the beaker testing work begun.
Materials The sodium silicate used in this study was N-Sodium Silicate available from PQ Corporation. N-Sodium Silicate has 37.85% solids as SiO2 and Na2O and 28.90% as SiO2. The pH is approximately 11.3. N-Sodium silicate has a molar ratio of silicon dioxide to alkali metal oxide of 3.22. For the purpose of this paper, the composition of the initiators will remain confidential, although numerous initiators were tested. Polyacrylamide polymers were evaluated ranging between high and low molecular weights and varying amounts of levels of hydrolysis ranging from 0 – 50%. Polymers used were: Alcoflood 254S (AC 254S) , a 250,000 molecular weight polyacrylamide with 7 percent hydrolysis; Goodrite® polymers that are polyacrylates; HE® polymers, where HE 100® is a copolymer of
12

AMPS (Sodium salt of 2-Acrylamido-2-Methyl Propane Sulfonic acid) and acrylamide and HE 300® polymer is a copolymer of VP (Vinyl Pyrrolidone) and Acrylamide; Drispac® polymer, a 0.9 degree of substitution CMC (carboxymethylcellulose) polymer; Natrosol 250HHR®, a non-ionic HEC (hydroxyethylcellulose) polymer; and Kelzan® XC polymer, a Xanthan gum polymer. Salts of NaCl, KCl and CaCl2⋅H2O were also utilized.
Preparative Methods The initial matrix screening experiments were performed at RTA Systems, Inc. The polymer solutions were prepared by forming a water vortex in a container using a magnetic stirrer and dropping the dry polymer granules on the shoulder of the vortex. The solutions were then slowly stirred overnight to complete the dissolution. Polymers were prepared at a concentration of 0.5 weight percent. The standard order of mixing of the SPI components to form a gel are: 1) Bartlesville city Tap Water (BTW), 2) Polymer master batch (5000 ppm solution), 3) Sodium silicate (concentrated), and 4) the Initiator. The jar was sealed with a lid and it was shaken for about 20 – 30 seconds to thoroughly mix the components. For the shorter gel times, the samples were observed at room temperature (RT) for the time of gelation. For extended gel times beyond 8 hours, the bottles were placed in an oven for accelerated gelation and extrapolated back to a room temperature gel time. From these lab tests, approximately 1-hour gelation time in an oven at 150oF is equivalent to 8 hours gelation time at room temperature. In doing a series of tests, it was determined best to pre-weigh the components in all the jars in a series except for the initiator. Then add the initiator last to all of the jars and place in the oven at the same time.
Results of Matrix Studies A gel time matrix was developed over the total weight percent range of SPI components as follows: Sodium silicate: 4.0, 3.0, 2.0, 1.0, and 0.56 weight percent. Polymer: 0.05, 0.10, 0.15, and 0.20 weight percent Initiator: 1.8, 2.3, 2.8, and 3.3 weight percent
13

This screening study was performed for numerous initiators and polymer types. Generally, SPI gels with sodium silicate levels less than 1.0 weight percent are probably too weak to be of value. SPI gels with silicate levels greater than 4.0 weight percent tend to plateau on a cost-benefit basis. Gels with sodium silicate less than 4.0 weight percent have ample gel strength for casing leak applications. SPI gels with polyacrylamide concentrations below 0.10 weight percent are not as stable often resulting in more syneresis than gels at or above 0.10 weight percent. Polyacrylamide levels up to 0.20 weigh percent are useful, particularly for the weaker gels for conformance control. Whereas, very nice hard ringing gels for casing leaks may be produced at polyacrylamide levels in the 0.10 to 0.20 wt percent range. Polyacrylamides are very economical at this concentration. Weak gels for conformance control are produced at a sodium silicate to initiator ratio of 0.5 – 1.10 producing a pH in the range of 7 – 8 and a gel time in the range of 30 – 65 hours. Firm ringing gels for casing leak applications are produced at a silicate/initiator ratio of approximately 1.10 – 2.0 for a pH in the range of 8 – 10 and a gel time of 4 – 29 hours. Early screening tests focused on the type of polymer incorporated into the SPI system. These tests were run at high concentrations of sodium silicate resulting in rapid gel times. The formulations in Table 1 had 14.9 weight percent sodium silicate, 3.7 weight percent initiator, 0.11 weight percent of polymer and 88.78 weight percent water. Although this initial polymer screening data is far from optimum in sodium silicate and initiator concentrations, it demonstrates that there may not be an impact of the polymer on the gel time, but suggests that most polymers can be used in the system to impart elasticity. Only Drispac polymer provided a brittle gel with severe syneresis. Table 2 shows the effect on the level of polyacrylamide hydrolysis and molecular weight at different sodium silicate and initiator concentrations. The low and high molecular weight polymers have relative molecular weights of 5 and 12 million respectively. At the respective silicate/initiator concentrations in Table 2, the non-hydrolyzed polyacrylamide gels were the only ones to exhibit a ringing sensation in the gel suggesting this is a reflection of polymer hydrolysis in this data set. In other formulations using an anionic polymer, ringing gels have been observed, i.e. Table 1, Sample No. 5. The actual gel times and perhaps to some extent, syneresis levels are believed to be a reflection of the ratio of sodium silicate to initiator
14

concentration. From the data in Table 2, the effect of the hydrolysis level on syneresis is inconsistent. Entries with the higher initiator concentration (4.4 %) may show an up-tick in gel time at higher levels of polymer hydrolysis. However, this trend does not hold for the other initiator concentrations where a peak in gel time appears at 20% hydrolysis. The data suggests that lower gel times occur with non-ionic polymer with minimal syneresis. The molecular weight (5 MM vs. 12 MM) of these polyacrylamides did not seem to effect gel time. Table 1. Effect of Polymer Type on the Silica-Polymer-Initiator Gel System. Sample
No. Polymer Polymer Type GelTime,
Min. Comments
1 Drispac® polymer
CMC-9 10 Very Brittle Gel, Severe Syneresis
2 HE® 100 polymer
AMPS/AM 13 Hard Elastic Gel.
3 Natrosol® 250 HHR
HEC 4 Hard Elastic Gel.
4 HE® 300 polymer
VP/AM 10 Hard Elastic Gel.
5 AC 254S PAM, 7% Hydrolysis 12 Hard Elastic Ringing Gel
6 Kelzan XC polymer
Xanthan Gum 9 Hard Elastic Gel
7 Goodrite 732 Polyacrylic Acid, pH= 2.6*
10 Very Hard Elastic Gel
8 Goodrite 766 Polymethacrylate, pH= 8.5*
10 Very Hard Elastic Gel
* Mwt 5000 Gel time is most affected by the sodium silicate concentration and at higher concentrations, shorter gel times were observed along with stronger gels. At lower sodium silicate concentrations, longer gel times were observed with weaker gels being formed. The initiator serves to provide a source of hydrogen ions to the gel system. There is an optimum initiator/sodium silicate mass ratio that provides optimum gel. The formulation in Table 3 is an example of a weak gel with a 64 hour gel time. The BTW added was pre-calculated to arrive at the above weight percentage of the components. The water components of the additives were taken into account to arrive at a total water weight percent as shown in Table
15

3. Table 4 is an example of a firm ringing gel for casing leak correction applications. Table 2. Effect of Polyacrylamide Anionicity on Gel Formation with SPI Gels. Sample Number
Sodium Silicate, Wt.
%
Initiator,
Wt. %
PAM*, Wt. %
Gel Time, Mins
Description of Gel Type
Syneresis
0% Hydrolysis, HMwt
1 8.7 4.4 0.22 34 Hard Ring Slight 2 8.9 2.2 0.22 66 Hard Ring Slight 3 7.3 1.8 0.18 121 Hard Ring No 7% Hydrolysis,
HMwt
4 8.7 4.4 0.22 31 Hard No Ring
Yes
5 8.9 2.2 0.22 84 Hard No Ring
Yes
6 7.3 1.8 0.18 224 Hard No Ring
Yes
16% Hydrolysis, HMwt
7 8.7 4.4 0.22 34 Hard No Ring
No
8 8.9 2.2 0.22 63 Hard No Ring
No
9 7.3 1.8 0.18 150 Hard No Ring
No
20% Hydrolysis, HMwt
10 8.7 4.4 0.22 32 Hard No Ring
Yes
11 8.9 2.2 0.22 67 Hard No Ring
Yes
12 7.3 1.8 0.18 200 Hard No Ring
Yes
33% Hydrolysis, LMwt
13 8.7 4.4 0.22 40 Hard No Ring
Yes
14 8.9 2.2 0.22 53 Hard No Ring
Slight
15 7.3 1.8 0.18 128 Hard No Ring
Slight
33% Hydrolysis,
16

HMwt 16 8.7 4.4 0.22 42 Hard No
Ring Yes
17 8.9 2.2 0.22 50 Hard No Ring
Slight
18 7.3 1.8 0.18 144 Hard No Ring
Slight
50% Hydrolysis, LMwt
19 8.7 4.4 0.22 56 Hard No Ring
Yes
20 8.9 2.2 0.22 51 Hard No Ring
Slight
21 7.3 1.8 0.18 160 Hard No Ring
Slight
* Superflock polyacrylamide Table 3. Example SPI Weak Gel For Permeability Correction. SPI Component Concentration
Factor, % Component Added, g
Component Conc., g
Weight Percent,
N-Sodium Silicate, Concentrated
37.60 0.81 0.30 0.95
Polymer (5000 ppm solution)
0.050 13.00 0.065 0.203
Initiator 100.00 0.57 0.57 1.78 Water from Sodium Silicate
62.40 0.81 0.505 1.58
Water from Polymer 99.50 13.00 12.94 40.45 Additional BTW 100.00 17.60 17.60 55.03 Totals 31.98 100.00 Total Water 97.06 Gel Time: 64 Hours; Weak gel, holds shape, No syneresis. The graphical results of a concentration study where sodium silicate is varied from 0.57 to 4.0 over the range of initiator concentrations from 1.8 to 3.3 weight percent and at constant PAM concentration of 0.10 wt. % are shown in Figure 1. Generally, the lower concentrations of SPI components and particularly the lower concentration of sodium silicate relate to longer gel times and weaker gels. At these low concentrations, the gels result in a
17

lower quality fit of a power algorithmic law pattern. This is largely due to increased error in establishing an exact gel time since the rate of viscosity increase is slower. Contrast this data with the higher SPI concentrations correlating to a shorter gel time and firmer ringing gel. The power law relationship provided higher R2 values for the algorithms and makes more logical sense than an exponential or logarithmic fit both of which intercepted the x or y axis. Table 4. Example SPI Firm Ringing Gel For Casing Leak Correction. SPI Component Concentration
Factor, % Component Added, g
Component Conc., g
Weight Percent,
N-Sodium Silicate, Concentrated
37.60 3.20 1.20 2.96
Polymer (5000 ppm solution)
0.050 8.50 0.043 0.105
Initiator 100.00 0.96 0.96 2.36 Water from Sodium Silicate
62.40 3.20 1.997 4.91
Water from Polymer 99.50 8.50 8.46 20.80 Additional BTW 100.00 28.00 28.00 68.86 Totals 40.66. 100.00 Total Water 94.58 Gel Time: 24 Hours; Hard Ringing Gel This pattern of curves is unique showing dependency on the concentrations of the silicate and the initiator. The curves may suggest there is an optimum ratio of the sodium silicate to initiator concentration. The concentration of polymer is independent, although at lowest polymer concentration, the gels were of slightly poorer quality. The graphical dependence on polymer concentration is not shown, although for the most part they are constant relationships outside of the lower concentrations of the silicate and the initiator. Most of the R2 values are above 0.95 suggesting a very good data fit.
18

F ig ure 1 . In ita to r C o nc e ntra tio n vs G e l T im e a t [P o ly] = 0 .1 0 % .
S ilic a t e = 4.0% , P o ly = 0.10f(x)= 120.12049* x^ (-1 .8914059); R ²= 0.9558S ilic a t e = 3.0% ; P o ly = 0.10%f(x)= 124.76553* x^ (-1 .7272324); R ²= 0.936S ilic a t e = 2.00% , P o ly = 0.10%f(x)= 118.66076* x^ (-1 .3770467); R ²= 0.9801S ilic a t e = 1.0% ; P o ly = 0.10%f(x)= 99.891388* x^ (-0 .90669755); R ²= 0.6816S ilic a t e = 0.57% , P o ly = 0.10% N o Co rre la t io n
1 2 3 4 5 6
10
20
30
40
50
60
70
G e l T im e , H o urs
Initia to r C o nce ntra tio n, W e ig ht Pe rce nt Pressure Extrusion Tests Early pressure extrusion tests were performed to provide a measure of gel strength of the SPI gels. These tests were compared to standard crosslinked polyacryalmide gels. The tests were performed in a heavy plastic cylinder fitted with screw caps on each end. Air pressure was used against a piston at the upper end to push the gel through a small 3/16 inch hole at the exit end whereby the gel was extruded. A piston in the upper end was fitted with an o-ring located inside the cylinder and a guide rod extending through a pressure tight hole in the cylinder cap that connects to the piston on one end. The piston moves freely in the cylinder. The 3/16 inch hole was plugged prior to filling with the pre-gelled solution. The cylinder was filled with the SPI gel components and left for 48 hours to form a hard rigid gel. After 48 hours, the cylinder was mounted with the 3/16 inch hole supported over a beaker to collect the extruded gel. The pressure inlet was connected to a source of compressed air. The pressure was slowly increased to the point whereby the piston started to push against the gelled system and extrude through the 3/16 inch hole. At that point, the pressure was held constant and recorded. The SPI gels were at 14.7 weight percent sodium silicate, 2.45 weight percent initiator and 0.18 weight percent polymer and the remainder water. The second gel was a standard polyacrylamide/CMC (0.30% PAM/0.7% CMC) blended gel at 10,000 ppm total polymer concentration crosslinked
19

with Cr+3 ions as per a Phillips Petroleum19 patent using 0.15 weight percent sodium dichromate and 0.20 weight percent sodium bisulfite. Table 5. Gel Strength of SPI Gel Compared With
Chromium Gel.
Gel Type Pressure to Initiate
Extrusion
Polyacrylamide-Cr 8
Polyacrylamide-Cr 7
SPI 25 SPI 20
In this particular test, the SPI system with comparable raw material cost to the standard polyacrylamide gel was stronger and more resistant to extrusion by a factor of 2.5 – 3 times as shown in Table 5. Long-Term Aging of SPI GelsTwo SPI gels with different initiators were placed in a 150oF static oven for accelerated oven aging on 13 February 2007. They were sealed in the standard screw cap jar. Unfortunately, the screw cap seal was not sufficiently tight enough to hold water and any other volatiles in the vessel at this temperature, thus tainting this data. Both gels shrank loosing approximately 55 weight percent water over a 7.5 year accelerated aging time. The gels shrank away from the jar wall into a consolidated, very firm gel. If the water loss from the container had not occurred, the results may have been different. The tests will be repeated. Third Party Testing- Confirmation of Matrix Tests at University of Kansas-Tertiary Oil Recovery Projects In support of rapid commercialization, tests on selected formulations will be verified by the University of Kansas at Lawrence (TORP laboratory) under the direction of Dr. G. Paul Willhite and Dr. Stan McCool. A legal agreement and the lab procedure has been made and the work has begun but not completed. The early part of this work has been included in the SPE 113490 technical paper and as Appendix C. Additional lab tests are anticipated with a new gel system in the near future.
20

KU-TORP Matrix Sample Preparation Amounts of lab water, salt solutions, polymer solution and sodium silicate solution were weighed into a vial. The solutions were mixed by shaking and the vial placed in a 40°C water bath for a minimum of one hour. Initiator was then weighed into the vials. The gelant vial was shaken well to mix and returned to the water bath. Total sample weight was about 30 grams. The samples were observed every eight hours or so to determine the formation of gel and gel quality by tilting the vial about 45° from the vertical. The samples were photographed and pH values were measured at about 1 week after mixing.
KU-TORP Matrix Results Two series of samples were prepared. Series 1-9 were prepared without added chloride salts. Sodium silicate and initiator concentrations were varied about the original preferred formulation. The polymer concentration was 0.20 weight percent. Similar gel solutions were prepared with added concentrations of between 0.1 and 1.0 weight percent sodium chloride (NaCl) and between 0.01 to 0.10 weight percent calcium chloride (CaCl2) salts. The results are provided in Table 6. The polymer concentration was chosen to be 0.20 weight percent because previous experiments suggest polymer concentration is independent of gel time. Samples 1 and 2 appear to be the best candidates from the point of stoichiometry as they are firmer with low syneresis. The “best” samples had initiator concentration above 1.2 weight percent. The preferred initiator concentrations between 1.5 and 1.8 weight percent gave gel times between 70 and 48 hours, possibly a good range for Arbuckle treatments. Sample 1 (G710) only had 2% syneresis. Sample 9 (G63) had the lowest sodium silicate concentration (0.78%) and the most syneresis (20%). There is no trend with the level of syneresis with the initiator concentration. However, the silicate/initiator ratio was kept between 0.5 – 0.8 for the samples in Table 6 with the exception of Sample 9 (G63). The best formulations were mixed in a saline environment (Table 6, Samples G7 Series) by first adding increasing levels of NaCl, then CaCl2 and finally both salts together. Gel times decrease substantially as sodium chloride concentration approaches 1 percent. Syneresis increased to 10 weight percent with increased NaCl concentration. Low levels of divalent calcium
21

ion did not reduce gel time as much and syneresis results were mixed, but calcium ion does significantly affect the gelation process. Immediate cloudiness appeared upon addition of sodium silicate solution to polymer/brine solutions containing CaCl2 concentrations of 0.04% and 0.08%. When both ions were introduced, the gel syneresed badly and it was very weak and unstable. As the gelation process proceeds, the solution pH decreased averaging 6.9 in Samples 1 – 9 (G710 – G61). These results in a saline environment may indicate that a fresh-water pre-flush is needed in field treatments to minimize mixing with the field brine. Once the gel is formed in fresh water, adding a saline solution on top of the gel has no deleterious effect. Table 6. Gelant Composition and Properties of Water Shutoff Systems.
Sample No. (Test
No.)
Sodium Silicate,
%
Initiator, %
NaCl, %
CaCl2, %
Gel Time, hours*
Silicate/ Initiator
Ratio
Syneresis, %
1 (G710) 1.10 1.75 0 0 48 0.63 1.7 2 G62 1.53 1.77 0 0 48 0.86 3.3 3 G66 0.99 1.53 0 0 70.8 0.65 5.0 4 G64 1.01 2.03 0 0 38.6 0.50 6.7
5 G65A 0.97 1.70 0 0 55.4 0.57 6.7 6 G610 0.98 1.8 0 0 48 0.57 6.7 7 G61 1.00 1.8 0 0 48.1 0.56 10.0 8 G67 1.01 1.2 0 0 146.3 0.84 10.0 9 G63 0.78 1.77 0 0 55.4 0.44 20.0
10 G73 0.99 1.83 0.11 0 40.5 0.54 3.3 11 G72 1.02 1.8 0.50 0 15.5 0.57 3.3 12 G71 0.98 1.78 1.01 0 8.7 0.55 9.9 13 G76 0.97 1.73 0 0.008 48.8 0.56 1.7 14 G75 1.00 1.74 0 0.038 40.5 0.57 6.7 15 G74 1.02 1.78 0 0.075 33.3 0.57 3.3 16 G79 1.00 1.76 1.00 0.008 Syn/Brok
en 0.57 -
17 G78 1.06 1.79 1.01 0.038 Syn/Broken
0.59 -
18 G77 0.97 1.80 1.02 0.076 Syn/Broken
0.54 -
* Gel times were +/- 4 hours.
22
Third Party Gel Time, Gel Quality, pH and Viscosity - University of Kansas-Tertiary Oil Recovery Projects Additional tests were conducted with the SPI gel system to determine gel time, gel quality, pH and viscosity values as a function of time. Initial runs of gelation under continuous shear were also conducted.
KU-TORP Sample Preparation Lab water, polymer solution and sodium silicate solution were weighed into a 4 ounce jar. The solution was mixed by shaking prior to placing the jar in a 40°C water bath for a minimum of one hour. Initiator was then weighed into the jar. The gel solution was mixed again by shaking the jar well. Total sample weight was about 90 grams. Approximate 30 grams of the sample was poured into a 40 ml vial. The vial and jar were placed in the 40°C water bath. The samples were observed every 5 to 6 hours to determine the formation of gel and gel quality. The vials were handled carefully (not tilted) and were observed for cloudiness and expelled solvent after gelation (syneresis). The presence of gel was determined in the 4 ounce jars and the pH was determined in selected samples by inserting the pH electrode in the jar and swirling. Runs were conducted where the sample was continuously sheared during the gelation process. This was accomplished with a Bohlin rheometer equipped with a double gap geometry (DG 40/50). The rheometer was allowed to equilibrate at 40 °C for a couple of hours before use. Thirty ml of sample was placed in the DG 40/50 geometry immediately after mixing. About 1 ml of 5 cp oil was placed on top of the sample in each gap to reduce/eliminate sample evaporation. The sample was then continuously sheared and viscosity readings were recorded every three minutes. It is suspected that the initiator, being an organic liquid, could partition into the oil used to eliminate evaporation, reducing the sample concentration. The DG 40/50 was selected due to the low ratio of oil-to-sample volumes as compared to other available geometries.
KU-TORP In-Depth Water Conformance Gel System Results Series 21 gels are for in-depth water conformance (WC) applications. Tests were conducted to determine the effect of the initiator and sodium silicate concentrations on gelation performance. Data on the composition, gel times, pH just before gelling, the level of syneresis and the Sodium
23
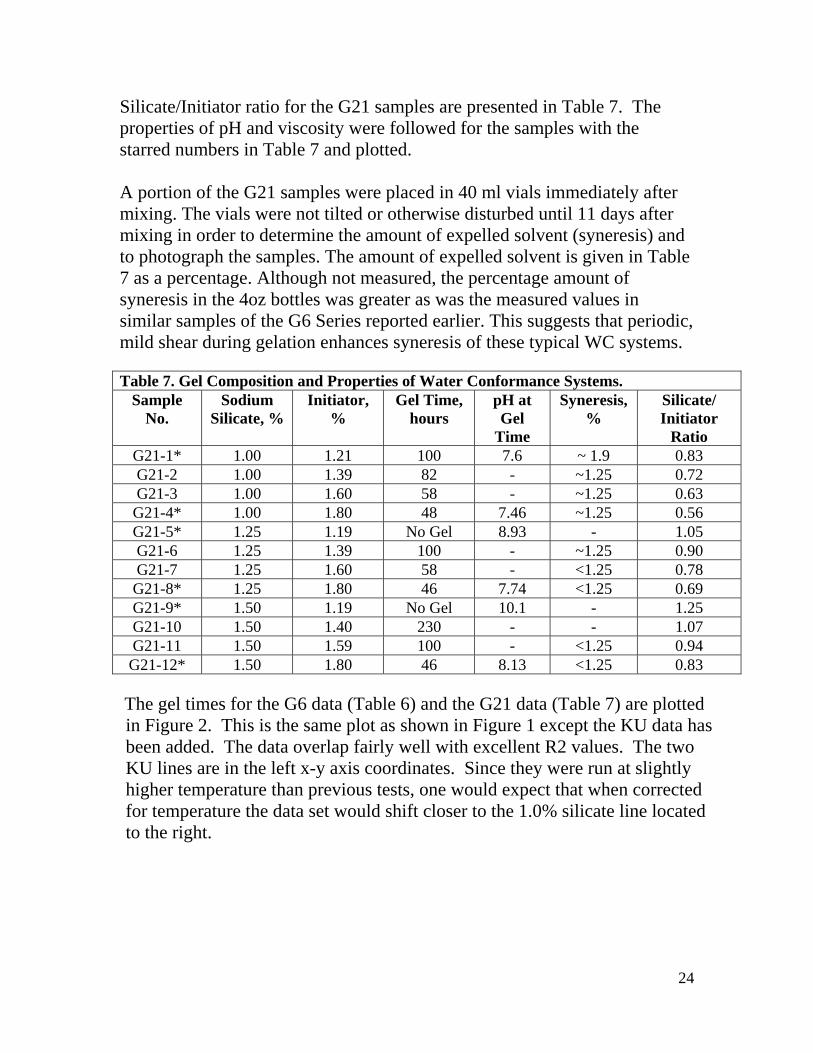
Silicate/Initiator ratio for the G21 samples are presented in Table 7. The properties of pH and viscosity were followed for the samples with the starred numbers in Table 7 and plotted. A portion of the G21 samples were placed in 40 ml vials immediately after mixing. The vials were not tilted or otherwise disturbed until 11 days after mixing in order to determine the amount of expelled solvent (syneresis) and to photograph the samples. The amount of expelled solvent is given in Table 7 as a percentage. Although not measured, the percentage amount of syneresis in the 4oz bottles was greater as was the measured values in similar samples of the G6 Series reported earlier. This suggests that periodic, mild shear during gelation enhances syneresis of these typical WC systems. Table 7. Gel Composition and Properties of Water Conformance Systems.
Sample No.
Sodium Silicate, %
Initiator, %
Gel Time, hours
pH at Gel
Time
Syneresis, %
Silicate/ Initiator
Ratio G21-1* 1.00 1.21 100 7.6 ~ 1.9 0.83 G21-2 1.00 1.39 82 - ~1.25 0.72 G21-3 1.00 1.60 58 - ~1.25 0.63 G21-4* 1.00 1.80 48 7.46 ~1.25 0.56 G21-5* 1.25 1.19 No Gel 8.93 - 1.05 G21-6 1.25 1.39 100 - ~1.25 0.90 G21-7 1.25 1.60 58 - <1.25 0.78 G21-8* 1.25 1.80 46 7.74 <1.25 0.69 G21-9* 1.50 1.19 No Gel 10.1 - 1.25 G21-10 1.50 1.40 230 - - 1.07 G21-11 1.50 1.59 100 - <1.25 0.94 G21-12* 1.50 1.80 46 8.13 <1.25 0.83
The gel times for the G6 data (Table 6) and the G21 data (Table 7) are plotted in Figure 2. This is the same plot as shown in Figure 1 except the KU data has been added. The data overlap fairly well with excellent R2 values. The two KU lines are in the left x-y axis coordinates. Since they were run at slightly higher temperature than previous tests, one would expect that when corrected for temperature the data set would shift closer to the 1.0% silicate line located to the right.
24

F igure 2 . Inita to r C oncentra tion vs G e l T ime a t [P o ly] = 0 .10 %.
Silica te=4.0% , Po ly =0.10f(x)=120.12049* x^(-1.8914059); R²=0.9558Silica te=3.0% ; Po ly =0.10%f(x)=124.76553* x^(-1.7272324); R²=0.936Silica te=2.00% , Po ly =0.10%f(x)=118.66076* x^(-1.3770467); R²=0.9801Silica te=1.0% ; Po ly =0.10%f(x)=99.891388* x^(-0.90669755); R²=0.6816G21 Series Silica te = 1.0% , Po ly = 0.20%f(x)=147.08962* x^(-1.9145638); R²=0.987G60 Series Silica te = 1.0% , Po ly = 0.20%f(x)=223.36934* x^(-2.5716841); R²=0.9908
1 2 3 4 5 6
10
20
30
40
50
60
70
Ge l Time , Hours
Initiator Conce ntration, We ight Pe rce nt
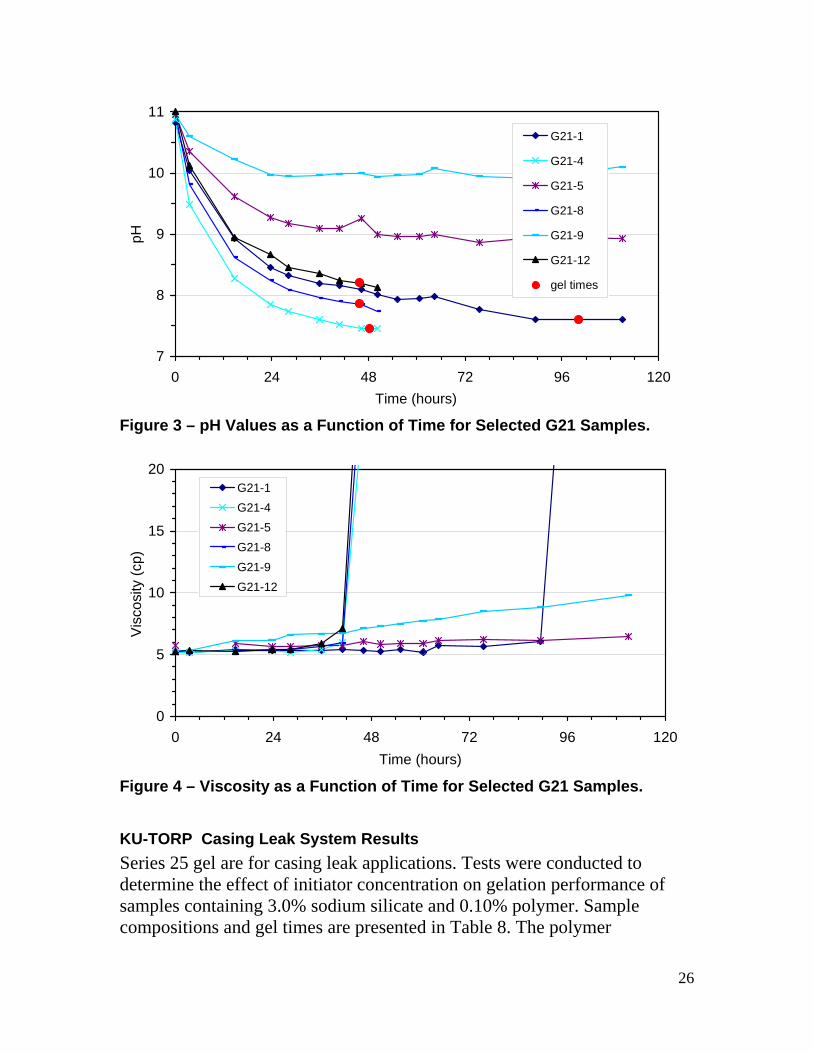
The graphic results are shown in Figure 3 plot the pH as a function of time. The three samples containing 1.80% Initiator at sodium silicate concentrations of 1.0, 1.25 and 1.5 weight percent sodium silicate gelled at about 48 hours. Sample G-21-1 gelled at approximately 100 hours because the silicate/initator ratio of 0.83 was low in comparison to the two gels (G21-5 and G21-9). These gels had silicate/initiator ratios that were higher but the pH drop was not significant enough (pH at 9 – 10) to form a gel at these low concentrations of silicate and initiator. The pH values of samples with the same initiator concentration decreased slower with increased sodium silicate concentration. For samples containing 1.80% Initiator, pH values at the gel time were higher at higher sodium silicate concentrations, resulting in the similar gel times. The graphic results are shown in Figure 4 for the viscosity data in Table 7 as a function of time. Viscosity of the samples that gelled increased moderately before gelation and rapidly increased at the point of gelation. The viscosity was higher than 1000 cp, the highest value that can be measured on the viscometer. The viscosity increased slightly for the two samples that did not gel in the 120 hour time frame.
25
7
8
9
10
11
0 24 48 72 96Time (hours)
pH
120
G21-1
G21-4
G21-5
G21-8
G21-9
G21-12
gel times
Figure 3 – pH Values as a Function of Time for Selected G21 Samples.
0
5
10
15
20
0 24 48 72 96 120Time (hours)
Vis
cosi
ty (c
p)
G21-1G21-4G21-5G21-8G21-9G21-12
Figure 4 – Viscosity as a Function of Time for Selected G21 Samples.
KU-TORP Casing Leak System Results Series 25 gel are for casing leak applications. Tests were conducted to determine the effect of initiator concentration on gelation performance of samples containing 3.0% sodium silicate and 0.10% polymer. Sample compositions and gel times are presented in Table 8. The polymer
26

concentration for these samples was 0.10 weight percent. The short gel times for this series result in less precise values. Viscosity and pH values were measured for the G21-3 sample. The sample had a pH of about 10.2 at the gel time, a much higher pH value than for the WC samples described above. Table 8 – Gel Composition of SPI Systems for Casing Leak.
Sample No.
Sodium Silicate, %
Initiator, % Gel Time, hours
pH at Gel Time
Silicate/ Initiator
Ratio G25-1 2.99 2.01 24.2 1.49 G25-2 2.99 2.20 10.1 1.36 G25-3 2.99 2.39 6.1 10.24 1.25 G25-4 3.00 2.62 6.1 1.15 G25-5 3.01 2.79 6.1 1.08
Viscosity as a function of time was measured for samples subjected to constant shearing conditions in the Bohlin rheometer. Compositions, shear rate and gel time for the runs are given in Table 9. Viscosity readings as a function of time are shown in Figure 5. Gel times were selected as the time when the viscosity reading increased above 10 cp due the erratic behavior above that reading. Table 9. Gel Composition of SPI Systems for Casing Leak – Steady Shear Tests. Sample No. Shear Rate,
(1/sec) Sodium Silicate, %
Initiator, % Gel Time, hours
G25-3 10 2.99 2.39 8.1 G32-1 100 3.00 2.40 9.0 G35-1 1 3.00 2.39 9.4 G37-1 10 2.99 2.40 8.7
Samples G35-1 and G37-1 were removed from the rheometer the following day and placed in vials for observation. Sample G35-1 was sheared for 15.4 hours and was removed shortly after the run was stopped. The sample was about 25% gel and 75% cloudy fluid. The sample was next observed after two days and the fluid portion had gelled and was still gelled 6 days later. This behavior after continuous shearing of the sample appears to be different than the syneresis behavior after mild, periodic shear of the WC samples. Therefore, at higher concentrations of SPI components, the gels may not be as shear sensitive as the lower concentrations.
27
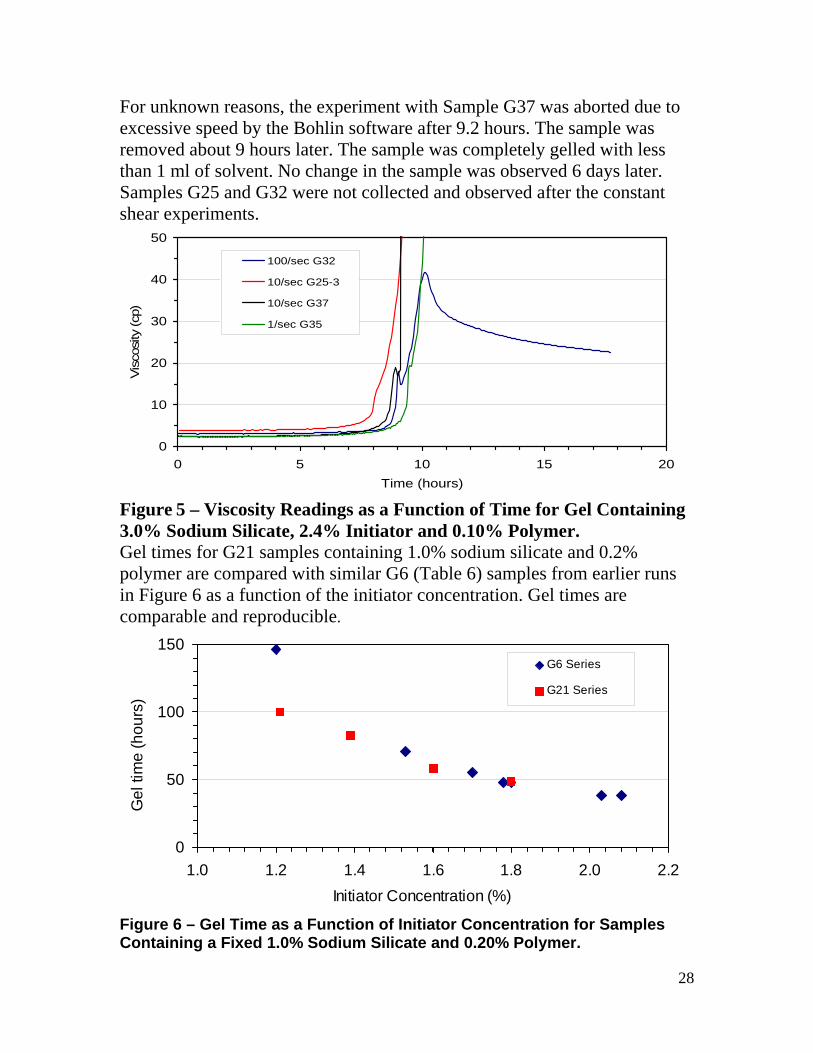
For unknown reasons, the experiment with Sample G37 was aborted due to excessive speed by the Bohlin software after 9.2 hours. The sample was removed about 9 hours later. The sample was completely gelled with less than 1 ml of solvent. No change in the sample was observed 6 days later. Samples G25 and G32 were not collected and observed after the constant shear experiments.
0
10
20
30
40
50
0 5 10 15 20Time (hours)
Vis
cosi
ty (c
p)
100/sec G32
10/sec G25-3
10/sec G37
1/sec G35
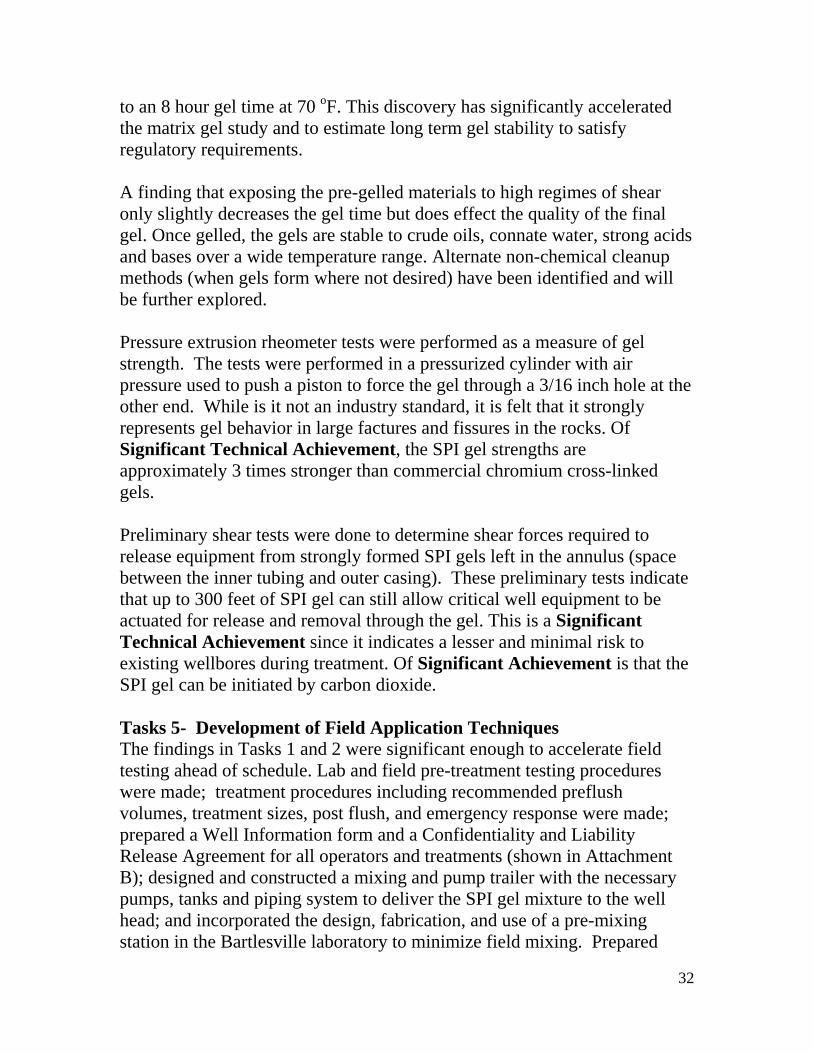
Figure 5 – Viscosity Readings as a Function of Time for Gel Containing 3.0% Sodium Silicate, 2.4% Initiator and 0.10% Polymer. Gel times for G21 samples containing 1.0% sodium silicate and 0.2% polymer are compared with similar G6 (Table 6) samples from earlier runs in Figure 6 as a function of the initiator concentration. Gel times are comparable and reproducible.
0
50
100
150
1.0 1.2 1.4 1.6 1.8 2.0 2.2Initiator Concentration (%)
Gel
tim
e (h
ours
)
G6 Series
G21 Series
Figure 6 – Gel Time as a Function of Initiator Concentration for Samples Containing a Fixed 1.0% Sodium Silicate and 0.20% Polymer.
28

RESULTS AND DISCUSSION: The SPI chemistry formulation is proprietary and in patent-pending status, thus little hard data can be provided until the patent is published. The patent filing disclosed that the SPI formulation is a silicate-polymer based system that has a wide variety of applications and control methodologies. This gel is seen in Figure 3 below. Laboratory work is mostly completed after analyzing different chemicals, elevated temperatures, different mixing
Figure 7- SPI Gel Technology
options and testing other variables to fully define the matrix of control variables of the gels. Nothing has been found that would eliminate these SPI gels from success in a variety of field applications, although we have found limits to the chemistry. Chemicals have been purchased for these field pressure tests. The original tasks proposed were:
• Task 1 Development of Laboratory Matrix Formulation • Task 2 Gel Characterization in the Laboratory Matrix • Task 3 Static Brine and multivalent impact • Task 4 Dynamic Laboratory Simulation Modeling (optional) • Task 5 Development of Field Application Techniques • Task 6 Perform Field Tests (6) and Evaluations • Task 7 Reporting and Tech Transfer
The original purpose of the project was to answer two key questions for the patent pending SPI (Silica, Polymer and Initiator) Gel Technology development and commercialization. Technical objectives were formed to answer those two questions and Tasks were assigned to meet those Technical Objectives.
Question #1: What are the primary variables for hard gel performance and stability for oil and gas production and injection wells to be considered to
29

impact the efficiency and effectiveness? Technical Objective #1: Research, test, and confirm product efficiency and product application variables in the laboratory for SPI technology. Tasks 1,2,3 and 4 were assigned for this objective . Question # 2: What type of physical application models can be developed from the lab data to simulate field performance and how close will this model correlate with the field tests? Technical Objective #2: For laboratory and field evaluations, develop a physical simulation model to predict the optimum field treatments and verify the results with 12 field treatments. Tasks 5 and 6 were assigned for this objective. Task 1 Develop Laboratory Matrix Formulation The key components of the SPI “green chemistry” are: Silica, Polymer and an Initiator. Task 1 lab effort focused on identifying and preliminarily evaluating the variety of SPI compositions and methodologies that can form hard and soft gels and other variables (temperature, brines, divalent ions, pH, gel time, gel types, etc…). Hard gels are candidates for casing leak plugging applications (targeted in the OCAST OARS project ) and soft gels are candidates for permeability modification/ deep penetrating applications (targeted in this Stripper Well Consortium project). Task 1 is complete with over 1,000 gel tests performed, although it will continue at a low effort level to support field testing and identify any new chemistry avenues. The matrix study was a thorough concentration analysis with all three SPI variables to find the sweet spots and elucidate mathematical relationships between SPI concentrations and gel times. One of the most Significant Technical Achievements is the evolved elucidation of a possible gelation mechanism for the SPI system. Knowledge and understanding of the gelation mechanism is a very powerful tool useful for further design improvements. The best mathematical curve fits SPI concentration verses gel times are logarithmic (R2 > 0.9). Of Notable Technical Achievement is the finding that a given SPI Gel’s gelation time can be increased or decreased by controlling the initial pH of the gelling fluid, and/or by dilution with water. Two silicates were evaluated for gel testing: N-Sodium silicate, the most common and cost effective silicate and potassium silicate. The plan is to focus on N-sodium silicate since potassium silicate is more expensive and provides little gain in oilfield applications. This effort is complete.
30

Twenty eight different commercial water soluble polymers were screened, but focused mostly around polyacrylamide (PAM) of varying levels of hydrolysis. Some of these polymers were blended demonstrating performance improvements. Non-ionic PAM’s appear to provide the best gels, a Notable Technical Achievement since it simplified the work. Hydrolyzed PAM and polyacrylates provide less than spectacular performance. Of Notable Technical Achievement, the HE polymers (PAM co-polymers) work well with the SPI gel system suggesting high temperature utility which will be addressed more in the coming year. Four cellulose polymers, EC, HPC, HEC, CMC, and Xanthan biopolymer were evaluated as well as PAM-cellulose blends. They did not contribute to gel performance as much as the non-ionic PAM’s. Polyethyleneimine (PEI) was not impressive. Of Significant Technical Achievement, one particular polymer (confidential), when added to a PAM based SPI gel system unexpectedly reduced syneresis of the weaker gels for permeability control and provided more “ringing” to the hard, yet semi-elastic casing leak gels. Ringing gels are very desirable because “ringing” implies gel stability and a significant level of elasticity as opposed to brittle low stability gels. Polymer screening is complete. Over 24 Initiators were screened. Effectiveness of some Initiators was a function of their insolubility in the system and those were not tested further. Some solubility enhancers have been identified. Six Initiators were tested at length and three are the main focus but their identity is withheld for patent protection purposes. Initiator screening is complete. All proposed work in this task have been accomplished, however additional testing will occur as new SPI systems are identified. Task 2 Laboratory Matrix Characterization The purpose of Task 2 was to evaluate the preferred SPI gels in further detail. All work in this task has been completed, however residual effort remains as new SPI systems are identified. Of Notable Technical Achievement in conjunction with Task 1, a very consistent temperature relationship was discovered across the SPI concentration matrix of Task 1. For every 10 oF above 70 oF the gel is aged, a corresponding multiple factor can be used to accurately estimate the gel time. This is a linear relationship whether at 150 or 200 oF. For example, after aging at 150 oF for one hour and the SPI mixture gels, this corresponds
31
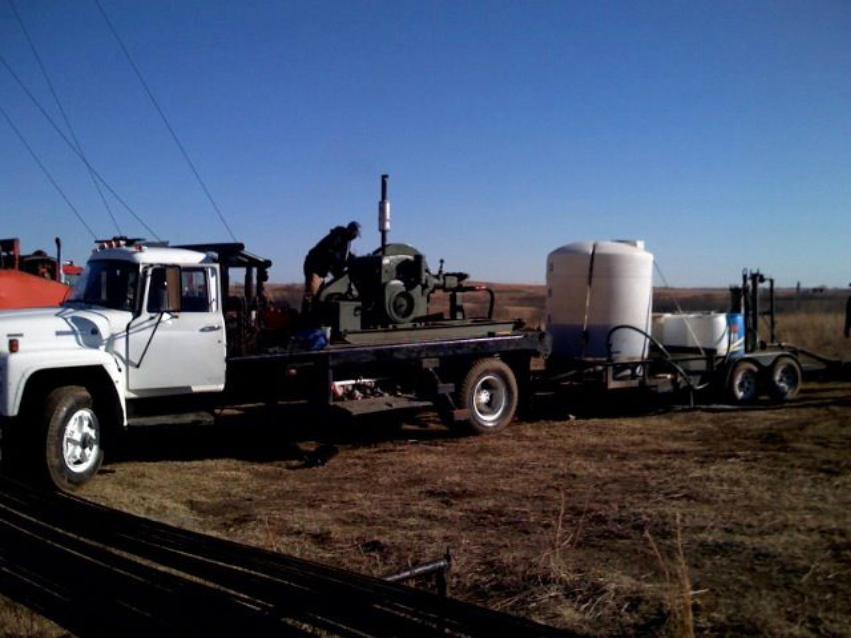
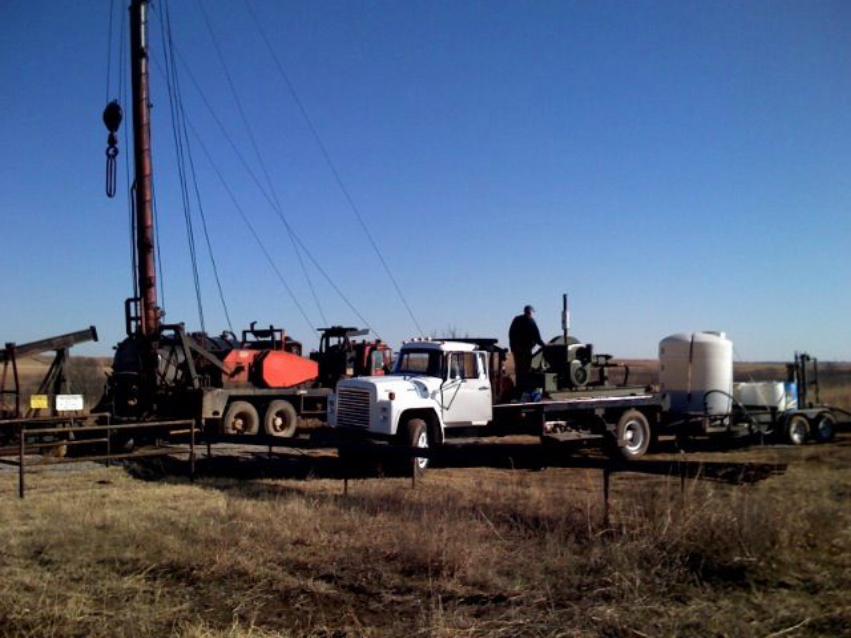
to an 8 hour gel time at 70 oF. This discovery has significantly accelerated the matrix gel study and to estimate long term gel stability to satisfy regulatory requirements. A finding that exposing the pre-gelled materials to high regimes of shear only slightly decreases the gel time but does effect the quality of the final gel. Once gelled, the gels are stable to crude oils, connate water, strong acids and bases over a wide temperature range. Alternate non-chemical cleanup methods (when gels form where not desired) have been identified and will be further explored. Pressure extrusion rheometer tests were performed as a measure of gel strength. The tests were performed in a pressurized cylinder with air pressure used to push a piston to force the gel through a 3/16 inch hole at the other end. While is it not an industry standard, it is felt that it strongly represents gel behavior in large factures and fissures in the rocks. Of Significant Technical Achievement, the SPI gel strengths are approximately 3 times stronger than commercial chromium cross-linked gels. Preliminary shear tests were done to determine shear forces required to release equipment from strongly formed SPI gels left in the annulus (space between the inner tubing and outer casing). These preliminary tests indicate that up to 300 feet of SPI gel can still allow critical well equipment to be actuated for release and removal through the gel. This is a Significant Technical Achievement since it indicates a lesser and minimal risk to existing wellbores during treatment. Of Significant Achievement is that the SPI gel can be initiated by carbon dioxide. Tasks 5- Development of Field Application Techniques The findings in Tasks 1 and 2 were significant enough to accelerate field testing ahead of schedule. Lab and field pre-treatment testing procedures were made; treatment procedures including recommended preflush volumes, treatment sizes, post flush, and emergency response were made; prepared a Well Information form and a Confidentiality and Liability Release Agreement for all operators and treatments (shown in Attachment B); designed and constructed a mixing and pump trailer with the necessary pumps, tanks and piping system to deliver the SPI gel mixture to the well head; and incorporated the design, fabrication, and use of a pre-mixing station in the Bartlesville laboratory to minimize field mixing. Prepared
32
trailer mounted tank, pump and piping for onsite mixing and pumping the SPI gel system into wells for in-depth treatments and casing repairs. Task 6- Field Test Field testing began as the SPI gel formulation was evolving. Early formulations had short gel times in the summer heat. Later formulations had extended gel times and more apparent control and better gels. Nine (9) in-depth water conformance field treatments were made with one SPI gel formulation in two (2) different fields-all in the Bartlesville formation, which has a history of low oil recoveries due to water channeling. The treatments in one field were considered a success in diverting water into new zones, as evidenced by pressure changes, for a technical success; however, it is too early to determine economic success of increased oil production. It is important to note that only a total of 200 bbls of SPI gel was used in this field and normal treatments are 5,000- 10,000 bbls. Discussions with the operator will occur for further field treatments. The second field for in-depth treatments utilized less than 200 bbls with no pressure or rate response seen. Much larger treatments are expected to be needed for an optimum economic response. Twelve (12) casing repair treatments were made with three (3) different SPI gel formulation systems in five (5) fields. Several well casing repair treatments were terminated due to unknown/ unanticipated downhole well problems or surface equipment problems. More tests would have been done except for the very high rainfall that has occurred in the mid-west plains in the spring and summer. The success rate overall was 57%, which included one partial success (300+ BPD down to less than 50 BPD ). Gel treatment sizes ranged from 6.25 bbls up to 96 bbls. Task 7 - Reporting A technical presentation on the SPI Technology was made to the University of Kansas’ annual Tertiary Oil Recovery Projects (TORP) meeting, on April 5, 2007 in Wichita, Kansas. Title of the talk by Ken Oglesby (PI) was “Innovative Technologies for Stripper Well Operators”. Contact was also made with key end users, customers and service operators at both the Society of Petroleum Engineers’ Advanced Technology
33
Workshop on “Chemical Methods for Water Control” that was held in San Antonio, Texas on March 4-7, 2007. A talk was given at the Rocky Mountain Oilfield Testing Center in Casper, Wyoming on 20 August 2007. A talk to the SWC meeting in Wichita, Kansas was given on 30 October 2007. A talk to i2E, a private organization contracted by Oklahoma state, in Tulsa, Oklahoma, was given on 19 September 2007. A talk to the Engineering Society of Tulsa (EST) was given on 28 January 2008. A Society of Petroleum Engineers (SPE) technical paper (SPE 113490) has been prepared (draft 5 as Appendix A) and will be presented in April 2008 at the SPE Improved Oil Recovery Symposium in Tulsa, Oklahoma. Copies of these presentations can be obtained upon request.
34

CONCLUSIONS: Basic matrix bottle, extrusion and sand pack flow tests and laboratory work are completed. Several SPI gel system and multiple additives have been identified, each possesses different gel times, gel strengths, gel life expectancy and costs. This versatility provides potential fit in multiple industries and applications. Multiple applications have been identified for commercialization- casing repair, water conformance, CO2 conformance, air drilling (water influx), mud drilling (lost circulation), utility (sewer, pipeline), construction (basement/ foundation sealing) and other targeted applications. Significant field tests have been accomplished to commercialize the in-depth water conformance and casing repair applications. A detailed patent and literature review was performed prior to patent submittal, which ensures a strong patent position. The investigators wish to thank to the Stripper Well Consortium (SWC), Oklahoma Center for Science and Technology (OCAST) and the US Department of Energy (DOE) for their support of this project. The following conclusions were derived from the results of the different lab experiments:
1. Controlled gels with delayed gel time are made from the combination of sodium silicate, an initiator and a polyacrylamide. These new gels, known as SPI gels demonstrate a new type of silicate gel possessing more elasticity than earlier silicate gels. Initial testing suggests these gels can be designed for in-depth conformance control treatments and casing leak repair. Although a considerable amount of research effort has been directed at the SPI gels to determine the proper balance between the components, component concentrations, gel time, and the gel strengths, there is still a significant amount of research work to be completed before these systems are ready for commercial applications.
2. The gels solutions have the advantage of being pumped as a single
stage treatment in contrast to the earlier silicate gels that required alternate fluid stages to form a precipitate gel.
3. The SPI gels may be from a number of different initiators and
polymers to fit the particular application. The polymers may be hydrolyzed or non-ionic polyacrylamide, polyacrylamide derivatives, cellulose derivatives, or biopolymer.
35

4. Weaker gels for conformance control are produced at a sodium silicate to initiator ratio of 0.5 – 1.10 producing a pH in the range of 7 – 8 and a gel time in the range of 30 – 65 hours. Firm ringing gels for casing leak applications are produced at a silicate/initiator ratio of approximately 1.10 – 2.0 for a pH in the range of 8 – 10 and a gel time of 4 – 29 hours.
5. The gels have low initial viscosity and show a rapid increase in
viscosity just before the gel forms.
6. At higher concentrations of SPI components, the stronger gels are not as shear sensitive as the weaker gels.
7. As the gel forms, the pH of the gel solution is reduced from 11 to 7 or
8.
8. The SPI gels are sensitive to higher brine (particularily sodium chloride) concentrations and require a pre-flush. Contact with such ions can be beneficial in generated gel strength .
9. Extrusion testing showed that SPI gels have 4+ times the shear
strength as conventional standard polyacrylamide gels. These tests need to be expanded and correlated to sand pack tests.
10. Sand pack tests are required for the optimized formulations and long
term stability testing is required for treatment design. The following conclusions were derived from the casing repair and shutoff field testing:
11. Surface temperatures can affect gel times for shallow placement and small treatment sizes.
12. Larger treatment sizes are beneficial for success, but does not ensure
success. 13. Diverting solids agents can be useful in aiding placement and better
coverage.
36
14. Eighty (80) bbl Bobtail tanks & truck arrangements would be more efficient in field testing.
15. Additional field and lab testing is required to optimize the
formulation and treatment process.
The following conclusions were derived from the in-depth water conformance field testing:
16. Additional field testing, larger overall SPI gel volumes and additional time for evaluation are required to optimize these treatments.
17. Operator controlled batch tank (220+ bbls) SPI treatments are
required to improve economics of large field treatments. 18. Additional laboratory and field tests are required to optimize the SPI
formulation for gel times and strength
37

REFERENCES: 1. Huang, C.G., Green, D.W., and Wilhite, G.P., "An Experimental Study
of the In-Situ Gelation of Chromium(III)-Polyacrylamide Polymer in Porous Media," paper SPE/DOE 12638, SPE/DOE Fourth Symposium on Enhanced Oil Recovery, Tulsa, Apr. 15-18, 1984.
2. Hubbard, S., Roberts, L.J., and Sorbie, K.S., "Experimental and
Theoretical Investigation of Time-Setting Polymer Gels In Porous Media,” paper SPE/DOE 14959, SPE/DOE Fifth Symposium on Enhanced Oil Recovery, Tulsa, Apr. 20-23, 1986.
3. Sydansk, A.D.,”Acrylamide-Polymer/Chromium(III)-Carboxylate Gels
for Near Wellbore Matrix Treatments,” SPE/DOE 20214, SPE/DOE Seventh Symposium on Enhanced Oil Recovery in Tulsa, Apr. 22-25, 1990.
4. Moradi-Araghi, A., Bjornson, G., and Doe, P.H., "Thermally Stable Gels
for Near-Wellbore Permeability Contrast Corrections,” SPE 18500, SPE International Symposium on Oilfield Chemistry Houston, Feb. 8-10,1989.
5. Mills, R.V.A., US Patent 1,421,706, July 4, 1922. 6. Gandon, L., US Patent 3,149,985, September 22, 1964. 7. McLaughlin, H.C. and Ramos, J., US Patent 3,435,899, April 1, 1969. 8. Smith, W.H., and Walters, E.F., US Patent 4,640,361, February 3,1987. 9. Chatterji, J., Onan, D.D., and King, B.J., US Patent 6,059,035, May 9,
2000. 10. Krumrine, P.H. and Boyce, S.D., “Profile Modification and Water
Control With Silica Gel-Based Systems,” SPE 13578, SPE International Symposium on Oilfield and Geothermal Chemistry, Phoenix, April 9 – 11, 1985.
11. Wagner, O.R., Smith, L.R., Osborn, J.L., Patent US 3,656,550, April 18,
1972
38
12. Chou, S. I. and Bae, J.H., “Characterization of Silicate Gels for Profile Control,” Symposium on Enhanced Oil Recovery,” Presented before the Division of Petroleum Chemistry, Inc, 205th National Meeting, American Chemical Society, Denver March 28 – April 2, 1993.
13. Hessert, J.E., and Clampitt, R.L., Patent US 3,749,172, July 31,1973. 14. Clampitt, R.L. and Hessert, J.E., Patent US 3,727,687, April 17, 1973. 15. Gall, J.W., Patent US 3,762,476, October 2, 1973. 16. Clampitt, R.L. and Hessert, J.E., Patent US 3,785,437, January 15, 1974. 17. Mumallah, N.A. and Shioyama, T.K., Patent US 4,644,073, February 17,
1987. 18. Falk, D.O., Patent US 4,688,639m, August 25, 1987. 19. Hessert, J.E. and Clampitt, R.L., Patent US 4,043,921, August 23, 1977. 20. Burns, L.D., Wilhite, P. , McCool, S., Oglesby, K. and Glass, J., SPE
Paper 113490, “New Generation Silicate Gel System For Casing Repairs and Water Shutoff”, 2008 SPE/DOE Improved Oil Recovery Symposium, April 2008.
BIBLIOGRAPHY: No additional given APPENDICES:
A SPE paper 113490 (draft 5) B. Summary table of Field Tests C. University of Kansas- Tertiary Oil Recovery Projects Lab Tests
(preliminary reports) D. Pictures of Field Testing
39
APPENDIX A
SPE Paper 113490 (Draft 5-Not Final)
New Generation Silicate Gel System for Casing
Repairs and Water Shutoff
1
SPE Paper 113490
New Generation Silicate Gel System For Casing Repairs and Water Shutoff Lyle D. Burns and Michael Burns, RTA Systems, Inc. Bartlesville, OK; Paul Wilhite and Stan McCool, University of Kansas, Lawrence, KS; Ken Oglesby, Impact Technologies, Tulsa, OK; Jim Glass, JAG Enhanced Recovery, Tulsa, OK Copyright 2008, Society of Petroleum Engineers This paper was prepared for presentation at the 2008 SPE Improved Oil Recovery Symposium held in Tulsa, Oklahoma, U.S.A., 19–23 April 2008. This paper was selected for presentation by an SPE program committee following review of information contained in an abstract submitted by the author(s). Contents of the paper have not been reviewed by the Society of Petroleum Engineers and are subject to correction by the author(s). The material does not necessarily reflect any position of the Society of Petroleum Engineers, its officers, or members. Electronic reproduction, distribution, or storage of any part of this paper without the written consent of the Society of Petroleum Engineers is prohibited. Permission to reproduce in print is restricted to an abstract of not more than 300 words; illustrations may not be copied. The abstract must contain conspicuous acknowledgment of SPE copyright.
ABSTRACT
The SPI gel system is a low cost, multi-component silicate based gel, mixed at surface and pumped as a single stage with controlled gel times ranging from a few hours to several days to form a variety of resilient gels from hard, "ringing" to soft, weak gels. This new environmentally friendly, "green" gel system uses low chemical concentrations and no heavy metals for a low overall cost. SPI gel systems were developed to solve water conformance problems on injector and producer wells, for casing leak repairs and other applications. The SPI pre-gelled system has a low viscosity for deep penetration of leaks and tight formations and it can be designed for special applications. Well over 1000 lab tests were performed to evaluate the SPI gel system at the RTA Systems laboratory. Further rheological testing was conducted and is in progress at the Tertiary Oil Recovery Project at the University of Kansas. Lab tests are continuing to establish a minimum 5-year life of the SPI silicate gels for permitted injection well repairs for regulatory Mechanical Integrity Testing (MIT) requirements. This paper presents the laboratory discovery work and the early 3rd party confirmation work. These gels are now being field-tested for waterflood conformance and casing repairs. INTRODUCTION Permeability and reservoir heterogeneity variations significantly affect the sweep efficiency or reservoir conformance of oil recovery processes. Over the last 40 years, several methods1-4 were proposed for improving reservoir conformance using crosslinked polymers to mitigate the problems associated with reservoir heterogeneity. Two methods are commercially used to crosslink polyacrylamides based on the controlled availability of multivalent metal ions (generally chromium) resulting in the crosslinked polyacrylamide. Key issues with the crosslinked polyacrylamide systems include (1) Environmental and safety issues over the heavy metal crosslinking agent chromium, (2) Limited penetration depth, (3) Polymer shear degradation, (4) Polymer absorption on the reservoir surface, (4) Polymer gel time, (5) Polymer precipitation under harsh reservoir conditions. Application of silicates in different industrial areas is enormous and well documented. Injection of silicate solutions into reservoirs with the aim at enhancing the recovery factor through a diverting effect was first proposed in 1922.5 Acidic gel systems are the oldest and most commonly employed techniques that employ silicates. These gels are more accurately described as precipitation type gels since they are extremely brittle with no elasticity. In the early 1960’s, sodium silicate and glyoxal were combined to make various hard cement-like coatings on substrates. At low concentrations, a firm gel was obtained that lacked cohesiveness and was not as hard as cement. In 1964, Gandon6 took the mission one step further citing sodium silicate reactions with other organic compounds to make cement like substances used to create very hard consolidated soils for constructing bridge and dam structures. In the last 50 years, numerous inventors7-9 patented various sodium silicate systems to make gels for use in plugging high permeability areas of oil and gas producing reservoirs. Krumrine and Boyce’s paper10 compiles numerous papers and patents on sodium silicate chemistry as applied to oil field and grouting applications. They also drew attention to a controversial fact that the silicate use was inequitably neglected in commercial applications in

2 [SPE 113490]
favor of polymer treatments in practice at the time. Many chemicals can serve as sodium silicate initiators. An initiator can be defined as a chemical that causes a sodium silicate solution to gel in a delayed fashion. It should be noted that the gel is not simply a precipitate. Metal ions such as calcium, can cause immediate precipitation of a water-insoluble metal silicate. Many initiators are acidic, water-soluble chemicals which lower the pH of the silicate solution to a point at least below about 11. Most ammonium salts of strong acids such as ammonium sulfate are effective gelants.11, 12 Methods of delaying rapid reactions in the prior art involve multiple stage treatments such as pumping alternating slugs of sodium silicate and the initiator separated with inactive slugs of fresh water when the initiator reacts rapidly. This complexity allows for delayed gelation in the formation after the placement of the two reactants; however this does not allow for in-depth placement of the silicate gels. Although the sodium silicate technology was the first plugging and permeability modification technology largely put to practice, the use of gelled polymers based on polyacrylamide and chromium VI salts with reducing agents or organochromium compounds became more popular in the 1970’s and 1980’s because of their unique versatility to make hard and soft elastic gels rather than the inelastic gels formed using the original sodium silicate chemistry. Phillips Petroleum Company was the pioneer in this area and later followed by Marathon Oil Company with similar technology using polyacrylamide-chromium gelled systems. For example, Clampitt, Hessert, and Gall13-16 are among the many inventors proposing various gelled cellulose and acrylamide polymers that could be placed in a high permeability formation and crosslinked into a chromium gel. Mumallah17 patented the concept of chromium proprionate as a delayed gel complexing agent for polyacrylamide. Later, Falk18 at Marathon patented chromium acetate for use in gelling polyacrylamides. Casing repairs and water reduction are important because they can save well profitability, prevent premature well plugging, loss of oil and gas reserves and allow regulatory compliance. Casing leaks occur primarily over time from steel casing exposed to corrosive formation waters. In wells with bad casing, water influx through casing leaks can cause scale formation and excess water production possibly leading to abandonment or premature plugged. As our oil and gas wells continue to age, casing leaks will become more of a problem. Competitive polymer gel systems are used successfully as an alternative to cement, or in combination with cement, to squeeze casing leaks and improve mechanical well integrity. They also are used instead of mechanical methods of cupped packers. Hard gels are used to hold a solid pressure in the casing or to block encroachment of foreign water into a producing well or block pressure leakoff into the formation. Advantages of using gels are two-fold. They can be washed out of the wellbore after a leak is squeezed, preventing the costly rig time necessary to drill out cement. Second, since such solutions exert a much lower hydrostatic pressure than a cement slurry, there is less possibility of breaking down the formation and losing the squeeze seal. In this work, sodium silicate gels made with an organic initiator in the presence of a polymer, such as a polyacrylamide derivative, were evaluated for conformance control and casing leak plugging. Historically, uniform silicate gels were almost impossible to prepare because the reaction is rapid between sodium silicate and an acidic setting agent. Therefore, most silicates form very rigid, non-uniform gels subject to fracturing or syneresis with concomitant shrinkage. Certain organic initiators can form delayed gels with sodium silicate as an improvement, but the gels are brittle without elasticity and the gels require high material concentrations. Sodium silicate is a complicated system of various molecular weight silica polymers in an alkaline solution. Aside from requiring a certain minimum amount of buffered alkalinity, sodium silicate has no definite chemical combining numbers. When sodium silicate is acidified to a pH of less than about 10, the sodium silicate is converted partially to silicic acid. Silicic acid exists at these alkaline pH’s as it is such a weak acid. Instead of precipitating and making silica, SiO2, the silicic acid remains hydrated and forms a three-dimensional network in trapping the solvent water. This network is a gel since both phases are continuous. A slight lowering of the pH brings about radical changes in gel time. Consequently, gel times are difficult to control, and lumping from local acid concentrations during large scale mixing frequently occurs. On the other hand polyacrylamide gels with the dichromate ion and a reducing agent such as sodium hydrosulfite form an elastic gel without the brittleness and other disadvantages of the early silicate systems. Polyacrylamide and certain organic initiators such as aldehydes are known to form gels at low pH and high concentrations of the reagents, but as reported, gels do not form at neutral pH and above. In the laboratory, when very low concentrations of a partially hydrolyzed polyacrylamide was added to sodium silicate in the presence of an organic initiator, varying types of gels were formed ranging from soft gels to very hard, ringing gels with gel times of minutes to days. The Silica Polymer Initiator (SPI) gels formed in this manner are more elastic in behavior like a polyacrylamide gel instead of possessing the characteristic brittleness of sodium silicate gels with the same initiator. In the absence of sodium silicate, neutral pH polyacrylamide solutions do not react with the organic substrates. In the absence of an

3
organic initiator, sodium silicate does not react with polyacrylamide. The presence of the polyacrylamide in the formulation is unique and novel resulting in a more elastic gel. Without polyacrylamide in the SPI formulation, a delayed silica precipitation occurs to generate a very opaque brittle gel. Silica precipitations of this type have been known for years. The Initiator does not appreciably react with the polyacrylamide. The Initiator servers as a source of protons allowing the silica to form a silica hydrogel that may be weakly bound by hydrostatic forces to the polyacrylamide molecules. These hydrostatic forces between the silicate hydrogel and the polymer tend to wrap around the polyacrylamide and also bind two or more polymer chains together in a weak crosslink. As gelation occurs, the pH drops from approximately 12 to the 10 – 7 range. Although a considerable amount of effort has been directed at the SPI gels to determine the proper balance between the components, component concentrations, gel time, and the gel strengths, there is still a significant amount of work to be completed before these systems are commercial. This paper is for the purposes of introducing a derivative silicate technology. INITIAL MATRIX SCREENING EXPERIMENTS Materials The sodium silicate used in this study was N-Sodium Silicate available from PQ Corporation. N-Sodium Silicate has 37.85% solids as SiO2 and Na2O and 28.90% as SiO2. The pH is approximately 11.3. N-Sodium silicate has a molar ratio of silicon dioxide to alkali metal oxide of 3.22. For the purpose of this paper, the composition of the initiators will remain confidential, although numerous initiators were tested. Polyacrylamide polymers were evaluated ranging between high and low molecular weights and varying amounts of levels of hydrolysis ranging from 0 – 50%. Polymers used were: Alcoflood 254S (AC 254S) , a 250,000 molecular weight polyacrylamide with 7 percent hydrolysis; Goodrite® polymers that are polyacrylates; HE® polymers, where HE 100® is a copolymer of AMPS (Sodium salt of 2-Acrylamido-2-Methyl Propane Sulfonic acid) and acrylamide and HE 300® polymer is a copolymer of VP (Vinyl Pyrrolidone) and Acrylamide; Drispac® polymer, a 0.9 degree of substitution CMC (carboxymethylcellulose) polymer; Natrosol 250HHR®, a non-ionic HEC (hydroxyethylcellulose) polymer; and Kelzan® XC polymer, a Xanthan gum polymer. Salts of NaCl, KCl and CaCl2⋅H2O were also utilized. Preparative Methods The initial matrix screening experiments were performed at RTA Systems, Inc. The polymer solutions were prepared by forming a water vortex in a container using a magnetic stirrer and dropping the dry polymer granules on the shoulder of the vortex. The solutions were then slowly stirred overnight to complete the dissolution. Polymers were prepared at a concentration of 0.5 weight percent. The standard order of mixing of the SPI components to form a gel are: 1) Bartlesville city Tap Water (BTW), 2) Polymer master batch (5000 ppm solution), 3) Sodium silicate (concentrated), and 4) the Initiator. The jar was sealed with a lid and it was shaken for about 20 – 30 seconds to thoroughly mix the components. For the shorter gel times, the samples were observed at room temperature (RT) for the time of gelation. For extended gel times beyond 8 hours, the bottles were placed in an oven for accelerated gelation, and extrapolated back to a room temperature gel time. From these lab tests, approximately 1-hour gelation time in an oven at 150oF is equivalent to 8 hours gelation time at room temperature. In doing a series of tests, it was determined best to pre-weigh the components in all the jars in a series except for the initiator. Then add the initiator last to all of the jars and place in the oven at the same time. Results of Matrix Studies A gel time matrix was developed over the total weight percent range of SPI components as follows: Sodium silicate: 4.0, 3.0, 2.0, 1.0, and 0.56 weight percent. Polymer: 0.05, 0.10, 0.15, and 0.20 weight percent Initiator: 1.8, 2.3, 2.8, and 3.3 weight percent This screening study was performed for numerous initiators and polymer types. Generally, SPI gels with sodium silicate levels less than 1.0 weight percent are probably to weak to be of value. SPI gels with silicate levels greater than 4.0 weight percent tend to plateau on a cost-benefit basis. Gels with sodium silicate less than 4.0 weight percent have ample gel strength for casing leak applications. SPI gels with polyacrylamide concentrations below 0.10 weight percent are not as stable often resulting in more syneresis than gels at or above 0.10 weight percent. Polyacrylamide levels up to 0.20 weigh percent are useful, particularly for the weaker gels for conformance control. Whereas, very nice hard ringing gels for casing leaks may be produced at polyacrylamide levels in the 0.10 to 0.20 wt percent range. Polyacrylamides are very economical at this concentration. Weak gels for conformance control are produced at a sodium silicate to initiator ratio of 0.5 – 1.10 producing
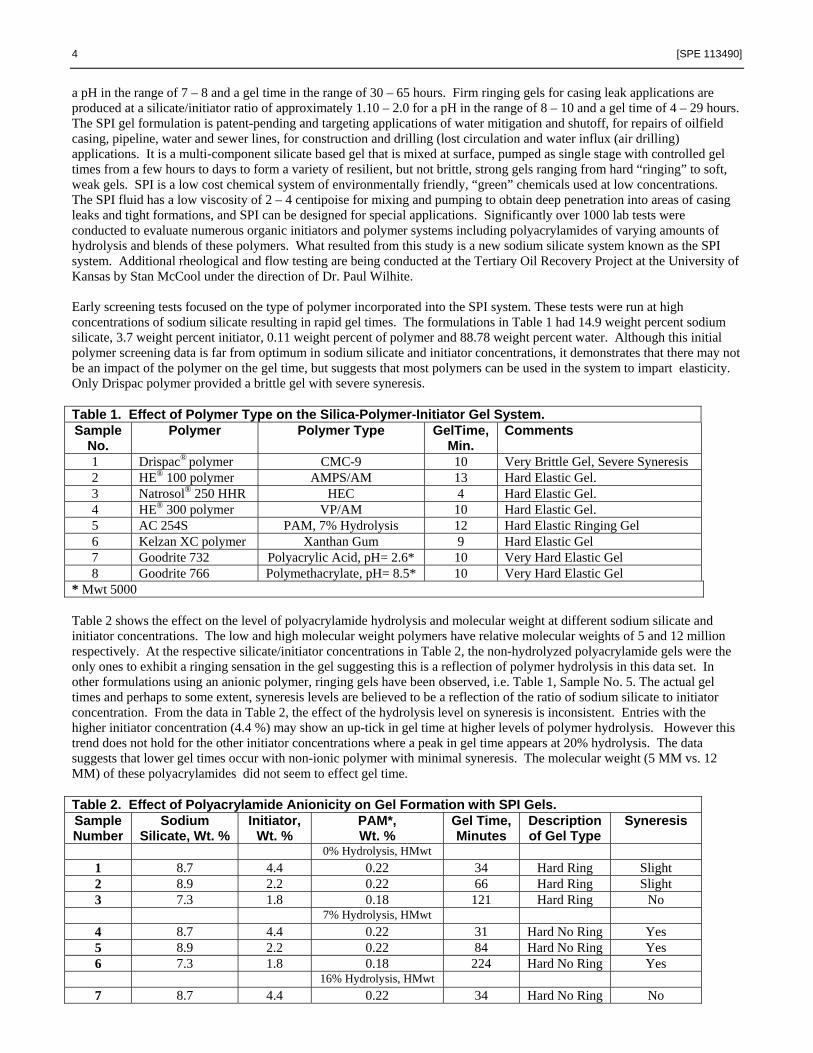
4 [SPE 113490]
a pH in the range of 7 – 8 and a gel time in the range of 30 – 65 hours. Firm ringing gels for casing leak applications are produced at a silicate/initiator ratio of approximately 1.10 – 2.0 for a pH in the range of 8 – 10 and a gel time of 4 – 29 hours. The SPI gel formulation is patent-pending and targeting applications of water mitigation and shutoff, for repairs of oilfield casing, pipeline, water and sewer lines, for construction and drilling (lost circulation and water influx (air drilling) applications. It is a multi-component silicate based gel that is mixed at surface, pumped as single stage with controlled gel times from a few hours to days to form a variety of resilient, but not brittle, strong gels ranging from hard “ringing” to soft, weak gels. SPI is a low cost chemical system of environmentally friendly, “green” chemicals used at low concentrations. The SPI fluid has a low viscosity of 2 – 4 centipoise for mixing and pumping to obtain deep penetration into areas of casing leaks and tight formations, and SPI can be designed for special applications. Significantly over 1000 lab tests were conducted to evaluate numerous organic initiators and polymer systems including polyacrylamides of varying amounts of hydrolysis and blends of these polymers. What resulted from this study is a new sodium silicate system known as the SPI system. Additional rheological and flow testing are being conducted at the Tertiary Oil Recovery Project at the University of Kansas by Stan McCool under the direction of Dr. Paul Wilhite. Early screening tests focused on the type of polymer incorporated into the SPI system. These tests were run at high concentrations of sodium silicate resulting in rapid gel times. The formulations in Table 1 had 14.9 weight percent sodium silicate, 3.7 weight percent initiator, 0.11 weight percent of polymer and 88.78 weight percent water. Although this initial polymer screening data is far from optimum in sodium silicate and initiator concentrations, it demonstrates that there may not be an impact of the polymer on the gel time, but suggests that most polymers can be used in the system to impart elasticity. Only Drispac polymer provided a brittle gel with severe syneresis. Table 1. Effect of Polymer Type on the Silica-Polymer-Initiator Gel System. Sample
No. Polymer Polymer Type GelTime,
Min. Comments
1 Drispac® polymer CMC-9 10 Very Brittle Gel, Severe Syneresis 2 HE® 100 polymer AMPS/AM 13 Hard Elastic Gel. 3 Natrosol® 250 HHR HEC 4 Hard Elastic Gel. 4 HE® 300 polymer VP/AM 10 Hard Elastic Gel. 5 AC 254S PAM, 7% Hydrolysis 12 Hard Elastic Ringing Gel 6 Kelzan XC polymer Xanthan Gum 9 Hard Elastic Gel 7 Goodrite 732 Polyacrylic Acid, pH= 2.6* 10 Very Hard Elastic Gel 8 Goodrite 766 Polymethacrylate, pH= 8.5* 10 Very Hard Elastic Gel * Mwt 5000 Table 2 shows the effect on the level of polyacrylamide hydrolysis and molecular weight at different sodium silicate and initiator concentrations. The low and high molecular weight polymers have relative molecular weights of 5 and 12 million respectively. At the respective silicate/initiator concentrations in Table 2, the non-hydrolyzed polyacrylamide gels were the only ones to exhibit a ringing sensation in the gel suggesting this is a reflection of polymer hydrolysis in this data set. In other formulations using an anionic polymer, ringing gels have been observed, i.e. Table 1, Sample No. 5. The actual gel times and perhaps to some extent, syneresis levels are believed to be a reflection of the ratio of sodium silicate to initiator concentration. From the data in Table 2, the effect of the hydrolysis level on syneresis is inconsistent. Entries with the higher initiator concentration (4.4 %) may show an up-tick in gel time at higher levels of polymer hydrolysis. However this trend does not hold for the other initiator concentrations where a peak in gel time appears at 20% hydrolysis. The data suggests that lower gel times occur with non-ionic polymer with minimal syneresis. The molecular weight (5 MM vs. 12 MM) of these polyacrylamides did not seem to effect gel time. Table 2. Effect of Polyacrylamide Anionicity on Gel Formation with SPI Gels. Sample Number
Sodium Silicate, Wt. %
Initiator, Wt. %
PAM*, Wt. %
Gel Time, Minutes
Description of Gel Type
Syneresis
0% Hydrolysis, HMwt 1 8.7 4.4 0.22 34 Hard Ring Slight 2 8.9 2.2 0.22 66 Hard Ring Slight 3 7.3 1.8 0.18 121 Hard Ring No 7% Hydrolysis, HMwt
4 8.7 4.4 0.22 31 Hard No Ring Yes 5 8.9 2.2 0.22 84 Hard No Ring Yes 6 7.3 1.8 0.18 224 Hard No Ring Yes 16% Hydrolysis, HMwt
7 8.7 4.4 0.22 34 Hard No Ring No

5
8 8.9 2.2 0.22 63 Hard No Ring No 9 7.3 1.8 0.18 150 Hard No Ring No 20% Hydrolysis, HMwt
10 8.7 4.4 0.22 32 Hard No Ring Yes 11 8.9 2.2 0.22 67 Hard No Ring Yes 12 7.3 1.8 0.18 200 Hard No Ring Yes
33% Hydrolysis, LMwt 13 8.7 4.4 0.22 40 Hard No Ring Yes 14 8.9 2.2 0.22 53 Hard No Ring Slight 15 7.3 1.8 0.18 128 Hard No Ring Slight
33% Hydrolysis, HMwt 16 8.7 4.4 0.22 42 Hard No Ring Yes 17 8.9 2.2 0.22 50 Hard No Ring Slight 18 7.3 1.8 0.18 144 Hard No Ring Slight
50% Hydrolysis, LMwt 19 8.7 4.4 0.22 56 Hard No Ring Yes 20 8.9 2.2 0.22 51 Hard No Ring Slight 21 7.3 1.8 0.18 160 Hard No Ring Slight
* Superflock polyacrylamide Gel time is most affected by the sodium silicate concentration and at higher concentrations, shorter gel times were observed along with stronger gels. At lower sodium silicate concentrations, longer gel times were observed with weaker gels being formed. The initiator serves to provide a source of hydrogen ions to the gel system. There is an optimum initiator/sodium silicate mass ratio that provides optimum gel. The formulation in Table 3 is an example of a weak gel with a 64 hour gel time. The BTW added was pre-calculated to arrive at the above weight percentage of the components. The water components of the additives were taken into account to arrive at a total water weight percent as shown in Table 3. Table 4 is an example of a firm ringing gel for casing leak correction applications. Table 3. Example SPI Weak Gel For Permeability Correction. SPI Component Concentration
Factor, % Component Added, g
Component Conc., g
Weight Percent,
N-Sodium Silicate, Concentrated 37.60 0.81 0.30 0.95 Polymer (5000 ppm solution) 0.050 13.00 0.065 0.203 Initiator 100.00 0.57 0.57 1.78 Water from Sodium Silicate 62.40 0.81 0.505 1.58 Water from Polymer 99.50 13.00 12.94 40.45 Additional BTW 100.00 17.60 17.60 55.03 Totals 31.98 100.00 Total Water 97.06 Gel Time: 64 Hours; Weak gel, holds shape, No syneresis. Table 4. Example SPI Firm Ringing Gel For Casing Leak Correction. SPI Component Concentration
Factor, % Component Added, g
Component Conc., g
Weight Percent,
N-Sodium Silicate, Concentrated 37.60 3.20 1.20 2.96 Polymer (5000 ppm solution) 0.050 8.50 0.043 0.105 Initiator 100.00 0.96 0.96 2.36 Water from Sodium Silicate 62.40 3.20 1.997 4.91 Water from Polymer 99.50 8.50 8.46 20.80 Additional BTW 100.00 28.00 28.00 68.86 Totals 40.66. 100.00 Total Water 94.58 Gel Time: 24 Hours; Hard Ringing Gel The graphical results of a concentration study where sodium silicate is varied from 0.57 to 4.0 over the range of initiator concentrations from 1.8 to 3.3 weight percent and at constant PAM concentration of 0.10 wt. % are shown in Figure 1.

6 [SPE 113490]
Generally, the lower concentrations of SPI components and particularly the lower concentration of sodium silicate relate to longer gel times and weaker gels. At these low concentrations, the gels result in a lower quality fit of a power algorithmic law pattern. This is largely due to increased error in establishing an exact gel time since the rate of viscosity increase is slower. Contrast this data with the higher SPI concentrations correlating to a shorter gel time and firmer ringing gel. The power law relationship provided higher R2 values for the algorithms and makes more logical sense than an exponential or logarithmic fit both of which intercepted the x or y axis.
Figure 1. Initator Concentration vs Gel Time at [Poly] = 0.10%.
Silicate=4.0%, Poly=0.10f(x)=120.12049*x (-1.8914059); R²=0.9558Silicate=3.0%; Poly=0.10%f(x)=124.76553*x (-1.7272324); R²=0.936Silicate=2.00%, Poly=0.10%f(x)=118.66076*x (-1.3770467); R²=0.9801Silicate=1.0%; Poly=0.10%f(x)=99.891388*x (-0.90669755); R²=0.6816Silicate = 0.57%, Poly=0.10% No Correlation
1 2 3 4 5 6
10
20
30
40
50
60
70
Gel Time, Hours
Initiator Concentration, Weight Percent This pattern of curves is unique showing dependentcy on the concentrations of the silicate and the initiator. The curves may suggest there is an optimum ratio of the sodium silicate to initiator concentration. The concentration of polymer is independent, although at lowest polymer concentration, the gels were of slightly poorer quality. The graphical dependence on polymer concentration is not shown, although for the most part they are constant relationships outside of the lower concentrations of the silicate and the initiator. Most of the R2 values are above 0.95 suggesting a very good data fit. Pressure Extrusion Tests Early pressure extrusion tests were performed to provide a measure of gel strength of the SPI gels. These tests were compared to standard crosslinked polyacryalmide gels. The tests were performed in a heavy plastic cylinder fitted with screw caps on each end. Air pressure was used against a piston at the upper end to push the gel through a small 3/16 inch hole at the exit end whereby the gel was extruded. A piston in the upper end was fitted with an o-ring located inside the cylinder and a guide rod extending through a pressure tight hole in the cylinder cap that connects to the piston on one end. The piston moves freely in the cylinder. The 3/16 inch hole was plugged prior to filling with the pre-gelled solution. The cylinder was filled with the SPI gel components and left for 48 hours to form a hard rigid gel. After 48 hours, the cylinder was mounted with the 3/16 inch hole supported over a beaker to collect the extruded gel. The pressure inlet was connected to a source of compressed air. The pressure was slowly increased to the point whereby the piston started to push against the gelled system and extrude through the 3/16 inch hole. At that point, the pressure was held constant and recorded. The SPI gels were at 14.7 weight percent sodium silicate, 2.45 weight percent initiator and 0.18 weight percent polymer and the remainder water. The second gel was a standard polyacrylamide/CMC (0.30% PAM/0.7% CMC) blended gel at 10,000 ppm total polymer concentration crosslinked with Cr+3 ions as per a Phillips Petroleum19 patent using 0.15 weight percent sodium dichromate and 0.20 weight percent sodium bisulfite. In this particular test, the SPI system with comparable raw material cost to the standard polyacrylamidegel was stronger and more resistant to extrusion by a factor of 2.5 – 3 times as shown in Table 5.

7
Table 5. Gel Strength of SPI Gel Compared With Chromium Gel. Gel Type Pressure to Initiate Extrusion
Polyacrylamide-Cr 8 Polyacrylamide-Cr 7
SPI 25 SPI 20
Long-Term Aging of SPI Gels Two SPI gels with different initiators were placed in a 150oF static oven for accelerated oven aging on February 13, 2007. They were sealed in the standard screw cap jar. Unfortunately, the screw cap seal was not sufficiently tight enough to hold water and any other volatiles in the vessel at this temperature, thus tainting this data. Both gels shrank loosing approximately 55 weight percent water over a 7.5 year accelerated aging time. The gels shrank away from the jar wall into a consolidated, very firm gel. If the water loss from the container had not occurred, the results may be different. The tests will be repeated. Confirmation of Matrix Tests at University of Kansas Sample Preparation Amounts of lab water, salt solutions, polymer solution and sodium silicate solution were weighed into a vial. The solutions were mixed by shaking and the vial placed in a 40°C water bath for a minimum of one hour. Initiator was then weighed into the vials. The gelant vial was shaken well to mix and returned to the water bath. Total sample weight was about 30 grams. The samples were observed every eight hours or so to determine the formation of gel and gel quality by tilting the vial about 45° from the vertical. The samples were photographed and pH values were measured at about 1 week after mixing. Results Two series of samples were prepared. Series 1-9 were prepared without added chloride salts. Sodium silicate and initiator concentrations were varied about the original preferred formulation. The polymer concentration was 0.20 weight percent. Similar gel solutions were prepared with added concentrations of between 0.1 and 1.0 weight percent sodium chloride (NaCl) and between 0.01 to 0.10 weight percent calcium chloride (CaCl2) salts. The results are provided in Table 6. The polymer concentration was chosen to be 0.20 weight percent because previous experiments suggest polymer concentration is independent of gel time. Samples 1 and 2 appear to be the best candidates from the point of stoichiometry as they are firmer with low syneresis. The “best” samples had initiator concentration above 1.2 weight percent. The preferred initiator concentrations between 1.5 and 1.8 weight percent gave gel times between 70 and 48 hours, possibly a good range for Arbuckle treatments. Sample 1 (G710) only had 2% syneresis. Sample 9 (G63) had the lowest sodium silicate concentration (0.78%) and the most syneresis (20%). There is no trend with the level of syneresis with the initiator concentration. However, the silicate/initiator ratio was kept between 0.5 – 0.8 for the samples in Table 6 with the exception of Sample 9 (G63). The best formulations were mixed in a saline environment (Table 6, Samples G7 Series) by first adding increasing levels of NaCl, then CaCl2 and finally both salts together. Gel times decrease substantially as sodium chloride concentration approaches 1 percent. Syneresis increased to 10 weight percent with increased NaCl concentration. Low levels of divalent calcium ion did not reduce gel time as much and syneresis results were mixed, but calcium ion does significantly affect the gelation process. Immediate cloudiness appeared upon addition of sodium silicate solution to polymer/brine solutions containing CaCl2 concentrations of 0.04% and 0.08%. When both ions were introduced, the gel syneresed badly and it was very weak and unstable. As the gelation process proceeds, the solution pH decreased averaging 6.9 in Samples 1 – 9 (G710 – G61). These results in a saline environment may indicate that a fresh-water pre-flush is needed in field treatments to minimize mixing with the field brine. Once the gel is formed in fresh water, adding a saline solution on top of the gel has no deleterious effect. Table 6. Gelant Composition and Properties of Water Shutoff Systems. Sample No. (Test No.)
Sodium Silicate, %
Initiator, %
NaCl, % CaCl2, % Gel Time, hours*
Silicate/ Initiator Ratio
Syneresis, %
1 (G710) 1.10 1.75 0 0 48 0.63 1.7 2 G62 1.53 1.77 0 0 48 0.86 3.3 3 G66 0.99 1.53 0 0 70.8 0.65 5.0 4 G64 1.01 2.03 0 0 38.6 0.50 6.7
5 G65A 0.97 1.70 0 0 55.4 0.57 6.7 6 G610 0.98 1.8 0 0 48 0.57 6.7

8 [SPE 113490]
7 G61 1.00 1.8 0 0 48.1 0.56 10.0 8 G67 1.01 1.2 0 0 146.3 0.84 10.0 9 G63 0.78 1.77 0 0 55.4 0.44 20.0
10 G73 0.99 1.83 0.11 0 40.5 0.54 3.3 11 G72 1.02 1.8 0.50 0 15.5 0.57 3.3 12 G71 0.98 1.78 1.01 0 8.7 0.55 9.9 13 G76 0.97 1.73 0 0.008 48.8 0.56 1.7 14 G75 1.00 1.74 0 0.038 40.5 0.57 6.7 15 G74 1.02 1.78 0 0.075 33.3 0.57 3.3 16 G79 1.00 1.76 1.00 0.008 Syn/Broken 0.57 - 17 G78 1.06 1.79 1.01 0.038 Syn/Broken 0.59 - 18 G77 0.97 1.80 1.02 0.076 Syn/Broken 0.54 -
* Gel times were +/- 4 hours. Gel Time, Gel Quality, pH and Viscosity - University of Kansas Additional tests were conducted with the SPI gel system to determine gel time, gel quality, pH and viscosity values as a function of time. Initial runs of gelation under continuous shear were also conducted. Sample Preparation Lab water, polymer solution and sodium silicate solution were weighed into a 4 ounce jar. The solution was mixed by shaking prior to placing the jar in a 40°C water bath for a minimum of one hour. Initiator was then weighed into the jar. The gel solution was mixed again by shaking the jar well. Total sample weight was about 90 grams. Approximate 30 grams of the sample was poured into a 40 ml vial. The vial and jar were placed in the 40°C water bath. The samples were observed every 5 to 6 hours to determine the formation of gel and gel quality. The vials were handled carefully (not tilted) and were observed for cloudiness and expelled solvent after gelation (syneresis). The presence of gel was determined in the 4 ounce jars and the pH was determined in selected samples by inserting the pH electrode in the jar and swirling. Runs were conducted where the sample was continuously sheared during the gelation process. This was accomplished with a Bohlin rheometer equipped with a double gap geometry (DG 40/50). The rheometer was allowed to equilibrate at 40 °C for a couple of hours before use. Thirty ml of sample was placed in the DG 40/50 geometry immediately after mixing. About 1 ml of 5 cp oil was placed on top of the sample in each gap to reduce/eliminate sample evaporation. The sample was then continuously sheared and viscosity readings were recorded every three minutes. It is suspected that the initiator, being an organic liquid, could partition into the oil used to eliminate evaporation, reducing the sample concentration. The DG 40/50 was selected due to the low ratio of oil-to-sample volumes as compared to other available geometries. Results – In-Depth Water Conformance Systems Series 21 gels are for in-depth water conformance (WC) applications. Tests were conducted to determine the effect of the initiator and sodium silicate concentrations on gelation performance. Data on the composition, gel times, pH just before gelling, the level of syneresis and the Sodium Silicate/Initiator ratio for the G21 samples are presented in Table 7. The properties of pH and viscosity were followed for the samples with the starred numbers in Table 7 and plotted. A portion of the G21 samples were placed in 40 ml vials immediately after mixing. The vials were not tilted or otherwise disturbed until 11 days after mixing in order to determine the amount of expelled solvent (syneresis) and to photograph the samples. The amount of expelled solvent is given in Table 7 as a percentage. Although not measured, the percentage amount of syneresis in the 4oz bottles was greater as was the measured values in similar samples of the G6 Series reported earlier. This suggests that periodic, mild shear during gelation enhances syneresis of these typical WC systems. Table 7. Gel Composition and Properties of Water Conformance Systems. Sample No. Sodium
Silicate, % Initiator, % Gel Time,
hours pH at Gel
Time Syneresis,
% Silicate/
Initiator Ratio G21-1* 1.00 1.21 100 7.6 ~ 1.9 0.83 G21-2 1.00 1.39 82 - ~1.25 0.72 G21-3 1.00 1.60 58 - ~1.25 0.63 G21-4* 1.00 1.80 48 7.46 ~1.25 0.56 G21-5* 1.25 1.19 No Gel 8.93 - 1.05 G21-6 1.25 1.39 100 - ~1.25 0.90 G21-7 1.25 1.60 58 - <1.25 0.78

9
G21-8* 1.25 1.80 46 7.74 <1.25 0.69 G21-9* 1.50 1.19 No Gel 10.1 - 1.25 G21-10 1.50 1.40 230 - - 1.07 G21-11 1.50 1.59 100 - <1.25 0.94
G21-12* 1.50 1.80 46 8.13 <1.25 0.83 The gel times for the G6 data (Table 6) and the G21 data (Table 7) are plotted on in Figure 2. This is the same plot as shown in Figure 1 except the KU data has been added. The data overlap fairly well with excellent R2 values. The two KU lines are in the left x-y axis coordinates. Since they were run at slightly higher temperature than previous tests, one would expect that when corrected for temperature the data set would shift closer to the 1.0% silicate line located to the right.
Figure 2. Initator Concentration vs Gel Time at [Poly] = 0.10%.
Silicate=4.0%, Poly=0.10f(x)=120.12049*x (-1.8914059); R²=0.9558Silicate=3.0%; Poly=0.10%f(x)=124.76553*x (-1.7272324); R²=0.936Silicate=2.00%, Poly=0.10%f(x)=118.66076*x (-1.3770467); R²=0.9801Silicate=1.0%; Poly=0.10%f(x)=99.891388*x (-0.90669755); R²=0.6816G21 Series Silicate = 1.0%, Poly = 0.20%f(x)=147.08962*x (-1.9145638); R²=0.987G60 Series Silicate = 1.0%, Poly = 0.20%f(x)=223.36934*x (-2.5716841); R²=0.9908
1 2 3 4 5 6
10
20
30
40
50
60
70
Gel Time, Hours
Initiator Concentration, Weight Percent
The graphic results are shown in Figure 3 plot the pH as a function of time. The three samples containing 1.80% Initiator at sodium silicate concentrations of 1.0, 1.25 and 1.5 weight percent sodium silicate gelled at about 48 hours. Sample G-21-1 gelled at approximately 100 hours because the silicate/initator ratio of 0.83 was low in comparison to the two gels (G21-5 and G21-9). These gels had silicate/initiator ratios that were higher but the pH drop was not significant enough (pH at 9 – 10) to form a gel at these low concentrations of silicate and initiator. The pH values of samples with the same initiator concentration decreased slower with increased sodium silicate concentration. For samples containing 1.80% Initiator, pH values at the gel time were higher at higher sodium silicate concentrations, resulting in the similar gel times.
7
8
9
10
11
0 24 48 72 96Time (hours)
pH
120
G21-1
G21-4
G21-5
G21-8
G21-9
G21-12
gel times

10 [SPE 113490]
Figure 3 – pH Values as a Function of Time for Selected G21 Samples. The graphic results are shown in Figure 4 for the viscosity data in Table 7 as a function of time. Viscosity of the samples that gelled increased moderately before gelation and rapidly increased at the point of gelation. The viscosity was higher than 1000 cp, the highest value that can be measured on the viscometer. The viscosity increased slightly for the two samples that did not gel in the 120 hour time frame.
0
5
10
15
20
0 24 48 72 96 120Time (hours)
Vis
cosi
ty (c
p)
G21-1G21-4G21-5G21-8G21-9G21-12
Figure 4 – Viscosity as a Function of Time for Selected G21 Samples. Results – Casing Leak Systems Series 25 gel are for casing leak applications. Tests were conducted to determine the effect of initiator concentration on gelation performance of samples containing 3.0% sodium silicate and 0.10% polymer. Sample compositions and gel times are presented in Table 8. The polymer concentration for these samples was 0.10 weight percent. The short gel times for this series result in less precise values. Viscosity and pH values were measured for the G21-3 sample. The sample had a pH of about 10.2 at the gel time, a much higher pH value than for the WC samples described above. Table 8 – Gel Composition of SPI Systems for Casing Leak.
Sample No. Sodium Silicate, %
Initiator, % Gel Time, hours
pH at Gel Time
Silicate/ Initiator Ratio
G25-1 2.99 2.01 24.2 1.49 G25-2 2.99 2.20 10.1 1.36 G25-3 2.99 2.39 6.1 10.24 1.25 G25-4 3.00 2.62 6.1 1.15 G25-5 3.01 2.79 6.1 1.08
Viscosity as a function of time was measured for samples subjected to constant shearing conditions in the Bohlin rheometer. Compositions, shear rate and gel time for the runs are given in Table 9. Viscosity readings as a function of time are shown in Figure 5. Gel times were selected as the time when the viscosity reading increased above 10 cp due the erratic behavior above that reading. Table 9. Gel Composition of SPI Systems for Casing Leak – Steady Shear Tests. Sample No. Shear Rate,
(1/sec) Sodium Silicate, %
Initiator, % Gel Time, hours
G25-3 10 2.99 2.39 8.1 G32-1 100 3.00 2.40 9.0 G35-1 1 3.00 2.39 9.4 G37-1 10 2.99 2.40 8.7
Samples G35-1 and G37-1 were removed from the rheometer the following day and placed in vials for observation. Sample G35-1 was sheared for 15.4 hours and was removed shortly after the run was stopped. The sample was about 25% gel and 75% cloudy fluid. The sample was next observed after two days and the fluid portion had gelled and was still gelled 6 days later. This behavior after continuous shearing of the sample appears to be different than the syneresis behavior after mild, periodic shear of the WC samples. Therefore, at higher concentrations of SPI components, the gels may not be as shear

11
sensitive as the lower concentrations.
For unknown reasons, the experiment with Sample G37 was aborted due to excessive speed by the Bohlin software after 9.2 hours. The sample was removed about 9 hours later. The sample was completely gelled with less than 1 ml of solvent. No change in the sample was observed 6 days later. Samples G25 and G32 were not collected and observed after the constant shear experiments.
0
10
20
30
40
50
0 5 10 15 20Time (hours)
Vis
cosi
ty (c
p)
100/sec G32
10/sec G25-3
10/sec G37
1/sec G35
Figure 5 – Viscosity Readings as a Function of Time for Gel Containing 3.0% Sodium Silicate, 2.4% Initiator and 0.10% Polymer. Gel times for G21 samples containing 1.0% sodium silicate and 0.2% polymer are compared with similar G6 (Table 6) samples from earlier runs in Figure 6 as a function of the initiator concentration. Gel times are comparable and reproducible.
0
50
100
150
1.0 1.2 1.4 1.6 1.8 2.0 2.2
Initiator Concentration (%)
Gel
tim
e (h
ours
)
G6 Series
G21 Series
Figure 6 – Gel Time as a Function of Initiator Concentration for Samples Containing a Fixed 1.0% Sodium Silicate and 0.20% Polymer. Conclusions: The following conclusions were derived from the results of the different experiments:
1. Controlled gels with delayed gel time are made from the combination of sodium silicate, an initiator and a polyacrylamide. These new gels, known as SPI gels demonstrate a new type of silicate gel possessing more elasticity than earlier silicate gels. Initial testing suggests these gels can be designed for in-depth conformance control treatments and casing leak repair. Although a considerable amount of research effort has been directed at the SPI gels to determine the proper balance between the components, component concentrations, gel time, and the
12 [SPE 113490]
gel strengths, there is still a significant amount of research work to be completed before these systems are ready for commercial applications.
2. The gels solutions have the advantage of being pumped as a single stage treatment in contrast to the earlier silicate
gels that required alternate fluid stages to form a precipitate gel.
3. The SPI gels may be from a number of different initiators and polymers to fit the particular application. The polymers may be hydrolyzed or non-ionic polyacrylamide, polyacrylamide derivatives, cellulose derivatives, or biopolymer.
4. Weaker gels for conformance control are produced at a sodium silicate to initiator ratio of 0.5 – 1.10 producing a
pH in the range of 7 – 8 and a gel time in the range of 30 – 65 hours. Firm ringing gels for casing leak applications are produced at a silicate/initiator ratio of approximately 1.10 – 2.0 for a pH in the range of 8 – 10 and a gel time of 4 – 29 hours.
5. The gels have low initial viscosity and show a rapid increase in viscosity just before the gel forms.
6. At higher concentrations of SPI components, the stronger gels are not as shear sensitive as the weaker gels.
7. As the gel forms, the pH of the gel solution is reduced from 11 to 7 or 8.
8. The SPI gels are sensitive to higher brine concentrations and require a pre-flush.
9. Sand pack tests are required for the optimized formulations and long term stability testing is required for treatment
design. REFERENCES 1. Huang, C.G., Green, D.W., and Wilhite, G.P.: "An Experimental Study of the In-Situ Gelation of Chromium(III)-
Polyacrylamide Polymer in Porous Media," paper SPE/DOE 12638, SPE/DOE Fourth Symposium on Enhanced Oil Recovery, Tulsa, Apr. 15-18, 1984.
2. Hubbard, S., Roberts, L.J., and Sorbie, K.S.: "Experimental and Theoretical Investigation of Time-Setting Polymer Gels
In Porous Media,” paper SPE/DOE 14959, SPE/DOE Fifth Symposium on Enhanced Oil Recovery, Tulsa, Apr. 20-23, 1986.
3. Sydansk, A.D.: .”Acrylamide-Polymer/Chromium(III)-Carboxylate Gels for Near Wellbore Matrix Treatments,”
SPE/DOE 20214, SPE/DOE Seventh Symposium on Enhanced Oil Recovery in Tulsa, Apr. 22-25, 1990. 4. Moradi-Araghi, A., Bjornson, G., and Doe, P.H.: "Thermally Stable Gels for Near-Wellbore Permeability Contrast
Corrections,” SPE 18500, SPE International Symposium on Oilfield Chemistry Houston, Feb. 8-10,1989. 5. Mills, R.V.A., US Patent 1,421,706, July 4, 1922. 6. Gandon, L., US Patent 3,149,985, September 22, 1964. 7. McLaughlin, H.C. and Ramos, J., US Patent 3,435,899, April 1, 1969. 8. Smith, W.H., and Walters, E.F., US Patent 4,640,361, Febrary 3,1987. 9. Chatterji, J., Onan, D.D., and King, B.J., US Patent 6,059,035, May 9, 2000. 10. Krumrine, P.H. and Boyce, S.D., “Profile Modification and Water Control With Silica Gel-Based Systems,” SPE 13578,
SPE International Symposium on Oilfield and Geothermal Chemistry, Phoenix, April 9 – 11, 1985. 11. Wagner, O.R., Smith, L.R., Osborn, J.L., Patent US 3,656,550, April 18, 1972

13
12. Chou, S. I. and Bae, J.H., “Characterization of Silicate Gels for Profile Control,” Symposium on Enhanced Oil Recovery,” Presented before the Division of Petroleum Chemistry, Inc, 205th National Meeting, American Chemical Society, Denver March 28 – April 2, 1993.
13. Hessert, J.E., and Clampitt, R.L., Patent US 3,749,172, July 31,1973. 14. Clampitt, R.L. and Hessert, J.E., Patent US 3,727,687, April 17, 1973. 15. Gall, J.W., Patent US 3,762,476, October 2, 1973. 16. Clampitt, R.L. and Hessert, J.E., Patent US 3,785,437 January 15, 1974. 17. Mumallah, N.A. and Shioyama, T.K., Patent US 4,644,073, February 17, 1987. 18. Falk, D.O., Patent, US 4,688,639m August. 25, 1987. 19. Hessert, J.E. and Clampitt, R.L., US 4,043,921, August 23, 1977.
APPENDIX B
Summary of
SPI FIELD TESTS
Casing Repair Treatments
and
In-Depth Water Conformance Treatments

SPI Gel System Development 2-Feb-08
SWC & OCAST Projects Summary of Field Tests
Date Depth Well SPI Max PreTreatment Post Treatment LCM? CommentsTest Operator Well County State Range Treatment Type Formation SPI Gel Volume Press Rate/ Press Rate/ Press Success
Number Code Code dd/ mm/ yy feet Type Prod/ Inj/ SWD Name Formulation BBLs psi BPD/ psi gpm/ psi
1 A a Coal OK 30/05/07 586-606 Shut-off Old perfs Producer AAA 23.6 450 1131 / 395 shutoff No Yes gas zone below
2 B b Chautauqua KS 24/5/2007 18-60 Casing Repair Producer surface AAA 6.25 ?? shutoff No Yes very shallow
3 C c Creek OK 6/9/2007 1474-1497 in-depth Injector Bartlesville BBB 48 450 1600+ / 560 1600+ / 561 No unknown cum 48 bbls SPI
4 C c Creek OK 12/9/2007 1474-1497 in-depth Injector Bartlesville BBB 48 1600+ / 560 1600+ / 561 No unknown cum 96 bbls SPI
5 D d Payne OK 14/09/07 2116-2146 Casing Repair Producer Mississippi BBB 12.5 290 500 / 250 ??? No No too small, too little set time
6 D e Payne OK 14/09/07 1489-1546 Casing Repair Producer Mississippi BBB 6.25 290 720/ 200 ??? No No too small, too little set time
7 E f Osage OK 17/09/07 2092-2110 In-depth Injector Bartlesville BBB 50 400 900/ 320 800/ 320 No Yes
8 F g Okmulgee OK 18/09/07 500-600?? Casing Repair SWD BBB 6.25 100 600/ 250 failed press tst No not valid Prior 300psi treatment, unknown very shallow leak
9 E f Osage OK 21/09/07 2092-2110 In-depth Injector Bartlesville BBB 50 400 800/ 320 ???? No Yes cum 100 bbls SPI
10 G h Kay OK 02/10/07 1997-2246 Casing Repair Producer BBB 16 150 7000+/ 40 shut off No Yes held 1500 psi
11 G h Kay OK 04/10/07 3404 Casing Repair Producer BBB 0 0 1440/ 75 no treatment No not valid well problem
11a G h Kay OK 08/10/07 3404 Casing Repair Producer BBB 0 0 1440/ 150 no treatment No not valid bad water
12 C c Creek OK 10/10/07 1474-1497 In-depth Inejctor Bartlesville BBB 48 450 1600+ / 560 1600+ / 561 No unknown cum 144 bbls SPI
13 C c Creek OK 15/10/07 1474-1497 In-depth Injector Bartlesville BBB 48 500 1600+ / 560 1600+ / 561 No unknown cum 192 bbls SPI
14 E f Osage OK 17/10/07 2092-2110 In-depth Injector Bartlesville BBB 50 425 ????? ???? No Yes cum 150 bbls SPI
15 C c Creek OK 19/10/07 1474-1497 In-depth Injector Bartlesville CCC 48 475 1600+ / 560 1600+ / 561 No unknown cum 240 bbls SPI
16 E f Osage OK 23/10/07 2092-2110 In-depth Injector Bartlesville CCC 50 450 ???? ???? No Yes cum 200 bbls SPI
17 F g Okmulgee OK 24/10/07 500-600?? Casing Repair SWD CCC 20 90 no MIT failed press tst Yes not valid repeat treatment, unknown very shallow leak
18 G h Osage OK 20/12/07 1000-1500 Casing Repair Producer CCC 25 375 300 / 0 70 / 0 Yes Partial prior cement sq
19 G h Osage OK 27/12/07 1000-1500 Casing Repair Producer CCC 25 300 70 / 0 50/ 0 Yes Partial repeat, cum 50 bbls SPI, prior cement sq
20 G h Osage OK ????? 1000-1500 Casing Repair Producer DDD 46 300 50/ 0 unknown yes Partial repeat, cum 96 bbls SPI, prior cmt sq

APPENDIX C
University of Kansas
Tertiary Oil Recovery Projects

Preliminary Report
On SPI Gels

Performance of SPI Gel System Impact Technologies, LLC 19 Sept. 2007 Report Flow Experiments I The objectives of the flow experiments are to determine the amount of permeability reduction in a sandpack produced by treatments with SPI gel systems, to determine the persistence of the permeability reduction and to compare the performance of SPI gel systems with that of a polyacrylamide-chromium acetate gel system. The gel systems were prepared and quickly flowed through the sandpack, the pack was shut-in to allow the system to gel and then water or brine was injected to determine the permeability of the treated pack over time. The SPI gel system is composed of sodium silicate, propylene glycol monomethyl ether acetate (PGMEA) and polyacrylamide. Sodium silicate solutions have high pH values to avoid precipitation/ gelation. The pH of the gelant is reduced as PGMEA hydrolyzes which causes the sodium silicate to gel. Polyacrylamide stabilizes the gel by making it more elastic and may also reduce the amount of syneresis. Experimental Details Gel systems. SPI gel systems are aqueous solutions of sodium silicate (N Clear, PQ Corp.,37.85% solution, free sample), propylene glycol monomethyl ether acetate (PGMEA; DOWANOL PMA, Dow Chemical, ≥99% purity, purchased from Aldrich) and polyacrylamide (Super Floc N300 HMW and Super Floc N300 LMW; Kemira, obtained from Lyle Burns). Sodium silicate and PGMEA were used as obtained. Aqueous stock solutions of both polymers were prepared at concentrations of 0.500%. Water was stirred at sufficient speed with a magnetic stir bar to produce a deep vortex. Polymer granules were dropped onto the shoulder of vortex to individually wet each granule. The mixture was stirred at a slow speed over night. A few “fish eyes” were observed so the solutions were filtered through a 12 µm screen filter. Filtration did not significantly change the viscosity. Equal amounts of each polymer solution were used to prepare gelants. Purified laboratory water (18 mΩ) was used for all preparations. SPI gelants were prepared by first mixing well appropriate amounts of water, polymer solutions and sodium silicate solution. PGMEA was added last and the solution well mixed by swirling and shaking the container. Gelants were prepared at room temperature for the flow experiments and then quickly injected into sandpacks maintained at 40°C by a water bath. Stock polymer and chromium acetate solutions were combined at a 3:1 weight ratio and stirred with a magnetic stirrer to prepare the polyacrylamide-chromium gelant. The polymer solution contained 0.6666% Alcoflood 935 polyacrylamide (Ciba, Lot # A2287BOV), 1.33% KCl and 0.00135% NaN3 (bactericide) and was prepared and filtered as described above. A stock chromium acetate solution was prepared from a 50% chromium acetate solution (McGean) just prior to mixing with the polymer solution. The stock solution contained 0.040% chromium.

Concentrations of components in the gelants are given in Table 1. The polyacrylamide-chromium gelant is a typical formulation (except for the biocide) for treatments in the Arbuckle formation in Kansas. Table 1 – Concentration of components in gelants. Run
Sodium silicate (wt.%)
PGMEA (wt.%)
Polyacrylamide (wt.%)
Chromium(wt%)
KCl (wt%)
Gel time (hours)
SP1 1.25 1.60 0.20 - - 59 SP2 0.50 0.0102 1.0 5.1 SP3 3.00 2.40 0.10 - - 8.7 Sandpacks. Sandpack holders were fabricated from acrylic or PVC tubing and stock. The packed volume was 1.5 inches in diameter and one foot long. Pressure ports along the length divided the pack into six 2-inch long sections. Sections were labeled 1 through 6 starting from the injection end. Pressure drops across the sections and the total length were measured with transducers and recorded by data-acquisition systems. Endplates on the pack were grooved to provide radial distribution of fluids from the centered inlet fitting and an O-ring provided the seal to the tube. Fine and course screens were placed adjacent to the endplates. Ottawa F-110 unground, ASTM-Graded silica sand (U.S. Silica) was the primary medium in the middle 10-inch length of the pack. Course silica sand (Ottawa 20-30 mesh, Fisher Scientific) was packed in approximately 1-inch length next to the screens at each end of the pack. Both sands were soaked in concentrated hydrochloric acid overnight and then rinsed with copious amounts of water. Dry sands were packed manually in the holder using a vibrator. The pack was saturated with water and water was flowed through the pack at high flow rates while using a vibrator to pack the wet sand. Additional amounts of the course sand were added to the inlet as needed to eliminate void space that developed. A tracer run was conducted to determine the pore volume of the sandpack. A 1% KNO3 solution was injected to displace the resident water. KNO3 concentration in the effluent was measured using an inline UV detector at a wavelength of 302 nm. Flow rate was measured using a balance. Integration of the normalized concentration as a function of grams of fluid produced from the pack gives the pore volume in grams of water which is converted to milliliters. Permeabilities of each section and for the overall length of the pack were determined by measuring pressure drops across the sections and the effluent flow rate using a balance. Tracer and permeability runs were conducted at room temperature. Permeabilities and pore volumes are listed in Table 2. Table 2 – Permeabilities of various sections and pore volumes of sandpacks.
Permeability (Darcy) Section(s) #
Pore volume
Run 1 2 3 4 5 6 2-5 Total (mL) SP1 8.64 5.68 4.98 4.72 5.24 8.05 5.16 5.88 125.9 SP2 7.33 5.60 6.04 5.18 5.99 10.53 5.70 6.54 119.8 SP3 11.54 7.12 8.01 8.17 9.28 12.03 8.15 9.43 136.3
2

Flow Experiments. A schematic of the equipment to conduct flow experiments is shown in Figure 1. The sandpack was connected to the pressure transducers and was submerged in a 40°C water bath. Gelant was prepared at room temperature and was placed in a transfer cylinder. Gelant was injected into the pack by pumping oil into the top of the transfer cylinder. About two pore volumes of gelant were injected into the sandpacks. Effluent fractions were collected in vials using an automated fraction collector. Effluent fractions were weighed and the pH and viscosity of most of the samples were measured as soon as possible after collection. Viscosity and pH of the injected gelant and selected effluent samples were periodically measured until the samples gelled. The samples were kept in a 40°C water bath. Viscosity was measured at 25°C. Pressure drops across the sections and the overall length of the pack were recorded.
∆ p ∆ p∆ p ∆ p ∆ p∆ p
∆ p
FractionspH,
viscosity, flow rate
Oil Pump
Gel
ant
Water Pump
pressure transducers
Section1 2 3 4 5 6
40°C water bath
transfercylinder
Figure 1 – Schematic of setup for flow experiments. The packs were shut in for time periods that were several times the bulk gel time. Water (brine for SP2) was then injected at a constant inlet pressure and the pressure drops across the sections were monitored. Pressure drop data are sometimes displayed as apparent viscosities or residual resistance factors (RRF). Apparent viscosity is the viscosity calculated by Darcy’s Law using the pressure drop, flow rate, initial permeability and section dimensions. Flow resistances are easily compared when calculated in apparent viscosity units. RRFs are the factor by which water permeability has been reduced by the gel treatment and is calculated by dividing the initial permeability by the water permeability after the treatment.
3

Results Experiment SP1. The SPI gel system contained 1.25% sodium silicate, 1.6 % PGMEA and 0.2% polymer. This system is being tested for water shutoff applications. The bulk gel time is 58 hrs. Flow resistance in sandpack SP1 during injection of 2.07 pore volumes of gelant is shown in Fig. 2. The initial apparent viscosities of each section are about the viscosity of water at 40°C (0.65cp). Apparent viscosity increases to about 4 cp as the gelant efficiently displaces water from each section. After water was displaced from Section 1, the flow resistance continued to increase indicating retention of gelant material at the front of, or within, that section. There are also slight increases in resistances in the other sections during gelant flow. The pH, viscosity and flow rate measured on effluent fractions during gelant injection are shown in Fig. 3. Both the pH and viscosity increased when the gelant was produced from the sandpack after one pore volume was injected. Viscosity of the effluent during production of gelant is comparable to the apparent viscosity measured during gelant flow in the downstream sections of the pack. Sample 11, plotted at 1.03 PVI in Figure 3, had a brown color as shown in Photo 1.Samples 11to 21 gelled.
Photo 1 – Effluent samples during gelant injection in SP1. Viscosity of effluent Fractions 14 and 18 and pH of Fractions 15 and 19 (which are indicated by the larger data symbols in Fig. 3) were monitored with time and are shown in Figures 4 and 5, respectively. Viscosity and pH of a sample of the injected gelant are also shown in the figures. Time was measured from the time the gelant was mixed. The viscosities of the samples coincided and were greater than 1000cp at 62.8 hours resulting in gel times of 58±4 hours. The same gel time was determined for the same system during bottle testing. The pH values also coincided and were between values for samples that were monitored during bottle tests which contained slightly higher and lower PGMEA concentrations. Flow of gelant through the sandpack did not affect the gelation performance of the gelant. The sandpack was shut-in for five days. Water at 10 psig was applied to the inlet to determine flow resistances in the pack. Pressure drops and the flow rate of water through the pack are shown in Figure 6. The overall pressure drop decreased from 10 psi three times during the first 24 hours. It was determined in later experiments that the decreases were the result of a sealed effluent vial. Pressure in the vial increased as it filled with effluent causing the overall pressure to decrease even though the injected water was maintained at 10 psig. After the first day, the
4

pressure droop across the pack was maintained close to 10 psi for the next four days. During this time period, the flow rate increased and then rose rapidly at about 110 hours. Thereafter, water was injected at a constant flow rate of 1 mL/minute and then 0.5 mL/minute and the pressure drop decreased with time. Permeability of the sandpack and the residual resistance factor (RRF) during water injection are shown in Figure 7. Permeability of the pack increased sharply at 110 hours. This increase coincides with a zone of higher flow resistance that propagated through the pack as shown by the pressure drops in Section 4, 5 and 6 in Figure 6. Viscosity and pH of the effluent samples are shown in Figure 8. The total amount of fluid in terms of pore volumes is also plotted in Figure 8. The initial viscosity of the effluent was comparable to the initial viscosity of the gelant and to the viscosity of a polymer solution at the same concentration. The trend of the effluent viscosity does not correlate with the zone of higher flow resistance that was observed in the pressure data.
0.0 0.5 1.0 1.5 2.0
0
5
10
15
20
25
0 10 20 30 40 5
Pore volumes injected
App
aren
t Vis
cosi
ty (c
p)
Time (min)
0
Overall
Section 1
Section 2
Section 3
Section 4
Section 5
Section 6
Figure 2 – Flow resistance during gelant injection in SP1.
5

0
2
4
6
8
10
12
0.0 0.5 1.0 1.5 2.0
Vis
cosi
ty (c
p)
Pore Volumes Injected
pH
Flow rate
Viscosity
Figure 3 – Effluent properties during gelant injection in SP1.
0
2
4
6
8
10
0 24 48
Vis
cosi
ty (c
p)
Time (hours)
72
Injected sample
Ef f . Fraction #14
Ef f l. Fraction #18
Figure 4 – Viscosity data to determine gel time of samples from SP1.
6
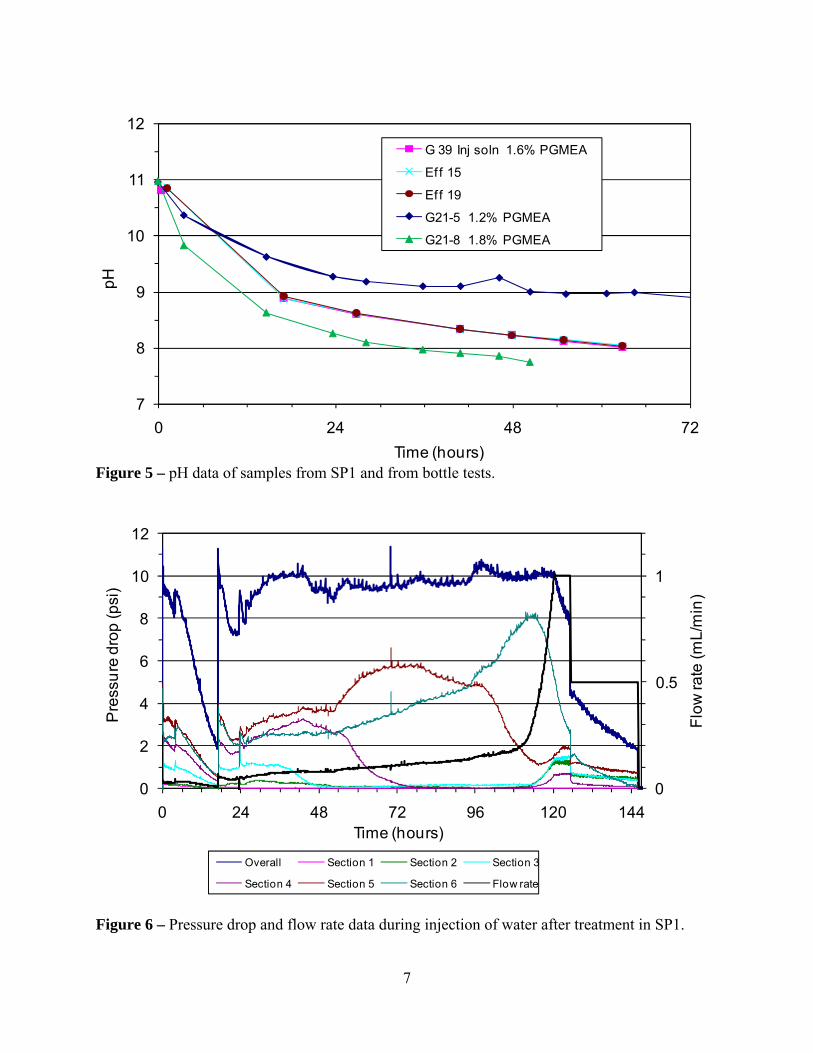
7
8
9
10
11
12
0 24 48
pH
Time (hours)72
G 39 Inj soln 1.6% PGMEA
Eff 15
Eff 19
G21-5 1.2% PGMEA
G21-8 1.8% PGMEA
Figure 5 – pH data of samples from SP1 and from bottle tests.
0
0.5
1
0
2
4
6
8
10
12
0 24 48 72 96 120 144
Flow
rate
(mL/
min
)
Pre
ssur
e dr
op (p
si)
Time (hours)
Overall Section 1 Section 2 Section 3
Section 4 Section 5 Section 6 Flow rate
Figure 6 – Pressure drop and flow rate data during injection of water after treatment in SP1.
7
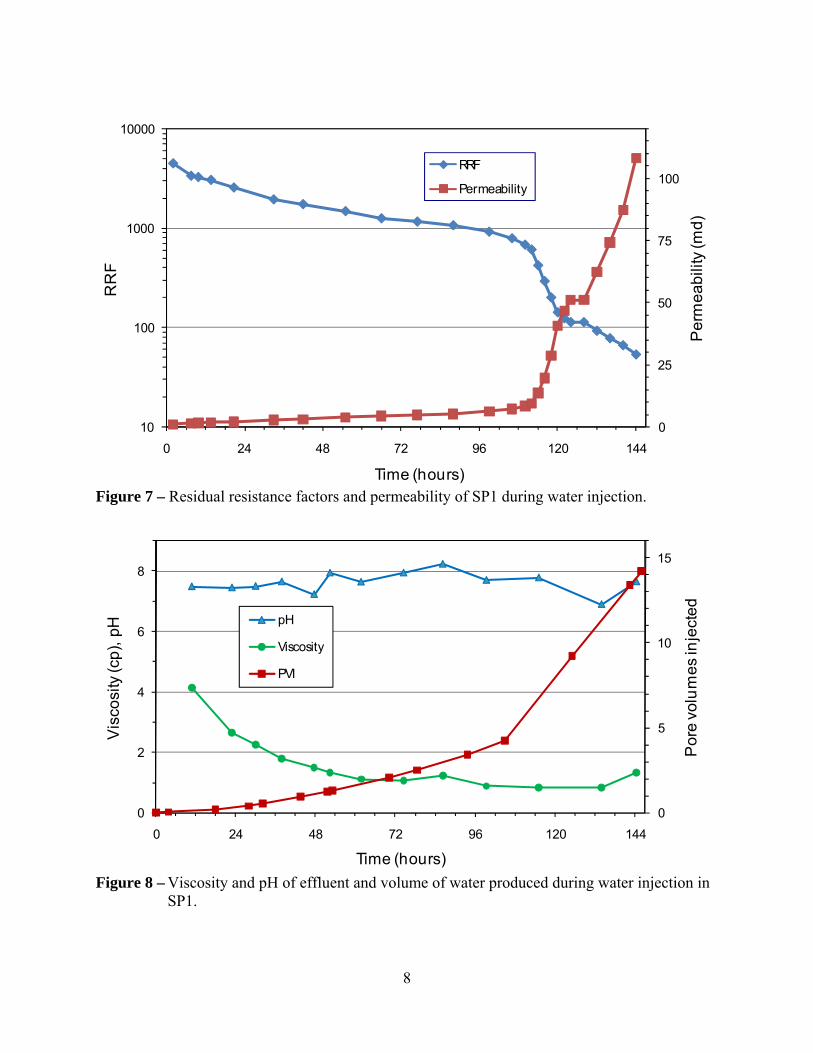
0
25
50
75
100
10
100
1000
10000
0 24 48 72 96 120 144
Per
mea
bilit
y (m
d)
RR
F
Time (hours)
RRF
Permeability
Figure 7 – Residual resistance factors and permeability of SP1 during water injection.
0
5
10
15
0
2
4
6
8
0 24 48 72 96 120 144
Por
e vo
lum
es in
ject
ed
Vis
cosi
ty (c
p), p
H
Time (hours)
pH
Viscosity
PVI
Figure 8 – Viscosity and pH of effluent and volume of water produced during water injection in
SP1.
8
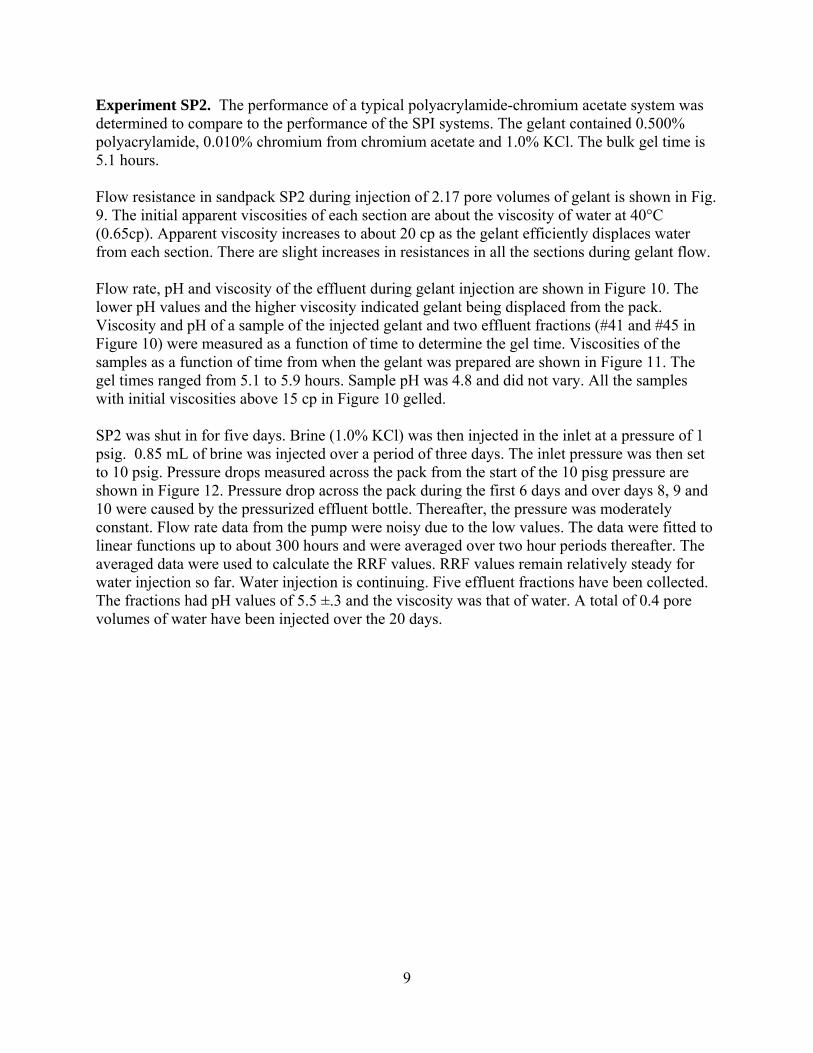
Experiment SP2. The performance of a typical polyacrylamide-chromium acetate system was determined to compare to the performance of the SPI systems. The gelant contained 0.500% polyacrylamide, 0.010% chromium from chromium acetate and 1.0% KCl. The bulk gel time is 5.1 hours. Flow resistance in sandpack SP2 during injection of 2.17 pore volumes of gelant is shown in Fig. 9. The initial apparent viscosities of each section are about the viscosity of water at 40°C (0.65cp). Apparent viscosity increases to about 20 cp as the gelant efficiently displaces water from each section. There are slight increases in resistances in all the sections during gelant flow. Flow rate, pH and viscosity of the effluent during gelant injection are shown in Figure 10. The lower pH values and the higher viscosity indicated gelant being displaced from the pack. Viscosity and pH of a sample of the injected gelant and two effluent fractions (#41 and #45 in Figure 10) were measured as a function of time to determine the gel time. Viscosities of the samples as a function of time from when the gelant was prepared are shown in Figure 11. The gel times ranged from 5.1 to 5.9 hours. Sample pH was 4.8 and did not vary. All the samples with initial viscosities above 15 cp in Figure 10 gelled. SP2 was shut in for five days. Brine (1.0% KCl) was then injected in the inlet at a pressure of 1 psig. 0.85 mL of brine was injected over a period of three days. The inlet pressure was then set to 10 psig. Pressure drops measured across the pack from the start of the 10 pisg pressure are shown in Figure 12. Pressure drop across the pack during the first 6 days and over days 8, 9 and 10 were caused by the pressurized effluent bottle. Thereafter, the pressure was moderately constant. Flow rate data from the pump were noisy due to the low values. The data were fitted to linear functions up to about 300 hours and were averaged over two hour periods thereafter. The averaged data were used to calculate the RRF values. RRF values remain relatively steady for water injection so far. Water injection is continuing. Five effluent fractions have been collected. The fractions had pH values of 5.5 ±.3 and the viscosity was that of water. A total of 0.4 pore volumes of water have been injected over the 20 days.
9

Figure 9 – Flow resistance during gelant injection in SP2.
4
5
6
7
8
9
0
5
10
15
20
0.0 0.5 1.0 1.5 2.0 2.5
pH o
r Flo
w ra
te (g
/min
)
Vis
cosi
ty (c
p)
Pore Volumes Injected
Viscosity
pH
Flow rate
#41 #45
Figure 10 – Viscosity, pH and flow rate of effluent during gelant injection in SP2.
10

0
10
20
30
0 2 4 6 8
Vis
cosi
ty (c
p)
Time (hours)
Injected gelant
Ef f luent sample 41
Ef f lulent sample 45
Figure 11 – Viscosity data to determine gel time of samples from SP2.
Figure 12 – Pressure drops, flow rate and residual resistance factor of Sections 2-5 during brine
injection in SP2.
11

Experiment SP3. The SPI gel system contained 3.0% sodium silicate, 2.4 % PGMEA and 0.1% polymer. This system is being tested for repair of casing leaks and possibly for water shutoff applications. The bulk gel time is 8.7 hrs. Flow resistance in Sandpack SP3 during injection of 1.88 pore volumes of gelant is shown in Figures 13 and 14. Pressure drop across Section 1 increased continually and reached 27 psi at the end of gelant injection. The pressure range of the transducers for Section 1 and the overall length was 10 psi and that pressure was exceeded at about the 18 minute mark. A 20 psig pressure was connected to the downstream leg of the overall pressure transducer at 32 minutes in order to measure the overall pressure drop which allowed the calculation of the pressure drop across Section 1. The continuous development of flow resistance in Section 1 shows the injectivity of this system in to porous matrix is limited. The over ranged transducers resulted in noisy data for the other sections. Data spikes for Sections 2-6 were removed resulting in the segmented lines in Figure 14. Initial apparent viscosities of each section are about the viscosity of water at 40°C (0.65 cp). Apparent viscosities of Sections 2-6 increased to levels between 2.5 and 4.5 cp as the gelant efficiently displaced water from each section. The steady apparent viscosity during gelant flow decreased down the pack and leveled out at about 2.6 cp in Sections 4, 5 and 6. Viscosity, pH and flow rate measured on effluent fractions during gelant injection are shown in Fig. 15. Both the pH and viscosity increased when the gelant was produced from the sandpack after one pore volume was injected. Viscosity of the effluent during production of gelant is comparable to the apparent viscosity measured during gelant flow in Sections 3, 4 and 5 in Figure 14. Viscosity and pH were measured with time until gelation for a sample of the injected gelant and effluent samples 14 and 17 (marked in Figure 15). Viscosity of the samples increased moderately up to about 8.5 hours afterwhich the viscosity could not be measured (> 1000cp) as shown in Figure 16. The gel time for the injected gelant was 8.7 hours and the effuent samples gelled at 8.2 and 8.8 hours. Measured pH values decresed with time and the samples gelled when the pH was about 10.4 as shown in Figure 17. Samples 9, 10 and 11had brown tints as shown in Photo 2. Samples 11 through 18 gelled.
Photo 2 – Effluent samples during gelant injection in sanpack SP3. Sandpack SP3 was shut-in for three days. Water was then injected at a pressure of 10 psig. The pressure drop across the core decreased to about 4 psi during the first three days due to
12

pressurization of the effluent vial. The pressure drop thereafter remained at about 10 psi. The RRF has generally remained at high levels between 20,000 and 32,000 for 17 days. Inspection of the pressure drops across the sections show the highest flow resistance initially in Section 1 which decreased to low values at 240 hours. Section 2 then showed the highest flow resistance and it also decreased to low values at 360 hours. This behavior is similar to the high flow resistance zone that was observed to flow throught Sections 3, 4 and 5 in SP1. When the high flow resistance zone exited the pack in SP1, the RRF values decreased significantly. SP3 should be continued to see if the high flow resistance zone continues to flow through the pack. The injection pressure, flow rate and volume of water injected that are measured by the pump are shown in Figure 19. The flow rate data are noisy due to the very low values. The flow rate was averaged over longer time periods and these values were used to calculate RRFs. Seven effluent fractions were collected and the cumulative volume produced is shown in Figure 19 and the flow rate, pH and viscosity of the fractions are shown in Figure 20. The pH remains elevated at values above 10 and the viscosity values are above those for water indicating production of polymer and/or precipitated silicates. Polymer production is more probable since the samples are clear.
0
100
200
300
400
0 10 20 30 4
App
aren
t vis
cosi
ty (c
p)
Time (minutes)0
Section 1
Overall
Figure 13 – Flow resistance in the sandpack and in Section 1 during gelant injection in SP3.
13

Figure 14 – Flow resistances in each section during gelant injection in SP3.
0
2
4
6
8
10
12
0 10 20 30 4
Visc
osity
(cp)
, pH,
Flo
w ra
te (g
/min
)
Time (minutes)0
Flow rate (g/min)
pH
Viscosity (cp)
#17#14#9 #10 #11
Figure 15 - Viscosity, pH and flow rate of effluent during gelant injection in SP3.
14

Figure 16 – Vicosity data to determine gel time for samples from SP3.
Figure 17 - pH data of samples from SP3.
15

Figure 18 – Pressure drops and residual resistance factor for Section 2-5 during water injection after gel treatment in SP3.
0.0
0.5
1.0
1.5
0
5
10
15
20
25
30
0 48 96 144 192 240 288 336 384 432
Inj.
or p
rod.
vol
ume
(por
e vo
lum
es)
Flow
rate
(mL/
day)
, Pre
ssur
e (p
sia)
Time (hours)
Flow ratePressureFR avg.Injected volumeProduced volume
Figure 19 – Measured and averaged flow rates, pump pressure, and injected and produced volumes during water injection in SP3.
16

0
5
10
15
0.0 0.2 0.4 0.6 0.8 1.0 1
Vis
cosi
ty (c
p), p
H, F
low
rate
(mL/
day)
Pore volumes injected
.2
Flow rate
pH
Viscosity
Figure 20 – Viscosity, pH and flow rate of effluent samples collected during water injection in
SP3. Discussion and Plans Main points:
• Limited injectivity of 3.0% sodium silicate gelant. • Deterioration of flow resistance in SP1 and possibly in SP2.
17

APPENDIX D
Selected Pictures
of
SPI Field Treatments and
Equipment