novel online monitoring and alert system for anaerobic digestion reactors
TRANSCRIPT

Published: September 14, 2011
r 2011 American Chemical Society 9093 dx.doi.org/10.1021/es202245f | Environ. Sci. Technol. 2011, 45, 9093–9100
ARTICLE
pubs.acs.org/est
Novel Online Monitoring and Alert System for Anaerobic DigestionReactorsFang Dong,† Quan-Bao Zhao,† Wen-Wei Li,*,† Guo-Ping Sheng,† Jin-Bao Zhao,† Yong Tang,† Han-Qing Yu,*,†
Kengo Kubota,‡ Yu-You Li,‡ and Hideki Harada‡
†Department of Chemistry, University of Science and Technology of China, Hefei, 230026 China‡Department of Civil Engineering, Tohoku University, Sendai 980-8579, Japazn
bS Supporting Information
’ INTRODUCTION
Anaerobic digestion (AD) processes are sensitive to environ-mental fluctuations and frequently suffer from operation instabil-ity. Thus, real-time monitoring and robust control of AD proces-ses are essential to avoid possible instability due to disturbance.For this purpose, intensive studies have focused on fast, reliable,and online monitoring of AD processes as well as the develop-ment of efficient feedback alert and control strategies.1 A numberof indexes have been frequently adopted in the process monitor-ing, including volatile fatty acids (VFAs), pH, redox potential,biogas production rate, and composition. Compared with theeasy-to-measure parameters like pH and redox potential, VFAand biogas production are widely considered as the two mostcrucial and direct indicators of the system status.2,3 In a normallyoperating AD system, VFAs produced by acidogens and aceto-gens can be immediately utilized by the methanogens formethane production, leaving a low VFA concentration.4 Thus,the VFA accumulation is usually interpreted as the result ofmethanogenesis inhibition or organic overloading, and implies arisk of process upset.5 However, VFA alone is insufficient toreveal the overall reactor status. In this context, the biogascomposition and production rate can also provide usefulinformation.6,7 Therefore, a combined detection of both liquid-and gas-phase parameters is considered as an efficient strategy toprovide comprehensive insight into an AD process.8�10
A variety of techniques for online monitoring of VFAsare available, such as fluorescence spectroscopy,11,12 near-infrared(NIR) spectroscopy,13 titration,14 and gas chromatography.15,16
Among them, titration is the most practical option, attributed toits high simplicity, rapidness, and cost-effectiveness.14,17�19 Onthe other hand, NIR spectroscopy technique is gaining a greatpopularity for online monitoring of gas-phase parameters.20
Thus, incorporating titration and NIR spectroscopy techniquesmight offer a relatively simple way to achieve a comprehensiveand accurate monitoring of AD process.
In addition to parameter detection, effective analysis of theobtained data is of equal importance for reactor status evaluationand diagnosis. Because of the high complexity of AD systems andthe unclear interrelations of many involved parameters, it isdifficult to extract useful “hidden” information from the largedata sets of individual parameters and to find out the truesituation as well as potential risks. For AD process evaluationor diagnosis, a common practice is to set threshold values forsome individual indicators like pH and VFA, and to judge thereactor status on the basis of the detected values.8,21�23However,such an evaluation is usually inaccurate, because information
Received: June 30, 2011Accepted: September 14, 2011Revised: September 11, 2011
ABSTRACT: Effective monitoring and diagnosis of anaerobic digestion pro-cesses is a great challenge for anaerobic digestion reactors, which limits theirstable operation. In this work, an online monitoring and alert system for upflowanaerobic sludge blanket (UASB) reactors is developed on the basis of a set ofnovel evaluating indexes. The two indexes, i.e., stability index S and auxiliaryindex a, which incorporate both gas- and liquid-phase parameters for UASB,enable a quantitative and comprehensive evaluation of reactor status. A series ofshock tests is conducted to evaluate the response of the monitoring and alertsystem to organic overloading, hydraulic, temperature, and toxicant shocks. Theresults show that this system enables an accurate and rapid monitoring anddiagnosis of the reactor status, and offers reliable early warnings on the potentialrisks. As the core of this system, the evaluating indexes are demonstrated to be ofhigh accuracy and sensitivity in process evaluation and good adaptability to theartificial intelligence and automated control apparatus. This onlinemonitoring and alert system presents a valuable effort to promotethe automated monitoring and control of anaerobic digestion process, and holds a high promise for application.

9094 dx.doi.org/10.1021/es202245f |Environ. Sci. Technol. 2011, 45, 9093–9100
Environmental Science & Technology ARTICLE
about the relationship between the individual parameters and thereactor status is still lacking and thus such an evaluation reliesheavily on the professional knowledge and experiences ofoperators. Moreover, these parameters can only reveal thecurrent reactor status, but it is actually, in most cases, too latefor an effective process control once the threshold values arereached. Indeed, no effective method for AD reactor diagnosis andrisk prediction is currently available. As such, it is imperative topropose and apply objective indexes for AD reactor diagnosis. Suchindexes should be ideally accurate and sensitive to environmentalfluctuations, reveal the change dynamics of reactor status, and beadaptive to online monitoring, autoalert, and control systems.
In this work, an effective online monitoring and alert system isdeveloped for an upflow anaerobic sludge blanket (UASB)reactor. Particularly, two new evaluating indexes, stability indexS and auxiliary index a, are proposed for a quantitative assessmentof reactor status, which for the first time take into account thechanging dynamics of both liquid- and gas-phase parameters ofUASB reactors. On the basis of a comprehensive investigationinto the relationship between the indexes and reactor perfor-mance, a database of S and a under various disturbances isestablished to offer a foundation for online diagnosis and earlywarning of AD process.
’MATERIALS AND METHODS
UASB Reactor andOnlineMonitoring andAlert System. Inthis work a bench-scale Plexiglas-made UASB reactor was used,which consisted of a reaction zone of 2.0 L and a gas�solidsseparator zone. The online monitoring system consisted of a gas-phase detection unit and a liquid-phase detection unit thatconnected to a computer through a data acquisition card (PCI-1602, ICPDASCo., China), as illustrated in Figure 1. The liquid-phase detection unit was comprised of an automatic sampleloading and ejecting device and an online titration device,controlled by computer through 485 serial ports. A precise meterpump (BT100-1F, Longer Co., China) was used as the sampleloading and ejecting device. The online titration device consistedof an inject pump (TJ-3A, Longer Co., China), a pH glass
electrode (LE409, Mettler Toledo Co., USA), and a titrationcell. A magnetic stirrer was used for the liquid mixing in thetitration cell. The gas-phase detection unit consisted of methaneand carbon dioxide sensors (AGM10 and AGM32, Onward Co.,China) and a gas flow measurement device for monitoring ofbiogas production rates.The software of alert system was designed on a LabView
virtual instrument platform (National Instruments Co.,USA),which incorporates multifunctions of data acquisition, analysis,recording, and display. Specifically, the indexes S and a profileswere calculated, recorded, and displayed real-time based on theLabView software.Experimental Operations. The seed sludge for the UASB
reactor was taken from an anaerobic digester in a local citrate-processing wastewater treatment plant. The pH and volatilesuspended solids (VSS) of seed sludge were 7.2 and 42.2 g/L,respectively. The reactor temperature was maintained at 35 (1 �C using a heating jacket, except during the temperature shocktesting period. The reactor was operated at a fixed loading rate of10 g/L chemical oxygen demand (COD) and 24-h hydraulicretention time (HRT) except as otherwise specified. Sucrose-richsynthetic wastewater was used as the feedstock, which contained3000 mg/L NaHCO3 as the buffer and sufficient amountof inorganic nutrients as follows (in mg/L): NH4HCO3, 405;K2HPO4 3 3H2O, 155; CaCl2, 50; MgCl2 3 6H2O, 100; FeCl2, 25;NaCl, 10; CoCl2 3 6H2O, 5; MnCl2 3 4H2O, 5; AlCl3, 2.5;(NH4)6Mo7O24, 15; H3BO3, 5; NiCl2 3 6H2O, 5; CuCl2 3 5H2O,5; and ZnCl2, 5.After the reactor reached a steady state in terms of COD
removal and methane production, four consecutive shock testswere conducted to investigate the response of the UASB reactorto various operating shocks, including organic overloading,hydraulic loading, temperature, and toxicant shocks (Table 1).The organic overloading shock was imposed by switching thefeed COD concentration to six fold while keeping the flow rateunchanged. The hydraulic loading shock was provided byelevating the flow rate while accordingly reducing the feedCOD and bicarbonate concentrations to maintain a constantorganic loading rate (OLR). The temperature shock wasachieved by directly shifting the reactor temperature from 37to 5 �C. For the toxicant shock, toxicants that need a relativelyhigh concentration to induce significant toxic effect, e.g., formaldehyde,
Figure 1. Schematic of online monitoring and alert system for a UASBreactor (dotted lines: data; solid lines: liquid or gas pipes).
Table 1. Operation Conditions for Shock Tests
test duration operation condition
6-fold organic overload shock 24 h influent COD of 60 000 mg/L
influent NaHCO3 of 3000 mg/L
HRT of 24 h
5 �C temperature shock 96 h influent COD of 10 000 mg/L
influent NaHCO3 of 3000 mg/L
HRT of 24 h
temperature of 5 �C6-fold hydraulic shock 24 h influent COD of 1667 mg/L
influent NaHCO3 of 500 mg/L
HRT of 4 h
toxicant shock slug dose influent COD of 10 000 mg/L
influent NaHCO3 of 3000 mg/L
HRT of 24 h
chloroform dosage of 80 mg/L
9095 dx.doi.org/10.1021/es202245f |Environ. Sci. Technol. 2011, 45, 9093–9100
Environmental Science & Technology ARTICLE
and surfactant, which shows chronic toxicity,24 were not chosenhere in order to avoid OLR interference.25 In this study,chloroform was selected as the toxicant, because of its signifi-cant toxic effect on anaerobic microorganisms even at a very lowlevel.26 The toxicant shock was imposed through slug dose ofchloroform at 80 mg/L.An interval of over two months was adopted between every
two shock tests to ensure a stable operation before anothershocking test. The variations of the gas- and liquid-phase para-meters during the entire test period were measured online andthe indexes S and a were calculated.Monitoring and Analysis. The VFA concentration and pH
were measured online using the liquid-phase detection unit withfive-point titration technique.19 The volume and composition ofmethane and carbon dioxide were detected online by the gas-phase detection unit. All detections were conducted once perhour except during the temperature shock test, in which a 4-hmeasurement frequency was adopted. The pH electrode andtitration cell were cleaned or washed regularly to prevent possiblefouling. The monitoring data were collected by the data acquisi-tion card and real-time recorded by computer. VSS and CODconcentrations were measured according to the StandardMethods.27
Evaluating Indexes. Two evaluating indexes are proposedhere for reactor status evaluation. The stability index S is used todescribe the VFA accumulation in the liquid phase, while theauxiliary index a is used to evaluate the variation trend of
methane production in the gas phase, as follows:
S ¼ 1QCH4
� dVFAdt
� 100 ð1Þ
a ¼ dQCH4
dtð2Þ
where (dVFA)/(dt) (mmol/L/h) is the change rate of total VFAconcentration at time t and QCH4
(mmolCH4/L/h) is methaneproduction rate (MPR).The signs of indexes also serve as useful signals for reactor state
evaluation. To benefit an automatic process diagnosis, a diag-nosis software based on the statistic analysis and logic judgmentprograms is designed for data analysis. In this study, if themajority (i.e., 70%) of the index data show the same sign in atime span of at least 5 h, this sign would be automatically assignedto the index. Specifically, if a change of sign occurs, the systemwill not give an immediate judgment. Instead, it would evaluatewhether such a sign change is caused by a real change of reactorstatus or just a temporary fluctuation according to the statistics ofthis point and the subsequent points in at least 5 h.On the basis of the signs and values of both indexes, the
current state and possible risks of reactor can be determined. Inthis study, the dangerous state is defined as sustaining VFAsaccumulation and corresponding inhibition in methane produc-tion. Under this state, the majority of S would be positive and awould be negative according to the eqs 1 and 2, and a higher value
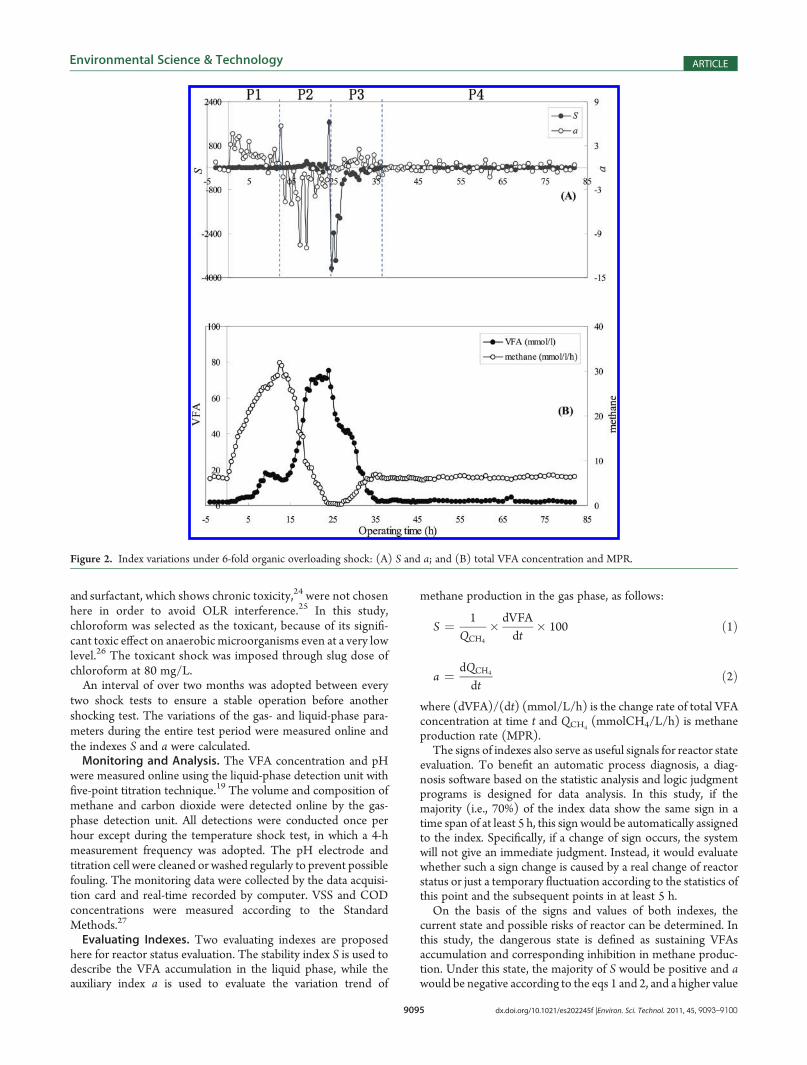
Figure 2. Index variations under 6-fold organic overloading shock: (A) S and a; and (B) total VFA concentration and MPR.

9096 dx.doi.org/10.1021/es202245f |Environ. Sci. Technol. 2011, 45, 9093–9100
Environmental Science & Technology ARTICLE
of S implies a higher degree of risk. To better reflect the degree ofdanger and stability, several threshold values are set here. Underthe premise of the positive S coupled with negative a, the alertsystem will give alarm if the absolute value of S exceeds 50.0.Notably, this threshold for alarm is only a type of emergencyalarm that indicates a serious situation. Actually, even at thebeginning of shock, the diagnosis system has already detected theoccurrence of shock according to signs of S and a. In a specialcase, if both indexes are close to zero, i.e., |S| is less than 4.0, and|a| is less than 1.5, this refers to a typical steady state. Or, if bothindexes have frequently changed signs (positive and negativesigns occur alternately and both occurrences are below 70%), thiscan be regarded as an unsteady state. In this way, the systemstatus can be diagnosed and a warning signal will be given by thealert system in advance if a dangerous state or trend is identified.
’RESULTS
Reactor Performance under Steady-State Conditions.Thegas production rate and compositions as well as the effluent pH,COD, and VFAs during the reactor steady-state operation periodwere monitored to evaluate the reactor performance. The averagegas production rate was in a range of 407.7�431.5 mL/h. Themethane and carbon dioxide contents were 65.5�68.0% and20.1�27.0%, respectively. The effluent pH was 7.14�7.21. Theeffluent COD and VFA concentrations were 41.5�96.0 and39.0�95.5 mg/L, respectively.Organic Overloading Shock.The typical response of the AD
process to an organic overloading shock is as follows:28 increasein VFA concentration, sludge volume index, and MPR; decreasein COD removal efficiency and methane content; change of pHdepending on the buffer capacity of the feed. According to thevariations of operating conditions and S and a values, the organicoverloading shock test could be divided into 4 phases (Figure 2).When the organic overloading shock was applied in phase 1
(P1, hours 0�14), initially no obvious inhibition was observed atthis stage. The S value was positive because of a rising VFAconcentration. Meanwhile, a also showed positive values as theMPR kept increasing. In phase 2 (P2, hours 15�24), the shockcondition continued and anobvious inhibition occurred. S remainedpositive values, but a turned negative as theMPR started to decline.The shock was stopped since phase 3 (P3, hours 25�37), and thereactor rapidly restored, with S and a values changed to negative andpositive, respectively. In phase 4 (P4, after hour 38), the reactorbecame restabilized, and both S and a values were close to zero.A lasting warning signal was given by the alert system
throughout P2 according to the identification result of diagnosissoftware, because most S showed positive values while a wasmostly negative. The absolute value of S exceeded 1000.0 at hour24, indicating a high risk of reactor collapse due to severe VFAaccumulation. From hour 25, the organic overloading shock wasterminated, and the S and a in P3 changed to negative and
positive values, respectively. Such changes suggest that the shockstrength was weakened or stopped, resulting in a reduced VFAconcentration and recovery of the methane production capacity.Accordingly, the alert stopped with the recovery of reactor status.In P4, both the S and a values approached zero. The MPR andVFA concentration became stabilized, and the reactor wastending toward stable operation.Hydraulic Loading Shock. The variations of S and a during
the 6-fold hydraulic loading shock are shown in Figure S1(Supporting Information). Most of the S showed negative values,and the absolute values were all below 3.0 in P1 (hours 1�24).Alternative positive and negative values of a were observedalmost in half-and-half, with all the absolute values below 1.4.These results suggest that the MPR remained stable in P1. Afterhour 24 (P2), the hydraulic shock stopped. The value of Smostlybecame positive and its absolute values were below 2.4 duringhours 25�36. The total VFA concentration increased slightly.The a values also showed positive and negative fluctuation, andthe absolute values fell to below 0.8. TheMPR remained stable inthis stage. After hour 37, both the absolute values of S and a wereclose to zero, and the reactor restored stable performance. Nosignificant change in both indexes was observed during thehydraulic loading shock, indicating that the reactor performancewas less affected by such a hydraulic loading shock. This wasconsistent with previous studies, in which the COD removalvaried only slightly under the condition of decreased HRT whileunchanged OLR.29
Temperature Shock. The changes of S and a during thetemperature shock are shown in Figure S2. During the tempera-ture shock (P1, hours 1�96), most of S exhibited positive values,indicating an increase in VFA concentration. The absolute valuesof S mounted from 3.0 up to a maximum of 60.0 at hour 28,suggesting an apparently increasing trend of VFA accumulation.Meanwhile, negative values were found for a in P1, indicating aconsiderable suppression of methane production. Accordingly,warning signals were given by the alert system throughout P1.Noticeably, the signs of a here were apparently different fromthose in the hydraulic and organic overloading shocks, whichmostly showed positive values. With temperature shock, themethane production was almost completely inhibited duringhours 60�96 and the absolute values of a were below 0.1. Withthe ending of temperature shock after hour 96 (P2), the S valuechanged drastically from positive to negative. A rapid drop in thetotal VFA concentration was observed. At the same time, the avalue changed from negative to positive and a gradual restorationof methane production was observed. As a consequence, the alertsignal automatically terminated. Although both S and a valuesfluctuated between positive and negative values within P3 (hours188�264), they became stable and approached zero inP4 (after hour265), indicating that the UASB reactor restored stable performance.Toxicant Shock.The response of S and a to the toxicant shock
is illustrated in Figure S3. Both S and a exhibited violent
Table 2. Operation Conditions and Shock Types of Tests in Literature
shock type duration shock condition references
4-fold organic overload shock hours 0�3 influent COD increased from 5000 to 20 000 mg/L 25
4-fold hydraulic shock hours 0�3 HRT decreased from 12 to 3 h 25
toxicant shock slug addition 10 mg chloroform/L was dosed 25
temperature shock days 0�70 temperature increased from 37 to 55 �C 30
temperature shock days 30�38 temperature increased from 55 to 65 �C 31

9097 dx.doi.org/10.1021/es202245f |Environ. Sci. Technol. 2011, 45, 9093–9100
Environmental Science & Technology ARTICLE
responses to the toxicant shock in the initial 4 h (P1). The S indexmostly showed positive values above 50.0, while a mostly
exhibited negative values during this period. This indicates arapid VFA accumulation and a severe inhibition in methaneproduction. A warning signal was given by the system in P1. Afterhour 5 (P2), a remained negative and the biogas productiondropped to near zero, while S value changed from positive tonegative in P2. Because the VFA could not be consumed by themethanogens, as evidenced by the completely ceased gas pro-duction, this means that the VFA production process was alsoinhibited. The slight decreased VFA concentration in the reactormight be attributed to the effluent discharge. The sharp increasein the absolute value of S and the ceased methane production athour 12 indicate a severe system collapse. After hour 12, a wasnear zero and no positive value of a was observed, analogue tothat under other shock-ceasing conditions. This further confirmsthe full stop of methane production and collapse of the UASBsystem.Verification. To further evaluate the practicability of the two
indexes S and a, the experimental data of shock tests reported inprevious studies were used for verification. The operating con-ditions and shock types in these tests are summarized in Table 2,whereas the calculated results of S and a are shown in Figure 3.As shown in Figure 3C, the S and a calculated from the
literature data show changing profiles highly similar to those inthis study, except for the toxicant shock test. For the toxicantshock test by Tay and Zhang,25 the calculated values of aincreased for a short period before dropping to zero again,indicating the recovery of methane production and stableperformance after the ending of shock. In contrast, in our studyan irreversible collapse of reactor occurred due to the muchhigher dosage of chloroform, which had caused unrecoverabletoxic damage. Generally, these two evaluating indexes demon-strate good applicability to various AD systems.
’DISCUSSION
Merits of the Monitoring and Alert System. The con-structed monitoring and alert system shows several distinctadvantages over the conventional systems. First, comprehensivebut reasonably simple online monitoring of AD process isrealized, which offers the basis for a rapid and accurate evaluationof AD reactor status. Second, the alert system demonstrates highcapacity in process diagnosis and early warning, attributed tothe introduction of the two new indexes, S and a. Third, thesystem, which is characterized by automated execution, mo-dularized design, and easy use, holds great promise for futurepractical application. All monitoring processes are automaticallyexecuted with software program. Simple and commerciallyavailable components are adopted for the hardware of this systemto facilitate modularization. Most of all, no complex operationand maintenance are required for this system, and customizedservices for reactor monitoring and online data processing can beachieved by using the virtual instrument software program.The two indexes, S and a, are proposed for diagnosis of AD
reactor status. They can reflect reactor status and changing trendaccurately, and have a rapid response to the operating conditiondisturbance. On the basis of the diagnosis results, an early alertcan be given by the system to prevent the upcoming risks.Accuracy of Indexes.The S and a indexes, which incorporate
the key operating parameters in both liquid- and gas-phase, offermeaningful information on anaerobic reactor status. Specifically,a combined evaluation of values and signs of both indexes revealsthe hidden pattern of dynamic change in VFA accumulation and
Figure 3. Profiles of S and a based on data in literature: (A) 4-fold organicoverloading shock;25 (B) 4-fold hydraulic loading shock;25 (C) toxicantshock;25 (D) 55 �C temperature shock;30 and (E) 65 �C temperature shock.31

9098 dx.doi.org/10.1021/es202245f |Environ. Sci. Technol. 2011, 45, 9093–9100
Environmental Science & Technology ARTICLE
methane production. Based on the experimental results of theshock tests and literature data verification, a database about thecorrelation between the two indexes and anaerobic reactor statuswas established (Table 3). Such a combination of different signsand magnitudes of the two indexes corresponds well to differentreactor status and shock types. Here, the absolute values of S anda reflect the intensity of changes or disturbance in anaerobicreactors, whereas their signs indicate a specific reactor status andshock type.As shown in Table 3, positive S is found under many different
operating conditions and reactor status, implying that the valueof S alone is insufficient to clearly identify reactor status.Noticeably, the signs of a also vary significantly and offer valuablesupplementary information. On the basis of a combined analysisof S and a at the initial stage of shock, it is possible to preliminarilydistinguish the shock type and find out whether anaerobes aresignificantly inhibited. Generally, a positive S and positive acorrespond to an organic overloading shock, while a positive Sand negative a indicate a temperature or toxicant shock. At thelate stage of an organic overloading shock (Figures 2A and 3A), apositive S and negative a are obtained regardless of the shockintensity, which suggests a methanogenesis-inhibited state. Incontrast, a negative S and positive a at the late stage of shockmeans consumption of VFA by methanogens and a gradualadaptation and reactor recovery after shock. In addition, thechanging trends of S and a are also informative. If S value changesfrom positive to negative, while a value remains negative for along time, the inhibition of both VFA and methane production issuggested.Apparently, there exist some relationships between the in-
dexes of S and a and the reactor status. Compared with theconventional individual parameters, such as pH, VFA, and MPR,which rely on their preset threshold values for judgment andusually lead to subjective and incorrect conclusions, these twointegrated evaluating indexes proposed in this study offer moreobjective, accurate, and comprehensive assessment on the statusand shock types of anaerobic reactors.Sensitivity of Indexes. Both S and a demonstrate high
sensitivity, mainly attributed to an integrated analysis of both theabsolute value and the sign as well as the use ofMPR as a regulatoryfactor. With this regulatory factor, the changes of S can be properlyand significantly magnified or buffered, so that the reactor changing
trend can be more clearly revealed. This ensures a high sensitivity ofthe indexes and a capability of the system for early warning. Forexample, in the organic overloading shock test (Figure 2), thepositive S and a in P1 corresponded to the VFA accumulation andMPR increase. Such an MPR increase was attributed to theuninhibited methanogenesis at the beginning. As a consequence,the increase in S was weakened by the methane production, whichserves as a buffer against the factor dVFA/dt. Thus, S showed nodrastic increase. The moderate change of S was consistent with thereactor status. In P2, however, the MPR severed as amplifier of S,because methanogenic inhibition occurred. At this phase, the Sremained positive, while a shifted to negative. The increase indVFA/dt was magnified by the MPR, leading to a maximum S ofover 1000.0 at the end of shock. This was consistent with thesignificantly deteriorated reactor performance. Accordingly, alertwas given by the system throughout P2. It is worthwhile to note that,however, the shock had already been detected by the system even atthe beginning of shock.For both S and a, their signs are dependent on the transient
changing trend of the monitoring parameters. The sign willchange and respond immediately once the reactor becomesinstable or undergoes changing state, even when the conven-tional evaluating parameters are still below their threshold values.For example, in the organic overloading shock test, the VFAconcentration, methane production, and pH all showed littlechanges at the initial shock stage (within 1 h): the VFAconcentration increased slightly from 2.0 to 2.2 mmol/L, themaximum MPR increased from 6.4 to 7.5 mmol/L/h, and pHand methane component kept at around 7.3 and 66.0%, respec-tively. However, both S and a values changed substantially. S anda jumped rapidly from near zero to 5.6 and 3.2, respectively, witha positive sign (the sign can change instantaneously as a result ofshock). These changes suggest a changing reactor status and offerhints to the type and level of the encountered shocks. Thepositive sign of S and a clearly suggested an organic overloadingshock. As a consequence of diagnosis results, alert was given bythe system. The time of earliest alert given was at hour 15, whichwas 5 h earlier than the occurrence of severe acidification (pH <6.2) and 8 h before the full stop of methane production. Incontrast, at hour 15 the VFA concentration was 20.1 mmol/L;MPRwas 36.9mmol/L/h, which was evenmuch higher than thatat hour 0 (6.4 mmol/L/h); pH value was 6.93 and acidification
Table 3. Correlation between the Sign of Indexes and Reactor Status
S a reactor status example
positive positive organic overload; methanogens are
not evidently suppressed
P1 of Figure 2A, P1 of Figure 3A
positive negative methanogens are
evidently suppressed
P2 of Figure 2A, P1 of Figure S2(A),
P1 of Figure S3(A), P2 of Figure 3A, P1 of Figure 3C,
P1 of Figure 3D, P1 of Figure 3E
negative positive activity of methanogens has restored. P3 of Figure 2A, P2 of Figure S2(A),
P2 of Figure 3C, P2 of Figure 3E
negative negative acidogenesis and methanogenesis are
both inhibited
P2 of Figure S3(A), P3 of Figure 3A
frequent
change of sign
frequent
change of sign
reactor state is unstable; at the
transitional stage
P3 of Figure S2(A), P2 of Figure 3D
close
to zero
close
to zero
reactor is operated at
steady state or all the biochemical
processes in the reactor cease
P4 of Figure 2A, P1, P2 of Figure S1(A), P4 of Figure S2(A),
P4 of Figure 3A, P1�P4 of Figure 3B, P3 of Figure 3C,
P3 of Figure 3D, P3 of Figure 3E

9099 dx.doi.org/10.1021/es202245f |Environ. Sci. Technol. 2011, 45, 9093–9100
Environmental Science & Technology ARTICLE
did not occur. Apparently, these conventional parameters re-vealed no sign of risk at that moment. Therefore, indexes S and aare not only more effective and accurate in assessing the reactorstatus and operation condition changes, but alsomore effective inrisk prediction, because risks can be detected far in advance.Similar high prediction accuracy of risks was repeatedly demon-strated in the other shock tests. Therefore, compared to theconventional parameters that can reveal the reactor status onlyafter occurrence of deterioration, the two indexes proposed herecan give synchronous and real-time information on the reactorstatus and rapidly reflect any slight change early before thedangers occur.Adaptability of Indexes to Diagnosis Program.With S and
a, a simple and reliable diagnosis program can be developed for afast and automatic evaluation of anaerobic reactors, without theneed for human intuition or intervention. Moreover, these twoindexes are suitable for a logic working pattern of artificial intel-ligence programming, because the positive and negative signsresemble 0 and 1 of the computer binary system. Therefore, anintegration of the two indexes with the online monitoring andalert system can provide a practical tool for online artificialintelligence diagnosis of anaerobic reactor status. By furtheremploying an additional feedback automatic control system,intelligent operating and automatic control of anaerobic reactorscould be realized.In summary, an efficient online monitoring and alert system is
developed for monitoring and diagnosing the status of a UASBreactor. The core of this system is a set of integrated indexes, astability index S and an auxiliary index a, which offer the basis fora quantitative and comprehensive evaluation of anaerobic diges-tion reactors. The great accuracy and sensitivity of the twoindexes enable a reliable early warning of potential risks. Theirgood adaptability and relatively simplicity also ensure a highpossibility for being incorporated into artificial intelligence andautomated control systems. Therefore, this online monitoringand alert system holds great promise for practical application inonline monitoring, diagnosis, and control of anaerobic digestionreactors for waste treatment. Moreover, with a further developmentof advanced monitoring and data interpretation techniques as wellas a deeper understanding of microbial metabolic dynamics, it mayalso be expanded to other fields of anaerobic fermentation pro-cesses. Nevertheless, despite the good performance of our system, itmay face challenges for practical application in large-scale reactors,such as liquid residual in pipeline, pipe jam, electrode fouling, andfluid mixing. In addition, the setting of threshold values for S and aindexes is important andmay vary significantlywith reactor type anddiagnosis objective, because there is inevitably a balance betweenprediction accuracy and degree of foreseeability. Thus, selection ofappropriate threshold setting values is necessary. These all warrantfurther investigations.
’ASSOCIATED CONTENT
bS Supporting Information. Figures S1�S3. This informa-tion is available free of charge via the Internet at http://pubs.acs.org.
’AUTHOR INFORMATION
Corresponding Author*W.-W.L. Fax: +86 551-3607453; e-mail: [email protected]. Fax: +86 551-3607592; e-mail: [email protected].
’ACKNOWLEDGMENT
We thank the NSFC-JST Joint Project (21021140001) andMinistry of Science and Technology of China (2008BADC4B18)for the partial support of this study.
’NOMENCLATUREa auxiliary indexCOD chemical oxygen demandHRT hydraulic retention timeMPR methane production rateOLR organic loading rateS stability indexVFA volatile fatty acidVSS volatile suspended solidsUASB upflow anaerobic sludge blanket
’REFERENCES
(1) Madsen, M.; Nielsen, J. B. H.; Esbensen, K. H. Monitoring ofanaerobic digestion processes: A review perspective. Renewable Sustain-able Energy. Rev. 2011, 15, 3141–3155.
(2) Bjorklund, R. B.; Christiansson, A.; Anders, E. W.; Ejlertsson, J.Electrode specific information from voltammetric monitoring of biogasproduction. Talanta 2010, 81, 1578–1584.
(3) Ward, A. J.; Hobbs, P. J.; Holliman; Jones, D. L. Optimisation ofthe anaerobic digestion of agricultural resources. Bioresour. Technol.2008, 99, 7928–7940.
(4) Lahav, O.; Morgan, B. E. Titration methodologies for monitor-ing of anaerobic digestion in developing countries - A review. J Chem.Technol. Biotechnol. 2004, 79, 1331–1341.
(5) Buyukkamaci, N.; Filibeli, A. Volatile fatty acid formation in ananaerobic hybrid reactor. Proc. Biochem. 2004, 39, 1491–1494.
(6) Mathiot, S.; Esoffier, Y.; Ehlinger, F.; Couderc, J. P.; Leyris, J. P.;Moletta, R. Control parameter variations in an anaerobic fluidized-bedreactor subjected to organic shockloads. Water Sci. Technol. 1992, 25,93–101.
(7) Steyer, J.-P.; Buffi�ere, P.; Rolland, D.; Moletta, R. Advancedcontrol of anaerobic digestion processes through disturbances monitor-ing. Water Res. 1999, 33, 2059–2068.
(8) Boe, K.; Batstone, D. J.; Steyer, J. P.; Angelidaki, I. Stateindicators for monitoring the anaerobic digestion process. Water Res.2010, 44, 5973–5980.
(9) García-Dieguez, C.; Molina, F.; Roca, E. Multi-objective cascadecontroller for an anaerobic digester. Proc. Biochem. 2011, 46, 900–909.
(10) Nielsen, H. B.; Uellendahl, H.; Ahring, B. K. Regulation andoptimization of the biogas process: Propionate as a key parameter.Biomass Bioenergy 2007, 31, 820–830.
(11) Li, W. H.; Sheng, G. P.; Lu, R.; Yu, H. Q.; Li, Y. Y.; Harada, H.Fluorescence spectral characteristics of the supernatants from ananaerobic hydrogen-producing bioreactor. Appl. Microbiol. Biotechnol.2010, 89, 217–224.
(12) Palacio-Barco, E.; Robert-Peillard, F.; Boudenne, J. L.; Coulomb,B. On-line analysis of volatile fatty acids in anaerobic treatment processes.Anal. Chim. Acta 2010, 668, 74–79.
(13) Zhang, M. L.; Sheng, G. P.; Mu, Y.; Li, W. H.; Yu, H. Q.;Harada, H.; Li, Y. Y. Rapid and accurate determination of VFAs andethanol in the effluent of an anaerobic H2-producing bioreactor usingnear-infrared spectroscopy. Water Res. 2009, 43, 1823–1830.
(14) Feitkenhauer, H.; Sachs, J.v.; Meyer, U. Online titration ofvolatile fatty acids for the process control of anaerobic digestion plants.Water Res. 2002, 36, 212–218.
(15) Lenz, M.; Hullebusch, E. D. V.; Farges, F.; Nikitenko, S.;Corvini, P. F. X.; Lens, P. N. L. Combined speciation analysis by X-rayabsorption near-edge structure spectroscopy, ion chromatography, andsolid-phase microextraction gas chromatography-mass spectrometry to

9100 dx.doi.org/10.1021/es202245f |Environ. Sci. Technol. 2011, 45, 9093–9100
Environmental Science & Technology ARTICLE
evaluate biotreatment of concentrated selenium wastewaters. Environ. Sci.Technol. 2011, 45, 1067–1073.(16) Ward, A. J.; Hobbs; Bruni, E.; Lykkegaard, M. K.; Feilberg, A.;
Adamsen, A. P. S.; Jensen, A. P.; Poulsen, A. K. Real timemonitoring of abiogas digester with gas chromatography, near-infrared spectroscopy,and membrane-inlet mass spectrometry. Bioresour. Technol. 2011, 102,4098–4103.(17) Moosbrugger, R. E.;Wentzel, M. C.; Ekama, G. A.; Marais, G. v.
R. A 5 pH point titration method for determining the carbonate andSCFA weak acid/bases in anaerobic systems. Water Sci. Technol. 1993,28, 237–45.(18) Anderson, G. K.; Yang, G. Determination of bicarbonate and
total volatile acid concentration in anaerobic digesters using a simpletitration. Water Environ. Res. 1992, 64, 53–59.(19) Lahav, O.; Morgan, B.; Loewenthal, R. Rapid, simple, and
accurate method for measurement of VFA and carbonate alkalinity inanaerobic reactors. Environ. Sci. Technol. 2002, 36, 2736–2741.(20) Pejcic, B.; Eadington, P.; Ross, A. Environmental monitoring of
hydrocarbons: A chemical sensor perspective. Environ. Sci. Technol.2007, 41, 6333–6342.(21) Michaud, S.; Berner, N.; Buffiere, P.; Roustan, M.; Moletta, R.
Methane yield as a monitoring parameter for the start-up of anaerobicfixed film reactors. Water Res. 2002, 36, 1385–1391.(22) Nielsen, J. B. H.; Lomborg, C. J.; Popiel, P. O.; Esbensen, K. H.
Online near infrared monitoring of glycerol-boosted anaerobic digestionprocesses: evaluation of process analytical technologies. Biotechnol.Bioeng. 2008, 99, 302–313.(23) Punal, A.; Roca, E.; Lema, J. M. An expert system for monitor-
ing and diagnosis of anaerobic wastewater treatment plants. Water Res.2002, 36, 2656–2666.(24) Ginkel, S. W. V.; Kortekaas, S. J. M.; Lier, J. B. V. The chronic
toxicity of alcohol alkoxylate surfactants on anaerobic granular sludge inthe pulp and paper industry. Environ. Sci. Technol. 2007, 41, 4711–4714.(25) Tay, J. H.; Zhang, X. Y. Stability of high-rate anaerobic systems.
I: Performance under shocks. J. Environ. Eng. 2000, 126, 713–725.(26) Speece, R. E. Anaerobic Biotechnology for Industrial Waste-
waters; Archae Press: Nashville, TN, 1996.(27) APHA-AWWA-WPCF. Standard Methods for the Examination
of Water and Wastewater, 20th ed.; Washington, DC, 1999.(28) Nachaiyasit, S.; Stuckey, D. C. The effect of shock loads on the
performance of an anaerobic baffled reactor (ARB). 1. Step changes infeed concentration at constant retention time. Water Res. 1997, 31,2737–2746.(29) Nachaiyasit, S.; Stuckey, D. C. The effect of shock loads on the
performance of an anaerobic baffled reactor (ARB). 2. Step and transienthydraulic shocks at constant feed strength. Water Res. 1997, 31,2747–2754.(30) Bouskova, A.; Dohanyos, M.; Schmidt, J. E.; Angelidaki, I.
Strategies for changing temperature from mesophilic to thermophilicconditions in anaerobic CSTR reactors treating sewage sludge. WaterRes. 2005, 39, 1481–1488.(31) Lau, I. W. C.; Herbert, H. H. P. Effect of temperature shock to
thermophilic granules. Water Res. 1997, 31, 2626–2632.