novel method of controlling acid discharge in drainage ... · pdf filenovel method of...
TRANSCRIPT

C S I R O L A N D a nd WAT E R
Novel Method of Controlling Acid Discharge
in Drainage Water Using Lime Slots
F.J. Cook, A. Lush, G.D. Carlin and K. Bott
CSIRO Land and Water, Brisbane
Technical Report 45/03, December 2002

NOVEL METHOD OF CONTROLLING ACID DISCHARGE IN DRAINAGE WATER USING LIME SLOTS
F.J. Cook1, A. Lush2, G.D. Carlin1 and K. Bott2 1CSIRO Land and Water 120 Meiers Road Indooroopilly Q 4068 2Gold Coast City Council PO Box 5042, Gold Coast MC Q 9729 CSIRO Land and Water Technical Report 45/03, December 2002

© 2003 CSIRO, Gold Coast City Council and Environment Australia (Natural Heritage Trust). This work is copyright. It may be reproduced subject to the inclusion of an acknowledgement of the source. Important Disclaimer: CSIRO Land and Water, Gold Coast City Council and Environment Australia (NHT) advises that the information contained in this publication comprises general statements based on scientific research. The reader is advised and needs to be aware that such information may be incomplete or unable to be used in any specific situation. No reliance or actions must therefore be made on that information without seeking prior expert professional, scientific and technical advice. To the extent permitted by law, CSIRO Land and Water, Gold Coast City Council and Environment Australia (NHT) (including its employees and consultants) excludes all liability to any person for any consequences, including but not limited to all losses, damages, costs, expenses and any other compensation, arising directly or indirectly from using this publication (in part or in whole) and any information or material contained in it. Cover Photograph: Kylie Hey, Qld. Dept. of Natural Resources & Mines. ISSN 1446-6163

Contents Summary 3 Objectives 4 Background 4 Site 5 Installation and Instrumentation 6
Lime application 6 Sump 7 Dip Wells 11 Soil samples for physical properties 13
Results 14 Soils 14 Climate 17 Discharge Events 18 Communication 22
Discussion 22 Conclusion 22 Acknowledgements 23 References 23
2

SUMMARY Lime slots were successfully installed in an acid sulfate soil (ASS) using the CSIRO gypsum-slotting machine. The lime was evenly distributed in the slots to a depth of 900 mm but the concentration in each slot varied. There was also some variation in the distance between each slot and the drain, as slot installation was completed at night due to impending rain. Rain has been scarce during this trial with the lowest recorded rainfall for more than 150 years. This has meant that only limited data on the performance of the slots was collected. This was compounded by the fact that during a moderate event in August/September 2002 monitoring did not take place as the instruments had been removed to allow harvesting of the sugar cane. Data from the ‘tail’ of this event was captured following reinstallation of the monitoring equipment. Valuable data on the soil physical and chemical properties were obtained in this project. The soil physical data showed how the moisture release data was well described using the van Genuchten (1980) function and that there is evidence of considerable compaction of soil in the inter-row. The soil chemical data from cores collected and analysed by the Queensland Acid Sulfate Soils Investigation Team (QASSIT) of the Department of Natural Resources and Mines (NR&M) group showed the degree of mixing of lime into and neutralising capacity, of the slots. They also showed that the soil at this site has considerable actual acidity (200 tonnes of sulfuric acid equivalent per hectare) stored in it. This means that control of the release of this acidity by techniques such as lime slots will be vital to minimise the destructive environmental potential of these soils.
3

OBJECTIVES The objectives as stated in the project proposal were stated as: “… to decrease acidity in drainage water from drained ASS fields by trialing and implementing a novel cost-effective technology based on lime slotting adjacent to drains. Specifically, we aim to test the method on an existing drained ASS site, with the objective of:
• Raising pH in discharge from currently 3 to 5.5
• Reducing iron from concentrations currently 100 mg/L to 1 mg/L
• Reducing aluminium concentrations in the drainage water from currently 10 mg/L to 0.1 mg/L
The project will serve as a demonstration project to promote environmentally sensitive agricultural practices, targeted at the local canegrower community in particular and to land users on drained coastal ASS in general.”
Only some of the objectives given above were achieved, namely the implementation of the lime slots and the communication to the local canegrower community and land users both in Australian and Internationally. The specific objectives of raising pH, reducing iron and aluminium concentrations were very difficult to assess, as the volume drained during the trial was minimal due to drought conditions.
However, additional information not initially envisaged in the project proposal on the accumulation of acidity in the soil and rate of oxidation of pyrite were obtained.
BACKGROUND In lowland coastal cane growing areas surface drainage is a prerequisite to maintaining cane productivity. Drains to manage surface water have been installed to prevent waterlogging and provide adequate drainage. Drainage systems and agricultural practices have increased the conveyance of groundwater and surface water into the waterways (Wilson et al., 1999, Rassam and Cook, 2002). This has also led to the increased discharge of acidity (low pH, and associated metals) into the receiving coastal waterways from the naturally occurring ASS (Cook et al., 2000). The resulting fish kills and a severe degradation of the environment due to the invasion of acid tolerant flora and fauna, has led to increased scrutiny of canegrowers adjacent to sensitive waterways, wetlands and fish habitat areas. Stakeholders such as the Gold Coast City Council have an interest in minimising acid drainage discharge. The dissolved metal's in the drainage water, particular aluminium are toxic to gilled organisms, while the iron has a chemical oxygen demand which can deplete water of its dissolved oxygen (Sammut et al., 1995). This water can impact on the coastal nursery areas for fish and other aquatic organisms. The loss of habitat also has an effect of fish and other aquatic populations. In the last 30 years the oyster production in NSW has decreased by 50% and in more recent years the proportion of fish with red spot disease has increased especially in areas with ASS. Economically this has an
4

effect on the viability of commercial fish species, with social ramifications for the continuation of fishing communities. Past attempts at remediating ASS discharge under agricultural production using broadcast liming techniques have only had limited success and are onerous and costly. However, it is conceivable that to minimise the impact of acid discharge from a broad range of drained ASS, it would be sufficient to neutralise the acidity entering the drains, rather than attempting to neutralise the total stored acidity (Cook and Gardner, 2001). If such improved techniques were available that were both effective in addressing the problem of acid discharge, whilst proving to be easy to implement and cost effective, it is likely that a greater rate of implementation could be achieved — greatly minimising adverse effects of drained ASS on the receiving environment. This of particular interest to the Gold Coast City Council, as they are concerned with continuing problems of managing acid discharge in the Woongoolba region of south-east Queensland. As it is potentially more economical to neutralise the acidity in the drainage water rather than treat the soil acidity, such a technique if effective, would also provide enormous benefit to land users confronted with the problem of acid drainage from their land. The project focused on developing, evaluating and implementing an innovative method based on treating drainage water before it discharges into the drains, with the aim of providing a generally applicable technology to manage acid discharge from drained ASS. The technique known as lime slotting creates a trench of soil parallel to the drains into which a high concentration of lime has been incorporated. This trial was initiated to install and test lime slotting as a method for the mitigating the amount of acid discharged from ASS. This report details the methodology and results from this trial.
SITE The project site was located south east of Brisbane near Beenleigh (Fig. 1) on the property of K and L Mischke. Three experimental plots and one control plot were established on 5.56 ha adjacent to Sandy Creek (Fig. 2). Drainage from half the plot area was drained through the centre drains which discharge into the central sump.
5
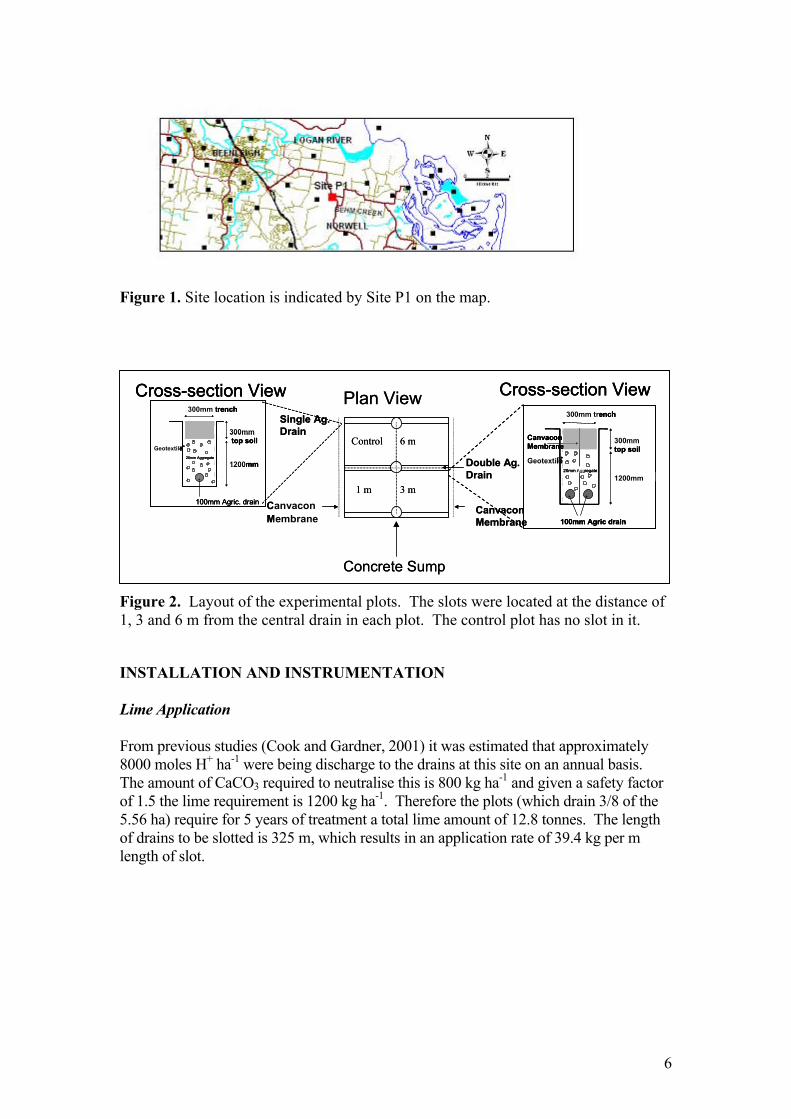
Figure 1. Site location is indicated by Site P1 on the map.
Cross-section ViewCross-section View Cross-section ViewCross-section ViewCross-section ViewCross-section View
F1
I L F8To5ol
Concrete Sump
CanvaconMembrane
Double Ag.Drain
CanvaconMembrane
Single Ag.Drain
Plan View
Geotextile
300mm top soil
1200mm
100mm Agric drain
300mm trench
CanvaconMembrane
20mm Aggregate
Geotextile
300mmtop soil
1200mm
100mm Agric. drain
300mm trench
20mm Aggregate
6 m m
3 m m1 m m
Control
Concrete Sump
CanvaconMembrane
Double Ag.Drain
CanvaconMembrane
Single Ag.Drain
Plan View
Geotextile
300mm top soil
1200mm
100mm Agric drain
300mm trench
CanvaconMembrane
20mm Aggregate
Geotextile
300mm top soil
1200mm
100mm Agric drain
300mm trench
CanvaconMembrane
20mm Aggregate
Geotextile
300mmtop soil
1200mm
100mm Agric. drain
300mm trench
20mm Aggregate
Geotextile
300mmtop soil
1200mm
100mm Agric. drain
300mm trench
20mm Aggregate
6 m m
3 m m1 m m
Control
igure 2. Layout of the experimental plots. The slots were located at the distance of , 3 and 6 m from the central drain in each plot. The control plot has no slot in it.
NSTALLATION AND INSTRUMENTATION
ime Application
rom previous studies (Cook and Gardner, 2001) it was estimated that approximately 000 moles H+ ha-1 were being discharge to the drains at this site on an annual basis. he amount of CaCO3 required to neutralise this is 800 kg ha-1 and given a safety factor f 1.5 the lime requirement is 1200 kg ha-1. Therefore the plots (which drain 3/8 of the .56 ha) require for 5 years of treatment a total lime amount of 12.8 tonnes. The length f drains to be slotted is 325 m, which results in an application rate of 39.4 kg per m ength of slot.
6

Shroud
Cutters
Disc
Chute
Hopper
Figure 3. Lime slotter with salient features indicated.
The lime slotter is pictured in Figure 3. The salient features of this are; a hopper for the lime, chutes that deliver lime to the soil immediately in front of the cutters, a disc with cutter blades on its circumference, and a shroud to keep the soil in the trench. This slotter can create a slot approximately 100-150 mm wide by 900 mm deep. The required application rate of lime was approximately 40 kg per m length of slot. This rate of lime application is equivalent to 6 t ha-1 if this lime was spread over the whole area and 1970 t ha-1 is the approximate rate of application to the slot. The slotter could not deliver such a high rate, so this was applied in 2 passes with 20 kg per m length of trench applied in each pass. As a result the trench was approximately 150-200 mm wide. The actual amount of lime used was 11.3 tonnes gives an estimated application rate of 35 kg per m length of drain. This will have not compromised the experiment as we had a safety factor of 1.5 in the calculation of the lime requirement. Sump The middle sump was modified so that each of the four drains entering the sump were separately instrumented to continuously measure flow rate, electrical conductivity (EC) and pH of the water (Fig. 4). The average values in each 10-minute period were logged and stored. To facilitate the calibration and cleaning of the instruments without the requirement of the confined spaces team (Fig. 5) instruments were mounted in a shaft that clipped into the outlets from the drains (Fig. 6).
7

Ftra
Fsb
igure 4. View from the top of the sump showing four instrument clusters for each reatment. They small rod inside the larger tube allows the EC and pH probes to be emoved without having to get into the sump. The green tubing is connected to ISCO utomatic samplers via solenoid valves.
igure 5. The GCCC Confined Spaces Team installing water meters. The ISCO ampler boxes, instrumentation box, pump and solar panel can be seen in the ackground.
8

Fw
WTatt Apa
igure 6. One of the four instrument pods showing pH (blue coloured probe), EC and ater sampling tube.
ater samples were extracted from each treatment using 2 ISCO automatic samplers. wo treatments were collected in each sampler, 1 and 6 m treatments in one sampler, nd 3 m and control treatments in the other. Solenoids were used to switch the origin of he sample between each treatment. Sample collection was based on the flow rate or ime based depending on the flow rate.
ll data was stored on a data logger and telemetered (Fig. 7) each day via a mobile hone modem to a computer in Brisbane. This data was then stored in a database and rchived onto CDs.
9

Fiphco
gure 7. Instrumentation box, showing solar panel regulator (top left), mobile one/modem (top center), data logger and interface, pH controllers (Sentrol) and EC nditioners (white boxes at the bottom right).
10

Dip Wells A series of dip wells were installed in each of the sites, and pressure transducers were installed in the dip wells that were either side of the lime slots (Fig. 8). This was to determine if the lime slots were causing the flow to be restricted. At each of the dip wells locations, soil samples were also taken at the start of the trial (Fig. 9). The pressure transducer readings were logged and the value stored every 10-minutes.
F
igure 8. Pressure transducer prior to being inserted into dip well.
11

FTltQ
igure 9. Schematic showing the layout of the site and placement of the dip wells. he displacement of the centre line is to make the diagram less cluttered. The dashed
ines represent the lime slots and the dip wells either side of these slots had pressure ransducers in them. The four digit numbers refer to the soil sample taken by DNR&M staff.
12

Soil samples for physical properties Soil core samples were obtained from 2 pits on 21/12/2001, which were dug (Fig. 10) at the experimental site. Pit 1 was sited at the central point of the control plot and pit 2 at the central point of the 3 m plot. Samples were taken according to standard methods (McKenzie and Cresswell, 1995). Triplicate samples were taken from each depth at 0.02-0.07, 0.60-0.65 and 1.20-1.25 m at each pit. For the 0.02-0.07 depth triplicate samples were taken from the row and inter-row space.
Fs
Ts
igure 10. Joseph Kemei collecting soil core samples for a soil pit at the experimental ite.
he samples were taken to the CSIRO soil physics laboratory in Townsville where the oil moisture characteristics and particle size of the samples were determined using
13

standard methods (Cresswell and McKenzie, 1995). The moisture release data was fitted to the van Genuchten (1980) function using the RETC computer program (van Genuchten et al., 1991). RESULTS Soils The soil sampling by the NR&M staff (Watling et al., 2002) at the start of the trial showed that the soil could be described as having 3 major layers, surface, actual acid sulfate soil (AASS) and potential acid sulfate soil (PASS). All of these layers were acidic with average pHs of 4.2, 4.0 and 4.4 for the surface, ASS and PASS layers respectively. There is also considerable amount of acidity stored in the soil in terms of jarosite and existing acidity (TAA) and a very large amount of potential acidity (TPA) still left in this soil (Watling et al., 2002, Table 3). Integration of these acidity data with depth indicates there is on average approximately 100 tonnes H2SO4 ha-1 of existing acidity in the soil and the total potential acidity (yet to be oxidised) is 360 tonnes ha-1. Cook and Gardner (2001) found that the rate of discharge of acidity from this site was approximately 0.4 tonnes H2SO4 ha-1 y-1. These existing and potential acidity figures are sobering in the context of these soils potential to continue to discharge and develop acidity for decades to centuries to come. The soils were sampled again in November 2002 and a detailed report was prepared by QNR&M staff (Watling et al., 2003). There was little or no change in the pH of the various soil layers. However, as would be expected for a prolonged dry period oxidation of the pyrite had occurred. A measurable decrease in the TPA of the control and 1 m slot treatments was, when integrated over the soil profile, 56 tonnes H2SO4 ha-1. The increased TAA over the 21 months period between sampling dates was measured as 10 tonnes H2SO4 ha-1. The rate of generation of acidity is then in the range of 6 to 30 tonnes H2SO4 ha-1 y-1. This compares favourably with estimates based a rate of 10 tonnes H2SO4 ha-1 y-1, derived from rates of oxygen consumption (Cook et al., 2003). The lime slots had soil samples taken at the same time as the above soil samples. The results from the November 2002 samples indicated that there is still considerable neutralising capacity of up to 1700 mol H+ tonne-1 left in the lime slots. This suggests that the lime slots could have a reasonable longevity, although the climatic conditions during this trial are abnormal, and have contributed to the neutralising capacity not being as affected as it may otherwise have been. However, the results do suggest that the slot was easily able to reduce any acidity generated within the slot.
Soil particle size analysis showed that the soil was dominated by fine sand except for the surface layer at Pit 2 (Table 1). There is only a small variance between the pits in terms of proportions of each size class.
14

Table 1. Particle size analysis for soil samples taken from pits 1 and 2.
% of mass Site Depth (m)
Coarse Sand Fine Sand Silt Clay
Pit 1, row 0.02-0.07 8.4 43.1 27.9 20.6
Pit 1, Inter Row 0.02-0.07 8.2 42.3 28.3 21.2
Pit 1 0.6-0.65 1 34.7 22.6 41.7
Pit 1 1.2-1.25 1.8 57 15.8 25.4
Pit 2, row 0.02-0.07 7 24.2 36 32.8
Pit 2, Inter Row 0.02-0.07 6.3 24.7 35.3 33.7
Pit 2 0.6-0.65 1 49 21.4 28.6
Pit 2 1.2-1.25 1.1 49.1 23.6 26.2
The bulk density was less in the row compared with the inter row due to vehicle traffic compacting the soil in the inter row. Also the soil at pit 1 is more dense than pit 2 (Table 2).
Table 2. Bulk density for the soil at the two pit sites.
Site Depth (m) Bulk Density (t m-3)
Pit 1, row 0.02-0.07 1.03
Pit 1, Inter Row 0.02-0.07 1.24
Pit 1 0.6-0.65 1.31
Pit 1 1.2-1.25 1.27
Pit 2, row 0.02-0.07 0.96
Pit 2, Inter Row 0.02-0.07 1.10
Pit 2 0.6-0.65 1.15
Pit 2 1.2-1.25 1.08
15

The moisture characteristic curves for the surface layer (0.02-0.07 m) show the effect of compaction in the inter row with a much flatter initial relationship between the matric potential (ψ) and volumetric water content (θ) (Fig. 11), especially at pit 1.
Surface Layer
F
Tbv
log(-ψ)
-1 0 1 2 3 4 5
θ (m
3 m-3
)
0.20
0.25
0.30
0.35
0.40
0.45
0.50
0.55
0.60
Pit 1 RowPit 1 Inter RowPit 2 Row Pit 2 Inter Row
igure 11a. Moisture characteristic curves for surface layer (0.02-0.07 m).
he moisture characteristics of the soil for the deeper layers show a very flat relationship etween θ and ψ for low values of ψ (Fig. 11). This supports the low specific yield alues estimated for this soil by Cook and Gardner (2001).
16

AASS and PASS Layers
log(-ψ)
-1 0 1 2 3 4 5
θ (m
3 m-3
)
0.25
0.30
0.35
0.40
0.45
0.50
0.55
0.60
0.65
Pit 1, 0.625 mPit 2, 0.625 mPit 1, 1.225 mPit 2, 1.225 m
Figure 11b. Moisture characteristic curves for AASS and PASS layers.
The moisture characteristic data were well fitted by a van Genuchten function (van Genuchten, 1980):
[ ] rnnrs θ
αψ
θθθ ++
−= − /111
(1)
where θ is the volumetric water content and the subscripts s and r are the saturated and residual values, ψ is the matric potential and α and n are parameters. The coefficients of regression for the fit of eqn (1) to the data was > 0.99 for both horizons. Climate The climate was uncharacteristically dry during the time of this trial with drought conditions. The long term average annual rainfall for this area is 1362 mm. The annual rainfall in 2001 at the site was 843 mm and for the period from 29/11/2001 to 28/11/2002 was 838 mm. This is 60 % of the average rainfall for both periods. The potential evapotranspiration (PET) calculated using the Penman-Monteith equation (Raupach, 1991) was 975 and 951 mm respectively for the time periods describe above. The long-term average pan evaporation is 1490 mm and using an
17

average crop factor for cane of 0.65 gives the PET as 970 mm. The measured PET values were hence average during the period of this trial. The results of this below average rainfall and average PET is that the potential cumulative water balance was relatively stable through most of 2001 but decreased sharply during the summer of 2001/02, before fluctuating for the remainder of 2002 around a much lower value of the water balance (Fig. 12).
Figure 12. Rainfall, PET and cumulative water balance from 1/1/2001 to 29/11/2002.
Date01/01 04/01 07/01 10/01 01/02 04/02 07/02 10/02
Rai
nfal
l (m
m)
0
20
40
60
80
100
120
140
Pote
ntia
l Eva
potr
ansp
iratio
n (m
m)
-15
-10
-5
0
5
10
Cum
ulat
ive
Wat
er B
alan
ce (m
m)
-400
-300
-200
-100
0
100
Rain (mm) PET (mm) Water Balance
Drainage Events
Discharge Events Due to the climatic conditions only 3 small drainage events were measured; March 2001, November-December 2001 and August-September 2002. Full capture of the latter event was not possible as the monitoring equipment had been removed prior to cane harvesting. A rainfall event occurred which delayed harvesting which eventually took place on 5-6 September (Fig. 13) and the monitoring equipment was immediately reinstalled. This is allowed data from the end of the event to be captured. Only data associated with these events will be presented here, as the other pH and EC values are worthless since there was no water flowing over the probes. The total flow for the three events (Fig. 14a) is equivalent to 54, 38, 19 and 10 mm respectively for the 6, 3, 1 and control plots. The pH is generally higher in the slotted treatments compared to the control (Fig. 14b) but only the last event can be used for comparison as this was the only time that all 4 treatments were flowing. The EC is more variable but shows in the last event that the control was greater than the 1 m slot (Fig. 14c).
18

F Tcadir
Tsm3Tv
igure 13. Harvesting at the site on 6/9/2002.
he water samples were tested for pH, Fe, Al, Cl and SO4. The acidity of the water was alculated on the basis of both the iron (Fe) and aluminium (Al) concentrations as well s the pH following Cook et al., (2000). The Cl:SO4 ratio is used as a means of etermining the origin of the sulfate in the water, with a ratio less that 2 being a clear ndication of a pyrite or mineral source (Mulvey, 1996). The ratio for all events shows a atio that is always less that 2 indicating the source is from pyrite (Fig. 15).
he acidity of the discharge water shows that the most acidity is discharged by the 6 m lot treatment and this is mainly due to iron (Fig. 16). However, this site also had the ost discharge. Expressing the discharge as a concentration with volume gives 51, 46,
7 and 38 mol acidity ha-1 mm-1 respectively for the control, 1, 3 and 6 m slot treatments. his suggests that there might have been a treatment effect, but with such low discharge olumes especially for the control treatment this is only tentative.
19

Figure 14. Cumulative flow, pH and EC for all treatments during the 3 events.
aFl
ow (m
3 )
0
100
200
300
400
6 m 3 m 1 mControl
b
pH
3
4
5
6
7
8
6 m 3 m 1 m Control
c
Time
01/01/01 01/05/01 01/09/01 01/01/02 01/05/02 01/09/02
Elec
tric
al C
ondu
ctiv
ity (d
S m
-1)
0
5
10
15
206 m 3 m 1 m Control
20

F
Fmt
igure 15. Cl:SO4 ratio for water samples from the treatments during the three events.
TimeMar/01 Jul/01 Nov/01 Mar/02 Jul/02 Nov/02
Cl:S
O4
0.6
0.8
1.0
1.2
1.4
1.6
6 m3 m1 mControl
d
Time
Mar/01 Jul/01 Nov/01 Mar/02 Jul/02 Nov/02
c
Time
Mar/01 Jul/01 Nov/01 Mar/02 Jul/02 Nov/02
Acid
ity (m
ol H
+ ha-1
)
0
500
1000
1500
2000
2500
3000
a
Acid
ity (m
ol H
+ ha-1
)
0
500
1000
1500
2000
2500
3000
Fe
Al
H+
b
igure 16. Cumulative acidity with time for a) control, b) 1 m slot, c) 3 m slot and d) 6 slot treatments. The components of the acidity, Fe, Al and H+ are shown. H+ in all
reatments is a very small proportion of the acidity.
21

COMMUNICATIONS Throughout the period of the trail communication to transfer this technology to cane growers, other managers of acid sulfate soils and other stakeholders was undertaken. The communications undertaken are listed below.
1. The project was opened on February 20th 2001 with about 30 local cane growers attending as well as the local newspapers. Interviews were given with ABC radio national and with Channel Nine News (Gold Coast).
2. A brochure on the slotting method was produced and widely distributed. 3. A joint workshop with the Vetiver project on 24th April 2002 attended by 50
people. 4. A paper was presented at the 4th Environmental conference by Allan Lush (Cook
et al., 2002). 5. 5th International Acid Sulfate Soils Conference field trip on 28th August 2002, 60
delegates, plus ABC radio (local) and Channel Nine News (Gold Coast) visited the site.
6. The site was included on the tour of the Biennial National Coast to Coast conference on 6th November 2002, with 20 delegates visiting the site.
7. During the project period Dr Cook has received numerous phone calls from parties interested in using the technique. These range from diary farmers in NSW to the Maroochydore Shire Council.
DISCUSSION This trial has produced positive outcomes with regard to demonstrating that lime slots can be successfully made. The data generated on both the soil chemistry and physical properties are a valuable resource. The chemistry data show the already large amount of acidity that is stored in the soil profile at this site and the enormous potential to produce more. Thus techniques like the one trialled here will be vital in the future to mitigate the effects of these soils on the surrounding environment. The results on the discharge of acidity from this site suggest that the lime slots may have been successful in reducing the acidity, but there is too little data to have any confidence in the results. This lack of data resulted from unusually dry climatic conditions that resulted in very little discharge during the trial. This trial has, in a narrow sense, not achieved all its objectives, as the lime slotting technique has not been fully tested due to the climatic conditions that prevailed. This has highlighted the problems of such trials where the results are contingent upon the weather.
CONCLUSION This trial has shown that lime slots can be easily installed in acid sulfate soils. The effectiveness of these is still not conclusively known. The soil data gained during this trial will be a valuable resource into the future for determining the behaviour of acid sulfate soils. The lime slotting technique was communicated widely during the time of the project.
22

ACKNOWLEDGEMENTS The authors would like to thank Environment Australia (NHT project), Gold Coast City Council, QDNR&M, DML Lime and L. & K. Mischke. REFERENCES Cook, F. J., Hicks, W., Gardner, E. A., Carlin, G. D., and Froggatt, D. W. (2000). Export of acidity in
drainage water from acid sulphate soils. Marine Pollution Bulletin 41, 319-326.
Cook, F. J. and Gardner, E. A. (2001). Prediction and management of acidity production and export from acid sulphate soils used for sugar production. SRDC Project DNR004, Final Report, June 2001. 326p.
Cook, F.J., Dobos, S., Carlin, G.D. and Millar, G.E. (2003). Oxidation rate of pyrite in acid sulfate soils: In situ measurements and modelling. Proceedings of International Acid Sulfate Soils Conference, Aust. J. Soil Res., (Submitted)
Cresswell, H. P. and McKenzie, N. J. (1995). Chapter 4.4. Laboratory determination of hydraulic conductivity. In Australian soil and land survey handbook series vol. 5: Soil physical measurements and interpretation for land evaluation. Coughlan, K. J., McKenzie, N. J., MacDonald, W. S. and Cresswell, H. P. (eds), CSIRO Publishing, Collingwood, Victoria, Australia, pp.150-162.
McKenzie, N. J. and Cresswell, H. P. (1995). Chapter 2. Field sampling. In Australian soil and land survey handbook series vol. 5: Soil physical measurements and interpretation for land evaluation. Coughlan, K. J., McKenzie, N. J., MacDonald, W. S. and Cresswell, H. P. (eds), CSIRO Publishing, Collingwood, Victoria, Australia, pp.11-34.
Raupach, M. R. (1991). Evaporation by irrigated eucalypt plantations. Canberra: CSIRO Centre for Environmental Mechanics, Ocassional Report O25, 17p.
Rassam, D. W. and Cook, F. J. (2002). 2. Numerical simulations of water flow and solute transport applied to acid sulfate soils. Journal of Irrigation and Drainage Engineering 128, 107-115.
Sammut, J., Mellville, M.D., Callinan, R.B. and Fraser, G.C. (1995). Estuarine acidification: Impacts on aquatic biota of draining acid sulfate soils. Australian Geographical Studies 33, 89-100.
Wilson, B. P., White, I., and Melville, M. D. (1999). Floodplain hydrology, acid discharge and change in water quality associated with a drained acid sulfate soil. Marine and Freshwater Research 50, 149-157.
van Genuchten, M. Th. (1980). A closed-form equation for predicting the hydraulic conductivity of unsaturated soils. Soil Sci. Soc. Am. J. 44:892-898.
van Genuchten, M. Th., Lei, F. J. and Yates, S. R. (1991). The RETC code for quantifing the hydraulic functions of unsaturated soils, Version 1.0. EPA Report 600/2-91/065, U.S. Salinity Laboratory, USDA, ARS, Riverside, California.
Watling, K. M., Adams, J. J., Smith, C. D. and Ahern, C. R. (2002). A novel method of controlling acid discharge in drainage water using lime slots. Progress Report 1&2 – Stage 1 & 2. Queensland Department of Natural Resourses and Mines, Queensland Acid Sulfate Soils Investigation Team (QASSIT). 16p + appendices.
Watling, K. M., Adams, J. J., Smith, C. D. and Ahern, C. R. (2003). A novel method of controlling acid discharge in drainage water using lime slots. Progress Report 3 – Stage 3. Queensland Department of Natural Resourses and Mines, Queensland Acid Sulfate Soil Investigation Team (QASSIT). 15p + appendices.
23