novel, low-cost, cfrp pressure vessel design for hydrogen
TRANSCRIPT

Novel, Low-Cost, CFRP Pressure
Vessel Design for Hydrogen Fuel
Cell Applications
Nyasha Nigel Mawire
Dissertation presented for the Degree of
Master of Science in Engineering
in the Department of Mechanical Engineering
Faculty of Engineering and the Built Environment
University of Cape Town
24 June 2019
Univers
ity of
Cap
e Tow
n

The copyright of this thesis vests in the author. No quotation from it or information derived from it is to be published without full acknowledgement of the source. The thesis is to be used for private study or non-commercial research purposes only. Published by the University of Cape Town (UCT) in terms of the non-exclusive license granted to UCT by the author.
Univers
ity of
Cap
e Tow
n

i

Plagiarism declaration
I, Nyasha Nigel Mawire, hereby:
a) grant the University of Cape Town free license to reproduce this dissertation in whole or in
part, for research;
b) declare that:
"I know the meaning of plagiarism and declare that all the work in this document, save for
that which is properly acknowledged, is my own. This dissertation has been submitted to the
Turnitin module and I confirm that my supervisor has seen my report and any concerns
revealed by such have been resolved with my supervisor."
I am now presenting the dissertation for examination for the degree of MSc (Eng) in Mechanical
Engineering.
Nyasha Nigel Mawire
24 June 2019
ii

iii
Abstract
In 2015, the Ascension III water rocket shattered the previous long-standing world record of 633 m
after reaching an altitude of 835 m. This feat was primarily attributed to the design of the Carbon Fibre
Reinforced Plastic (CFRP) pressure vessel portion of the rocket. The pressure vessel was composed on
a long, thin-walled commercial CFRP cylindrical tube that had two Poly Vinyl Chloride (PVC) end caps
bonded onto either end with an adhesive. The inside wall of the CFRP tube was coated with a thin
rubber liner to prevent leakage through the tube wall of the pressurised air-water mixture that
provided the necessary thrust for the rocket. The outcome was that the CFRP pressure vessel design
was thus, novel, low-cost and lightweight with the potential to be used in other gas storage
applications for example in Hydrogen Fuel Cell (HFC) applications. This report details the research
aimed at identifying the feasibility and suitability of the proposed CFRP pressure vessel concept for
high pressure hydrogen gas storage for use in Hydrogen Fuel Cell Powered Vehicles (HFCPVs).
The primary component of the pressure vessel to be designed was the CFRP tube which was to be
commercially filament wound using carbon fibre and epoxy resin. With an angle ply laminate structure
for the CFRP tube, an optimal fibre winding angle of 50o was initially chosen to maximise the burst
pressure. The stress analysis and strain behaviour of the CFRP tube were modelled using the Classical
Lamination Theory. Specimens were made using the same CFRP material as the tube and were tensile
tested to give an initial set of approximate properties to be used in the design calculations. The distinct
geometrical features of the end cap were designed, and Aluminium 6082-T6 was selected as a suitable
material for its construction as it was easy to machine while it also possessed desirable mechanical
properties. SpaBond 340 LV epoxy adhesive was used to bond the end caps onto the ends of the CFRP
tube.
A number of specimen CFRP pressure vessels were constructed with the inclusion of the rubber liner.
Hydrostatic burst tests were performed on specimen vessels with different wall thicknesses (2 mm
and 4 mm) to determine the pressure at which each type of vessel would fail. However, only the 2 mm
vessels experienced failure of the CFRP tube section as the predominant failure mode while most 4
mm vessels failed by shearing of the interface between the adhesive layer and end cap. According to
the ASME Boiler and Pressure Code Section X, the maximum design pressures at which the CFRP
pressure vessels could operate at were at most, 2.25 times smaller than the respective failure
pressures. The maximum design pressures were thus determined to be 147 bar and 182 bar for the 2
mm and 4 mm CFRP pressure vessels respectively.
The specimen pressure vessels were also fitted with strain gauges on the external cylindrical surface
of the CFRP tubes to measure the longitudinal and hoop strain during the burst tests. The strain
measurements allowed the deformation behaviour of the CFRP tubes to be modelled which would
prove useful for designing further CFRP tubes. For all specimen CFRP pressure vessels, it was observed
that the deformation response of the CFRP tubes were linear up until a certain pressure. Beyond that
point, a decrease in stiffness was observed which suggested that some form of irreparable damage
had commenced. Other specimen CFRP pressure vessels were constructed and underwent hydraulic
proof testing at 1.25 times the design pressure for 30 minutes and at the design pressure for a further
24 hours. The objective was to assess if the pressure vessels were durable and reliable of which all
tested specimen vessels passed successfully. The hydraulic proof test results seemingly suggested that
the rubber liner could adequately prevent leakage of water from the vessels at their design pressures.
The long-term gas leak test was performed at the design pressure using air (i.e. a compressible fluid)
on the proof tested pressure vessels to detect and localize any leaks for a duration of up to 72 hours.

iv
However, the leak rates were determined to be at least an order of magnitude larger than the
recommended leak rate for hydrogen gas storage vessels. The leak test results strongly suggested that
the rubber liner was insufficient to prevent air molecules from escaping the vessel, was not durable
for repeated use and thus, not suitable for long-term gas storage. Therefore, it was concluded that
the novel CFRP pressure vessel design concept was not yet suitable for hydrogen gas storage, but with
improvements, could still prove possible for use in HFCPVs. Further work into these improvements
could include improving the end cap design and testing other rubber liners.

v
Acknowledgements
There are numerous individuals and entities that all had a role to play in the completion of this
dissertation, but I would like to award special thanks to the following:
God for the opportunity to pursue my postgraduate studies and for His guidance during these past
two years.
My supervisor, Associate Prof Chris von Klemperer for the guidance, wisdom, patience, knowledge
and assistance he shared towards my research as well as other important aspects of my life.
The UCT RCIPS Pre-seed Fund for providing the funding for my research and Prof Arnaud Malan of the
Industrial CFD group for providing funds towards my tuition and other expenses.
My mom, sister and my girlfriend for their love and crucial support material or otherwise during these
past two years. Outside my research pursuits, they have always been people I would count on in my
time of need.
Prof Rob Knutsen, Soraya von Willingh, Penny Louw and fellow postgraduate students at CME who
made my stay there memorable and worthwhile.
In other supporting roles I would also like to thank the following individuals for the roles that they
played towards my research:
Gavin Doolings for driving me to and from Paarden Eiland safely during the time I was
performing my tests.
Willie Slaverse and George du Plessis for their help in configuring my equipment and applying
strain gauges onto specimen CFRP pressure vessels.
Pierre Smith for ensuring my components were made in workshop on time without any
problems and for lending me tools from time to time.
Prof Genevieve Langdon and Dr Steeve Chung for allowing me access to the BISRU blast
chamber to conduct my long-term leak tests.
Executive Safety Services for allowing me the chance to use their hydrostatic pump for burst
testing.

vi
Table of Contents
Plagiarism declaration………………………………………………………………………………………………………………………..i
Abstract……………………………………………………………………………………………………………………………………………..ii
Acknowledgements…………………………………………………………………………………………………………………………..iv
List of figures…………………………………………………………………………………………………………………………………….ix
List of tables…………………………………………………………………………………………………………………………………….xii
List of abbreviations……………………………………………………………………………………………………………………….xiv
1. Introduction .................................................................................................................................. 1
1.1 Background information .......................................................................................................... 1
1.2 Plan of development ................................................................................................................ 4
2. Literature review ........................................................................................................................... 5
2.1 Hydrogen fuel cell technology .................................................................................................. 5
2.1.1 Hydrogen fuel cell ............................................................................................................. 5
2.1.2 Hydrogen as a fuel ............................................................................................................ 5
2.1.3 Applications of HFCT ......................................................................................................... 6
2.1.4 Hydrogen storage methods ............................................................................................... 6
2.2 Gas storage pressure vessels .................................................................................................. 10
2.2.1 Types of pressure vessels ................................................................................................ 10
2.2.2 Pressure vessel heads ..................................................................................................... 11
2.2.3 Pressure vessel codes ...................................................................................................... 12
2.2.4 Hydrogen gas storage pressure vessels............................................................................ 13
2.2.5 Testing of pressure vessels .............................................................................................. 16
2.2.6 Stress determination for a cylindrical pressure vessel ...................................................... 16
2.3. Carbon Fibre Reinforced Plastic Composites.......................................................................... 19
2.3.1 Applications of CFRP ....................................................................................................... 19
2.3.2 Types of carbon fibre fabric ............................................................................................. 19
2.3.3 Manufacturing methods for CFRP composites ................................................................. 21
2.3.4 Strength analysis of composites ...................................................................................... 22
2.4 Novel, low-cost CFRP pressure vessel ..................................................................................... 42
2.4.1 Background ..................................................................................................................... 42
2.4.2 Description of patent ...................................................................................................... 42
3. Design and manufacture of the CFRP pressure vessel .................................................................. 45
3.1 CFRP tube design ................................................................................................................... 45

vii
3.1.1 Manufacturing ................................................................................................................ 45
3.1.2 Laminate stacking arrangement ...................................................................................... 45
3.1.3 Stress analysis for the CFRP tube ..................................................................................... 46
3.1.4 Optimization of filament winding angle ........................................................................... 51
3.2 End cap design ....................................................................................................................... 52
3.2.1 Geometrical features of the end cap ............................................................................... 53
3.2.2 Material selection ........................................................................................................... 54
3.2.3 Stress analysis for the end cap......................................................................................... 56
3.2.4 Design iterations ............................................................................................................. 62
3.2.5 End cap manufacturing ................................................................................................... 67
3.3 Rubber liner ........................................................................................................................... 67
3.3.1 Liner application method ................................................................................................ 67
3.3.2 Thickness of the rubber liner ........................................................................................... 69
3.4 Assembling the pressure vessel .............................................................................................. 70
3.5 Summary of the design and manufacture of the CFRP pressure vessel ................................... 71
4. Testing methodology ................................................................................................................... 72
4.1 Determination of mechanical properties of the CFRP laminate structure ............................... 72
4.1.1 Description...................................................................................................................... 72
4.1.2 Geometry of the specimens ............................................................................................ 73
4.1.3 Manufacturing the specimens ......................................................................................... 74
4.1.4 Mechanical testing procedure ......................................................................................... 75
4.2 End cap adhesive shear tests ................................................................................................. 75
4.2.1 Description...................................................................................................................... 75
4.2.2 Specimen preparation ..................................................................................................... 77
4.2.3 Adhesive shear test procedure ........................................................................................ 78
4.3 Pressure tests ........................................................................................................................ 78
4.3.1 Burst pressure test .......................................................................................................... 78
4.3.2 Hydraulic proof pressure test .......................................................................................... 85
4.3.3 Leak pressure test ........................................................................................................... 86
4.4 Summary of the testing methodology .................................................................................... 88
5. Results and discussion ................................................................................................................. 89
5.1 Tensile tests of the CFRP specimens ....................................................................................... 89
5.1.1 Results ............................................................................................................................ 89
5.1.2 Discussion of the tensile test results ................................................................................ 94
5.2 End cap adhesive shear .......................................................................................................... 94
5.2.1 First Test ......................................................................................................................... 94

viii
5.2.2 Second test ..................................................................................................................... 96
5.2.3 Third test ........................................................................................................................ 99
5.3 Hydrostatic burst pressure tests........................................................................................... 100
5.3.1 First set of CFRP pressure vessels .................................................................................. 101
5.3.2 Second set of CFRP pressure vessels .............................................................................. 106
5.4 Hydraulic proof test ............................................................................................................. 115
5.4.1 Results .......................................................................................................................... 115
5.4.2 Discussion ..................................................................................................................... 116
5.5 Long term gas leak testing ................................................................................................... 116
5.6.1 Results .......................................................................................................................... 116
5.6.2 Discussion of the results ................................................................................................ 118
5.7 Analysis of CFRP pressure vessel design based on experimental results................................ 119
5.7.1 CFRP material properties ............................................................................................... 120
5.7.2 End cap design .............................................................................................................. 122
5.7.3 Rubber liner .................................................................................................................. 122
5.8 Optimisation of the filament winding angle.......................................................................... 123
5.9 Cost of the novel CFRP pressure vessel ................................................................................ 124
5.10 Summary of the results and discussion............................................................................... 124
6. Conclusions and recommendations ........................................................................................... 127
6.1 Conclusions.......................................................................................................................... 127
6.1.1 End cap ......................................................................................................................... 127
6.1.2 CFRP tube ..................................................................................................................... 127
6.1.3 Rubber liner .................................................................................................................. 128
6.2 Recommendations ............................................................................................................... 128
6.2.1 End cap design .............................................................................................................. 128
6.2.2 CFRP tube ..................................................................................................................... 129
6.2.3 Rubber liner .................................................................................................................. 129
7. References ................................................................................................................................ 130
Appendix A: CFRP tubes................................................................................................................. 139
1. Stress calculations.................................................................................................................. 140
2. Strain measurements ............................................................................................................. 144
2.1 First set of CFRP pressure vessels ..................................................................................... 144
2.2 Second set of CFRP pressure vessels................................................................................. 145
Appendix B: Detailed End Cap Drawings ........................................................................................ 149
1.1 First end cap design ............................................................................................................. 150
1.2 Second end cap design ......................................................................................................... 153

ix
1.3 Third end cap design ............................................................................................................ 156
Appendix C: Leak rate calculations ................................................................................................. 159
Appendix D: Material and product data sheets .............................................................................. 161
Appendix E: Detailed costs associated with the novel CFRP pressure vessels and Type IV pressure
vessels ........................................................................................................................................... 162

x
List of figures
Figure 1.1: The Ascension III water rocket before launch [2] .............................................................. 1
Figure 1.2: Payload and nose cone of Ascension III prior to launch [1] ............................................... 1
Figure 1.3: Partially assembled payload frame for test rocket [1] ....................................................... 2
Figure 1.4: Schematic of the cross-sectional view of the CFRP pressure vessel derived from the water
rocket [5]........................................................................................................................................... 2
Figure 2.5: Comparison of gravimetric energy densities and volumetric energy densities for several
fuels.[17] ........................................................................................................................................... 6
Figure 2.6: Illustration of the different methods of storing hydrogen [17] .......................................... 7
Figure 2.7: Typical hemispherical vessel head [48] ........................................................................... 11
Figure 2.8: Typical ellipsoidal vessel head [48] ................................................................................. 12
Figure 2.9: Typical torispherical vessel head [48] ............................................................................. 12
Figure 2.10:Schematic illustrating the structural differences in the Type I, II, III and IV hydrogen gas
storage tanks [26] ............................................................................................................................ 13
Figure 2.11: Type I metallic hydrogen gas storage tanks [63] ........................................................... 14
Figure 2.12: Type IV CFRP filament-wound tank [64] ........................................................................ 15
Figure 2.13: Illustration of the stresses induced within a typical cylindrical pressure vessel [73] ...... 17
Figure 2.14: Illustration of all the stresses induced by an internal pressure in a vessel [74] .............. 17
Figure 2.15: Unidirectional fabric [79] .............................................................................................. 20
Figure 2.16: Actual (left) and simplified (right) version of plain weave pattern [85] .......................... 20
Figure 2.17: Actual (left) and simplified (right) version of Twill weave pattern [85] .......................... 21
Figure 2.18: Illustration of the wet filament winding process [93] .................................................... 22
Figure 2.19: Portion of a unidirectional lamina that is being pulled in the 1-direction (along the fibre
direction) [77] ................................................................................................................................. 24
Figure 2.20: Representative portion of a unidirectional lamina being pulled in the 2-direction
(transverse to the fibre direction) [77] ............................................................................................. 26
Figure 2.21: Representative volume element loaded in the direction parallel to the fibres i.e. 1-
direction [77]................................................................................................................................... 27
Figure 2.22: Representative volume element with an in-plane shear stress applied onto it [3] ......... 28
Figure 2.23: A unidirectional lamina [94] ......................................................................................... 29
Figure 2.24: Typical laminate structure[3] ........................................................................................ 30
Figure 2.25: Angled lamina with fibres oriented at an angle, θ, to the x-axis [3] ............................... 33
Figure 2.26: Resultant forces and moments on a lamina[3] .............................................................. 40
Figure 2.27: Cross-sectional view of the CFRP pressure vessel derived from the patent application [5]
........................................................................................................................................................ 43
Figure 3.28: Illustration of the stresses acting on an infinitesimal point on the surface of cylinder
[104] ............................................................................................................................................... 47
Figure 3.29: Graph of the safety factor vs the filament winding angle for each orientation .............. 52
Figure 3.30: Cross-sectional schematic (left) and isometric view (right) of the simple end cap design
employed in the water rocket project [1]......................................................................................... 53
Figure 3.31: Cross-sectional view of one of the ends of the CFRP tube with an end cap secured by
SpaBond 340 LV adhesive ................................................................................................................ 54
Figure 3.32: CFRP tube with the two end caps secured on both ends ............................................... 54
Figure 3.33: Illustration of the types of loading on the end cap ........................................................ 56

xi
Figure 3.34: Schematic of a simple end cap with the respective dimensions .................................... 57
Figure 3.35: Isometric view (left) of a simple circular disc as well as the same disc when secured onto
one of the ends of the CFRP tube (right) .......................................................................................... 58
Figure 3.36: Illustration of the applied forces on the end cap as modelled in the FEA software ........ 60
Figure 3.37: Illustration of the FEA deflection/deformation result for the first end cap design ......... 61
Figure 3.38: Illustration of the FEA stress result for the first end cap design ..................................... 62
Figure 3.39: Schematic of the cross section of first end cap design .................................................. 63
Figure 3.40: Photographs illustrating failure through shear on the surface of the first design of the
end caps .......................................................................................................................................... 63
Figure 3.41 Illustration of the initial application method of the epoxy adhesive onto the first end cap
design ............................................................................................................................................. 64
Figure 3.42: Schematic of the cross section of the second end cap design ....................................... 65
Figure 3.43: Illustration of how the new adhesive application method works with a detailed view of
the flow path of the adhesive from the syringe, through the angled holes into the designated bond
area ................................................................................................................................................. 65
Figure 3.44: Photograph showing the adhesive layer after end cap had been removed.................... 66
Figure 3.45: Schematic showing cross-sectional view of the third end cap design with 2 O-ring
grooves and a knurled bond area surface ........................................................................................ 67
Figure 3.46: Illustration of the rubber application method ............................................................... 68
Figure 3.47: Illustration of the components used in applying the rubber .......................................... 69
Figure 3.48: Cross section of a fully assembled CFRP pressure vessel ............................................... 70
Figure 4.49: Schematic showing the fibre directions in the 0o and 90o CFRP specimens .................... 73
Figure 4.50: Front, top and side views of a typical unidirectional test specimen with tabs stuck on .. 74
Figure 4.51: Representation of the block of wood with two flat sided panels of aluminium glued onto
it ..................................................................................................................................................... 74
Figure 4.52: Shear test setup ........................................................................................................... 76
Figure 4.53: Illustration of the interaction in the forces acting on the end cap and CFRP tube through
the bond ......................................................................................................................................... 76
Figure 4.54: Schematic of the horizontal setup for the pipe network equipment that was to be used
for burst tests. ................................................................................................................................. 79
Figure 4.55: Vertical setup for the actual burst test equipment........................................................ 80
Figure 4.56: A typical strain gauge [122] .......................................................................................... 81
Figure 4.57: A 0o and 90o strain gauge rosette [123] ........................................................................ 81
Figure 4.58: Illustration of the components of a typical strain gauge [123]....................................... 82
Figure 4.59: Strain gauges are configured in Wheatstone bridge circuits to detect small changes in
resistance.[121] ............................................................................................................................... 83
Figure 4.60: Top view of a P-3500 strain indicator............................................................................ 84
Figure 4.61: Schematic of the strain gauge rosette with the gauges oriented at 0O (longitudinal) and
90O (hoop). ...................................................................................................................................... 85
Figure 4.62: Equipment setup for the long-term gas leak pressure test ............................................ 87
Figure 5.63: Graph of the longitudinal stress against the strain of the CFRP specimens along the 0o
direction (longitudinal direction) ..................................................................................................... 91
Figure 5.64: Photograph of a failed 0o tensile test specimen with a crack along the fibre direction .. 92
Figure 5.65: Photograph of a failed 0o tensile test specimen with two failure modes ....................... 92

xii
Figure 5.66: Graph of the transverse stress against the strain of the CFRP specimens along the 90o
direction (transverse direction) ....................................................................................................... 93
Figure 5.67: Photograph of a failed 90o tensile test specimen .......................................................... 93
Figure 5.68: Graph showing the results for the first shear test ......................................................... 95
Figure 5.69: Photograph of an example of a specimen that failed due to shear during the first set of
tests ................................................................................................................................................ 96
Figure 5.70: Graph showing the results for the second shear test .................................................... 97
Figure 5.71: Photograph of a failed specimen from the second shear test........................................ 98
Figure 5.72: Graph showing the results of the third shear test ....................................................... 100
Figure 5.73: Photograph showing shear failure between the end cap (i.e. first design) to adhesive
layer interface for vessel 1 ............................................................................................................. 102
Figure 5.74: Photograph showing void formation on the adhesive layer after shear failure of vessel 1
during a burst test ......................................................................................................................... 102
Figure 5.75: Photograph showing multiple modes of failure of the adhesive layer on both interfaces
for vessel 3 .................................................................................................................................... 103
Figure 5.76: Graph of the longitudinal strain vs the pressure for the first set of CFRP pressure vessels
...................................................................................................................................................... 104
Figure 5.77: Graph of the hoop strain vs the pressure for the first set of CFRP pressure vessels ..... 104
Figure 5.78: Visual representation of the deformation observed on of the 2 mm CFRP vessels before
failure............................................................................................................................................ 107
Figure 5.79: Photograph showing failure due to delamination between the adhesive to CFRP tube
wall interface ................................................................................................................................ 108
Figure 5.80: Photograph showing shear failure on the end cap to adhesive layer interface for a 4 mm
vessel ............................................................................................................................................ 108
Figure 5.81: Photograph showing multiple modes of failure modes for a 4 mm CFRP pressure vessel
...................................................................................................................................................... 109
Figure 5.82: Graph of longitudinal strain vs pressure for five 2 mm vessels from the second set .... 111
Figure 5.83: Graph of hoop strain vs pressure for five 2 mm vessels from the second set .............. 111
Figure 5.84: Graph of longitudinal strain vs pressure for five 4 mm vessels from the second set .... 112
Figure 5.85: Graph of hoop strain vs pressure for all five 4 mm vessels from the second set .......... 113
Figure 5.86: Photograph of the cross section of a 2 mm CFRP pressure vessel used during the
hydraulic proof tests...................................................................................................................... 115
Figure 5.87: Photograph showing bubbling of the soapy water solution at one of the ends of a CFRP
pressure vessel .............................................................................................................................. 117
Figure 5.88: Photograph of the cross section of a 2 mm CFRP pressure vessel used during the long
term leak tests .............................................................................................................................. 117
Figure 5.89: Photograph showing the region near the bottom end cap in greater detail ................ 118
Figure 5.90: Schematic illustrating what likely occurred at the interface between the end cap and
CFRP tube during the long-term gas leak test ................................................................................ 119
Figure 5.91: Graph comparing the expected burst pressures for various filament winding angles using
the four failure theories for the 2 mm thin pressure vessel ............................................................ 123
List of tables
Table 2.1: FCTO proposed targets for hydrogen storage methods for 2020 [17] ................................. 9
Table 2.2: Comparison of the working pressures for the types of hydrogen storage vessels [65] ...... 15
Table 2.3: Pressure tests for prototype FRP pressure vessels ........................................................... 16

xiii
Table 2.4: Features of the CFRP pressure vessel ............................................................................... 43
Table 3.5: Initial material property values for the CFRP composite material ..................................... 48
Table 3.6: Ultimate strength values for the CFRP tube for each orientation of loading ..................... 50
Table 3.7: Typical costs of the different materials as quoted from the CES Edupack software [108] . 55
Table 3.8: Aluminium 6082-T6 mechanical properties [109] ............................................................ 55
Table 3.9: Dimensions of the end cap and other properties ............................................................. 57
Table 3.10: Design variables for sizing and analysing the stresses on the end cap ............................ 59
Table 4.11: Recommended vs actual tensile test specimen dimensions according to ASTM
D3039/D3039M ............................................................................................................................... 73
Table 4.12: Similarities and differences in the 3 sets of shear test specimens .................................. 78
Table 4.13: Steel strain gauge rosette specifications ........................................................................ 83
Table 4.14: The design and proof pressures for the two different vessels ........................................ 86
Table 5.15: Supplied mechanical property values for the carbon fibre [117] and the epoxy resin [101]
........................................................................................................................................................ 89
Table 5.16: Theoretical property values of the CFRP material .......................................................... 89
Table 5.17: Tensile test results for the 0o specimens ........................................................................ 90
Table 5.18: Tensile test results for the 90o specimens ...................................................................... 92
Table 5.19: First end cap adhesive shear test results ........................................................................ 95
Table 5.20: Second adhesive shear test results ................................................................................ 97
Table 5.21: Failure pressures, maximum design pressure and modes for the first set of CFRP pressure
vessels ........................................................................................................................................... 101
Table 5.22: Predicted burst pressures for 4 mm CFRP tube using the initial estimate strength
properties ..................................................................................................................................... 101
Table 5.23: Failure pressures and modes for the 2mm CFRP pressure vessels ................................ 106
Table 5.24: Initial predictions of the burst pressures for the 2 mm CFRP vessels using the initial
strength properties ....................................................................................................................... 107
Table 5.25: Failure results of the five 4 mm CFRP pressure vessels................................................. 109
Table 5.26: Predicted burst pressures for 4 mm CFRP tube using the initial strength properties from
the tensile tests ............................................................................................................................. 110
Table 5.27: The respective design and proof pressures of the 2 mm and 4 mm CFRP pressure vessels
...................................................................................................................................................... 115
Table 5.28: Long term gas leak test result for the CFRP pressure vessels ........................................ 116
Table 5.29: First set of the updated stiffness property values for the CFRP tube ............................ 120
Table 5.30: Second set of updated stiffness property values of the CFRP tubes.............................. 120
Table 5.31: Second predictions of burst pressures for the 2 mm CFRP vessels using updated strength
properties ..................................................................................................................................... 121
Table 5.32: Updated strength property values based on the 2 mm CFRP vessel’s burst test compared
to the initial values from the tensile tests ...................................................................................... 121
Table 5.33: Predicted burst pressures for the 2 mm CFRP vessels using the updated strength
properties ..................................................................................................................................... 122
Table 5.34: Optimal winding angles for the different failure theories based on the 2 mm thin
pressure vessels ............................................................................................................................ 124

xiv
List of abbreviations
ASME American Society of Mechanical Engineers
ASTM American Society of Testing and Manufacturing
CFRP Carbon Fibre Reinforced Plastic
CNC Computer Numeric Control
FRP Fibre Reinforced Plastic
HFC Hydrogen Fuel Cell
HFCT Hydrogen Fuel Cell Technology
HFCPV Hydrogen Fuel Cell Powered Vehicle
ICE Internal Combustion Engine
NDE Non-Destructive Test
PVC Poly Vinyl Chloride
UD Unidirectional
UTS Ultimate Tensile Strength

1
1. Introduction
1.1 Background information A group of undergraduate mechanical engineering students led by Stuart Swan designed, built and
tested a novel water powered rocket at the University of Cape Town in 2015. They worked as part of
the Industrial CFD group under Prof Arnaud Malan. The water rocket called the Ascension III, on its
maiden flight, ascended to an altitude of 835 m which broke the previous world record (for the highest
altitude reached) of 623 m by a margin of 212 m (i.e. 30%) [1].
Figure 1.1: The Ascension III water rocket before launch [2]
The Ascension III as shown in Figure 1.1 measured approximately 2.68 m in length and yet weighed
less than 1.5 kg in mass as it was wholly made from non-metallic materials. At the top end of the
rocket was the payload as shown in Figure 1.2. The payload contained an on-board flight computer,
camera and a parachute which would be deployed to recover the rocket after it reached the apogee.
Figure 1.2: Payload and nose cone of Ascension III prior to launch [1]
Payload
Nose cone

2
Figure 1.3 is a photograph of the payload with the nose cone removed.
Figure 1.3: Partially assembled payload frame for test rocket [1]
The main component of the water rocket was the pressure vessel as shown in the drawing in Figure
1.4. It had a long thin-walled commercial filament wound CFRP cylindrical tube. These tubes are
usually used in aerospace and ship-building industries for applications such piping networks [3,4].
Closing off and bonded to the two ends of the long CFRP tube, were two end caps (one with a nozzle
and one without) both machined on a CNC lathe from Poly Vinyl Chloride (PVC) material. The pressure
vessel would contain an air-water mixture (with 80% air and 20% water) held at 100 bar for 10 minutes
before launching the rocket. The release of the pressurised mixture through the end cap with the
nozzle provided the thrust required to propel the rocket upwards. Previous attempts to pressurise the
CFRP pressure vessel hydrostatically during burst testing had resulted in leaking through the CFRP
tube wall. This led Stuart to develop an innovative method of lining the inside wall of the CFRP tube
with a thin rubber layer which proved successful in sealing the vessel and resulted in a patent
application [5] being filed.
Figure 1.4: Schematic of the cross-sectional view of the CFRP pressure vessel derived from the water rocket [5]
End cap 2
CFRP cylindrical pipe End cap 1 (with a nozzle)
On-board computer (Altus Metrum TeleMetrum Altimeter)
Nozzle
3
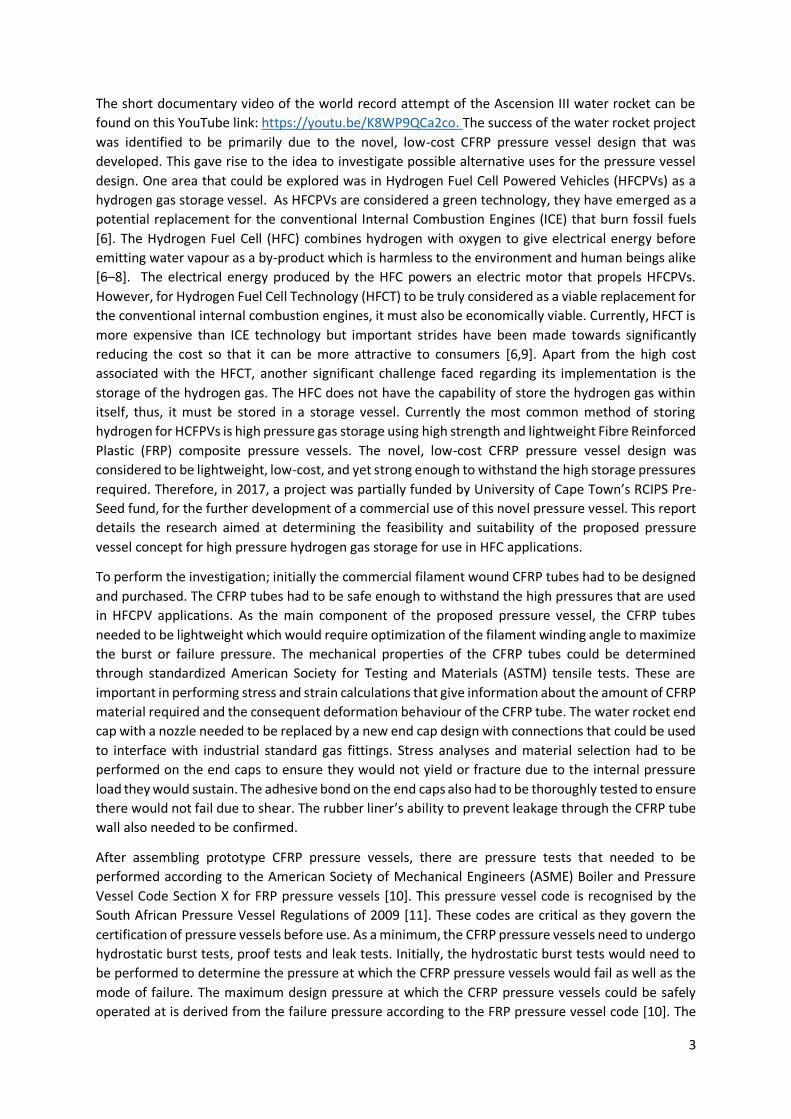
The short documentary video of the world record attempt of the Ascension III water rocket can be
found on this YouTube link: https://youtu.be/K8WP9QCa2co. The success of the water rocket project
was identified to be primarily due to the novel, low-cost CFRP pressure vessel design that was
developed. This gave rise to the idea to investigate possible alternative uses for the pressure vessel
design. One area that could be explored was in Hydrogen Fuel Cell Powered Vehicles (HFCPVs) as a
hydrogen gas storage vessel. As HFCPVs are considered a green technology, they have emerged as a
potential replacement for the conventional Internal Combustion Engines (ICE) that burn fossil fuels
[6]. The Hydrogen Fuel Cell (HFC) combines hydrogen with oxygen to give electrical energy before
emitting water vapour as a by-product which is harmless to the environment and human beings alike
[6–8]. The electrical energy produced by the HFC powers an electric motor that propels HFCPVs.
However, for Hydrogen Fuel Cell Technology (HFCT) to be truly considered as a viable replacement for
the conventional internal combustion engines, it must also be economically viable. Currently, HFCT is
more expensive than ICE technology but important strides have been made towards significantly
reducing the cost so that it can be more attractive to consumers [6,9]. Apart from the high cost
associated with the HFCT, another significant challenge faced regarding its implementation is the
storage of the hydrogen gas. The HFC does not have the capability of store the hydrogen gas within
itself, thus, it must be stored in a storage vessel. Currently the most common method of storing
hydrogen for HCFPVs is high pressure gas storage using high strength and lightweight Fibre Reinforced
Plastic (FRP) composite pressure vessels. The novel, low-cost CFRP pressure vessel design was
considered to be lightweight, low-cost, and yet strong enough to withstand the high storage pressures
required. Therefore, in 2017, a project was partially funded by University of Cape Town’s RCIPS Pre-
Seed fund, for the further development of a commercial use of this novel pressure vessel. This report
details the research aimed at determining the feasibility and suitability of the proposed pressure
vessel concept for high pressure hydrogen gas storage for use in HFC applications.
To perform the investigation; initially the commercial filament wound CFRP tubes had to be designed
and purchased. The CFRP tubes had to be safe enough to withstand the high pressures that are used
in HFCPV applications. As the main component of the proposed pressure vessel, the CFRP tubes
needed to be lightweight which would require optimization of the filament winding angle to maximize
the burst or failure pressure. The mechanical properties of the CFRP tubes could be determined
through standardized American Society for Testing and Materials (ASTM) tensile tests. These are
important in performing stress and strain calculations that give information about the amount of CFRP
material required and the consequent deformation behaviour of the CFRP tube. The water rocket end
cap with a nozzle needed to be replaced by a new end cap design with connections that could be used
to interface with industrial standard gas fittings. Stress analyses and material selection had to be
performed on the end caps to ensure they would not yield or fracture due to the internal pressure
load they would sustain. The adhesive bond on the end caps also had to be thoroughly tested to ensure
there would not fail due to shear. The rubber liner’s ability to prevent leakage through the CFRP tube
wall also needed to be confirmed.
After assembling prototype CFRP pressure vessels, there are pressure tests that needed to be
performed according to the American Society of Mechanical Engineers (ASME) Boiler and Pressure
Vessel Code Section X for FRP pressure vessels [10]. This pressure vessel code is recognised by the
South African Pressure Vessel Regulations of 2009 [11]. These codes are critical as they govern the
certification of pressure vessels before use. As a minimum, the CFRP pressure vessels need to undergo
hydrostatic burst tests, proof tests and leak tests. Initially, the hydrostatic burst tests would need to
be performed to determine the pressure at which the CFRP pressure vessels would fail as well as the
mode of failure. The maximum design pressure at which the CFRP pressure vessels could be safely
operated at is derived from the failure pressure according to the FRP pressure vessel code [10]. The

4
proof tests are intended to assess the reliability and durability of the vessels while the leak tests are
meant to detect any leaks. The leak tests are to be performed with a gas at the design pressure of the
vessels and will provide a means to assess the ability of the rubber liner to prevent leakage. Air would
need to be the first gas to be used in the leak tests before using a gas such as Helium which has smaller
gas molecules. Helium gas would also serve as a suitable substitute for hydrogen gas which poses a
significant safety risk for pressure vessel testing.
1.2 Plan of development This report begins with the literature review in Chapter 2. The literature review describes the extensive
background research on HFCT including the HFC, its applications and the methods of hydrogen storage
in current use along with the ensuing challenges. Subsequently, the literature on the gas storage
pressure vessels, their design, uses and testing methods are presented. The third sub-section under
the literature review involves CFRP composite materials including how they are formed, used and
analysed from a stress and strain perspective. The literature review chapter concludes with a
description of the novel, low-cost CFRP pressure vessel concept that will be investigated. Chapter 3
involves the detailed aspects that were deployed in the design of the CFRP pressure vessel and Chapter
4 describes the tests that were performed on the vessels. The results of the tests in Chapter 4 are
presented and discussed in Chapter 5. Chapter 6 articulates the conclusions that were drawn from the
previous chapter(s) before giving recommendations for future use.

5
2. Literature review To be able to design the proposed novel CFRP pressure vessel for hydrogen storage, all its aspects had
to be adequately understood. This involved reviewing research on what has been done in the subject
areas relating to the proposed vessel. The relevant subject areas pertaining to the proposed pressure
vessel include the following:
HFCT.
Gas storage pressure vessels.
CFRP composite materials.
This section delves into the content that is available on these subject areas in greater detail as well as
links them to the proposed CFRP pressure vessel. Furthermore, this section will aim to highlight areas
in previous studies that do not include the aspects of the proposed pressure vessel.
2.1 Hydrogen fuel cell technology This section will initially describe what Hydrogen Fuel Cell Technology (HFCT) entails beginning with
defining a hydrogen fuel cell, how it functions, and what fuels it. Subsequently, hydrogen as a fuel is
discussed highlighting its pros and cons in comparison with conventional fossil-based fuels. The
storage methods currently employed to store hydrogen are then briefly described with emphasis
placed on the methods which pertain to hydrogen fuel cell powered vehicles.
2.1.1 Hydrogen fuel cell A Hydrogen Fuel Cell (HFC) is basically a device that converts the mixture of hydrogen and oxygen gas
into an electric current and water through electrolysis [12, 13]. The oxygen gas can be sourced from
the atmosphere whilst the hydrogen has to be channelled from a storage vessel [12]. Typically, one
HFC produces a small amount of current on its own, so to increase the electrical current (or energy)
output, many are grouped together in series to produce a fuel cell stack [8]. The fuel stack will continue
producing the electrical current so long as the HFCs in the stack are supplied with hydrogen and
oxygen. The appeal of the HFC is derived from the fact that it produces no air pollution as it emits only
water vapour as a by-product [6]. The HFC is becoming an increasing popular candidate to replace the
conventional fossil fuel powered Internal Combustion Engine (ICE) that produces harmful carbon
dioxide emissions [14–16]. There is a desperate need to reduce the carbon dioxide footprint which is
the major cause of global warming by using clean technologies. An example is the HFCPV. However,
there are still challenges associated with the HFC (e.g. cost of the system) that need to be overcome
if it is to become economically viable in HFCPVs [6].
2.1.2 Hydrogen as a fuel Hydrogen is considered a clean energy carrier and as mentioned, is a possible replacement for fossil
based fuels [15, 16]. Hydrogen also has a higher energy content than most fossil fuels for the same
mass of fuel [17] as can be seen in Figure 2.5. For example, hydrogen (120 MJ/kg) has almost three
times the energy content of diesel (43 MJ/kg). On a volume basis, however, the situation is completely
reversed in that hydrogen has an energy density of approximately 8 MJ/L whereas diesel has an energy
density of 36 MJ/L. As a gas at atmospheric conditions, hydrogen contains even less volumetric energy
content than that which is contained in gasoline of the same volume [15]. Hence, while the high
gravimetric energy density of hydrogen makes it a more attractive fuel, it still has the distinct
disadvantage of having a significantly lower volumetric energy density.

6
Figure 2.5: Comparison of gravimetric energy densities and volumetric energy densities for several fuels.[17]
2.1.3 Applications of HFCT Broadly classified, HFCs are being used in stationary, portable and transportation applications [9, 17].
The choice of application is determined by various factors including the efficiency required, start-up
time of the fuel cell and its dynamic behaviour [9]. Stationary applications as the name suggests, refer
to instances where the HFCs used are fixed to one location as they are not designed to be moved.
These applications require high efficiency (80% or higher) and quick tart-up times. An example is in
Combined Heat and Power (CHP) systems usually used in residential areas in parts of Asia and
Uninterruptible Power Systems (UPS) used to provide reliable backup power to grid systems in case
of any disruptions [18]. Portable applications are where the HFCs are used in a more flexible manner
and built into or charge up systems/devices designed to be moved around with relative ease [19].
Portable applications require relatively short start-up times for example in Auxiliary Power Units (APU)
of lower power, small personal electronics and military applications that require off-the-grid
operability [9, 19]. Relative to stationary or transportation applications of the HFC, portable
applications have considerably lower power requirements (generally from 25W – 5kW) as their use is
driven by the need to lower emissions and operating noise whilst efficiency is not a primary concern
per se [9]. Finally, transportation applications are ones where the HFC is integrated into vehicular
propulsion systems that provide power to vehicles [20]. Hydrogen Fuel Cell Powered Vehicles
(HFCPVs) are an example of transport applications and they include light-duty cars, forklifts, buses,
trucks, manned light aircraft, etc [20]. These HFCPVs include zero distributed emissions and better
well-to-wheel efficiency than ICE powered vehicles [9]. HFCPV applications will be the primary focus
of this report.
2.1.4 Hydrogen storage methods Hydrogen storage is considered a key enabling technology for the HFC [17]. Figure 2.6 shows a
simplistic top-down breakdown of the different methods in which hydrogen can be stored in its
different phases of matter. The major categories shown are physical and material-based storage
methods.

7
Figure 2.6: Illustration of the different methods of storing hydrogen [17]
2.1.4.1 Physical-based storage methods
The physical-based storage methods only deal with pure hydrogen in liquid or gaseous form [17].
There is a general consensus amongst various authors that physical storage methods are the most
commonly used and advanced hydrogen storage methods available today for various applications [16,
21-22].
Compressed gas storage
Of the three available physical storage methods, compressed gas storage is the most widely used
particularly in HFCPVs because of its simplicity in design and ease of implementation [16, 21, 23]. For
stationary applications of HFCs, the gas is usually stored at low pressure but in high volumes since
hydrogen gas has a relatively lower volumetric energy density [17]. However, for transport
applications like in HFCPVs, large volume hydrogen tanks are not practical as space is at a premium
[16, 23]. Because of the relatively low volumetric energy density of hydrogen gas, in HFCPVs, the
hydrogen is typically stored at very high pressures that lie in the range of 350-700 bar [15]. The high
pressures involved allow for the increase in gravimetric energy density of the hydrogen gas as more
molecules can be fitted into the pressure vessel. Therefore, the higher the mass of hydrogen gas that
can be stored, the more fuel that can be stored, resulting in a longer driving range for the HFCPV. For
on-board storage of compressed hydrogen gas in HFCPVs, the medium of storage ought to be
lightweight, inexpensive, safe, and take up as little space as possible [15, 21, 23]. The pressure vessels
used to store hydrogen gas are mostly made from high strength Carbon Fibre Reinforced Plastic (CFRP)
composites because of the need to reduce the weight contribution of the pressure vessel whilst not
compromising on the strength of the vessel [16, 21]. Whilst these high strength CFRP composite
vessels are lightweight, they still are expensive to manufacture [24]. The other concern regarding this
storage method is safety, for instance in accidents where hydrogen gas might be exposed to fire which

8
could lead to a catastrophic explosion. On-going research is however, being conducted towards
lowering the costs associated with storing the hydrogen gas within the CFRP composite pressure
vessel [21, 25].
2.1.4.1.2 Liquid hydrogen storage
Liquid hydrogen exists at cryogenic temperatures (around -252°C) at an ambient pressure of 1 bar
[17]. To maintain these cryogenic temperatures, specialist insulation equipment/material is required
[23]. Liquid hydrogen has a higher volumetric energy density than hydrogen gas which lowers the
pressure that is needed to store the liquid hydrogen [17]. However, the amount of energy expended
in cooling the hydrogen to liquid form is at least 30 % of the energy within the hydrogen fuel itself.
Furthermore, this energy requirement is about three times the amount required for compressed
hydrogen storage [26]. In addition, liquid hydrogen evaporates easily which makes it unsuitable for
long term storage and it might pose a safety hazard if the escaped hydrogen is ignited [27]. According
to Zuttel [28], this restricts the possible use of these systems to applications where the cost of
hydrogen is not a major issue and the fuel is expended in a short time, e.g. aerospace applications.
Dublin et al suggest that while storing hydrogen as a liquid would increase the driving range of an
HFCPV, it is unlikely that this method will be suitable for the HFCPVs in the future [23].
2.1.4.1.3 Cryo-compressed storage method
The third method illustrated in figure 2.4 under physical-based storage methods is called cold/cryo-
compressed storage method. This method is a hybrid storage method that combines concepts from
the two previously discussed physical storage methods. It involves cryogenic temperatures similar to
those experienced in the liquid hydrogen storage method, but this method is flexible enough to have
the hydrogen either in gaseous or liquid form [21]. Cryo-compressed hydrogen storage is generally
preferred over the liquid hydrogen method because it is able to overcome the issue of evaporation of
the hydrogen and also because there is less energy expended in cooling the hydrogen compared to
traditional liquid hydrogen storage [23]. Because cooling the hydrogen gas increases the volumetric
energy density of hydrogen, cryo-compressed hydrogen gas has more energy content (about 3 times
more) than that of non-cooled compressed hydrogen gas [23]. However, the additional insulation
required for this method adds significantly to the size, weight and the cost of the storage vessel [29].
This storage method shares the same application areas as the liquid hydrogen storage methods.
However, from a cost perspective at this juncture in time, it is considered to be unsuitable for use in
HFCPV applications [21].
2.1.4.2 Material-based storage methods
Hydrogen can also be stored on the surface of some solids through a process referred to as adsorption
or within solids through another process called absorption in compounds referred to as hydrides [17].
2.1.4.2.1 Adsorption
This is a process that involves the adhesion of molecules of gas, liquid, or dissolved solids to a surface
[30]. In this context, it describes a scenario by which hydrogen gas (H2) molecules are adsorbed onto
the surface of a material [17]. The reverse process to adsorption is referred to as desorption [31]. The
materials used for this process include metal organic frameworks, carbon and other nanostructures
which are commonly referred to as sorbents [16, 23]. Porosity and high surface areas for the
aforementioned materials are required for this method to be effective in storing hydrogen [23]. In
addition, the rate of adsorption also depends on the applied pressure and temperature [32]. “Despite
the reversible nature of the hydrogen adsorption or desorption process for high surface area sorbents
and carbon-based materials, they suffer from lower hydrogen capacity,” according to Hwang et al [16].

9
It is a storage method with decent potential but further research is still required in order to improve
on the shortcomings according to [16, 26, 33].
2.1.4.2.2 Chemical hydrides
A hydride is any class of chemical compound in which hydrogen atoms or molecules are combined
with another element [34]. Metal hydrides often have higher gravimetric and volumetric energy
densities as compared to the physical based storage methods [16, 23, 32]. A few metal hydrides have
the potential for reversible on-board hydrogen storage and the ability to release hydrogen at relatively
low pressures and temperatures (i.e. 1-10 bar and 25-100OC) ideal for the HFC to function optimally
[16, 29]. There also have been extensive studies done on complex hydrides (formed by Group I,II and
III light metals [28]) that have shown high potential to improve on the gravimetric energy density of
hydrogen. However, they still provide a relatively low hydrogen capacity and slow hydrogen uptake
unsuitable for HFCPV systems [16]. Storing hydrogen fuel in chemical hydrides is considered a
relatively safe and efficient storage method [28]. Conversely, for the current HFCPV market, the
volumetric and gravimetric energy densities of the hydrogen produced is low and as such, there is still
some room for improvement through further research into that area [21, 23, 26].
2.1.4.3 Comparison of the hydrogen storage methods
The Fuel Cell Technologies Office (FCTO) as part of the United States Department of Energy (US DOE),
is one of the most recognised and leading organizations in the world that are responsible for
developing regulations regarding on-board automotive hydrogen storage systems. There is a
particular focus on systems that allow for a driving range of more than 300 miles (approximately 480
km) while meeting cost, safety, and performance requirements [17]. In Table 2.1 are the proposed
targets for hydrogen storage methods for 2020 set by the FCTO [17]. The capacities of a storage system
refer to the usable quantity of hydrogen deliverable to the fuel cell system divided by the total mass
(or volume) of the complete storage system, including all stored hydrogen, media, and system
components [17]. The capacities can be expressed in various quantities as shown in table 2.1 above.
The underlying assumption when calculating the gravimetric capacities is that the system has a usable
H2 storage capacity of 5.6 kg which is a benchmark for lightweight vehicles [35]. There are other
targets specified by the FCTO for 2020 which were excluded from the table for example durability and
fuel quality were not included as they are not part of the scope of this report.
Table 2.1: FCTO proposed targets for hydrogen storage methods for 2020 [17]
Storage parameter Unit(s) 2020 Target
1 System Gravimetric Capacity (Net useful energy from hydrogen/maximum system mass)
kWh/kg (kg of H2/kg of system)
1.5 (0.045)
2 System Volumetric Capacity (Net useful energy from hydrogen/maximum system volume)
kWh/L (kg of H2/L of
system)
1.0 (0.03)
3 Storage System Cost (Cost of the fuel)
$/kWh net ($/kg of
H2)
10 (333)
If all the targets in table 2.1 are met by any of the available storage methods, it would allow HFCPVs
to at least compete with conventional ICE powered vehicles from an economic perspective as well as
in terms of driving range. However, the ability to store hydrogen with a sufficiently high energy density
remains a significant challenge for HFCPVs. Currently, none of the available hydrogen storage methods

10
have simultaneously met all of the set requirements proposed by the US DOE [17]. Compressed gas is
the most widely used mature hydrogen storage method in HFCPVs currently according to multiple
sources including [16, 21, 23, 25, 32]. In the short-term, it is the cheapest and easiest storage method
to implement as seen by its use in the Honda Clarity FCX [36], Hyundai Tucson [37] and the Toyota
Mirai [38]. However, it still has some disadvantages associated with it including the cost of the CFRP
pressure vessel which needs to be significantly reduced without compromising on performance and
safety as at least 75 % of the cost is attributed to the carbon fibre material [39]. While liquid hydrogen
offers a higher volumetric energy density than compressed gas, it has problematic issues like boil off
which result in the loss of the useable hydrogen and poses a safety risk [23, 27]. The relatively high
amount of energy required for liquefaction also remains a challenge against the use of liquid hydrogen
in HFCPVs [23]. The cryo-compressed storage method seems to address the boil-off issue for liquid
hydrogen storage method whilst boasting a higher volumetric energy density at lower pressures than
in the compressed hydrogen gas storage method. However, the relatively higher liquefaction energy
as well as the cost and weight of the vessel remain a stumbling block for this method regardless of its
potential in the current market [16, 29]. The two material-based storage methods still fall behind the
physical-based storage methods in terms of ease of implementation and complexity in the short-term
although there seems to be an agreement amongst several sources including [16-17, 25-26], that
chemical hydrides and sorbents are the ideal long-term storage methods. However, Durbin et al [23]
seem to disagree by suggesting that chemical hydrides are not a suitable storage media for on-board
storage of hydrogen fuel in either the short-term or long-term. For this report, compressed gas storage
is the sole focus of this research.
2.2 Gas storage pressure vessels A pressure vessel is simply defined as a storage container that stores a fluid at a pressure higher than
the atmospheric pressure [40]. The pressurised fluid can either be compressible or incompressible. A
compressible fluid has a density and thus, volume, dependent on the pressure whilst an
incompressible fluid’s volume does not change with pressure [41]. In most cases, gases are considered
as compressible fluids whilst liquids (such as water) are widely accepted as incompressible fluids in
practice [41-42]. Because the fluid in a pressure vessel has a higher pressure than the ambient
pressure, it usually makes them dangerous if the vessel was to burst or leak [43]. Hence, the higher
the pressure within a pressure vessel, the higher the risk of injury or harm to whoever is within close
range should the pressure vessel fail. Because of the risks posed by pressure vessels, safety
precautions must be put in place to ensure that the level of the risks are lowered to the minimum [44].
One of the precautions involved with designing pressure vessels are pressure vessel codes which
include large safety factors on strength. Safety factors in this regard are usually a ratio of the maximum
allowable pressure within the vessel to the burst/failure pressure of the vessel [10]. Therefore, the
higher the safety factor the lesser the risk. Other precautions can also lessen the risks involved with
pressure vessels are the use of safety valves. Hence, what is critical in designing a pressure vessel is
stress analysis, material selection, the fabrication process, and consideration of the underlying
operating conditions [44-45]. Failure to adhere to any one of those aspects can lead to serious
repercussions if a vessel were to fail and cause damage or injury [46].
2.2.1 Types of pressure vessels This section will describe briefly the three common types of pressure vessels categorised according to
their specific application. The three types of vessels are storage vessels, heat exchangers and process
vessels [46-47]. Storage pressure vessels are used to store fluids at high pressure and they are the

11
most common of all vessels be it for industrial processes, commercial or residential use [46]. They can
be of any shape including a cylindrical or spherical geometry though cylindrically shaped vessels are
the most common because they are cheaper and less complex to fabricate [46, 48-49]. Storage vessels
are used to store liquids or gases awaiting use in another process [47]. The second most common type
of vessel is the heat exchanger type. A heat exchanger is a device used to transfer heat between two
or more fluids [50]. The heat exchanger is used in different applications including refrigeration, vehicle
cooling systems, air conditioning and within the food and service industry [46]. The third type of
pressure vessel is the process vessel and it provides a medium in which processes can be performed
such as blending, separation, cooling, purification and changing a material’s state [51]. Process vessels
often work in conjunction with the other two types of pressure vessels and they usually require
specialized design and manufacturing to suit their specific function [46]. Examples of process vessels
include columns and reactors [47]. Because this research is focussed on designing a vessel to store
hydrogen gas, only storage pressure vessels will be further described.
2.2.2 Pressure vessel heads A cylindrical pressure vessel has end caps that are also referred to as heads that close off the two ends
of the vessel [52]. There are different types of pressure vessel heads with the commonly used in
service being hemispherical, ellipsoidal, and torispherical heads [49, 53]. The hemispherical head
shown in Figure 2.7 is an ideal shape for a head from a stress perspective because the pressure in the
vessel is divided equally across the surface of the head [48], [53]. It is also the most efficient in terms
of volume for storage since it is effectively half of a sphere although that makes it relatively more
expensive to fabricate [54].
Figure 2.7: Typical hemispherical vessel head [48]
The ellipsoidal head has the shape of a semi-ellipse with the most common ratio used being 2:1 as
shown in Figure 2.8 [54]. It also has a knuckle with a radius (KR) and is the transition between the
cylindrical portion of the pressure vessel and the dish (DH). It has the advantage that the shape of this
head is more economical, because the height of the head is just a quarter of the diameter of the
cylindrical potion of the vessel [48]. However, the ellipsoidal head is not as efficient at handling
stresses as the hemispherical head, hence, they tend to require thicker walls [54].

12
Figure 2.8: Typical ellipsoidal vessel head [48]
A torispherical head has a dish with a fixed radius (CR) as shown in Figure 2.9, the size of which
depends on the type of torispherical head [48]. Like the ellipsoidal head, the torispherical head also
has a knuckle.
Figure 2.9: Typical torispherical vessel head [48]
As stated, the ellipsoidal and torispherical heads are cheaper to fabricate than the hemispherical head
[53]. The torispherical head also takes up the least amount of space as it results in the shortest vessel
length [54]. However, it still lags in terms of efficiency when dealing with stresses as compared to a
hemispherical head which makes the head thicker and possibly heavier [53-54].
2.2.3 Pressure vessel codes Before a pressure vessel can be used be it for commercial or industrial purposes, it should be certified
according to standards or codes that are specific to a particular region or country in which the pressure
vessel is to be used. There are commonly used pressure vessel standards globally which include the
following:
ASME (American Society of Mechanical Engineers) Boiler and Pressure Vessel Code (BPVC)
used in the United States of America [55].
The Pressure Equipment Directive (PED 2014/68/EU) [56], the Transportable Pressure
Equipment Directive (TPED 2010/35/EU) [57], and the Simple Pressure Vessels Directive (SPVD
2009/105/EC) all applicable in Europe [58].
CODAP: French Code for Construction of Unfired Pressure Vessel [59].
B51-09 Canadian Boiler, pressure vessel, and pressure piping code [60].
For South Africa, the Pressure Vessel Regulations of 2009 [11] (fall under the Occupational Health and
Safety Act (1993) for South Africa) govern the design, manufacture, operation, repair, modification,
maintenance, inspection and testing of pressure equipment with a design pressure equal to or greater
than 50 kPa (0.5 bar) [11]. Hence, the proposed CFRP pressure vessel falls under this category as it will
be a pressure vessel with a design pressure greater than 50 kPa. The South African National Standard
(SANS) 347 of 2012 [61] falls under the Pressure Equipment Regulations of 2009 and it further deals
with the categorization and conformity assessment, as well as the selection of health and safety
standards of pressure equipment for use by users, certification bodies and approved inspection
authorities. However, the pressure standards available in South Africa [61] and [11] predominantly

13
have regulations and rules that apply to metallic pressure vessels. The ASME Pressure Vessel Code
Section X [10] is recognised under the above mentioned regulations within South Africa and it deals
specifically with Fibre Reinforced Plastic (FRP) pressure vessels which therefore applies to the CFRP
pressure vessel pertaining to this research.
2.2.4 Hydrogen gas storage pressure vessels As described previously, compressed gas storage of hydrogen fuel is the most widely used method for
storing hydrogen for HFC applications. The reasons being its simplicity, lower cost and ease of
implementation. It does however have one major disadvantage which is its relatively lower volumetric
energy density capacity even after compressing the gas between 350-700 bar. However, it is arguably
the most mature hydrogen storage method on the market currently [16, 21, 23, 25, 32]. There are
currently four types of defined pressure vessels (Type I, II, III and IV) being used to store compressed
hydrogen gas for various applications. The choice of the storage pressure vessel to use is based on the
type of HFC application which requires a compromise between technical performances and cost [26].
Figure 2.10 pictorially summarizes the structural differences between the 4 types of hydrogen gas
storage tanks.
Figure 2.10:Schematic illustrating the structural differences in the Type I, II, III and IV hydrogen gas storage tanks [26]
Type I pressure vessel
This is a pressure vessel wholly constructed from a metallic material usually either steel or aluminium
[24, 62]. Figure 2.11 shows an example of a typical Type I pressure vessel. Type I vessels are
characterised by being bulky and heavy because of the relatively high mass densities of metals. They
can store hydrogen gas at pressures up to approximately 200 bar which is the lowest operating
pressure of the four types of vessels [26]. They are easy to manufacture and are the least expensive
of all types of hydrogen gas storage pressure vessels. They are usually used in stationary applications
because space or volume is not a substantial issue in these applications [17]. According to Jorgensen
et al [21, 24], they are not suited for applications like HFCPVs because they take up a significant
amount of space and would contribute significantly to the weight of the system.
Metal structure

14
Figure 2.11: Type I metallic hydrogen gas storage tanks [63]
Type II pressure vessel
This is a hybrid pressure vessel with a metallic pressure vessel (or thick metallic lining) with FRP
material hoop-wrapped onto the outer surface of the vessel excluding the ends [24]. It is less bulky
than a Type I vessel, and it can sustain higher pressures (up to 300 bar) owing to the added strength
attributed to the FRP windings. Type II pressure vessels are about 50% more expensive to manufacture
than Type I pressure vessels while being about 30-40% lighter [62]. They are also used in stationary
applications when there is a need for higher storage pressures to those offered by Type I vessels [26].
Type III pressure vessel
This pressure vessel is made of a thin, rigid pre-formed aluminium liner with filament-wound FRP
windings [24]. The FRP composite carries most of the load while the aluminium liner acts as a gas
diffusion barrier. Type III vessels are similar to Type II vessels though they differ in that Type III vessels
are wholly wound with layers of FRP material (including the ends) whereas Type II are only partially
wound. Furthermore, in Type III pressure vessels, the fibres carry practically all the load as opposed
to Type II pressure vessels where the load is shared between the fibres and the metallic section [62].
Because the FRP has a relatively high strength-to-weight ratio, Type III vessels have very high strength
and yet weigh less than Type I or II vessels. They are capable of pressures in the range 350-700 bar in
operation [28]. They are ideally suited for transportation applications like HFCPVs. However, they are
considerably more expensive than Type I and II vessels with the majority of the cost attributed to the
reinforced polymer materials.
Type IV pressure vessel
This is similar to a Type III pressure vessel with the difference being that where there is an aluminium
pre-formed liner for a Type III, there is a pre-formed polymeric based liner for Type IV pressure vessels.
A typical Type IV pressure vessel is shown in Figure 2.12 [62]. The polymer liners of type IV pressure
vessels can be obtained by roto-moulding, blow moulding or by welding injected domes to extruded
tubes of polymer [26]. Type IV vessels have very high strength and are lighter compared to all the
types of hydrogen storage pressure vessels. They are also similarly capable of pressures in the range
350-700 bar as Type III vessels making them suited for use as on-board storage vessels for HFCPVs

15
[24]. However, the cost of manufacturing Type IV vessels is still an issue making them not yet viable
[16, 21, 24]. The normalised cost (cost per kilogram of H2 gas stored) for Type IV pressure vessels (350
bar and 700 bar) ranges between US$500 and US$700 as of 2015 i.e. between R6800 and R9520 [64].
Refer to Appendix E for a detailed cost breakdown of the two types of Type IV pressure vessels
Figure 2.12: Type IV CFRP filament-wound tank [65]
Summary on the types of hydrogen gas storage pressure vessels
Below in Table 2.2 is a list of the different types of pressure vessels that are used to store hydrogen
gas with the working pressures of each type of vessel.
Table 2.2: Comparison of the working pressures for the types of hydrogen storage vessels [66]
Type Description Working Pressure
I Purely metallic tank up to 200 bar
II Metallic tank with carbon fibre windings up to 300 bar
III CFRP Filament Wound Tube with Aluminium Liner 350 - 700 bar
IV CFRP Filament Wound Tube with Polymeric liner 350 -700 bar
Type I and II pressure vessels take up more space as they are bulkier and heavier than Type III and IV
pressure vessels [21, 26]. Type III and IV are made from high strength FRP composites that have a
better strength-to-weight ratio than metals. From a cost perspective, Type III and IV are more
expensive than Type I and II pressure vessels (because of the costs of the material and manufacturing
processes) but since space within a HFCPV is at a premium, Type III and IV are preferred. The only
difference between Type III and IV pressure vessels is the liner material as they have similar pressure
ranges and constructed from the same reinforcement fibrous materials.

16
2.2.5 Testing of pressure vessels The safety of pressure vessels is of critical importance, hence, pressure vessels must undergo rigorous
testing to ensure they attain the desired safety level depending on the application in which they are
utilised. There are two categories under which most pressure tests fall under namely destructive and
non-destructive tests. A destructive test is a method where the test specimen is destroyed irreparably
mainly to determine mechanical properties such as strength [67]. For destructive tests, water is
normally utilised through hydrostatic tests due to the fact that it is safer because the incompressible
nature of water results in it releasing significantly less energy released when the vessel fails [68].
Nevertheless, pneumatic tests (i.e. using air as the gas) can still be used in pressure systems that are
designed in such a way as that they cannot be filled with water [68]. Non-Destructive Tests (NDT) are
employed to assess the vessels to check for in-service fitness, leak tightness and the reliability [68–
70].
According to the ASME pressure vessel code for FRP pressure vessels, some of the following common
tests ought to be performed on prototype FRP pressure vessels are as listed in Table 2.3 [10]:
Table 2.3: Pressure tests for prototype FRP pressure vessels
Name of test Description
Burst test A destructive test where the pressure vessel is filled with water and pressurized until it fails [67]. The purpose of this test is to determine the strength of the vessel as well as the maximum design pressure it can operate at. For CFRP pressure vessels, the maximum design pressure ought to be 2.25 times smaller than the failure pressure [10].
Proof test A NDT that is used to test the reliability and durability of a pressure vessel in a controlled setting [71]. These pressure tests check if the vessel can withstand a pressure slightly higher than the design pressure without leaking or enduring permanent deformation.
Leak test A NDT that aims to detect and localize any leaks from a pressure vessel [72]. This test utilises techniques such as bubble testing using dry air or measures trace gases using a mass spectrometer to detect any leaks from the pressure vessel.
Fatigue test A test whereby the pressure vessel undergoes cyclical pressure loads (i.e. pressurizing and depressurizing) to determine the number of cycles the vessel can withstand before failure. The test aims to understand how the pressure vessel will perform under similar conditions in actual use [73].
The burst, proof and leak tests will be considered as part of the scope of this research.
2.2.6 Stress determination for a cylindrical pressure vessel When a typical cylindrical pressure vessel with closed ends has a fluid stored within it at a pressure
higher than that of the atmosphere, stresses will be induced in the vessel because of that pressure.
Hence, determining the strength of a pressure vessel is important in the design of pressure vessels as
it guides the designer in selecting suitable materials and appropriate dimensions for the vessel to be
constructed.

17
Figure 2.13: Illustration of the stresses induced within a typical cylindrical pressure vessel [74]
Figure 2.14: Illustration of all the stresses induced by an internal pressure in a vessel [75]
The types of stresses induced in a pressure vessel are usually classified into 3 types which are
described below
Hoop stress – it acts in the circumferential direction of the vessel. It is denoted by σH in Figure
2.13 and as σc in Figure 2.14.
Longitudinal stress - acts in the direction along the axis of the cylinder. It is denoted by σL in
Figure 2.13 and σa in Figure 2.14.
Radial Stress - acts orthogonally to the axis of symmetry in the radial direction and is denoted
as σr in Figure 2.14.
There are two theories generally used to analyse and determine stresses induced in a typical cylindrical
pressure vessel. These include the Thin Cylinder and Thick Cylinder theories [76]. The Thin Cylinder
theory is applicable if the internal diameter to wall thickness ratio is smaller than or equal to 20.
Alternatively, in the case that the same ratio is less than 20 then the Thick Cylinder theory would apply.
Another distinction between the two theories is that the radial stress is considered negligible by the
Thin Cylinder theory whilst it is applicable with respect to Thick Cylinder theory. The two theories are
described in detail in the following sub-sections:
Thin cylinder theory
The hoop stress (acting in the circumferential direction) is calculated using the following equation [77]
2
iH
PD
t [2.1]

18
where P is the internal pressure in the vessel, Di is the internal diameter of the cylindrical section and
t is the thickness of the vessel.
The longitudinal stress value is equivalent to half of the magnitude of the hoop stress and is calculated
using the following equation [77].
1
4 2
iL H
PD
t [2.2]
The radial stress is considered negligible with respect to the thin cylinder theory.
Thick cylinder theory
The hoop and radial stresses are calculated using the Lamé’s equations [76] as shown below.
2H
BA
r [2.3]
2R
BA
r [2.4]
where r is any value of radius between the internal radius (R1) to the external radius (R2) of the
cylinder, and A and B are Lamé’s constants. To evaluate the constants A and B, two known conditions
are needed. For this particular case, the conditions are summarised as follows:
1( ) ,
Ra r R P
2( ) , 0
Rb r R
It should be noted that the first condition infers that the radial stress is the negative of the internal
pressure because the radial stress is causing the compression of the wall of the cylindrical vessel hence
the radial stress is negative. Substituting for the two known conditions into equations 2.3 and 2.4 will
result in the following equations for A and B:
2
1
2 2
2 1
PRA
R R
[2.5a]
2 2
1 2
2 2
2 1
PR RB
R R
[2.5b]
Thus,
2
2
2
/ 1
1H
R rP
k
[2.5]
where 2 1/k R R
The longitudinal stress, given the aforementioned two known conditions, is calculated using the
following formula [76] :

19
2
1
2 2
2 1
L
PRA
R R
[2.6]
2.3. Carbon Fibre Reinforced Plastic Composites A composite is a material which consists of two or more distinct constituent materials combined at a
macroscopic level where the materials are not soluble in each other [3]. Composites are popular
material choices because one can tailor the properties of the resulting composite [78]. Carbon Fibre
Reinforced Plastic (CFRP) is a type of fibre reinforced composite that offers a higher strength-to-weight
ratio than most metals although is relatively more expensive [79]. It is formed by combining carbon
fibres (reinforcing material) and a polymeric resin (matrix). The carbon fibres provide the required
strength of the composites as they carry most of the applied loads whilst the resin holds the fibres
together and transfers the loads to the fibres.
2.3.1 Applications of CFRP CFRP composites are desired because of their relatively high tensile strength and elastic modulus as
previously mentioned [3, 4]. This allows them to be used extensively in applications where there is
need to use as little material as possible without compromising on strength. Such popular applications
are in high performance industries like in aerospace and automotive [80]. There are also other
desirable mechanical properties of CFRP composites including the high fatigue strength, good
corrosion resistance and a small coefficient of thermal expansion [81]. High fatigue strength is an
attractive trait for a CFRP pressure vessel as it would endure many cycles of pressurization and
depressurization. The good corrosion resistance of CFRP composites makes sure that they will not
react with the contents of the vessel as well as external elements from the atmosphere.
2.3.2 Types of carbon fibre fabric After carbon fibre has been manufactured, it can be offered in different forms of fabric depending on
the intended use [82]. A fabric is defined by long fibres (of carbon, aramid or glass) bundled to create
tows which are then woven to produce a flat sheet of one or more layers of fibres of various forms
[83]. The types of fabric differ according to their fibre orientations and the manufacturing method.
Common types of fibre orientations are unidirectional and woven.
Unidirectional fabric
Unidirectional (UD) fabric is composed of bundles (or tows) of carbon filaments all oriented in the
same direction as shown in Figure 2.15 [80]. It is useful in applications where most of the applied load
on an object is in a particular direction allowing for it to be placed precisely where it is required, and
in the optimum quantity (no more or less than required) [84]. This also has the effect of minimizing
the weight of the constructed object. Furthermore, UD fibres are straight and not crimped which
results in the highest possible fibre properties from the fabric in composite component construction
[84].

20
Figure 2.15: Unidirectional fabric [80]
However, it is not as flexible as woven cloth because of its single dimensional rigidity which makes it
unlikely to use in applications where loads can come from all directions and it is sometimes more
difficult to place into position [78, 82].
Woven fabrics
They are produced by the linking of warp fibres and weft fibres in a regular pattern or weave style and
their integrity is maintained by the mechanical interlocking of the fibres [85]. There are several weave
styles available for example plain weave and twill weave. The plain weave is the most fundamental
weave where tows are woven together at right angles propagating laterally and vertically across the
cloth as shown in Figure 2.16. As such, loads can be applied in multiple axes and the composite will
retain its stiffness [80]. Its distinct pattern is not the strongest of all the weave patterns, but it is the
one of the easiest to handle [86].
Figure 2.16: Actual (left) and simplified (right) version of plain weave pattern [86]
The twill weave fabric has one or more warp fibres alternately weaving over and under two or more
weft fibres in a regular repeated manner [85]. An example of a 2x2 twill weave illustrated in Figure
2.17. The twill weave is more complex and modern than the plain weave pattern [80]. However, it is
more flexible and has good durability for when complex shapes are required [82].

21
Figure 2.17: Actual (left) and simplified (right) version of Twill weave pattern [86]
Because of the scope of this report, where filament wound tubes will be used, unidirectional fibre is
what will be focussed on in this report.
2.3.3 Manufacturing methods for CFRP composites There are several ways in which composites (CFRP included) can be manufactured. The choice of
manufacturing method depends on several factors including the intended application, type of matrix
and fibres, temperature to form and cure the matrix, the geometry of the end product and cost
effectiveness of the process [87]. The two major types of manufacturing methods are open moulding
and closed moulding [4, 88]. Below is a brief description of each method and the respective
advantages.
Open mould processes – they involve placing the resin and the fibres in an open mould where
they cure and harden when exposed to the atmosphere. Typical open mould processes
include hand lay-up, spray-up, casting, and filament winding.
Closed mould processes – they involve processing composite materials and curing them
within vacuum bags on matched die moulds that are closed to the atmosphere for example
hot press moulding. These processes are suited for when high production volumes are
required.
In this work, the focus will be primarily on the filament winding process that will be used to
manufacture the cylindrical section of the proposed CFRP pressure vessel.
Filament winding
This is a process of constructing open or closed composite objects such as cylindrical tubes or pressure
vessels [89]. It is achieved when continuous reinforcements (for example UD tape or tow), either
previously impregnated with a matrix material or impregnated during the winding, are placed over a
rotating mandrel [90]. Dry winding is the type of filament winding operation that winds prepregs (i.e.
ready-made tape composed of fibres pre-impregnated with resin [3, 91]) onto the mandrel directly
without using resin [92]. Wet winding alternatively, is where fibre strands or tows are impregnated
with resin in a bath immediately before they make contact with the mandrel as shown in Figure 2.18
[4, 93]. Wet winding is advantageous in that it is inexpensive and allows one to accurately control the
properties of the composite [3]. On the other hand, dry winding is cleaner, but more expensive and
thus quite uncommon [3]. Hence, the choice of which filament winding process is driven by application
specific factors which may include cost and control of the final properties of the composite object.

22
Figure 2.18: Illustration of the wet filament winding process [94]
2.3.4 Strength analysis of composites As a composite material consists of two or more constituents, the analysis of the mechanical
behaviour and design of such materials is different from that for conventional homogeneous isotropic
materials such as metals [3]. Isotropic in the context of materials means that the material has the
same properties in all directions whilst homogeneous materials are ones that have the same
properties at all points on that material [4]. Composites commonly fall in neither category. For
example if a CFRP composite is pulled along the fibre direction, it will have a different tensile strength
as compared to pulling in a direction transverse to the direction of the fibres, hence it is anisotropic.
Composites are heterogeneous which can be observed when the properties are analysed for different
points. For example, the properties differ between a point which has fibre and one that has the matrix
material.
2.3.4.1 Micromechanical analysis of composites
Micromechanics analyses the interaction between the two constituent materials and their properties
on a microscopic level with the aim of trying to predict the final properties of the composite [3, 78].
To determine the properties of a composite, ordinarily experiments have to be conducted on the
material to determine its properties. Experiments usually are time consuming and expensive so in
order to resolve those issues, micromechanical models have been developed to try to predict the
properties of the composite basing on the properties of the known constituent materials [4, 78].
Fibre volume and mass fraction
The volume fraction of fibres within a composite is the ratio of the volume of fibres compared to the
total volume of the composite. The fraction of fibres within the composite can also be expressed in
terms of mass though the volume fraction of fibres is more commonly used [4]. The volume fraction
of fibres (Vf) can be expressed as follows:
f
f
f m
vV
v v
[2.8a]

23
where fv is the volume of the fibres and m
v is the volume of the matrix.
It should be noted that equation 2.8a is only applicable when the volume occupied by voids (vvoid) in
the composite material is insignificant [3], [87]. To include the effects of voids, equation 2.8a can be
rewritten as follows:
f
f
f m void
vV
v v v
[2.8b]
The mass fraction of fibres can be expressed as follows:
f
f
f m
mM
m m
[2.9]
Where mf is the mass of the fibres and mm is the mass of the matrix.
The concept of the volume fraction of fibres is critical to the evaluation of the stiffness and strength
properties of the composite [3].
Density
Density of the composite can be derived from the volume fractions as shown below:
c f mm m m [2.10]
where mc is the mass of the composite
Rewriting the equation in terms of volume and density and simplifying further:
c c f f m mv v v
f mc f m
c c
v v
v v
c f f m mV V [2.11]
The above result means that the density of the composite can be determined from the densities and
volume fractions of the fibres and the matrix.
Void content
During the manufacture of laminated composites, there is a possibility of the formation of voids due
to air being trapped in the material [87].Voids have the effect of exaggerating the density of a
composite and can be detrimental to its mechanical properties for example transverse tensile
strength, fatigue resistance, and moisture resistance [3]. If the volume occupied by voids is less than
5% then their effects are considered insignificant [87]. The space occupied by voids (vvoid) in a
composite laminate can be estimated by comparing the theoretical density with its actual density of
the composite using the following equation [87]:
100ct cevoid
ct
v
[2.12]

24
where ct is the theoretical density of the composite and ce is the experimental density of the
composite.
Stiffness properties
The mechanical properties to be covered in this section are listed as follows:
Elastic longitudinal modulus, E1.
Elastic transverse modulus, E2.
Major Poisson’s Ratio, v12.
In-plane shear modulus, G12.
The strength approach used to determine the above mentioned constants is based on the following
assumptions [3, 78, 91]:
The bond between fibres and the matrix is perfect.
The elastic moduli, diameters, and spaces between fibres are uniform.
The fibres are continuous and parallel.
The fibres and matrix are linearly elastic and follow Hooke’s law.
The fibres possess uniform strength.
The composite is free of voids.
However, these listed assumptions are not necessarily true in practice.
Elastic longitudinal modulus (E1)
This is the elastic modulus of the composite along the direction of the fibres. If a force, P, pulls on the
lamina element shown in Figure 2.19 below, it will undergo a strain (ε1) as well as a stress (σ1) on its
cross section.
Figure 2.19: Portion of a unidirectional lamina that is being pulled in the 1-direction (along the fibre direction) [78]
The strain can be calculated as follows:
1
L
L
[2.12]
where L is the extension and L is the original length.
The strain, ε1, is the same between the fibres and the matrix as they stretch by the same amount
across the portion of the lamina. The stresses in the fibres and the matrix are expressed as follows

25
1f f
E [2.13]
1m m
E [2.14]
The average stress across the lamina (σ1) acts on the cross-sectional area (A1) of the portion of the
lamina. The stress across the fibres and the matrix acts on the respective areas Af and Am. The
resultant force, P, is shared by the fibres and can be expressed as follows
1 1 f f m mP A A A [2.15]
Substituting for the stresses and removing of the common factor ε1:
1 1 f f m mE A E A E A
1
1 1
f mf m
A AE E E
A A
Where the ratios of the areas can be expressed as volume fractions [78]:
1 f f m mE E V E V [2.16]
Hence, the longitudinal elastic modulus is a function of the volume fractions and the elastic moduli of
the fibres and the matrix. The equation to determine the elastic longitudinal modulus is commonly
known as the rule of mixtures [3, 78]. It can be inferred that the volume fraction of the fibres
contributes largely to the longitudinal modulus as the modulus of the fibres is larger than that of the
matrix to a greater extent. It can thus, be reasonably concluded that the longitudinal modulus is
dominated by the fibres.
Elastic transverse modulus (E2)
This is the elastic modulus measured transverse to the direction of the fibres. In this case, instead of
pulling a sample lamina in the fibre direction, the lamina will be pulled in the transverse (orthogonal)
direction as shown in Figure 2.20. Due to the pulling of the lamina in the 2-direction, the fibres and
the matrix are assumed to have a common stress, σ2. The strains therefore are different for the fibres
and the matrix. The two strains can be expressed by rearranging equations 2.13 and 2.14 as shown
below:
2
f
f
E
[2.17]
2
m
m
E
[2.18]
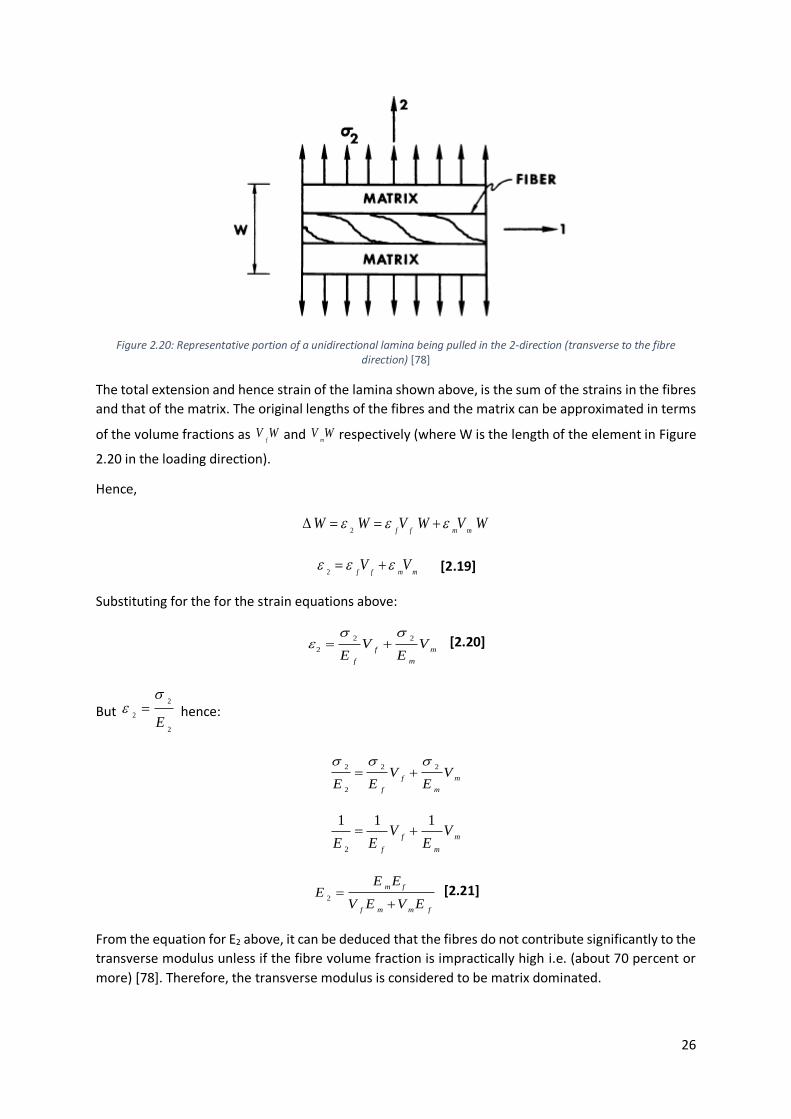
26
Figure 2.20: Representative portion of a unidirectional lamina being pulled in the 2-direction (transverse to the fibre direction) [78]
The total extension and hence strain of the lamina shown above, is the sum of the strains in the fibres
and that of the matrix. The original lengths of the fibres and the matrix can be approximated in terms
of the volume fractions as f
V W and m
V W respectively (where W is the length of the element in Figure
2.20 in the loading direction).
Hence,
2 f f m mW W V W V W
2 f f m mV V [2.19]
Substituting for the for the strain equations above:
2 2
2 f m
f m
V VE E
[2.20]
But 2
2
2E
hence:
2 2 2
2
f m
f m
V VE E E
2
1 1 1f m
f m
V VE E E
2
m f
f m m f
E EE
V E V E
[2.21]
From the equation for E2 above, it can be deduced that the fibres do not contribute significantly to the
transverse modulus unless if the fibre volume fraction is impractically high i.e. (about 70 percent or
more) [78]. Therefore, the transverse modulus is considered to be matrix dominated.

27
Major Poisson’s ratio (v12)
The Major Poisson’s ratio can be defined as the negative ratio of the strain in the transverse direction
to that of the longitudinal direction when a composite is loaded the longitudinal direction only.
2
12
1
v
[2.21]
where 1 is the longitudinal strain and 2 is the transverse strain.
If it is assumed that the composite is to be loaded in the direction parallel to the fibres (see Figure
2.21) and that the strains within the fibres is similar to those in the matrix in the 1-direction.
Figure 2.21: Representative volume element loaded in the direction parallel to the fibres i.e. 1-direction [78]
The transverse extension ( w ) of the volume element shown above can be expressed as follows
2 12 1w W W [2.22]
where W is the length of the element in Figure 2.21 in the direction transverse to the loading
direction.
The transverse extension can also be expressed as the sum of the extensions of the fibres and of the
matrix:
f mw w w [2.23]
Treating the transverse strains in the fibres and the matrix separately, they can be expressed in terms
of the respective Poisson’s ratios and volume fractions as follows [78]:
1m mmW Vw [2.24]
1f ff W Vw [2.25]
Combining the previous equations, the expression for the Major Poisson’s ratio simplifies to:
12 f f m m
V V [2.26]

28
The equation of the Major Poisson’s ratio (2.26) is also a variation of the rules of mixtures method
[91].
In-plane Shear Modulus (G12)
The main assumption used in the determination of this constant is that the fibres and the matrix have
the same shear stresses.
Figure 2.22: Representative volume element with an in-plane shear stress applied onto it [3]
If such an in-plane stress is applied to the volume element shown in Figure 2.22 above, the resulting
shear deformation, δC, can be expressed as follows:
c f m [2.27]
Expressing the shear deformations in terms of shear strains:
c c ct [2.28]
f f ft [2.29]
m m mt [2.30]
where c , f , and m are shear strains of the composite, fibres and matrix respectively
ct , ft and mt are the thicknesses of the composite, fibres and matrix respectively
The shear strains can also be defined in terms of the in-plane shear modulus and shear stresses:
12
c
cG
[2.31]
f
f
fG
[2.32]

29
m
m
mG
[2.33]
where c , f and m are the composite, fibre and matrix shear stresses respectively
fG and m
G are the shear moduli for the fibres and the matrix respectively
Combining the equations above and replacing ratios of thicknesses as volume fractions, yields the
following expression of the in-plane shear modulus of the composite[3]:
12
f m
m f f m
G G
G V G VG
[2.34]
Micromechanics also allows designers of composite laminate structures to see the effect of the
property values of the constituent materials without having to construct the physical composite
structure. However, micromechanical models have within themselves, considerable inherent
limitations [78]. An example is the assumption made that there is a perfect bond between the matrix
and the fibres which is not necessarily true in practice. Hence, there is a need to validate the
discrepancy between the theoretical predictions with the actual experimental data.
2.3.4.2 Macromechanical analysis of composites
Macromechanical analysis involves studying the material behaviour basing on the main assumption
that the composite is homogeneous and that the effects of the constituent materials are detected
only as averaged apparent properties of the composite material [78].
Unidirectional Lamina
A unidirectional lamina (also referred to as a ply) is a flat singular layer of fibres arranged parallel to
each other within a matrix. Figure 2.23 is an illustration of a unidirectional lamina.
Figure 2.23: A unidirectional lamina [95]
When laminae are bonded and stacked on top of one another, a laminate is formed as shown in Figure
2.24. Each lamina within a laminate may have fibres oriented in different directions as well as different
thicknesses to other laminae within the laminate.

30
Figure 2.24: Typical laminate structure[3]
Therefore, the building block of the laminate is a lamina, hence, understanding the mechanical
analysis and behaviour of a single lamina would need to precede the understanding of a laminate [3].
Laminate codes
Each laminate structure has a laminate code that describes the angle of orientation of each laminar relative to the next lamina. An example of such a code is [10/45/90] which describes a laminate structure with the first layer having an angle of 10°, the next at 45° and the last oriented at 90° in that order from top to bottom along the z-axis.
There are several common ways into which laminates can be formed. Below are two types of special laminates accompanied by a description:
Balanced Laminate - A laminate is balanced if layers at angles other than 0° and 90°occur only
as plus and minus pairs of + θ and – θ [3]. An example is [+50/-50/+50/-50].
Symmetric Laminate - A laminate is called symmetric if the material, angle, and thickness of
plies are the same above and below the mid-plane [3]. An example is [20/40/40/20] usually
denoted as [20/40]s.
Stress-strain relationships for a lamina
The stress-strain relationships for composite materials are more complicated to express than those
for isotropic material. Making the assumption that composite materials are linear and elastic is widely
considered acceptable whilst assuming that composite materials are isotropic is considered
unacceptable [3]. Therefore, it follows that Hooke’s Law applies to composites [91].
A unidirectional lamina falls under the orthotropic material category which are materials that have
three mutually perpendicular planes of material symmetry [78]. They are considered a subset of
anisotropic materials because their properties change when measured from different loading
directions [3].
Fibre direction
z-axis

31
Hence, the stress-strain relationship for an orthotropic material is more complicated than the one for
isotropic materials. An orthotropic material in a three-dimensional (3D) stress state, can be described
by the following system of equations:
11 12 131 1
21 22 232 2
31 32 333 3
4423 23
5531 31
6612 12
0 0 0
0 0 0
0 0 0
0 0 0 0 0
0 0 0 0 0
0 0 0 0 0
C C C
C C C
C C C
C
C
C
[2.35]
Where the 6 x 6 matrix is called the stiffness matrix [C]. To the left of matrix [C] is the stress vector
while strain vector is to the right side.
In the stress vector on the left-hand side of the equation, represents a normal stress is a certain
direction and represents a shear stress in a certain plane. Similarly, in the strain vector on the right-
hand side, represents a normal strain in a certain direction and represents a shear strain in a
certain plane.
However, if a lamina is sufficiently thin and does not carry any out of plane loads, one can assume
plane stress conditions [3],[95] i.e. 𝜎3 = 𝜏23 = 𝜏31 = 0 . This will reduce the 3D system of equations
to a two-dimensional (2D) problem with the following system of equations which are easier to analyse
and solve.
1 11 12 1
2 12 22 2
12 66 12
0
0
0 0
Q Q
Q Q
Q
[2.36]
Where the 3 x 3 matrix is now referred to as the Reduced Stiffness Matrix, Q, which is different to the
Stiffness matrix, [C]. Alternatively, the equation 2.36 can be rewritten as follows
1 11 12 1
2 12 22 2
12 66 12
0
0
0 0
S S
S S
S
[2.37]
Where the 3 x 3 matrix is referred to as the Compliance Matrix which is the inverse of the Reduced
Stiffness Matrix [Q].
The four elements (S11, S12, S22 and S66) of the compliance matrix, S, can be evaluated from the
following four independent engineering elastic constants shown below:
E1 – Elastic Modulus along the fibres in the lamina
E2 – Elastic Modulus transverse to the fibre direction in the lamina
ν12- Major Poisson’s Ratio
G12 – In-plane shear modulus for the plane 1-2
These four independent engineering constants can be found empirically through mechanical testing
for example using ASTM (American Society for Testing and Materials) tests [96]. Then the following

32
equations relate the elements of the compliance matrix and the independent constants as shown
below [3, 78]:
11
1
1S
E , [2.38]
1212
1
SE
, [2.39]
22
2
1S
E [2.40]
66
12
1S
G [2.41]
The engineering constants can be related to the elements from the reduced stiffness matrix [Q] as
follows:
221 12
1
Ev v
E [2.42]
where 2 1v is the Minor Poisson’s ratio.
1
11
12 211
EQ
, [2.43]
12 2
12
12 211
EQ
, [2.44]
2
22
12 211
EQ
[2.45]
6 6 1 2Q G [2.46]
Stress-strain relationships for an angled lamina
An angled lamina is one in which the fibres are aligned at an angle, θ, to either one of the principal
axes (i.e. x and y axes) as shown in Figure 2.25. Angled lamina are common in practice because
sometimes loads applied on laminae do not act along any one of the principal directions.

33
Figure 2.25: Angled lamina with fibres oriented at an angle, θ, to the x-axis [3]
Referring to Figure 2.25, fibres are oriented in the 1-direction which is orthogonal to the 2-direction.
The 1 and 2 axes are referred to as the local (or material) axes and the x and y axes are called global
axes. Commonly, stresses and strains would initially be dealt with in the global axis system before
being transformed into the local axis system. The stresses and strains from the global axes are related
to those of the local axes system through a transformation matrix [T] that incorporates the angle θ
into them as shown below [3, 90]:
1
2
12
x
y
xy
T
[2.47]
and 1
2
12
2 2
x
y
xy
T
[2.48]
Where
2 2
2 2
2 2
cos sin 2sin cos
sin cos 2sin cos
sin cos sin cos cos sin
T
[2.49]
Combining equations 2.9 and 2.20 yields the following equation:
1
2
12
[ ]
x
y
xy
Q T
[2.50]
The left-hand side of equation 2.48 can be rewritten as shown in equation 2.51 before combining with
equation 2.50 and can be expressed as follows:

34
1 1
2 2
12 12
[ ]
2
P
[2.51] 1 0 0
[ ] 0 1 0
0 0 2
where P
1
2
12
[ ]
2
x
y
xy
Q P T
[ ]
2
x x
y y
xy xy
Q P T T
[2.52]
Equation 2.51 can be rearranged as shown below before being substituted into equation 2.52 to give
equation 2.53. After simplifying equation 2.53, one will arrive at equation 2.54:
1
2
x x
y y
xy xy
P
[2.51]
1 1[ ]
x x
y y
xy xy
T Q P T P
[2.53]
11 12 16
12 22 26
16 26 66
x x
y y
xy xy
Q Q Q
Q Q Q
Q Q Q
[ ]
x x
y y
xy xy
Q
[2.54]
Where [ ]Q
is referred to as the transformed reduced stiffness matrix. The elements of the [ ]Q
can
be calculated as follows [3]:

35
4 4 2 2
11 22 12 6611cos sin 2( 2 )sin cosQ Q Q Q Q
[2.55]
2 2 4 4
11 22 66 1212( 4 )sin cos (sin cos )Q Q Q Q Q
[2.56]
4 4 2 2
11 22 12 6622sin cos 2( 2 )sin cosQ Q Q Q Q
[2.57]
3 3
11 12 66 22 12 6616( 2 )sin cos ( 2 )cos sinQ Q Q Q Q Q Q
[2.58]
3 3
11 12 66 22 12 6626( 2 )sin cos ( 2 )sin cosQ Q Q Q Q Q Q
[2.59]
2 2 4 4
11 22 12 66 6666( 2 2 )sin cos (sin cos )Q Q Q Q Q Q
[2.60]
After determining each element of matrix [Q], one can use equation 2.54 to determine the global
stresses acting on a lamina if the global strains are known. Alternatively, one can also determine the
global strains if the global stresses are known.
Failure theories for laminae
For isotropic materials like metals, there exists failure theories which serve the purpose of attempting
to predict the failure stress and/or strains of an object made of those materials that has been
subjected to a load. Failure theories allow for more efficient designs depending on their relative
accuracies in predicting when the composites will fail. Hence, depending on the application, no lesser
or greater amount of material need to be utilised for that application as determined by the failure
theory used. Composites also have failure theories that differ to those of isotropic materials. For
composites, the strength of laminate structures is related to the strength of each individual lamina
and the connectors between the laminae [3]. “This allows for a simple and economical method for
finding the strength of a laminate using the various failure theories,” as suggested by Dametew [97].
Maximum Stress failure theory
Similar to isotropic materials (e.g. steel), there is a Maximum Stress failure theory for a unidirectional
lamina for composites as well. However, where isotropic materials have two main strength
parameters (normal and shear stresses), laminae have five strength parameters in total, two (tension
or compression stresses) for each principal material axis direction i.e. in the direction that is parallel
to the fibres and the one transverse to the fibres [91]. The fifth parameter is the shear stress acts
parallel to the 1-2 plane. Because laminae are not isotropic, they have different strengths in different
directions of loading. The longitudinal direction refers the direction parallel to the fibres and the
transverse direction refers to the direction at right angles to the fibre direction. The strength
parameters are listed below:
1 u t s C
- Ultimate Longitudinal Stress in Compression
1 u t s T
- Ultimate Longitudinal Stress in Tension
2 u t s C
- Ultimate Transverse Stress in Compression
2 u t s T
- Ultimate Transverse Stress in Tension
1 2 m a x
- Ultimate Shear Stress

36
The conditions for the Maximum Stress failure theory are that the applied stresses (σ1, σ2 or τ12)
should not exceed any of the above ultimate stresses for each type of loading.
1 1 1uts C uts T [2.61]
2 2 2uts C uts T [2.62]
1 2 m a x 1 2 1 2 m a x
[2.63]
Maximum Strain failure theory
The Maximum Strain failure theory is based on the maximum normal strain theory by St. Venant and
the maximum shearing stress theory by Tresca for isotropic materials [3]. It also shares similarities
with the Maximum Stress failure theory described above with the only difference that it uses ultimate
strains as bounds for failure in place of ultimate stresses. Initially, the local strains on the lamina must
be derived from the global strains induced by the load on the lamina. These applied local strains are
then compared with the ultimate strains at failure with the conditions for failure shown as follows:
1 1 1uts C uts T [2.64]
2 2 2uts C uts T [2.65]
12 12 12m a x m a x
[2.66]
Where:
1 u t s C
-Ultimate Longitudinal Strain in Compression
1 u t s T
-Ultimate Longitudinal Strain in Tension
2 u t s C
-Ultimate Transverse Strain in Compression
2 u t s T
- Ultimate Transverse Strain in Tension
1 2 m a x
- Ultimate Shear Strain
Tsai-Hill failure theory
Tsai-Hill Failure Theory is based on the distortion energy failure theory of Von-Mises’ distortional
energy yield criterion for isotropic materials [91]. Distortion energy is part of the total strain energy of
the body and it comes about due to the change in shape of a body under stress [77]. When this
distortion energy exceeds the failure distortion energy of the material then failure would have
occurred. The Tsai-Hill failure theory is an adaption of the distortion energy failure theory as applied
to anisotropic materials and in particular, to unidirectional laminae [3]. Assuming plane stress
conditions, the lamina would have been considered to have failed if it does not satisfy the following
condition:
2 2 2
1 1 2 2 1 2
2
1 1 2 1 2 m a x
1
u t s T u t s T u t s T
[2.67]
As can be seen in the condition above, there is a coupling between the different applied stresses unlike
in the previous two failure theories. Because the transverse compressive strength (σ2-UTS-C) is usually
significantly larger than the transverse tensile stress (σ2-UTS-T) [4], [81], the Tsai–Hill failure theory tends
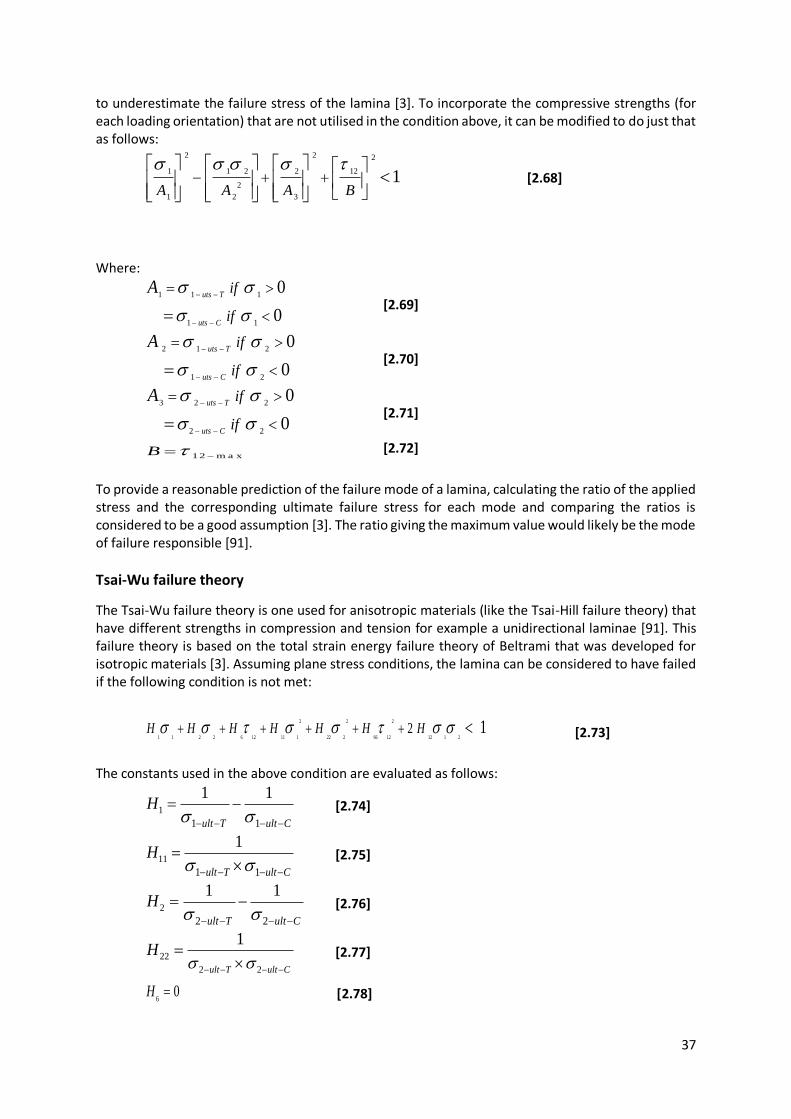
37
to underestimate the failure stress of the lamina [3]. To incorporate the compressive strengths (for each loading orientation) that are not utilised in the condition above, it can be modified to do just that as follows:
2 2 2
1 1 2 2 12
2
1 2 3
1A A A B
[2.68]
Where:
1 1 1
1 1
0
0
uts T
uts C
if
if
A
[2.69]
2 1 2
1 2
0
0
uts T
uts C
if
if
A
[2.70]
3 2 2
2 2
0
0
uts T
uts C
if
if
A
[2.71]
12 m a xB [2.72]
To provide a reasonable prediction of the failure mode of a lamina, calculating the ratio of the applied stress and the corresponding ultimate failure stress for each mode and comparing the ratios is considered to be a good assumption [3]. The ratio giving the maximum value would likely be the mode of failure responsible [91].
Tsai-Wu failure theory
The Tsai-Wu failure theory is one used for anisotropic materials (like the Tsai-Hill failure theory) that have different strengths in compression and tension for example a unidirectional laminae [91]. This failure theory is based on the total strain energy failure theory of Beltrami that was developed for isotropic materials [3]. Assuming plane stress conditions, the lamina can be considered to have failed if the following condition is not met:
2 2 2
1 1 2 2 6 12 11 1 22 2 66 12 12 1 22 1H H H H H H H [2.73]
The constants used in the above condition are evaluated as follows:
1
1 1
1 1
ult T ult C
H
[2.74]
11
1 1
1
ult T ult C
H
[2.75]
2
2 2
1 1
ult T ult C
H
[2.76]
22
2 2
1
ult T ult C
H
[2.77]
60H [2.78]
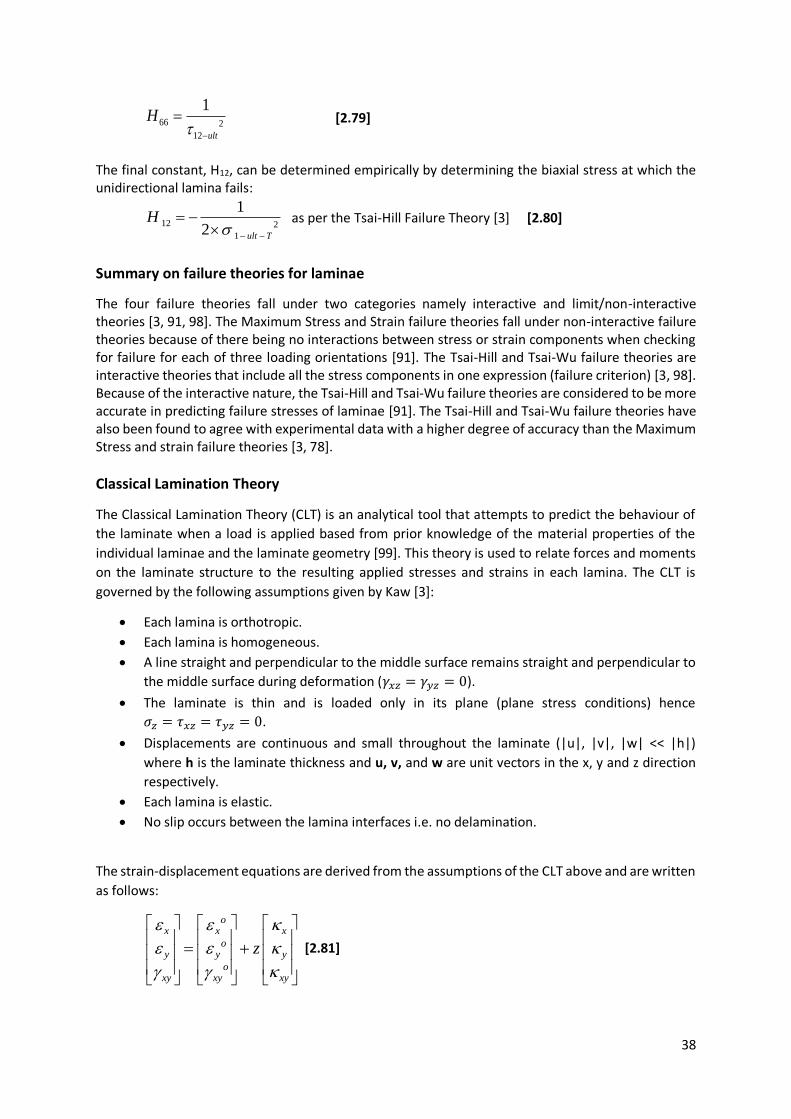
38
66 2
12
1
ult
H
[2.79]
The final constant, H12, can be determined empirically by determining the biaxial stress at which the unidirectional lamina fails:
12 2
1
1
2 ult T
H
as per the Tsai-Hill Failure Theory [3] [2.80]
Summary on failure theories for laminae
The four failure theories fall under two categories namely interactive and limit/non-interactive theories [3, 91, 98]. The Maximum Stress and Strain failure theories fall under non-interactive failure theories because of there being no interactions between stress or strain components when checking for failure for each of three loading orientations [91]. The Tsai-Hill and Tsai-Wu failure theories are interactive theories that include all the stress components in one expression (failure criterion) [3, 98]. Because of the interactive nature, the Tsai-Hill and Tsai-Wu failure theories are considered to be more accurate in predicting failure stresses of laminae [91]. The Tsai-Hill and Tsai-Wu failure theories have also been found to agree with experimental data with a higher degree of accuracy than the Maximum Stress and strain failure theories [3, 78].
Classical Lamination Theory
The Classical Lamination Theory (CLT) is an analytical tool that attempts to predict the behaviour of
the laminate when a load is applied based from prior knowledge of the material properties of the
individual laminae and the laminate geometry [99]. This theory is used to relate forces and moments
on the laminate structure to the resulting applied stresses and strains in each lamina. The CLT is
governed by the following assumptions given by Kaw [3]:
Each lamina is orthotropic.
Each lamina is homogeneous.
A line straight and perpendicular to the middle surface remains straight and perpendicular to
the middle surface during deformation (𝛾𝑥𝑧 = 𝛾𝑦𝑧 = 0).
The laminate is thin and is loaded only in its plane (plane stress conditions) hence
𝜎𝑧 = 𝜏𝑥𝑧 = 𝜏𝑦𝑧 = 0.
Displacements are continuous and small throughout the laminate (|u|, |v|, |w| << |h|)
where h is the laminate thickness and u, v, and w are unit vectors in the x, y and z direction
respectively.
Each lamina is elastic.
No slip occurs between the lamina interfaces i.e. no delamination.
The strain-displacement equations are derived from the assumptions of the CLT above and are written
as follows:
ox x x
oy y y
oxy xy xy
z
[2.81]

39
Where
ox
oy
oxy
𝑖𝑠 𝑎 𝑣𝑒𝑐𝑡𝑜𝑟 𝑡ℎ𝑎𝑡 𝑟𝑒𝑝𝑟𝑒𝑠𝑒𝑛𝑡𝑠 𝑚𝑖𝑑𝑝𝑙𝑎𝑛𝑒 𝑠𝑡𝑟𝑎𝑖𝑛𝑠 𝑎𝑛𝑑
x
y
xy
𝑖𝑠 𝑎 𝑣𝑒𝑐𝑡𝑜𝑟 𝑡ℎ𝑎𝑡 𝑟𝑒𝑝𝑟𝑒𝑠𝑒𝑛𝑡𝑠 𝑚𝑖𝑑𝑝𝑙𝑎𝑛𝑒 𝑐𝑢𝑟𝑣𝑎𝑡𝑢𝑟𝑒𝑠 𝑜𝑓 𝑒𝑎𝑐ℎ 𝑙𝑎𝑚𝑖𝑛𝑎
And Z which represents the position of a lamina along the z-axis relative to the mid-plane
This system of equations is used to determine the strains in the x-y plane and the x and y directions in
a laminate [91]. The strain-displacement equations describe a linear relationship between the strains
in a laminate and the curvatures of the laminate while it also goes to show the independence of strains
to coordinate axes, x and y.
Strain and stresses in laminates
The strain and stress matrix equations (equations 2.8 through to 2.27) for a unidirectional lamina were
described and listed in the previous section(s). Since laminates are groupings of laminae stacked
together in a specific order, it follows that laminae strain and stress equations can be applied to
laminates as well according to the derivations and assumptions of the CLT. Combining the stress and
strain equation for a lamina (2.27) and the strain displacement equation (2.48) for a laminate
structure, the result is as follows:
11 12 16 11 12 16
12 22 26 12 22 26
16 26 66 16 26 66
o
x x x
o
y y y
o
xy xy xy
Q Q Q Q Q Q
Q Q Q z Q Q Q
Q Q Q Q Q Q
[2.82]
The equation 2.49 applies to each lamina within the laminate structure. The equation describes the
scenario in which the stress varies across the thickness of each lamina (along the z-axis). If the
transformed reduced stiffness matrix is the same for all laminae in the laminate structure, then the
only variable becomes the position of each lamina from the mid-plane given by the z-coordinate.
Determination of force and moment resultants for each lamina
This section describes how to determine the mid-plane strain and curvature values from the strain-
displacement equation 2.48 after loading the laminate structure as described by Kaw [3]. The resultant
forces and moments sustained by each lamina can be calculated through integrating the stress over
the thickness of each lamina [3]. Having prior knowledge of the applied force, then the mid-plane
strains and curvatures can be found. The relationship between the applied load and the mid-plane
strains and curvatures will be explained in this sub-section.
Equation 2.83 calculates the thickness of a laminate by summing up the thicknesses of each lamina
along the z-axis.
1
n
k
k
h t
[2.83]

40
Where h is the laminate thickness and t is the thickness of each lamina. The mid-plane of the lamina
will obviously be located halfway through the laminate structure i.e. at h/2. The mid-plane will be used
as the reference point when locating the position of each lamina for example the top surface of the
first lamina from the top will be [+h/2] whilst the bottom surface of the last lamina will be [–h/2].
The resultant force per unit length (N) through the laminate thickness in the x-y plane can found by
integrating the global stress over the thickness of each lamina. Similarly, the resultant moments per
unit length (M) through the laminate thickness can be found by integrating the global stresses on each
lamina through the lamina thickness along the z-axis.
Figure 2.26: Resultant forces and moments on a lamina[3]
The stresses acting on a lamina within the laminate (Figure 2.26) can be replaced by resultant forces
and moments as shown the following equations:
/2
/2
h
x x
h
N dz
[2.84] /2
/2
h
x x
h
M zdz
[2.87]
/2
/2
h
y y
h
N dz
[2.85] /2
/2
h
y y
h
M zdz
[2.88]
/2
/2
h
xy xy
h
N dz
[2.86] /2
/2
h
xy xy
h
M zdz
[2.89]
In matrix form, the equations can be written as follows:
/2
/2
x xh
y y
h
xy xy
N
N dz
N
[2.90]
/2
/2
x xh
y y
h
xy xy
M
M zdz
M
[2.91]
Equations 2.90 and 2.91 for a single lamina simplifies to the following:
11
k
k
x xhn
y y
k h
xy xy k
N
N dz
N
[2.92]
11
k
k
x xhn
y y
k h
xy xy k
M
M zdz
M
[2.93]
Substituting for the global stresses from equation 2.54 results in the following:

41
1 1
11 12 16 11 12 16
12 22 26 12 22 26
1 1
16 26 66 16 26 66
k k
k k
o
x x xh hn no
y y y
k koh h
xy xy xy
k k
Q Q Q Q Q QN
N Q Q Q dz Q Q Q dz
NQ Q Q Q Q Q
[2.94]
1 1
11 12 16 11 12 16
2
12 22 26 12 22 26
1 1
16 26 66 16 26 66
k k
k k
o
x x xh hn no
y y y
k koh h
xy xy xy
k k
Q Q Q Q Q QM
M Q Q Q zdz Q Q Q z dz
MQ Q Q Q Q Q
[2.95]
By evaluating the integrals and summation signs, the above equations simplify to:
11 12 16 11 12 16
12 22 26 12 22 26
16 26 66 16 26 66
o
x x x
o
y y y
o
xy xy xy
N A A A B B B
N A A A B B B
N A A A B B B
[2.96]
11 12 16 11 12 16
12 22 26 12 22 26
16 26 66 16 26 66
o
x x x
o
y y y
o
xy xy xy
M B B B D D D
M B B B D D D
M B B B D D D
[2.97]
Where elements of the [A], [B] and [D] matrix are calculated as follows:
1
1
[ ] ( ) 1, 2,6 1, 2,6n
ij ij k k k
k
A Q h h i and i
[2.98]
2 2
1
1
1[ ] ( ) 1, 2,6 1, 2,6
2
n
ij ij k k k
k
B Q h h i and i
[2.99]
3 3
1
1
1[ ] ( ) 1, 2,6 1, 2,6
3
n
ij ij k k k
k
D Q h h i and i
[2.100]
The [A], [B] and [D] matrices are referred to as the extensional, coupling and bending stiffness matrices
respectively. The extensional stiffness matrix [A] relates the resultant in-plane forces to the in-plane
strains, and the bending stiffness matrix [D] relates the resultant bending moments to the plate
curvatures [3]. The coupling stiffness matrix [B] couples the force and moment terms to the mid-plane
strains and mid-plane curvatures[3].
Summary on the CLT
As summarized concisely by Kaw [3], the following are the steps for analysing a laminated composite
subjected to the applied forces and moments using the CLT:

42
1. Determine the value of the reduced stiffness matrix [Q] for each lamina using its four elastic
moduli, E1, E2, ν12, and G12.
2. Find the value of the transformed reduced stiffness matrix for each lamina using the [Q] matrix
calculated and the fibre orientation angle of each lamina. The elements of the transformed
reduced stiffness matrix can be found using Equations 2.55 to 2.60.
3. Knowing the thickness, tK, of each lamina, find the coordinate of the top and bottom surface,
hi (i = 1…,n), of each lamina, using Equation 2.83.
4. Use the transformed reduced stiffness matrices and the locations of each lamina from step 3
to find the three stiffness matrices [A], [B], and [D] using Equations 2.98-2.100.
5. Substitute the stiffness matrix values found in step 4 and the applied forces and moments in
Equations 2.96 and 2.97
6. Solve the six simultaneous equations (2.96 and 2.97) to find the mid-plane strains and
curvatures.
7. Using the location of each lamina, find the global strains in each lamina using Equation 2.81.
8. For finding the global stresses in each lamina, use the stress–strain Equation 2.82.
9. For finding the local strains, use the transformation Equation 2.48.
10. For finding the local stresses, use the transformation Equation 2.47.
After determining the local stress and strain values for each lamina, they can be substituted into the
expressions or conditions for each failure theory to check for failure.
2.4 Novel, low-cost CFRP pressure vessel
2.4.1 Background Stuart Swan, along with other students, designed, built and tested a water powered rocket at the
University of Cape Town in 2015. The students worked under the Industrial CFD research group that
is led by Prof Arnaud Malan. The water rocket went on to break the previous world record for the
vertical altitude reached by a water rocket (623m) by a significant margin of about 30% [1]. During the
development of the water rocket, a novel, low-cost, design of a pressure vessel was created. The
pressure vessel was made up of a standard commercial filament wound CFRP composite cylindrical
pipe PVC end caps bonded on either end of the tube by SpaBond 340 LV adhesive. The pressure vessel
was low cost, lightweight and possessed a high strength-to-weight ratio. The inner surface of the
vessel was lined with a rubber which was meant to prevent leakage. An international patent
application was filed for the lining method using a liquid rubber [5].
2.4.2 Description of patent The CFRP pressure vessel had three main features (see Figure 1.4) namely the following:
CFRP cylindrical tube
End caps
Rubber lining

43
Figure 2.27: Cross-sectional view of the CFRP pressure vessel derived from the patent application [5]
The functions of those features are concisely described in Table 2.4.
Table 2.4: Features of the CFRP pressure vessel
Feature Description and function
CFRP cylindrical tube Made from CFRP through standard commercial filament winding
Main section of the vessel that bears the hoop, axial and potentially radial stresses induced due to the internal pressure.
End caps Custom built (i.e. machined) and bonded onto both ends of the cylindrical section using SpaBond 340 LV adhesive.
Close off and seal the open ends of the CFRP tube section to prevent leakage of the fluid contained within the vessel.
Resist the pressure load without yielding/fracturing.
Rubber lining Coated onto the inner surface of the CFRP cylindrical tube.
Serves the purpose of “closing up” any micro-cracks in the CFRP tube to prevent the contents of the vessel from leaking through the CFRP tube’s wall.
This type of pressure vessel is mostly composed of filament wound CFRP making it similar to a Type IV
hydrogen gas vessel they both have polymeric based liners. However, it differs from the Type IV vessel
in three main aspects.
Type IV vessels are made through filament winding CFRP onto pre-formed polymeric liner [66].
The rubber lining used in the novel CFRP pressure vessel alternatively is applied post-
manufacture of the CFRP tubes [1].
The liner for the Type IV vessel is structurally rigid while the rubber liner for the novel vessel
is not rigid.
For the Type IV vessels, winding CFRP onto their curved ends could only performed through
specialist multi-axis filament winding machines while the novel, low-cost vessel only requires
a simple two-axes filament winding machine [100-101]. This tends to make the manufacturing
process for the novel CFRP pressure vessel less expensive.
The liners for Type IV vessels are pre-formed which is time-consuming and requires specialist
manufacturing processes to ensure the structural integrity of the liner before the carbon fibres are
wrapped around them [62]. As a result, the pre-formed rigid polymeric liners tend to have a
End cap 2
CFRP cylindrical pipe End cap 1

44
substantial mass as they need to have sufficient structural integrity, thus, adding significantly to the
weight of the pressure vessel [1]. The use of a thin rubber lining in this novel pressure vessel makes it
less expensive and lighter than those for Type IV vessels. Hence, from those points of views, it can be
inferred that the pressure vessel design based on the record-breaking water rocket might potentially
be a lighter and lower cost alternative as a pressure vessel to Type IV pressure vessels. Therefore, after
designing and manufacturing the novel pressure vessel, several pressure tests need to be performed
to ensure the vessel has sufficient strength and assessing the ability of the liner to prevent the escape
of the pressurized fluid from the vessel in the long term.

45
3. Design and manufacture of the CFRP pressure vessel This chapter deals with the design of the components of the CFRP pressure vessel namely the CFRP
cylindrical tube section, end caps and rubber liner. The aspects pertaining to the design of the CFRP
pressure vessel include but are not limited to stress analysis, sizing and material selection.
3.1 CFRP tube design The CFRP Tube is the part of the pressure vessel which will sustain most of the loading i.e. hoop,
longitudinal and possibly radial stresses (depending on the thickness of the vessel). The CFRP tube will
have to be appropriately designed to handle the stresses induced by the internal pressure. However,
since the CFRP material is not isotropic like the conventional metals, conventional stress and strain
models, and/or failure theories for isotropic materials will not suffice. The Classical Lamination Theory
(CLT) considers the orthotropic nature of the laminate structure and was chosen to be used to predict
the mechanical behaviour of the laminate structure under the applied stresses.
3.1.1 Manufacturing The CFRP tube is to be manufactured through filament winding. The filament winding is to be
performed by a local company called GRP Tubing in Cape Town, South Africa. The carbon fibre is to
pass through a bath of an epoxy resin under tension before being wound onto a cylindrical shaped
mandrel until the desired thickness for the laminate structure is reached. Both the carbon fibre and
the epoxy resin are locally sourced at AMT Composites and Aerontec respectively. The CFRP tubes are
to be post-cured according to the prescribed method for the epoxy resin AR600 + AH2336 hardener
[102]. The post-curing schedule was as follows: 2 hours at 80°C + 3 hours at 150°C + 4 hours at 180°C.
According to the data sheet for the epoxy resin AR600 [102], the increase in temperature between
the 3 different temperature plateaus (for example the increase in temperature between 80°C and
150°C) was to be between 1.5°C and 2.0°C. The cooling down between the plateaus until the room
temperature was reached had to be at the same rate. The choice in using the epoxy resin AR600 and
its associated hardener was mainly because of its low cost, availability and desirable properties which
include the following:
Low viscosity
Good mechanical properties
Good thermal properties
Suitability for use in filament winding
3.1.2 Laminate stacking arrangement Before choosing the stacking arrangement however, a decision needed to be made as to whether the
laminate structure was balanced or symmetric or both. A balanced laminate structure causes the
coupling stiffness matrix [B] to be a zero matrix. The uncoupling between extension and bending in
symmetric laminates makes the analysis of such laminates simpler while it also prevents a laminate
from twisting due to the effects of thermal loads which may be a result of temperature fluctuations
[3]. Alternatively, symmetric laminates have higher bending stiffness than that of any asymmetric
laminate composed of the same layers [95]. This also makes them advantageous from that
perspective. Therefore, it was chosen that the laminate structure for the CFRP tube had to be balanced
and symmetric about the mid-plane of the laminate. The angle-ply laminate structure was then chosen
as the stacking arrangement because inherently, they have a balanced structure and have relatively
higher stiffness and strength properties [3].
.

46
3.1.3 Stress analysis for the CFRP tube According to Hearn [77], if an internal pressure is induced in a cylindrical shaped vessel with closed
ends, it will experience hoop, longitudinal and possibly radial stresses. There are two theories that
were used to evaluate the applied stresses namely the Thin and Thick cylinder theories. However, the
choice of which theory to use depended on the ratio of the pressure vessel’s internal diameter to wall
thickness.
Sizing the CFRP tube
The volumetric capacity of Type III and IV CFRP pressure vessels used in a HFCPV is at least 180 litres
for a vessel of 1 m length [28]. That would translate to an internal diameter of about 240 mm. The
costs involved in procuring CFRP tubes of that diameter would have been relatively expensive as it
would have required a substantial amount of carbon fibre tow material to be used. However, the same
stresses experienced by a CFRP tube with a 240 mm internal diameter would be the same as the
stresses induced in a 50 mm internal diameter tube so long as the ratio of the internal diameter to
wall thickness of the tubes remained the same in both cases [76]. Because 50 mm diameter was the
smallest internal diameter size GRP Tubing could produce through filament winding, it was the internal
diameter that was ultimately chosen for the CFRP tube test specimens.
To determine the required wall thickness sufficient for the CFRP tube to withstand induced stresses,
the tube was first assumed to be a thin cylinder with a wall thickness that is 5% of the internal diameter
i.e. 2mm thick. Subsequently, the Thin Cylinder theorem was to be used to determine the hoop and
longitudinal stresses acting on the entire laminate structure. These two stresses would be the global
stresses acting on the laminate structure.
The initial set of mechanical strength and stiffness properties for the CFRP tubes were determined
using the results of the ASTM tensile tests described in chapter 5. This initial set of material properties
were substituted into the equations based on the CLT (see section 2.3.4.2 for more details) to
determine the local stresses and strains of each lamina within the laminate structure of the CFRP tube.
The applied local stresses and strains along with the strength properties of the CFRP tube could then
be used in conjunction with the failure theories to determine if the CFRP tube would burst at a given
pressure. The Maximum Stress failure theory was chosen as the failure theory that would be used in
initially sizing the wall thickness of the first CFRP tube. It was chosen because it is simple to use,
predicts the failure mode and is widely used in industrial applications [103]. In addition, the UTS of
the CFRP in the direction transverse to the fibre direction was found to be significantly lower than the
other two strength property values (see Table 3.6). According to M. J. Hinton et al and N. Tiwari [103,
104], the failure of individual unidirectional laminae in transverse-tension loading conditions is better
characterized by a Maximum Stress failure criterion within each affected lamina. Hence, it was
reasonable to assume that the CFRP tube would fail in the direction of loading transverse to the fibre
direction. This further justified the use of the Maximum Stress failure theory. The detailed steps and
calculations that were taken to size the tube through stress analysis is detailed below.
CLT calculations
The main design constraints that were used in the sizing of the CFRP tube were as follows:
Failure Pressure [P] - 350 bar
Internal Diameter [Di] - 50 mm
Wall thickness [t] - 2 mm

47
Because the wall thickness was chosen to be 2 mm initially, eight laminae of unidirectional CFRP
material were required since each layer (or lamina) was approximately 0.25 mm thick. It should be
noted that the failure pressure in this instance refers to the pressure at which the CFRP would be
permanently damaged.
Applied stresses on the CFRP tube
The stresses calculated based on the Thin Cylinder theorem using equations 2.1 and 2.2 as follows:
Hoop stress: 437.52
H
iPDMPa
t
Longitudinal stress: 4
218.8iL
PD
tMPa
The CLT was developed to deal with two dimensional plane stresses acting on a thin laminate [3, 98].
The plane stresses that were acting on the laminate structure at every point on the surfaces (internal
or external) of the cylindrical tube were the hoop and longitudinal stresses.
In the context of loading a laminated composite structure, the stresses exerted on the laminate are
termed global stresses (in the x-y coordinate system). The global stresses had to be resolved on an
infinitesimal element on the surface as shown in Figure 3.28.
Figure 3.28: Illustration of the stresses acting on an infinitesimal point on the surface of cylinder [105]
The longitudinal stress acts along the axis of the cylinder in the x-direction and the hoop stress acts
perpendicular to the axis of the cylinder in the vertical y-direction. Because of the induced load due
to the internal pressure, there were no shear stresses involved according to Hearn [77].
218.8
437.5
0 0
x L
y H
xy
MPa
According to Shultz et al [106], the optimum winding angle for maximum burst strength of a CFRP
cylindrical pressure vessel when using the Maximum Stress failure theory is 50o. Therefore, the
symmetric angle-lamina laminate structure was set with fibres oriented at +50o and -50o. The
transformation matrix [T] for each lamina is dependent on the fibre orientation angle. Laminae with
fibres oriented at +50o had a specific transformation matrix [T1] and those with fibres oriented at –50o
had their own specific transformation matrix [T2]. The respective transformation matrices were
determined using equation 2.49 are as follows:
y
x

48
1
0.413 0.587 0.985
0.587 0.413 0.985
0.492 0.492 0.174
T
and 2
0.413 0.587 0.985
0.587 0.413 0.985
0.492 0.492 0.174
T
Reduced and transformed reduced matrices
The values of the elements in the reduced stiffness matrix [Q] were not dependent on the fibre
orientation angle for the laminae. This is because the elements of matrix [Q] are only dependent on
the material properties of the CFRP tube composite. Therefore, the [Q] matrix was the same for all
laminae. The initial material stiffness property values (see section 5.1 for more details) as well as the
Major and Minor Poisson’s ratios for the CFRP material with a fibre volume fraction of 50% are shown
in Table 3.5. The fibre volume fraction of 50% was assumed for tensile test specimens (see section 5.1)
and was intended to be used in making the CFRP tubes as well.
Table 3.5: Initial material property values for the CFRP composite material
Property Symbol Value
Longitudinal Elastic Modulus 1
109 GPa
Transverse Elastic Modulus 2
6 GPa
Major Poisson’s Ratio 12
0.3
Minor Poisson’s Ratio 21
0.02
11 12 16
12 22 26
16 26 66
109.5 1.809 0
1.809 6.03 0
0 0 5
Q Q Q
Q Q Q Q GPa
Q Q Q
Because the value of elements of the transformed reduced stiffness matrix [ ]Q
depends on the fibre
orientation angle, laminae with fibre orientation angle of + 500 had a different [ ]Q
matrix to those
with fibre orientation angles of -500. For laminae with fibre orientation angles of +50o and -50o, the
transformed reduced stiffness matrices were 1[ ]Q
and 2[ ]Q
respectively.
1 2
26.5 24.1 21.6 26.5 24.1 21.6
24.1 44.5 29.4 24.1 44.5 29.4
21.6 29.4 27.3 21.6 29.4 27.3
Q QGPa and GPa
Extensional, coupling and bending stiffness matrices
Looking at the cross section of the CFRP tube’s laminate structure, the top and bottom surfaces of
each lamina were allocated a position with respect to the z-coordinate. The mid-plane had a z-position
of 0 mm whilst the topmost and bottom surfaces of the laminate were half of the thickness of the
laminate on either side of the laminate (i.e. ± 1 mm). The positions of the top and bottom surfaces of
the laminae (hK) in the laminate were determined using equation 2.83 (see section 2.3.4.2 for more
details).

49
Using the positions of the top and bottom surfaces of each lamina as well as the transformed reduced
stiffness matrix, the extensional [A], coupling [B] and bending [D] stiffness matrices were evaluated
using equations 2.98-2.100. The coupling stiffness matrix [B] resulted in a null matrix as expected
which meant the forces and the moment terms were de-coupled.
0.053 0.048 0
0.048 0.089 0
0 0 0.055
A GPa m
2
0 0 0
0 0 0
0 0 0
B Pa m
3
0.018 0.016 0.005
0.016 0.030 0.007
0.005 0.007 0.018
D kPa m
Stresses and strains in the laminate
The global stresses acting on the laminate structure were integrated over each lamina to give the
resultant forces per unit length (N) acting on each lamina within the x-y plane through the laminate
thickness. Similarly, integrating the global stresses over the thickness of each lamina gave the
moments acting per unit length (M) acting on each lamina. All the moment terms (Mx, Mxy and My)
and the shear force term (Nxy) yielded a zero value apparently because there were no applied
moments or shear stresses according to the Thin Cylinder theorem.
The resultant forces and moments per unit length acting on each lamina was then substituted into the
equations 2.96 and 2.97 along with the [A], [B] and [D] matrices to form simultaneous equations. The
simultaneous equations were solved to determine mid-plane strains and curvatures. To determine the
global strains for each lamina within the laminate, the mid-plane strains and curvatures were
substituted into the strain displacement equation 2.81 as follows:
0.002919
0.009212
0
o o
x x x
o o
y y y
o o
xy xy xy
z
The result was that all laminae within the laminate had the same strain vector because the mid-plane
curvature vector was a null vector. Hence, the strain across the thickness of the laminate, did not
depend on the position of the lamina along the z-axis. As a result, the laminae supposedly were
“strained” similarly for all orientations thereby preventing a situation where adjacent laminae have
different strains which would probably result in failure due to interlaminar shear.
Having determined the strains for each lamina in the x-y coordinate system, the global stresses for
each lamina were determined using equation 2.54. Laminae with fibres oriented at +50o effectively
had the same magnitude of the global stresses to those with the fibre orientation angle of -50o as
shown:

50
For laminae with fibre orientation angle of +50o: For laminae with fibre orientation angle of -50o:
1
144.7
339.4
208.1
x x
y y
xy xy
Q MPa
2
2 2
2
144.7
339.4
208.1
x x
y y
xy xy
Q MPa
Using the transformation matrices [T1] and [T2], the local stresses and strains for the laminae were
determined as shown below.
For laminae with fibre orientation angle of +50o:
1
2 1
12
463.8
20.22
59.731
x
y
xy
T MPa
1
2 1
12
0.00420
0.00209
0.00597
x
y
xy
T
For laminae with fibre orientation angle of -50o:
1 2 2
2 2 2 2
12 2 2
463.8
20.22
59.731
x
y
xy
T MPa
1 2
2 2 2
12 2
0.00420
0.00209
0.00597
x
y
xy
T
The CFRP material strength properties (see section 5.1 for more details) given in Table 3.6 for the three
loading orientations. They were compared with the local applied stresses within each lamina as
required by the Maximum Stress failure theory.
Table 3.6: Ultimate strength values for the CFRP tube for each orientation of loading
Property Symbol Value [MPa]
Ultimate Tensile Strength in the 0 O direction 1 max
1357
Ultimate Tensile Strength in the 90 O direction 2 max
14.8
Ultimate In-plane shear strength 12 max
60
The result was that each lamina in the 2 mm CFRP tube laminate structure would fail in the direction
transverse to the fibres since the respective applied local stress (20.22 MPa) was higher than the
corresponding ultimate transverse strength (14.8 MPa). Therefore, the CFRP tube needed more
layers/laminae to prevent failure. Therefore, more layers were added sequentially and iterations of
the CFRP tube’s stress analysis were performed until it was determined that the minimum thickness
had to be 4 mm to avoid failure. The local applied stresses for each lamina in the 4 mm CFRP tube
laminate structure was determined to be as follows:
1
2
12
325.764
13.056
41.618
MPa
The detailed calculations for the 4 mm CFRP tubes can be found in Appendix A.

51
3.1.4 Optimization of filament winding angle Because most of the load carrying capacity of a polymer matrix type composite is within its
unidirectional long and continuous fibres, they are usually designed with most of the fibres oriented
in the direction of loading [3, 78, 91]. This allows the designer of the composite to save in terms of its
weight which is one of the advantages of a composite over a conventional isotropic material in the
context of cylindrical pressure vessels. Since the hoop stress is approximately twice the value of the
longitudinal stress, the former is the limiting case when designing a pressure vessel constructed from
an isotropic material. The pressure vessel becomes over-designed in the longitudinal direction as a
result. In a filament wound CFRP pressure vessel, the filament winding angle of the CFRP tube becomes
a significant design consideration which needs to be optimized to ensure the maximum load carrying
capacity of the vessel. In turn, this would ensure that relatively less material (or layers of carbon fibre)
is needed to make the vessel which lowers the weight and the cost incurred in constructing the
pressure vessel.
As stated previously, it was predicted that the CFRP tube would probably fail in the direction
transverse to the fibres [104, 107]. Hence, it was decided to use the Maximum Stress failure theory to
predict the optimum filament winding angle for a failure pressure of 350 bar. Given the material
properties shown in Table 3.6, the local stresses and strains were determined using the CLT model
calculations for each lamina within the 4 mm thick CFRP tube laminate for a range of filament winding
angles from 45o till 60o.
The safety factors for the same range of filament winding angles were calculated as the ratios of the
maximum local stresses to the applied local stresses for each loading orientation. A sample calculation
of the safety factor for the winding angle of 50o is given below:
The applied local stresses for each lamina:
1
2
12
325.764
13.056
41.618
MPa
The safety factors for each direction of loading:
1 max
1
1
2 max
2
2
12
12 max
12
4.17
1.13
1.44
n
n
n
The safety factors were plotted against the winding angles of the fibres in the laminae within the
laminate as shown in Figure 3.29. According to the graph, the curve for the direction of loading along
the fibres (1-direction) has a minimum peak between 50o and 53o then increases in either direction.
The curve for direction 2 (transverse to the fibres), peaks just above 51O as well and decreases in either
direction from that angle. The loading in the 1-2 plane peaks at 60O and decreases from that peak at
a faster rate than the other two curves. In this case, the loading orientation with the minimal safety
factor values was that of the direction of loading transverse to the fibres. It was therefore the limiting
case and it was reasonably assumed that the laminate structure would fail in the direction transverse
to the fibres which has a strength dominated by the matrix [3-4, 95].

52
Figure 3.29: Graph of the safety factor vs the filament winding angle for each orientation
Therefore, the peak of the curve for direction 2 was determined to be the point that would give the
optimal design safety factor. The other safety factors for direction 1 and plane 1-2 were inferred from
the line that passes through the optimal point which was at approximately 520. However, the
manufacturer (GRP Tubing) could only guarantee a filament winding angle of 50o which was also the
reported optimal winding angle by Shultz et al [106]. It was eventually used in the manufacturing of
the CFRP tubes.
3.2 End cap design The end caps are to be secured to each end of the filament wound CFRP cylindrical tube using SpaBond
340 LV adhesive in a similar fashion to that employed in the water rocket design. The end cap design
used underwent several iterations to improve it to better suit the pressure vessel requirements. The
functions of the end caps are three-fold, to resist the load due to the pressure of the fluid, to seal the
pressure vessel thereby preventing leakage and to allow gas storage fittings to be incorporated onto
the vessel. The end caps will incorporate O-rings in their design which will assist in containing the
contents of the vessel from leaking to the outside. Stress analysis and suitable material selection were
essential in the design of the end cap if it is to fulfil its intended purposes.
4,17 4,16 4,16
1,131,20
1,20
1,44
1,65 1,93
0,00
1,00
2,00
3,00
4,00
5,00
6,00
7,00
8,00
45 47 49 51 53 55 57 59
Safe
ty F
acto
r
Angle (degrees)
Maximum Stress Failure Theory- Safety Factor vs Winding Angle
Direction 1 Direction 2 Plane 1-2

53
3.2.1 Geometrical features of the end cap To achieve the three functions of the end cap, there were certain geometrical features that had to be
designed including grooves for O-rings and provision for a bond area. Below are schematics of the
simplified end cap concept. This was adopted from the water rocket design [1].
Figure 3.30: Cross-sectional schematic (left) and isometric view (right) of the simple end cap design employed in the water rocket project [1]
The hemispherical dome shown in Figure 3.30 above allows the pressure in the vessel to be divided
equally across the surface which reduces the possibility of stress concentrations [48]. According to
[54], the hemispherical shape on the end cap is also the most efficient shape for pressurized storage.
The pressure acting on the hemispherical dome will not only result in the end cap being pushed
longitudinally outwards but also in the hoop direction against the internal surface of the CFRP tube.
This will ensure that the adhesive layer should not experience tension but always be in compression.
This is helpful as the adhesive is generally weak under tension [108]. There is an O-ring which should
effectively seal the vessel preventing any contact between the contents of the vessel with the outside
environment. The bond area on the external surface of the end cap will be the designated area where
the SpaBond 340 LV adhesive will be applied. The adhesive layer will effectively bond the end cap onto
the inner surface of the CFRP tube at the end. The bond in this configuration would experience
predominantly shear as a result of the internal pressure being exterted on the end cap. A visual
representation of how the end cap will be assembled onto one of the ends of the CFRP tube is shown
in Figure 3.31.
Concave hemispherical
dome

54
Figure 3.31: Cross-sectional view of one of the ends of the CFRP tube with an end cap secured by SpaBond 340 LV adhesive
Two end caps are needed to seal off the open ends of the CFRP tube. However, one of the two end
caps will have to accomodate appropriate end fittings that will facilitate the insertion or removal of
the fluid(s) contained within the pressure vessel. To achieve this, one of the end caps will require a
threaded hole for a male threaded connection of an appropriate end fitting. The threaded hole was
chosen to be of British Standard Pipe (BSP) standard which is quite common in industry for pressure
vessel connections. Figure 3.32 illustrates both of the end caps bonded onto the both ends of the CFRP
tube.
Figure 3.32: CFRP tube with the two end caps secured on both ends
3.2.2 Material selection The material selection for the end cap was guided by the following design considerations:
The material should have a sufficiently high yield strength to resist failure due to the loading
induced by the internal pressure of the fluid in the vessel.
The material should have a lower elastic modulus than the CFRP tube in the hoop-direction.
The material should be compatible with SpaBond 340 LV which is a suitable epoxy-based
adhesive used to bond the end cap to the CFRP tube.
The material should be easy to fabricate/machine.
The material should be as cheap as possible.
End cap without the
threaded hole
End cap with the
threaded hole

55
The material should have a low mass density.
The material selection was mainly performed by using the CES EduPack 2017 software [109] as it
contained most of the conventionally available materials in use currently. The parameters used were
based on the above-mentioned design factors as shown below:
(a) The material had to have a minimum yield strength of 200 MPa and a maximum elastic
modulus of 100GPa. These 2 parameters were entered the respective input fields which
filtered out most of the materials leaving only 11 materials (mostly metallic) from which to
choose from.
(b) The second step involved choosing a material with a tensile strength of at least 300 MPa from
the remaining 11 materials which narrowed down the list of materials to 6 with 5 of them
being metallic based materials and the other being CFRP composite.
(c) Ultimately, the last selection criteria were based on the mass density and the cost of
procurement for the materials. Below is Table 3.7 that was drawn up containing the materials
left from the previous step (except for CFRP) along with their respective densities and unit
cost which were available within the software.
Table 3.7: Typical costs of the different materials as quoted from the CES Edupack software [109]
Material Density [kg/m3]
Cost per unit mass [US$/kg]
Age-hardening wrought Aluminium Alloys 2500-2900 1.9-2.0
Brass 7900-8500 4.29-5.03
Bronze 8500-9000 5.97-6.98
Commercially pure titanium 4500-4520 12.7-14.3
Zinc die-casting alloys 4950-7000 2.21-2.42
Because of the need to build a lightweight CFRP pressure vessel, the material for the end caps had to
have a low mass density to contribute as little weight as possible to the total weight of the CFRP
pressure vessel. In addition, the material to be chosen also had to have a relatively low cost which
would not add considerably to the pressure vessel’s total cost. Of all the materials available,
aluminium was the best choice based on mass density and cost as it ranked lowest in both cases. Zinc
also had low cost and densities relative to other materials but compared to aluminium it had almost
twice the density. Titanium had also a reasonably low density though it costs almost six times more
than aluminium which disqualified it from further consideration. Brass and bronze both had densities
that were about three times more that of aluminium whilst costing significantly more which made the
not ideal for this application. Hence, aluminium was the clear choice of material to use to make the
end caps. Aluminium 6082-T6 was the type of aluminium that had the required mechanical properties
and was readily available to use. A summary of its mechanical properties is listed in Table 3.8.
Table 3.8: Aluminium 6082-T6 mechanical properties [110]
Property Unit Value
Proof stress MPa 245
Tensile strength MPa 300
Tensile Modulus GPa 70
Density kg/m3 2700

56
3.2.3 Stress analysis for the end cap The end cap will experience two different types of loading namely the distributed direct force due to
internal pressure from the fluid pushing on the end cap and the shearing on the epoxy adhesive layer.
Figure 3.33 exhibits the end cap with the uniformly distributed pressure load (in blue) and the shear
force applied by the adhesive layer (in orange).
Figure 3.33: Illustration of the types of loading on the end cap
Shear stress due to the epoxy adhesive bond
Because the pressure will be acting on the side of the end cap with the hemispherical dome, the
interface with the epoxy adhesive will experience shear stress. This is a result of the end cap being
“pushed” outwards by the pressure of the fluid while the adhesive layer resists the pressure by holding
the end cap. The equation 3.1 was used for calculating the shear stress as shown below:
s
s
F
A [3.1]
where s is the shear stress in [MPa],
F is the shearing force in [N] and
SA is the bond area undergoing shear [mm2]
The shearing force, F, due to the pressure acting on the hemispherical dome of the end cap is
determined by equation 3.2 below:
PF P A [3.2]
where P is the internal pressure of the vessel in [MPa] and
PA is the projected area of the hemispherical end in [mm2]
Shear Force
on bond
[F]
Epoxy adhesive bond

57
Sizing the end cap
The end cap has several dimensions as shown in Figure 3.34. The outer diameter was derived from
the internal diameter of the CFRP tube. Hence, the outer diameter of the end cap had to be 50 mm.
The bond area has two main dimensions namely the bond line thickness and the length. The bond line
thickness is the distance between the inner surface of the CFRP tube and the bond area. The
recommended bond line thickness when using epoxy adhesives to bond aluminium was in the range
of 0.5-1.5 mm [111]. Thus, a bond line thickness 1.5 mm was chosen. Knowing both the end cap outer
diameter and the bond line thickness, meant that the bond area diameter could be computed.
Figure 3.34: Schematic of a simple end cap with the respective dimensions
Calculations of the bond area length
Using the properties and dimensions in Table 3.9 below, some basic calculations were performed to
obtain the maximum applied shear stress on the epoxy adhesive bond.
Table 3.9: Dimensions of the end cap and other properties
Property Symbol Value Units
Internal diameter of vessel or end cap outer diameter iD
50 mm
The diameter of the bond area id
47 mm
Internal pressure within the vessel P 350 [35]
bar [MPa]
Theoretical shear strength of the Spabond 340 LV s
34 MPa
Safety factor n 2.5
The pressure acting on the end cap manifests as a shearing force that will attempt to push the end cap
outwards. That maximum applied force was found to be the following:
68.722s pF P A kN

58
There were two bond interfaces namely (a) the interface between the adhesive layer and tube and (b)
the interface between the adhesive layer and the end cap. The adhesive bond was likely to fail on one
of those two interfaces which was later established by the end cap adhesive shear tests covered in the
next chapter. The applied shear stresses of both the interfaces were determined as shown below:
(a) Interface between the adhesive layer and the CFRP tube
Shear Area 21 50 50iSA D h h h mm
Minimum bond area length, 32.250
s
s
F nh mm
(b) Interface between the adhesive layer and end cap
Shear Area 22 47 47iSA d h h h mm
Minimum bond area length, 34.247
s
s
F nh mm
Case (b) gave a higher value for the bond area length proving to be the worst case. Therefore, the
minimum bond area length was rounded up to be 35 mm.
Applied stress and deflection due to the pressure
Besides causing shear, the pressure, P, will also cause the end cap to deform as previously explained.
Assuming the adhesive layer’s bond does not fail in shear, a direct uniformly distributed force will be
applied directly onto the end cap in the form of a pressure acting on the curved surface area of the
hemispherical dome. As such, the end cap will also need to resist yielding under the influence of this
load. Because of the shape of the end cap, determining the applied stress acting on each point on the
end cap is complex. The values of applied stresses and hence induced strains on the end cap are not
uniform for every point. However, this problem can be simplified if one is to assume that the end cap
takes on the shape of a circular disc/plate with clamped flat ends as shown in Figure 3.35. An analytical
solution could be simpler to solve for the circular disc of constant thickness than the end cap in Figure
3.33.
Figure 3.35: Isometric view (left) of a simple circular disc as well as the same disc when secured onto one of the ends of the CFRP tube (right)

59
Some of the assumptions that were made are as follows:
1. The pressure acting on the flat face of the disc is constant at all points on that face
2. The circular edge was fully constrained/clamped by the epoxy adhesive bond
3. The CFRP tube was considered to have negligible deformation in the hoop direction since the
tube had a higher elastic modulus than the circular aluminium disc.
According to E.J. Hearn [76], the circular disc similar to the one shown above can be analysed
analytically and the applied stress as well the deflection could be determined. The maximum
deflection occurred at the centre of the disc whilst the maximum stress occurred on the
clamped/constrained circular edge. The equations for the maximum deflection and applied stress
were as follows:
Maximum deflection:
4
2
3
3(1 )
16
qR
Et [3.3]
Maximum applied stress:
2
2
3
4R
qR
t [3.4]
Where q is the pressure, R is the radius of the disc, v is the Poisson’s ratio for the material of disc, E is
the elastic modulus for the disc and t is the disc thickness.
With most of the variables required to solve the above equations known, the disc thickness was the
only unknown in this case. To determine the minimum thickness required for the disc to avoid
permanent deformation, the maximum applied stress had to be equated to the yield strength of the
material of the circular disc (i.e. Aluminium 6082-T6)
Table 3.10: Design variables for sizing and analysing the stresses on the end cap
Property Symbol Value
Radius of the disc R 25 mm
Poisson’s ratio for Aluminium [112] 0.35
Elastic Modulus of Aluminium 6082-T6 [110]
E 70 GPa
Yield Strength of Aluminium 6082-T6 [110]
y 255 MPa
Maximum pressure within the vessel q 35 MPa
Given the data in Table 3.10, the minimum thickness required for the circular plate was as follows:
2 2
6
3 3(35)(25 )8.02
4 4(255 10 )R
qRt mm
For a plate thickness of 8.02 mm, the maximum deflection at the centre of the circular plate was
determined to be as follows:
6 3 4
2
9 3 3
3(35 10 )(25 10 )(1 0.35 ) 0.0623
16(70 10 )(8.02 10 )mm

60
However, the actual thickness of the end cap was determined to be at least 35 mm (i.e. the bond
length) which made it reasonable to conclude that the end cap would not fail due to the applied stress
nor would it have a significant deflection.
The actual aluminium end cap was modelled in SolidWorks 2017-18 with a total length of 50 mm with
a hemispherical dome with a 19 mm radius. The Finite Element Analysis (FEA) tool within the software
was used to model all the types of loading on the end cap (see Figure 3.36 below) and investigate the
resulting effects. The major assumption that was made for the FEA tool was that the surface on the
end cap in contact with internal wall of the CFRP tube was fixed meaning that it was constrained from
deforming in the hoop direction. The assumption was based on the fact that CFRP tube was stiffer
than aluminium in the hoop direction.
Figure 3.36: Illustration of the applied forces on the end cap as modelled in the FEA software
After running the FEA model, the maximum deflection was determined to occur at the centre of the
hemispherical dome (which was characterized by the red in colour in the Figure 3.37) with a value of
0.01311 mm.

61
Figure 3.37: Illustration of the FEA deflection/deformation result for the first end cap design
It was also worth noting that there was a significant amount of deformation on the bond area
according to colour spectrum scale on the right side of the above figure. This meant that the bond
area would press the epoxy adhesive bond against the internal wall of the CFRP tube which was
favourable for its shear properties [108]. If the bond was to experience tension, cleavage would have
likely occurred at a lower pressure than 350 bar. In addition, there was also an appreciable amount of
outward deformation in the groove in which the O-ring would sit which meant that the O-ring would
be pushed against the inner wall of the CFRP tube ensuring that the O-ring should adequately seal the
vessel.

62
Figure 3.38: Illustration of the FEA stress result for the first end cap design
In Figure 3.38 above, the FEA results for the applied stress showed that the maximum stress occurred
on a circular edge of the end cap that would be in contact with CFRP tube and was immediately
adjacent to the bond area. The value of the stress at that edge was about 123 MPa which was
approximately half of the yield strength of Aluminium 6082-T6. Therefore, the FEA result confirmed
that the end cap should not yield under these loading conditions.
3.2.4 Design iterations The end cap underwent two design iterations after the first design in a bid to ensure they fulfil their
predetermined functions. This section will describe each of the three end cap designs that were
developed. The detailed drawings for each of the designs can be found in Appendix B.
First end cap design
The initial design geometry employed for the end cap was based solely on the design used in the water
rocket project [1]. Figure 3.39 shows a cross section of the schematic of the first end cap design with
hemispherical dome, end cap groove and the designated bond area labelled.
Circular edge with
maximum stress

63
Figure 3.39: Schematic of the cross section of first end cap design
The end caps based on the first design were machined (see section 7.2.5 for more details on end cap
manufacturing) and bonded with SpaBond 340 LV adhesive onto the CFRP tubes to form a prototype
specimen CFRP pressure vessel. The resin for the SpaBond 340 LV adhesive had been mixed with a
slow hardener to form a grey adhesive mixture as shown in the photographs in Figure 3.40. The
prototype vessel was subjected to a hydrostatic burst test (more details to be covered in the later
chapters). The bond area on one of the two end caps of the pressure vessels failed through shear at a
pressure of just over 130 bar which was significantly lower than what was expected. The shear failure
occurred on the surface of the aluminium end cap that was in contact with the bond as anticipated.
After failure, the end caps were pressed into the vessel so that the bond area could be inspected
visually. Figure 3.40 below displayed the voids that formed on the end cap to adhesive layer interface
in great detail.
Figure 3.40: Photographs illustrating failure through shear on the surface of the first design of the end caps
The voids effectively reduced the surface area of the bond that was in contact with the end cap which
possibly resulted in the lower shear strength value of the bond (about 5 MPa as compared to the
theoretical value of 34 MPa). The formation of voids was observed to have been attributed to the
application method of the adhesive. This method involved applying the adhesive on the bond area on
the external surface of the end cap by smearing it on before pushing it into one of the ends of the
CFRP tube as illustrated in Figure 3.41:
Voids Voids
End Cap
Adhesive
layer
CFRP
Tube
Concave hemispherical
dome

64
Figure 3.41 Illustration of the initial application method of the epoxy adhesive onto the first end cap design
The initial adhesive application method involved the following steps:
The internal surface of the CFRP tube and the external surface of the end cap had to be
abraded with emery cloth with grit of 80.
The two surfaces then had to be cleaned using acetone.
After mixing the Spabond 340 LV resin with the slow hardener, the adhesive mixture would
be smeared onto the bond area on the end cap as shown in the left image above
The end cap will finally be pushed into the CFRP tube and left in that position until the adhesive
sets.
Because of the pushing of the end caps into one of the ends of the CFRP tube, some of the adhesive
would likely be displaced by trapped air pockets. The trapped air pockets remained in the bond area
even after the adhesive would have set and formed voids. Consequently, this compromised the
strength of the bond when it was cured. Hence, the design of the end cap had to be altered to improve
the shear strength by eliminating the formation of voids.
Second end cap design
To eliminate the formation of voids in the bond area, altering the method of applying the adhesive
was required. The new method involved placing the end cap into an end of the CFRP tube then
introducing the adhesive into the bond area afterwards. The end caps had to have holes drilled into
them to provide a path for the adhesive to flow into the bond area as displayed in Figure 3.42.
Adhesive applied onto
bond area initially O-ring
CFRP tube
End cap pushed into the
end of the CFRP tube End Cap

65
Figure 3.42: Schematic of the cross section of the second end cap design
The adhesive mixture would flow through the angled holes to the bottom of the bond area before
flowing up to the top of the bond area thereby “displacing” any air (see Figure 3.43 below). The
SpaBond 340 LV in this case was used with the fast hardener as this was observed to produce a less
viscous adhesive mixture than when the slow hardener was used previously. The less viscous adhesive
mixture was ideal it allowed the bond area to be filled easily.
Figure 3.43: Illustration of how the new adhesive application method works with a detailed view of the flow path of the adhesive from the syringe, through the angled holes into the designated bond area
In Figure 3.44 is a photograph showing a uniform adhesive layer on the inner surface of the CFRP tube
after the end cap was pressed out. It shows that the second adhesive application method was more
successful as there were no discernible voids that formed on the bond. This resulted in a higher shear
O-ring
groove
Angled holes
Syringe
Flow path of
adhesive mixture
Angled hole in
the end cap
CFRP tube

66
area (and strength) than from the previous method. This was supported by the second set of end cap
adhesive shear tests that were performed (more details in the next chapter).
Figure 3.44: Photograph showing the adhesive layer after end cap had been removed
There were two prototype pressure vessels that were constructed using the second design that
underwent hydrostatic burst tests. The burst tests resulted in the two vessels failing at pressures of
162 bar and 220 bar which was an improvement from the previous test. However, the average shear
strength of the bond from the second set of shear tests (covered in the next chapter) was still far lower
than the value in the datasheet for SpaBond 340 LV. This may have been because the surface of the
end cap in contact with the bond was not rough enough to grip effectively onto the bond. In addition,
the big difference between the two failure pressures was likely due to the inconsistency in the surface
roughness between the end caps in those two vessels. Therefore, there was a need for rougher bond
area surface with a consistent surface roughness. Therefore, the leakage and surface roughness issues
needed to be addressed in the next end cap design.
Third end cap design
The third and final design improves on the results of the two previous designs firstly by further
improving leak tightness. To address the leaking issue, two O-rings were to be accommodated instead
of one, with two O-rings being more difficult to by-pass. The two grooves are shown in the schematic
in Figure 3.45. Secondly, to improve on the surface roughness, it was decided to have the bond surface
on the end cap knurled on a lathe. Knurling increases the surface roughness which is essential in
increasing the mechanical bond of the surface in contact with the adhesive layer. In addition, the
knurling would be consistent for all the end caps in terms of surface roughness which would also mean
that the shear strengths would be similar for all the pressure vessels. To increase the pressure at
which shear failure would occur, it was decided to increase the length of the bond surface on the end
cap by 20 % (through increasing the bond area length from 35 mm to 42 mm). The 20% increase in the
bond area length would only be applied to the end caps used in pressure vessels not in the end cap
adhesive shear tests. The second cap design can be found in Appendix B1.3.
Uniform
adhesive layer
cap
CFRP tube

67
Figure 3.45: Schematic showing cross-sectional view of the third end cap design with 2 O-ring grooves and a knurled bond area surface
3.2.5 End cap manufacturing The material to manufacture the end cap was selected to be Aluminium 6082-T6. Because the end cap
is to fit into the internal surface of the CFRP tube, it also has to be cylindrical in shape symmetrical
about a mutual central axis shared by both the tube and the end cap. The aluminium was initially
sourced in the form of a cylindrical bar of a higher diameter (60 mm) than the nominal external
diameter of the end cap. The bar of aluminium was secured on a lathe where it was turned which
reduced the diameter to the nominal diameter of 50 mm. The other lathe operations performed to
produce the desired end cap features (i.e. grooves, holes, hemispherical dome and knurled surface)
included parting off, drilling, knurling and internal boring.
3.3 Rubber liner Composites are generally porous in nature [3-4, 113]. The CFRP pressure vessel being designed and
manufactured might also form micro-cracks because of various phenomenon like varying thermal
cyclical loads that may arise due to filling the vessel with a gas [114]. These micro-cracks need to be
sealed lest the fluid contained within the vessel seeps out through them. To counter this problem,
Stuart Swan developed a method of lining the pressure vessel portion of the water rocket he built with
rubber [1]. For the CFRP pressure vessel, the rubber liner will also serve the main purpose of sealing
the internal surface of the CFRP tube to prevent leakage of the pressurized fluid within the vessel
through the CFRP tube section. Because the rubber lining is applied post-manufacture of the CFRP
tube, it saves on assembly and manufacturing costs making it cheaper as compared to those incurred
in manufacturing Type III and IV pressure vessels. Rubber as a material is also cheaper to purchase
than the pre-formed rigid aluminium and polymeric liners within the Type III and IV vessels. Rubber
has a relatively lower mass density meaning that the use of a rubber liner would lower the weight of
the pressure vessel considerably which should help increase its gravimetric density.
3.3.1 Liner application method The rubber that was used in the water rocket [1] is called VytaFlex 60 urethane rubber and it was to
be used in the CFRP pressure vessel as well. The rubber comes in the form of two separate liquid
components which are mixed by a 1:1 ratio and applied onto the inner surface of the pressure vessel
before it is left to set and then cure for 16 hours at room temperature as per the technical data sheet
provided by the manufacturer [115].
Knurled bond area
surface
Angled hole
Two O-ring
grooves

68
Procedure
Below is an in-depth description of the procedure that is followed when applying the rubber liner. This
procedure assumes CFRP tube has already has one end cap bonded to the CFRP tube with the other
end left open.
The open end of the tube had tape attached onto the section that would have the other cap
bonded onto the tube as shown in Figure 3.46. The tape was meant to prevent the rubber
from settling and curing onto that area as the rubber could have prevented the SpaBond 340
LV from bonding well with the inner surface of the CFRP tube.
Figure 3.46: Illustration of the rubber application method
The inner surface of the CFRP tube was first cleaned by a cloth to remove any dirt before being
wiped by a cloth with Acetone to remove any chemicals, residual dirt and/or oils that might
prevent the rubber from bonding well with the inner surface of the CFRP tube.
A rod with a sponge attached and secured (by washers, O-rings and a nut) as shown in Figure
3.47 was inserted into the CFRP tube.

69
Figure 3.47: Illustration of the components used in applying the rubber
The thoroughly mixed liquid rubber was then poured into the tube and was allowed to “seek
its level” and be fully absorbed by the sponge for about 1 minute.
The rod was then pulled out and pushed back in repeatedly. In the process, the sponge
applying the liquid rubber onto the inner surface of the tube with each stroke. This step was
repeated until the sponge could no longer ooze out and apply any of the liquid rubber onto
the internal surface of the tube. At this point, the rod with the sponge was then removed from
the tube.
For about 30 minutes, the tube is left in the same vertical position before it is flipped vertically
to have the open end in contact with the surface. This process was then repeated at least 4
times to ensure that there was an even thickness of the rubber at almost every point along
the inner surface of the tube.
The lined CFRP tube would then be left to cure for a period of 16-24 hours [115] before the
procedure is repeated until the desired rubber layer thickness of approximately 1 mm was
reached.
The tape protecting the end cap bond region would then be removed.
3.3.2 Thickness of the rubber liner The procedure of applying the rubber liner in the previous section only allowed for one layer of rubber
that had a certain thickness. For the surface of the rubber lining to be smooth (when judging by eye),
it was necessary to not exceed a particular amount of mixed liquid rubber before its application.
Exceeding that amount would have resulted in an uneven rubber lining as the excess rubber would
start flowing due to gravity which resulted in sizeable lumps forming on the inner wall of the CFRP
tube. The lumps of rubber would not flow all the way down the inner wall of the tube because of the
high viscosity of the liquid rubber. To determine the maximum thickness of the layer of rubber lining
per time, different amounts of liquid rubber were prepared as well as different tube specimens to
apply the rubber lining on. In total, seven rubber liner layers were applied to the different seven
O-ring and washer
Nut, washer
and O-ring
Sponge

70
specimens and the maximum thickness that would result in a smooth layer was determined to be
about 0.2 mm. As was mentioned in the procedure for application of rubber previously, another layer
of rubber lining could be applied on top of another layer to have a thicker layer. It was implemented
by Stuart Swan for the water rocket [1] where he used three layers of rubber liner of approximately
0.07 mm thickness to get to a total thickness of 0.21 mm. It was decided to have a rubber lining with
a total thickness of at least 3.5 times that of the water rocket which resulted in an intended thickness
between 0.8-1.0 mm (i.e. 4-5 layers of approximately 0.2 mm thickness each).
3.4 Assembling the pressure vessel This section will elaborate the steps that were followed in assembling the CFRP pressure vessel from
its components. The CFRP pressure vessel was composed of three components namely the CFRP tube,
end caps and the rubber lining as shown in Figure 3.48 below.
Figure 3.48: Cross section of a fully assembled CFRP pressure vessel
Initially, the CFRP tube was to be cut such that the total length would result in a length to diameter
ratio of 4 which is common among vessels used in practice [116]. Therefore, the effective length would
be 200 mm since the internal diameter of the tube was 50 mm. The total length of the pressure vessel
includes the end caps as well (each at least 50 mm in length) which resulted in an overall length of at
least 300 mm. In terms of surface preparation before bonding, both ends of the CFRP tube were to be
sanded thoroughly using emery cloth of a grit of 80 with the focus being on the bond area on the inner
surface of the tube. Both bond areas on one of the ends of the CFRP tube and on the end caps would
be cleaned with a cloth with acetone to remove any dirt or oils that may prevent the epoxy adhesive
from bonding well with either surfaces. The O-ring(s) were then placed in the respective groove(s) on
the end cap before it was bonded onto the end of the tube. The adhesive layer between the end cap
and the CFRP tube was then left to cure overnight before the rubber lining would then be applied
using the application method described previously in section 3.3.1. The other end cap was then
bonded onto the other end of the CFRP tube and also left to cure overnight. Subsequently, the CFRP
pressure vessel would be placed in an oven and post cured using the schedule prescribed by the
technical data sheet for SpaBond 340 LV [108]. This post-curing of the SpaBond 340 LV also benefitted
the rubber lining as it provided further post-curing of the rubber [115].
Rubber Liner
(black) End Cap CFRP tube

71
3.5 Summary of the design and manufacture of the CFRP pressure vessel The CFRP tube’s design entailed initially choosing the inherently balanced angle ply laminate structure
as the stacking arrangement which also had to be symmetric about the mid-plane. Next, the CLT was
used to model the strain behaviour of the CFRP tube subject to the internal pressure. The Maximum
Stress, Maximum Strain, Tsai-Hill and Tsai-Wu failure theories were then used to predict the burst
pressure of the CFRP tube. In addition, the Maximum Stress failure theory determined that the
optimum filament winding angle is 50o. The manufacturing of the designed CFRP tube was performed
using an automated filament wet winding process. The carbon fibre chosen was the HTS45 from Toho
Tenax and the epoxy resin chosen was AR600 with the AH2336 hardener from Aerontec.
The initial design of the end caps was based on the water rocket design and SpaBond 340 LV was
chosen as the epoxy adhesive to bond the end caps to the CFRP tube. The stresses acting on the end
caps were the direct stress due to the internal pressure and the shear stress from the bond. Stress
analyses were performed to determine the deflection and the maximum stress on the end cap using
a simple analytical approach as well as FEA. The material chosen was Aluminium 6082-T6 and the
manufacture of the end cap was to be performed on a lathe. However, the adhesive application
method associated with the first end cap design resulted in the formation of voids in the adhesive
layer thereby weakening the bond’s shear strength. Firstly, the second end cap design had angled
holes introduced allowing for direct injection of the adhesive into the bond area. This prevents void
formation thereby increasing the shear strength of the bond. Secondly, two O-ring grooves were also
introduced to prevent leakage of water during the hydrostatic burst testing. Knurling was performed
on the designated bond area on the end cap for the third end cap design to give a consistent surface
roughness.
The liner chosen to be applied on the inner walls of the CFRP tube was VytaFlex 60 series urethane
liquid rubber. A sponge was used to absorb the liquid rubber before it would be used to apply the liner
onto the tube’s inner walls. This was left to cure for 16 hours before another layer of liner could be
applied.

72
4. Testing methodology To be able to fully design the CFRP pressure vessel, there was a need to know the design variables
related to the strength of the CFRP composite and of the end cap’s adhesive bond. Determining these
values was necessary as it allowed for the correct sizing of the vessel’s components as well as for the
further optimization of the vessel to ensure that minimum material was used. This would lead to a
lowering of the vessel’s weight and costs involved in manufacturing the vessel. Once the vessels were
manufactured, they had to undergo certain pressure tests to assess functionality. This included burst
tests, hydraulic proof tests and leak tests which assessed failure pressure, tested reliability and
checked for pressure retention without leaking.
4.1 Determination of mechanical properties of the CFRP laminate
structure As the values of the mechanical properties of the final filament wound CFRP composite were
unknown, experiments had to be performed to determine these properties. These mechanical
properties included elastic moduli, ultimate strengths and strains in the transverse and longitudinal
orientations of the CFRP composite.
4.1.1 Description The carbon fibre that was used for the filament wound pressure vessel was supplied by AMT
Composites [117]. The manufacturer of the carbon fibre is Toho Tenax based in Europe. The product
data sheet illustrated only the typical repeated values for the tensile properties (tensile strength and
modulus) of the fibre [118]. The epoxy resin that was used with the carbon fibre was called AR 600 in
conjunction with the AH 2336 hardener which were procured from Aerontec in Cape Town [119]. The
product data sheets can be found in Appendix A.
Since the carbon fibres were to be mixed with epoxy resin (the matrix) to form the composite in
particular volume fractions, the resulting properties of the composite would lie in between the
properties of the fibre and the resin [3-4, 78]. Of particular interest was the expected longitudinal and
transverse mechanical properties of the composite which would be used in the stress calculations
section to determine the amount of material required, find safety factors, burst pressures etc. The
American Society for Testing and Manufacturing (ASTM) D3039/D3039M standard was identified as
suitable for finding the properties of the CFRP composite material. The ASTM D3039/D3039M
describes a tensile test that determines the tensile strength of the laminated composite along the
fibre direction (at 0o) as well as those transverse to the direction of the fibres (at 90o) [96]. Figure 4.49
illustrates the specimens for each of the two loading directions. It can also be used to determine the
tensile moduli in the two orientations and the Major Poisson’s ratio (ν1). The tensile tests required
thin, flat rectangular specimens with unidirectional fibres and a constant thickness. They would need
to be mounted onto the grips of a tensile testing machine before being pulled in tension until failure.
The force and the corresponding strain of the specimens would be recorded until the specimen fails.
The data recorded by the force and strain transducers could then be used to derive the stress-strain
curve from which the ultimate tensile stresses (and strains), tensile moduli and Poisson’s ratio could
be determined which could then be implemented in the design of the CFRP pressure vessel.

73
Figure 4.49: Schematic showing the fibre directions in the 0o and 90o CFRP specimens
4.1.2 Geometry of the specimens The recommended geometry for the ASTM D3039/D3039M tensile test specimens as well as the actual
geometry that was used are listed in Table 4.11 below [120]:
Table 4.11: Recommended vs actual tensile test specimen dimensions according to ASTM D3039/D3039M
Fibre orientation 0 O unidirectional 90 O unidirectional
Geometry Recommended Actual Recommended Actual
Width (mm) 15 15 25 25
Overall length (mm) 250 180 175 180
Thickness (mm) 1 1.25 2 1.25
Tab length (mm) 56 50 25 50
Tab thickness (mm) 1.5 1.2 1.5 1.2
Tab bevel angle (O) 7 or 90 90 90 90
The test standard [120] gave room for adjustments to the geometry specifications given in the table
above. Some adjustments were made as shown by the actual dimensions in the table above. The
adjustments were necessary because test specimens were to be cut from a single flat panel with a
constant thickness (1.25 mm). The 0 O unidirectional specimens were cut along the fibre direction and
the 90 O unidirectional samples would be cut transverse to the direction of the fibres. If both set of
specimens for the two orientations were cut from the same flat panel, it would help ensure
consistency in the results. The other advantage was that only one panel with a constant thickness
needed to be made. The tabs were cut off from an aluminium flat sheet that was approximately 1.2
mm thick. The tab dimensions were according to those given in Table 4.11. The tabs were glued onto
the specimens with an epoxy adhesive (Spabond 340 LV) before being left to set. After the epoxy
adhesive had set, the specimens were post cured in an oven according to the prescribed curing
schedule for the adhesive [108]. The longitudinal and transverse test specimens that were cut and
had tabs stuck on them as illustrated in Figure 4.50:
0o specimen
Specimen
90o specimen
Specimen
Fibres oriented
parallel to the
direction of loading
Fibres oriented
transverse to the
direction of loading

74
Figure 4.50: Front, top and side views of a typical unidirectional test specimen with tabs stuck on
4.1.3 Manufacturing the specimens The flat panel was made using the same epoxy resin and carbon fibre proposed for constructing the
CFRP pressure. One difference however was that whilst the filament winding process that was going
to be performed by GRP Tubing was automated, the flat panel that was made in the lab by manually
wrapping the carbon fibre tows over the prepared pattern mould. Thus, a simplified manual filament
winding process was performed on a rectangular prism shaped block of wood that had two thin flat
panels of aluminium glued onto it as shown in Figure 4.51 below:
Figure 4.51: Representation of the block of wood with two flat sided panels of aluminium glued onto it
After wrapping the flat sided block to the thickness of approximately 2 mm with carbon fibre tow post
impregnated with epoxy resin, the entire setup was put into a vacuum bag before the resin was
allowed to cure overnight. Next, it was placed into an oven and then cured according to the curing
procedure stipulated by the epoxy resin’s data sheet in Appendix D (i.e. 2 hours at 80°C + 3 hours at
150°C + 4 hours at 180°C) [102]. After successfully curing, two flat panels were cut off the two flat
sides of the pattern block. However, the final thickness of the flat panels was approximately 1.25 mm
Aluminium tabs
Unidirectional specimen
Front View
Top View
Side View

75
possibly due to the compaction due to the “vacuum bagging” process. A drawing template of how
specimens were to be cut based on the dimensions specified in Table 4.11 was developed in
SolidWorks 2017 Computer Aided Design (CAD) software before being fed into the Computer Aided
Manufacturing (CAM) program for a CNC router cutter which cut the 0° and 90° unidirectional
specimens.
4.1.4 Mechanical testing procedure The Zwick 1484 testing machine was used for testing both the 0 O and 90 O unidirectional test
specimens. The main parameters that were adjusted were the cross-head speed (2 mm/min) and the
extensometer was utilised (over a gauge length of 60 mm) to measure the strain in real time to ensure
that the strain data could be later analysed. A summary of the procedure is provided below:
1. The variables were set to the appropriate values (i.e. cross-head speed of 2mm/min and
the extensometer set at a length of 60mm).
2. A specimen was inserted onto the grips and aligned properly also making sure that the
specimen was gripped sufficiently.
3. A preload was set at 20 N and was applied to the specimen before the extensometer
gripped the sample.
4. The test commenced, and the specimen was pulled until failure of the specimen.
The steps 2-4 were repeated for both the 0 O and 90 O unidirectional specimens for at least 5 specimens
of each fibre angle. The results are presented in section 5.1 in the next chapter.
4.2 End cap adhesive shear tests As part of the design process for the end caps, the epoxy adhesive bond strength had to be tested to
size the bond area appropriately. The adhesive that was used for the shear tests was SpaBond 340 LV.
An adhesive shear test was devised to determine the shear strength of the bond between the CFRP
tube and the end cap. This section will cover the design and the results of the shear test.
4.2.1 Description Dummy end caps were made for this test which instead of having a hemispherical dome machined,
had a flat end and were shorter (see Figure 4.52). The dummy end caps were cheaper to manufacture
as they required less material and time to manufacture than the vessel’s end caps. The bond line
thickness of 1.5 mm (i.e. perpendicular distance between the edge of the bond area on the end cap
to the internal surface of the CFRP tube) was the same as that of the vessel’s end caps. The direction
in which the loads acted differed between the pressure tests and the end cap adhesive shear test.
However, this should not have caused a difference between the shear strength values from those tests
as the shear strength value does not depend on the direction of the applied load. The dummy end
caps did not have O-rings like the end caps used in the pressure vessels. The dummy end caps were
machined to a diameter such that they had a transition fit with the internal diameter of the CFRP tube.
This meant that a slight push was required to put them in place before bonding occurred. This was
done to mimic the friction effect of the O-rings on the end caps used for pressure vessels. These
considerations were made so that the results of the end cap adhesive shear test would be similar and
could be applied to actual end cap design.

76
Figure 4.52: Shear test setup
As shown in Figure 4.52, on one end of a short length of the CFRP tube, a dummy end cap was partially
bonded to the tube. The partial bond meant that only a portion of the bond area would be utilised
whilst the rest would protrude out of the CFRP tube as shown above. The protruding flat end would
then have had a downwards force applied by the Zwick 1484 universal machine as can be seen in
Figure 4.53.
Figure 4.53: Illustration of the interaction in the forces acting on the end cap and CFRP tube through the bond

77
The downward force (F) on the dummy end cap would be primarily resisted by the bond. The
maximum shear force (and stress) would thus correspond to the maximum applied downward force
that resulted in shear failure.
4.2.2 Specimen preparation Each specimen was made up of a dummy end cap partially bonded to a short CFRP tube. There were
two hardeners that were used to mix with the SpaBond 340 LV resin namely the slow and fast
hardeners. The slow hardener was used to make the specimens for the first shear test while the fast
hardener was used for the remaining two sets shear tests. One notable difference between the two
hardeners was that the quoted maximum shear strength of the SpaBond 340 LV [108] with the slow
hardener was slightly higher than when the fast hardener was used (34.5 MPa as compared to 33.3
MPa). Before applying the adhesive, the surfaces to be bonded on the dummy end caps and the CFRP
tube’s internal surface had to be prepared accordingly. The two surfaces had to be abraded by a
medium grit sand paper (or emery cloth) and any dust/dirt had to be wiped clean with acetone. This
ensured that the bond on both surfaces had sufficient grip whilst also ensuring the strength would not
be compromised as a result of contaminants like dust and oils. Below is a description of the design
decisions, processes and methods employed for each of the three shear tests.
4.2.2.1 First shear test specimens
The specimens for the initial shear test were similar to what is shown in Figure 4.52. The SpaBond 340
LV was used to bond mild steel dummy end caps using the first bond application method (as described
in section 3.2.4 for more details). Mild steel was used instead of aluminium for the dummy end caps
because it was readily available and inexpensive. The slow hardener was used in the bonding of the
dummy end caps for the specimens for the first test because it had a reasonably long pot life (45 mins
at 20oC) which allowed the adhesive to be applied and thoroughly spread on the bond area. However,
the clamp time associated with the slow hardener (17 hours 40 minutes was longer than when a fast
hardener (3 hours 50 mins). After allowing the adhesive to set, the specimens were put into an oven
where they were to be cured according to the schedule below [108]:
From the room temperature (20 OC) to 70OC in an hour and 20 mins.
The oven temperature was then maintained at 70OC for 5 hours.
From 70OC to room temperature in an hour and 20 mins.
Hence, the total post-curing time amounted to 7 hours 40 mins. After curing, the specimens were
ready for the shear test.
4.2.2.2 Second and third shear test specimens
The second and third set of shear test specimens were also made to mimic the behaviour of the second
and third design of end caps respectively. Both sets had angled holes that allowed for the direct
injection of the adhesive into the bond area. The fast hardener was used because the resulting
SpaBond 340 LV adhesive was less viscous than when slow hardener was used. This allowed the
adhesive to fill the bond area easier. The post-curing schedule was the same as that of the slow
hardener. The third set of dummy end caps were distinct from the second set in that the surface of
the bond area for the third set was knurled. Knurling was applied on the bond area of the dummy end
caps to ensure a consistently rough surface that would increase the mechanical bond.
4.2.2.3 Summary on the shear test specimens
Below is Table 4.12 that compares the similarities and differences in the specimens that were
utilised for the shear tests.

78
Table 4.12: Similarities and differences in the 3 sets of shear test specimens
Specimen features First specimen Second specimen Third specimen
Bond area on the dummy end cap
Abraded with 80 grit sand paper
No angled holes
Abraded with 80 grit sand paper
Angled holes
Knurled surface
Angled holes
Hardener used Slow Fast Fast Post curing duration 7 hours 40 mins 7 hours 40 mins 7 hours 40 mins
Shear strength of the Spabond 340 adhesive
34.5 MPa 33.3 MPa 33.3 MPa
4.2.3 Adhesive shear test procedure The Zwick 1484 testing machine with the flathead attached, provided the load that would be resisted
by the bond of the adhesive layer until failure. The process was as follows:
1. The protruding length of the dummy end cap on each specimen was measured using a pair of
Vernier Callipers at 5 different locations around the circumference and the values were
recorded.
2. The specimen was then placed directly underneath the Zwick 1484 machine flathead.
3. The flathead would then be vertically adjusted such that it would almost be in contact with
the top flat surface of the dummy end cap on the specimen.
4. The Zwick was zeroed before the test was started and the test was only completed when the
bond of the adhesive layer failed.
5. The (force vs standard travel of the machine head) data from the machine was saved for that
specific specimen before the test was repeated for the rest of the specimens.
6. The recorded data was then processed, analysed and plotted into graphs of shear stress
against standard travel as illustrated in the next chapter.
4.3 Pressure tests The first pressure test that was performed on the CFRP pressure vessel specimens was a hydrostatic
burst test. Another secondary objective of the burst tests was to collect strain data from the CFRP
section of the pressure vessel as it deformed under the influence of an induced pressure. The strain
data would then be analysed and compared to validate the theoretical strain data derived from the
design calculations. The second pressure test that was to be employed was the proof pressure test
which is a part of the non-destructive test (NDT) procedures. The proof test involves testing the
pressure vessel for leaks at a slightly higher pressure than the design pressure to ascertain that there
are no leaks or premature failure of the pressure vessel [10]. The final test was the long-term leak test
which involved using a dry gas such as air to detect the presence any localised leaks anywhere on the
vessel. Passing the leak test would have meant the CFRP tube rubber liner, and the end caps are
sufficient to prevent gas (i.e. a compressible fluid) from escaping the vessel.
4.3.1 Burst pressure test For the burst tests, water was pumped into the pressure vessel until it failed. This could be through
either cracking of the CFRP or shear failure of the end caps. Leaking and the resulting drop in pressure
from the gauge were the visual indications of failure of the pressure vessel. The purpose of the burst
test was two-fold, the first reason was to determine the failure pressure then secondly, to be able to
predict the deformation behaviour (i.e. induced strain) of the CFRP portion of the pressure vessels.

79
4.3.1.1 Requirements
The requirements for class III FRP pressure vessels are described in section 8-700.5.3 of the ASME
Boiler and Pressure Vessel Code Section X [10]. They are listed below as follows:
Three vessels shall be tested hydraulically, to destruction, by pressurizing at a rate of no more
than 5 bar/second.
The test shall be carried out under ambient conditions.
Prior to the commencement of the test, no air should be trapped in the system.
4.3.1.2 Analysis of experimental results
The important parameters that needed to be recorded were the failure (or burst) pressure and the
pressure time curve according to [10]. The failure pressure ought to be at least 2.25 times the value
of the intended design pressure.
4.3.1.3 Design of the burst test setup
The following equipment/apparatus were required to design the equipment setup for the burst test:
The CFRP pressure vessel.
Steel piping.
Calibrated pressure gauge.
End fitting that interfaces with the piping network and the vessel.
Ball valves.
Various connectors.
Because the proposed design pressure of the pressure vessel was 350 bar, it meant that the
equipment mentioned above had to be able to sustain a pressure of at least 787.5 bar (2.25 times the
design pressure). Since the burst test was a hydrostatic test, the equipment had to be setup in such a
way as to have vents at high point [10]. Vents were meant to provide a passage through which air
could escape while the pressure vessel was being filled with water. With those considerations in mind,
the equipment setup shown in Figure 4.54 was designed for the burst test.
Figure 4.54: Schematic of the horizontal setup for the pipe network equipment that was to be used for burst tests.
The ball valve labelled number 1 would be connected to the hydrostatic pump and when open, would
provide a pathway for water to be pumped into the pressure vessel. Filling the pressure vessel would
be done when the test apparatus is in a vertical configuration as shown in Figure 4.55.
1
2

80
Figure 4.55: Vertical setup for the actual burst test equipment
After filling up the pressure vessel, more water would need to be pumped to ensure all the pipes are
filled with water. With all the pipes filled completely with water, the excess water would have to flow
out of ball valve 2. When the water flowing out of ball valve 2 was clear of any air bubbles, it signified
that there are no more air bubbles within the system and that valve was to be closed before the test
could commence.
4.3.1.4 Strain gauge selection
A strain gauge is simply a device used to measure the strain on objects subject to an applied load
[121]. An example of a strain gauge is illustrated in Figure 4.56. The strain gauge measures the strain
as a change in its length (when stretched) which manifests as a change in electrical resistance [122].
Ball valve 1
Connects to the
hydrostatic pump
Ball valve 2
Outlet to the
atmosphere
CFRP pressure
vessel
Calibrated
pressure gauge
Strain gauge
rosette

81
Figure 4.56: A typical strain gauge [123]
Hence, the more the gauge is stretched, the more its electrical resistance increases. When connected
to an electrical circuit, the change in electrical resistance will reflect as a change in the voltage across
it which can then be transformed into a corresponding strain value.
Strain gauges can only measure strain in one direction hence why a single strain gauge is referred to
as a uniaxial strain gauge. In this scenario however, there is a need to measure strain in more than
one direction (the bi-axial stress state resulting from hoop and longitudinal stress on the cylindrical
vessel), a two-element strain gauge rosette was required to measure the hoop and longitudinal strain
for the CFRP pressure vessel. The two-element strain gauge rosette involved two adjacent
conventional strain gauges orientated at 0O (longitudinal) and 90O (hoop) respectively as shown in
Figure 4.57 below. The strain gauge rosette was to be attached onto the outer surface of the pressure
vessel.
Figure 4.57: A 0o and 90o strain gauge rosette [124]
Selection Parameters
To install a strain gauge onto an object for strain measurement, careful consideration needs to be
taken in order to select the appropriate gauge for that application. This is to ensure that correct and
reliable strain measurements may be obtained, the gauge installation cost may be reduced and to
facilitate ease of installation [125]. There were several parameters that were considered for selecting
a strain gauge, some of which are the gauge length, gauge pattern and self-temperature compensation
number. Generally, the process of selecting strain gauges involves compromises as one parameter
choice may satisfy one of the requirements and yet work against other requirements [125].

82
The gauge length of a strain gauge is the active or strain sensitive length of the grid as can be seen in
Figure 4.58 [14, 15]. The other features like the solder tabs are considered insensitive to strain because
of their relatively large cross-sectional area and low electrical resistance [125].
Figure 4.58: Illustration of the components of a typical strain gauge [124]
For this application, the gauges were going to be attached onto the curved outer surface of the CFRP
pressure vessel. Because the surface was not flat but curved, the longer the gauge length was going
to be the more likely the strain reading was going to be distorted particularly in the hoop direction.
This meant that the gauge length of the strain gauge(s) had to be as short as possible. However, strain
gauges with a short gauge length (< 3mm) in general, tend to offer less accuracy than longer ones in
terms of the maximum allowable elongation, the stability under static strain, and endurance when
subjected to alternating cyclic strain [125-126]. It was felt that the need to measure the undistorted
strain outweighed the potential errors from the shorter gauge length. Hence, a short active gauge
length of 2 mm was chosen for this application.
The gauge pattern refers to the shape of the grid, the number (uniaxial/multi-axial) and orientation of
the grids in a multiple-grid gauge [125]. For a uniaxial stress state scenario, a single grid gauge would
have sufficed. However, with an internal pressure applied onto the CFRP pressure vessel in this
application, there will be at least a bi-axial stress state due to the hoop and longitudinal stress. Hence,
at the very least a two-gauge rosette would have been required to measure the strain induced by
those principal stresses. Hence, a 0o and 90o strain gauge rosette was chosen to measure the induced
longitudinal and hoop strain respectively.
Materials generally expand with increase in temperature. The resulting strain that is generated is
called apparent strain. Apparent strain depends on the material property called the expansion
coefficient measured in ppm/K where ppm is parts per million and K is Kelvin. For each material, there
is a unique expansion coefficient [107] for instance steel has an expansion coefficient of about
11ppm/K and aluminium has about 23 ppm/K [127]. The temperature response of strain gauges is
matched to that of a specific material such that they compensate for the apparent strain caused by
temperature changes within that material. Hence, a strain gauge should be chosen which matches the
temperature response of the matching material in order to eliminate the effects of apparent strain.
During hydrostatic testing in a room with a constant temperature, there would be no significant
change in temperature of the water being pressurized, the CFRP vessel or the immediate surroundings
unless external heat is supplied to the testing apparatus. Carbon fibre has a relatively low temperature
compensation number of -0.1 ppm/K [118] as compared to metals like steel and aluminium (11 ppm/k
and 23 ppm/K respectively [127]). However, strain gauges matched for carbon fibre were far more
expensive than ones for metals like steel or aluminium. For these particular hydrostatic burst tests,
there was no discernible cause for any significant temperature change which could have caused any

83
significant error. Hence, steel matched strain gauges were chosen to measure the strain on the CFRP
pressure vessel for the following reasons:
Steel matched strain gauges are significantly less expensive than CFRP matched gauges.
Steel matched strain gauges could be sourced locally.
Steel had the lowest coefficient of expansion (or temperature compensation number) among
the locally available strain gauges.
The specifications of the particular steel strain gauge rosette sourced from Peter Jones Electrical are
shown in the Table 4.13:
Table 4.13: Steel strain gauge rosette specifications
Property Description
Manufacturer KYOWA
Type KFG-2-120-D17-11
Gauge factor (24oC, 50% RH) 2.08 ± 1.0%
Gauge length 2 mm
Gauge resistance (24oC, 50% RH) 120.4 ± 0.4Ω
Adoptable thermal expansion 11.7 ppm/ oC
4.3.1.5 Measurement of strain
When an object onto which a strain gauge is attached expands/contracts due to stress, the strain
gauge will also be deformed in kind by the same amount [123]. The deformation of the strain gauge
is manifested as a change in its electrical resistance. The change in electrical resistance is usually very
small to detect and to detect this small change a Wheatstone bridge is used [122]. The Wheatstone
bridge is shown schematically in Figure 4.59 and it is used to connect the strain gauges in such a way
so as to detect the small changes in resistance through measurement of potential differences across
the strain gauges.
Figure 4.59: Strain gauges are configured in Wheatstone bridge circuits to detect small changes in resistance.[122]
The measured output comes in the form of a voltage difference, VO, which is caused by a change in
resistance. The voltage difference can be amplified and then converted into a strain reading. There
are 3 common strain gauge configurations within the Wheatstone bridge namely the quarter, half or
full bridge configuration.
Strain gauge configurations
The quarter bridge has one active strain gauge connected in the Wheatstone bridge, the half bridge
has two active strain gauges connected and the full bridge has 4 active strain gauges connected. The

84
sensitivity to the small change in strain differs with each configuration with the least sensitive being
the quarter bridge and the most sensitive being the full bridge configuration [122]. The quarter bridge
configuration was chosen of the 3 different configurations because it was the least complex and
cheapest configuration since it only needed one active strain gauge. The half and full bridge
configurations would require two and four active strain gauges respectively.
Strain measuring device
The equipment that was chosen to measure the induced strain on the CFRP pressure vessel was the
P-3500 strain indicator (see Figure 4.60). It was convenient to use in this application as it is robust,
easy to use and portable.
Figure 4.60: Top view of a P-3500 strain indicator
Additionally, the P-3500 had other useful features including the following [128]:
Choice of 4-1/2 Digital Liquid Crystal Display (LCD) or Light Emitting Diode (LED) readout.
Direct reading of strain.
Battery or line-voltage operation.
Gauge factor setting (to 4 significant digits) displayed on readout.
Quarter-, Half- and Full-Bridge circuits.
Compatible with 120 and 350 Ohm strain gauges.
Portable, lightweight, rugged for field use.
Evaluation of hoop and longitudinal strain values
After installing the strain gauge rosette on the outer surface of the pressure vessel, it was to be
connected to the P-3500 strain indicator which facilitated the measurement of direct strain values.
Since a two strain gauge rosette was chosen, there were to be two separate direct strain reading for
each orientation (i.e. 0o and 90o) to be read via the digital display on the P-3500. If one strain gauge
(i.e. SG 2) is in line with the axis of the cylindrical pressure vessel, it would measure the direct value of
the longitudinal strain as shown in Figure 4.61. If a second strain gauge (i.e. SG 1) is then placed at
right angles to the first, it would measure the direct value of the hoop strain.

85
Figure 4.61: Schematic of the strain gauge rosette with the gauges oriented at 0O (longitudinal) and 90O (hoop).
4.3.1.6 Burst test procedure
After purging the air bubbles from the pressure vessel and the burst testing apparatus, the hydrostatic
test would be ready to commence. Each of the two strain gauges in the 0o and 90o strain gauge rosette
would be connected in a quarter bridge configuration on the P3500 strain indicator. The gauge factor
would be adjusted to the quoted value for that strain gauge before both the AMP ZERO and balance
settings are zeroed. The zeroing ensured that all readings would be made relative to a reference
reading (i.e. zero) thereby eliminating systematic errors.
The hydrostatic pump would then raise the pressure of the water in the system (including the pressure
vessel) to a value between 20-30 bar and the first set of two strain readings would be recorded.
Increments of between 20-30 bar were then implemented in accordance with the test requirements
for each time step and the resulting strain readings would also be recorded. However, there was an
exception to this as the equipment that was used had no steady pressure increase rate of 5 bar/second
but the 20-30 bar increase occurred over a period of about 5 seconds (i.e. a rate of pressure increase
of between 4-6 bar/second). Between increments/readings, the value for the pressure was allowed
to settle for a period of at least a minute before the set of readings were recorded. This process was
repeated incrementally until the pressure vessel failed. The recorded failure pressures and observed
modes of failure are detailed in section 5.3.
4.3.2 Hydraulic proof pressure test The hydraulic proof pressure test is a type of Non-Destructive Test (NDT) that was to be used to prove
the durability of a given test sample in a controlled setting [71].The other purpose of this test was
mainly to verify that the vessel(s) would withstand pressure above its intended use without
experiencing any leaks or succumbing to failure.
4.3.2.1 Requirements
The requirements for this test according to the ASME Boiler and Pressure Vessel Code Section X were
as follows [10]:
The hydraulic pressure in the vessel has to be increased gradually and regularly to 1.25 times
the design pressure.
The vessel shall be held at the proof pressure (i.e. 1.25 times the design pressure) for 30
minutes followed by a reduction to the design pressure and held for 10 minutes to ascertain
that there are no leaks and no failure.
In the occurrence of leakage in the piping and fittings, the vessels may be re-tested after repair
of such leakages.
SG 2
Hoop direction
Longitudinal/axial direction

86
There were two types of CFRP pressure vessels that were burst tested (see next chapter for more
details) prior to the commencement of the proof test. They were distinguished by the wall thickness
of the CFRP tube. One was 2 mm thick and the other was 4 mm. The design pressures at which these
two types of CFRP pressure vessels were determined by the burst pressure test. The failure pressure
had to be divided by 2.25 to determine the design pressure in accordance with the burst test
requirements. The proof pressure values of the two vessels had to be 1.25 times the respective design
pressure values. The design and proof pressure values for the two types of vessels are summarised in
Table 4.14.
Table 4.14: The design and proof pressures for the two different vessels
Type of vessel Design pressure [bar]
Proof pressure [bar]
2 mm wall thickness 147 184
4 mm wall thickness 182 228
After the test concluded, vessels would be rejected in the case of failure to retain pressure, leakage
or visible permanent deformation after depressurization [10].
4.3.2.2 Procedure
The same equipment and setup for the burst tests were used for the proof tests. The two types of
vessels listed in the table above were tested to ascertain if they would fail according to the
requirements. The pressure was increased by 20-30 bar per step and in between the increments, there
was a brief period of 15-20 seconds that passed before the pressure was increased again. This allowed
the pressure vessel to adjust and the strain readings to settle before they were recorded. After the
test pressures were reached for each type of vessel, the valve was closed and disconnected from the
hydrostatic pump. The vessel would be held at the test pressures for at least 30 minutes before the
pressure was reduced to the design pressure for a minimum of 10 mins. The results of the tests can
be found in the next chapter.
4.3.3 Leak pressure test The primary purpose of a leak detection test is detecting and localizing leaks from the pressure vessel
and the general method employed is pneumatic because it is relatively inexpensive [72].
4.3.3.1 Requirements
The requirements for leak testing were listed below as according to the ASME Pressure Vessel Code
Section X [10]:
Leak testing should be conducted on a completed vessel.
Acceptable methods for leakage testing include, but are not limited to, bubble testing with
dry air.
The leak testing should be performed at the design pressure.
4.3.3.2 Procedure
The equipment setup that was designed for the leak test is shown in the schematic in Figure 4.62. The
air that would fill the CFRP pressure vessel was to be channelled from a steel cylinder which held 11.5
kg of compressed air at 200 bar. Because the CFRP vessels had a smaller volume, they would require
only a relatively smaller mass of air, less than 150 g, to reach the required design pressures of 147 bar
and 182 bar (see ideal gas calculations in the Appendix C). During connecting the equipment for the
leak test caution was taken to ensure the leaks from the equipment were negligible. This was achieved

87
by testing the setup. This involved replacing the pressure vessel with a valve which would be kept
closed whilst valves 1 and 2 were kept open. The relief valve was also kept closed to ensure no air
would escape.
Figure 4.62: Equipment setup for the long-term gas leak pressure test
It should be noted that because of the safety implications involved in leak testing with air (i.e. a
compressible fluid), the test was conducted in a blast chamber. The steel cylinder was kept outside
the blast chamber as the tap had to be operated manually. Only the calibrated pressure gauge and
the CFRP pressure vessel were in the blast chamber as illustrated in Figure 4.62. The blast chamber
had a window through which the reading on the pressure gauge could be monitored to ensure the
desired pressure was reached.
The tap on the steel cylinder would be opened and the air would flow into and fill the piping until the
reading on the pressure gauge would settle at just under 200 bar. Then the valves 1 and 2 would be
closed before opening the relief valve to facilitate the trapped air in between the valves to dissipate.
This allowed for the steel supply cylinder to be disconnected from the equipment. The pressure
reading on the gauge would be monitored over time and any drop in the reading would signify the
presence of a leak from the equipment. A soapy water solution would be applied on every joint of the
pipe network equipment setup prior to the start of the leak test. This was necessary for detecting and
localizing any leaks through checking for “bubbling”. The leaking joints would be carefully retightened
ensuring that they were sufficiently tight and leak-proof. After ensuring that there were no leaks in
the equipment, the CFRP pressure vessels were connected as shown in figure 8.14. The tap was then
opened as mentioned before and the vessel filled up with air until the reading on the pressure gauge
reflected the design pressure i.e. 147 bar and 182 bar for the 2 mm and 4 mm vessels respectively.
Valves 1 and 2 were closed and the relief valve was opened to purge the air in the pipes and the steel
cylinder disconnected leaving only the vessel pressurized with the pressure gauge to monitor the
reading. The pressure reading was then monitored and recorded over a period of up to 72 hours to
assess if there were any leaks from the vessel. The results of the long-term leak tests that were
performed are detailed in section 5.5.
Calibrated pressure gauge
CFRP pressure vessel
Ball valves
Compressed
air storage
cylinder 200
bar Relief valve
2 1
BLAST CHAMBER

88
4.4 Summary of the testing methodology The ASTM D3039/D3039M tensile tests involved making specimens with the aim of determining the
in-plane tensile properties (i.e. elastic moduli and strengths) of the CFRP material used in the
manufacture of the tube section of the pressure vessel. These in-plane tensile strengths and
stiffnesses were necessary for accurately estimating the pressure at which the CFRP tube laminate
structure would fail.
The end cap adhesive shear tests were designed to determine the shear strength of the bond on the
SpaBond 340 LV adhesive layer and the two interfaces. The specimens of this test were manufactured
by bonding “dummy” end caps onto short CFRP tubes. The dummy end caps had flat protruding ends
which a Zwick 1484 machine’s crosshead would apply a constant strain rate until the bond of the
adhesive layer fails.
After constructing prototype CFRP pressure vessels, they had to undergo different pressure tests. The
first test was the hydrostatic burst pressure test which was aimed at determining the pressures at
which the vessels would fail. The second objective of the burst test was to learn how the CFRP would
deform under pressure by measuring the induced hoop and longitudinal strains of the CFRP tubes. To
do this, strain gauges were attached to the tube sections of the vessels prior to the burst test.
Furthermore, the hydraulic proof tests were performed on new CFRP pressure vessels to verify if they
would withstand pressures above their intended (i.e. maximum working pressures) use without
experiencing any leaks or failure. Lastly, a long-term leak test was devised to test durability and to
detect any leaks from the pressure vessel. A pneumatic leak test was chosen because it is relatively
inexpensive.

89
5. Results and discussion This section describes and discusses the results from the various tests that were performed on the
CFRP pressure vessels and their components.
5.1 Tensile tests of the CFRP specimens The objective of the ASTM D3039/D3039M tensile test was to determine the following properties:
The UTS in the 0 O and 90 O directions (σ1-UTS and σ2-UTS respectively)
The elastic modulus in the 0 O and 90 O directions (E1 and E2 respectively)
The failure strain in the 0 O and 90 O directions (ε1 and ε2 respectively)
5.1.1 Results Determination of the theoretical CFRP property values
These tests had to determine these property values so that they could be used in the design
calculations of the pressure vessel. A micromechanics approach using datasheet values was initially
used to predict most of the mechanical properties of composites (see section 2.4.4). However, this
approach was purely theoretical and relied on manufacturers’ data as well as some simplifying
assumptions for example assuming the composite is perfectly bonded which is not necessarily true.
Table 5.15 shows the manufacturers’ data on the carbon fibre and epoxy.
Table 5.15: Supplied mechanical property values for the carbon fibre [118] and the epoxy resin [102]
Material
Property
Elastic Modulus UTS Failure Strain
1E
[GPa]
2E
[GPa]
L
[MPa]
T
[MPa]
1
[%]
2
[%]
Carbon Fibre (HTS45) [118] 240 - 4500 - 1.8 -
Epoxy Resin AR600 and AH2336 Hardener [102]
2.5 2.5 73 73 5.5 5.5
Table 5.16 shows the calculated theoretical property values for the CFRP material determined using
the micromechanics approach described in section 2.3.4.1.
Table 5.16: Theoretical property values of the CFRP material
Property Symbol Theoretical Value
Ultimate Tensile Strength in the 0 O direction 1
2287 MPa
Ultimate Tensile Strength in the 90 O direction 2
14.8 MPa
Elastic Modulus in the 0 O direction 1
121.7 GPa
Elastic Modulus in the 90 O direction 2
6 GPa
Maximum Tensile Strain in the 0 O direction 1
1.05%
Maximum Tensile Strain in the 90 O direction 2
0.5%

90
There was no information regarding the UTS of the fibres in the transverse direction from the
manufacturers (Toho Tenax) [118]. This meant that the respective micromechanics equation could not
be used to determine the theoretical UTS value for the CFRP specimens in the transverse direction
(σ2). It is common to treat the strength of the resin as the transverse UTS of FRP composites [3, 91].
This tends to be overly simplistic and ignores the fact that the introduction of fibres into the resin
causes a decrease in the strength in the direction transverse to the fibres and as the fibre volume
fraction increases, the transverse tensile strength of the FRP composite decreases [4]. Therefore, a
simple yet very conservative approach suggested by Hull [4] was used instead and is shown below:
0.5
2 1 2f
m t
v
[5.1]
where:
2 is the transverse UTS of the composite
m t
is the transverse UTS of the matrix material
fv is the volume fraction of the fibres (i.e. 50%)
Similarly, because there was no information on the elastic modulus and failure strain in the direction
transverse to the fibres from the manufacturer’s technical data sheet [118], the micromechanics
equation for E2 and ε2 could not be used. The value for E2 was inferred from Performance Composites
Ltd [81] as it listed the property values acquired from extensive testing of a wide range of CFRP
composites composed of similar carbon fibre and epoxy resin. Additionally, according to other sources
[3-4, 95], the value for E2 for CFRP material generally did not vary amongst different carbon fibres with
similar stiffness properties in the transverse direction that ranged in the range 6-10 GPa.
Tensile test results of the 0o CFRP specimens
The tensile test results for the five 0o CFRP specimens are listed in Table 5.17 below. It should be noted
that the observed failure strain was derived from the Zwick machine test data using the displacement
traversed by the machine head. The calculated failure strain rate was determined by dividing the UTS
by the determined elastic modulus. The same applies for the 90o CFRP specimen test results.
Table 5.17: Tensile test results for the 0o specimens
Specimens Elastic Modulus [GPa]
UTS [MPa]
Observed Failure Strain
[%]
Calculated Failure Strain
[%]
Specimen 1 115.3 1379 1.40% 1.09%
Specimen 2 113.4 1490 1.81% 1.20%
Specimen 3 96.2 1327 1.45% 1.26%
Specimen 4 110.3 1321 1.22% 1.09%
Specimen 5 110.4 1269 1.28% 1.05%
Average 109 1357 1.43% 1.14%
Standard deviation 6.71 75 0.206% 0.0708%
Expected value 121.7 2287 1.05%

91
The elastic modulus was at least 110 GPa for four of the specimens with one outlier with a value of
96.2 GPa. The mean value of the Elastic modulus was 109 GPa and the standard deviation of the mean
was 6.71 GPa which indicated a reasonably small amount of variation in the results. The mean elastic
modulus value was smaller than the theoretical value by approximately 11 GPa (i.e 11% difference).
The UTS values ranged from 1269 MPa to 1490 MPa with a mean value of 1357 MPa. The standard
deviation value was only 5.5% of the mean value thereby showing a small variation in the values. The
mean value determined was approximately 59 % of the theoretical value demonstrating a significant
discrepancy. The observed failure strain values were consistently higher than the calculated values for
all five specimens. As expected, the mean value for the observed failure strain (1.43%) was larger than
that of the calculated failure strain (1.14%). The standard deviation of the observed failure strain was
found to be approximately 14.5 % indicating a relatively high variation in the data as compared to that
of the calculated failure strain which was only about 6% of its mean.
Plotting a stress vs strain graph for all specimens, it was observed that the relationships were all linear
for all five specimens according to Figure 5.63. For the longitudinal direction, the linear behaviour was
observed until the fracture point which is similar to what is expected typically in CFRP composite
specimens [4, 91].
Figure 5.63: Graph of the longitudinal stress against the strain of the CFRP specimens along the 0o direction (longitudinal direction)
The consistency in the slopes of most of the specimens suggested that their elastic moduli were also
similar except for specimen 3 which was noticeably lower. This was supported by the results in Table
5.17 as Specimen 3 had an elastic modulus value of 96.2 GPa while the other four specimens had
values of at least 110 GPa.
After inspecting the five failed 0o CFRP specimens, it was observed that the predominant failure mode
(for four of the five specimens) was cracking and splitting of the specimen along the fibre direction.
This was an acceptable failure mode given by the ASTM D3039/D3039M standard though it was not a
true tensile failure as there was no lateral failure of the carbon fibres [120]. Figure 5.64 illustrates this
type of failure mode.
0
200
400
600
800
1000
1200
1400
1600
0 0,002 0,004 0,006 0,008 0,01 0,012 0,014 0,016
Stre
ss (
MP
a)
Strain
Longitudinal Stress vs Strain - 0o CFRP specimens
Specimen 1 Specimen 2 Specimen 3 Specimen 4 Specimen 5

92
Figure 5.64: Photograph of a failed 0o tensile test specimen with a crack along the fibre direction
Specimen 4 exhibited an additional failure mode to the one in Figure 5.64. The specimen also had
partial failure transverse to the fibre direction indicating fibre breakage as shown in Figure 5.65. This
type of failure mode was also considered acceptable according to the ASTM D3039/D3039M standard
[120]. However, this difference in failure mode did not seem to affect the experimental results i.e.
elastic modulus and UTS.
Figure 5.65: Photograph of a failed 0o tensile test specimen with two failure modes
90o CFRP specimens
The results of the tensile test for the three 90o CFRP specimens are shown in Table 5.18.
Table 5.18: Tensile test results for the 90o specimens
Specimens Elastic Modulus [MPa]
UTS [MPa]
Observed Failure Strain
[%]
Calculated Failure Strain
[%]
Specimen 1 632 3.38 0.584% 0.535%
Specimen 2 423 2.53 0.600% 0.598%
Specimen 3 738 4.16 0.548% 0.568%
Average 598 3.36 0.578% 0.567%
Standard deviation 131 0.666 0.0216% 0.0257%
Expected value 10000 14.8 0.5%
Crack along fibre
direction
Aluminium tab
Crack along the direction
transverse to the fibres
Crack along fibre
direction
Aluminium
tab
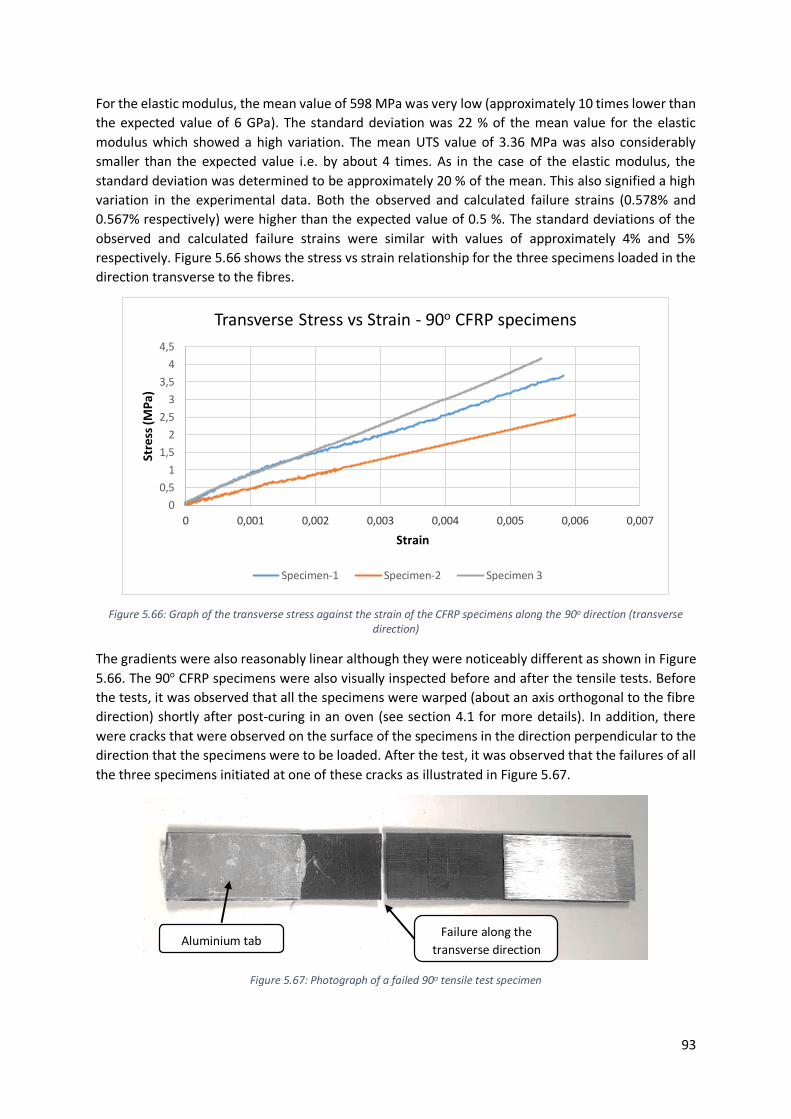
93
For the elastic modulus, the mean value of 598 MPa was very low (approximately 10 times lower than
the expected value of 6 GPa). The standard deviation was 22 % of the mean value for the elastic
modulus which showed a high variation. The mean UTS value of 3.36 MPa was also considerably
smaller than the expected value i.e. by about 4 times. As in the case of the elastic modulus, the
standard deviation was determined to be approximately 20 % of the mean. This also signified a high
variation in the experimental data. Both the observed and calculated failure strains (0.578% and
0.567% respectively) were higher than the expected value of 0.5 %. The standard deviations of the
observed and calculated failure strains were similar with values of approximately 4% and 5%
respectively. Figure 5.66 shows the stress vs strain relationship for the three specimens loaded in the
direction transverse to the fibres.
Figure 5.66: Graph of the transverse stress against the strain of the CFRP specimens along the 90o direction (transverse direction)
The gradients were also reasonably linear although they were noticeably different as shown in Figure
5.66. The 90o CFRP specimens were also visually inspected before and after the tensile tests. Before
the tests, it was observed that all the specimens were warped (about an axis orthogonal to the fibre
direction) shortly after post-curing in an oven (see section 4.1 for more details). In addition, there
were cracks that were observed on the surface of the specimens in the direction perpendicular to the
direction that the specimens were to be loaded. After the test, it was observed that the failures of all
the three specimens initiated at one of these cracks as illustrated in Figure 5.67.
Figure 5.67: Photograph of a failed 90o tensile test specimen
0
0,5
1
1,5
2
2,5
3
3,5
4
4,5
0 0,001 0,002 0,003 0,004 0,005 0,006 0,007
Stre
ss (M
Pa)
Strain
Transverse Stress vs Strain - 90o CFRP specimens
Specimen-1 Specimen-2 Specimen 3
Failure along the
transverse direction Aluminium tab

94
5.1.2 Discussion of the tensile test results As can be observed from the results, most of the values of the mechanical properties from the tensile
tests were consistently lower than the theoretical values for both the 0 O and 90 O directions. However,
the property values for the UTS and Elastic Modulus in the 90 O direction were found to be very low in
comparison to the expected values as well as those from several credible sources [3-4, 81, 95]. The
reasons for the various mismatches in the property values of the 0O and 90O CFRP specimens
determined by the tensile tests could have been the result of the following factors:
Presence of voids which could have been likely introduced during the manufacture of the
specimens. Voids are known to result in a lower transverse tensile strength value if the void
content is sufficiently high [3].
The 90O specimens were warped after being post-cured and discernible cracks were observed
on the surface. During the manual filament winding process, the winding angle was judged by
eye which may have introduced inaccuracies in the winding angle. This could have caused
warping when the specimens were post-cured, thereby forming cracks on the surface because
of the residual stresses caused by heat. The cracks were therefore stress concentrations
where failure could initiate.
Non-uniform material properties. During the filament winding process, after each layer of
carbon fibre was wound on the rectangular block (Figure 4.3), the layer was post-impregnated
with epoxy resin by hand. Because of the human factor, the epoxy resin content on the flat
panels was likely not constant for each point (i.e. inconsistent material properties). As such,
areas of low or high epoxy resin content could have been formed resulting in localised areas
of weakness on the specimens.
For most of the 0o specimens, failure occurred in the fibre direction and not in the direction
transverse to the loading direction. This meant that most of the fibres in the specimens did
not fail due to tension which should have occurred at a higher tensile load than was witnessed.
The assumptions made on the theoretical property values were incorrect. For example that
there was a perfect bond between the fibres and the resin.
The set of mechanical properties determined from these tensile tests appeared lower than
anticipated, but they provided the initial set of design values that were used to model the behaviour
of the CFRP tube. The CFRP tube would eventually be tested and their actual behaviour would be used
to confirm the behaviour modelled using the initial set of properties.
5.2 End cap adhesive shear There were three sets of end cap adhesive shear tests that were performed with five test specimens
per test. The three tests coincided with each of the three designs of the end caps covered in section
4.2. The objective of this test was to determine the actual shear strength of the SpaBond 340 LV
adhesive when used to bond each of the three end cap designs to the inner wall of the CFRP tube.
5.2.1 First Test For the first end cap adhesive shear test, the slow hardener was used in conjunction with the SpaBond
340 LV resin resulting in a theoretical shear strength of SpaBond 340 LV of 34.5 MPa according to the
manufacturer [108].
Results
Table 5.19 provides a summary of that data that was recorded for the first test. The maximum applied
shear stress was calculated by dividing the maximum applied shear force by the calculated shear area
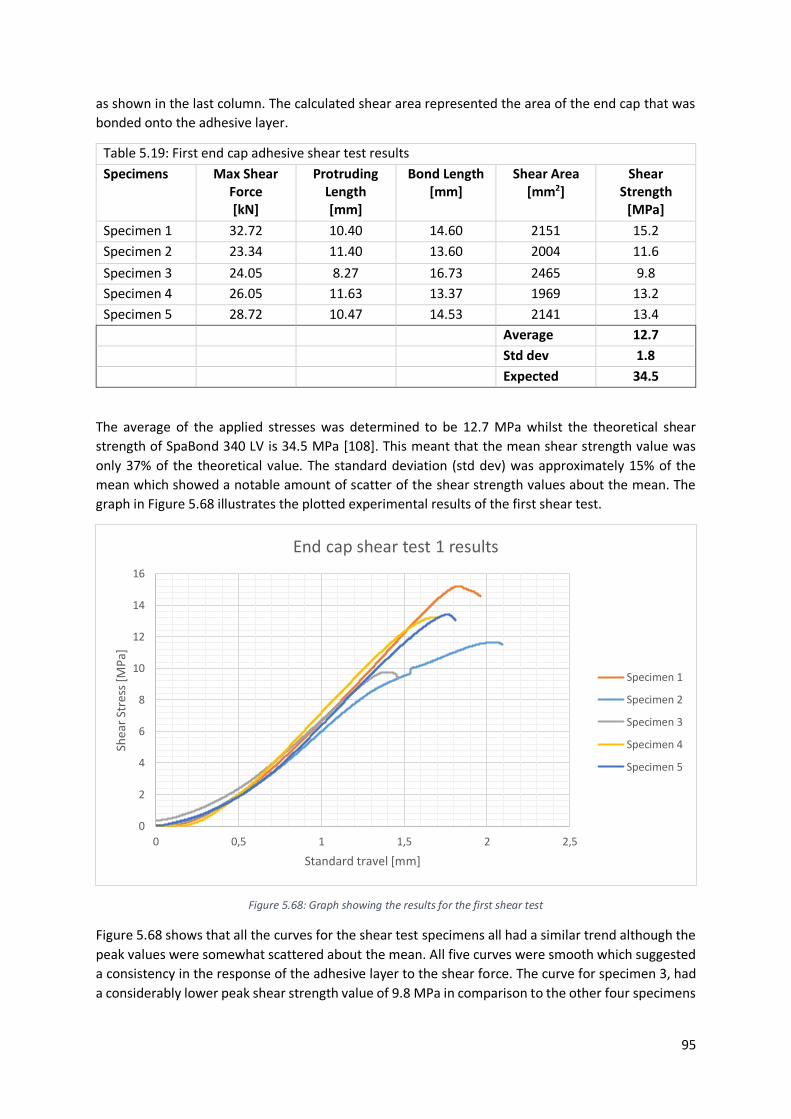
95
as shown in the last column. The calculated shear area represented the area of the end cap that was
bonded onto the adhesive layer.
Table 5.19: First end cap adhesive shear test results
Specimens Max Shear Force [kN]
Protruding Length [mm]
Bond Length [mm]
Shear Area [mm2]
Shear Strength
[MPa]
Specimen 1 32.72 10.40 14.60 2151 15.2
Specimen 2 23.34 11.40 13.60 2004 11.6
Specimen 3 24.05 8.27 16.73 2465 9.8
Specimen 4 26.05 11.63 13.37 1969 13.2
Specimen 5 28.72 10.47 14.53 2141 13.4
Average 12.7
Std dev 1.8
Expected 34.5
The average of the applied stresses was determined to be 12.7 MPa whilst the theoretical shear
strength of SpaBond 340 LV is 34.5 MPa [108]. This meant that the mean shear strength value was
only 37% of the theoretical value. The standard deviation (std dev) was approximately 15% of the
mean which showed a notable amount of scatter of the shear strength values about the mean. The
graph in Figure 5.68 illustrates the plotted experimental results of the first shear test.
Figure 5.68: Graph showing the results for the first shear test
Figure 5.68 shows that all the curves for the shear test specimens all had a similar trend although the
peak values were somewhat scattered about the mean. All five curves were smooth which suggested
a consistency in the response of the adhesive layer to the shear force. The curve for specimen 3, had
a considerably lower peak shear strength value of 9.8 MPa in comparison to the other four specimens
0
2
4
6
8
10
12
14
16
0 0,5 1 1,5 2 2,5
Shea
r St
ress
[M
Pa]
Standard travel [mm]
End cap shear test 1 results
Specimen 1
Specimen 2
Specimen 3
Specimen 4
Specimen 5

96
that had shear strength values of at least 11 MPa. Only the curve for specimen 5 differed slightly in
terms of the slope compared to the rest of the specimens beyond the standard travel value of 1 mm.
Figure 5.69: Photograph of an example of a specimen that failed due to shear during the first set of tests
Figure 5.69 illustrates a specimen that failed in shear during the first adhesive shear test. After pressing
the dummy end cap out, the adhesive layer could be visually inspected. Of note, were the voids in the
adhesive layer which were likely due to the first adhesive application method in the designated area.
It was also worth noting that all five specimens experience shear failure on the end cap to adhesive
layer interface rather on the adhesive layer to CFRP interface. This was a strong indication that the
end cap to adhesive layer interface was the limiting case for this type of loading.
Discussion
The mean shear strength for the first test was only 37% of the theoretical value of 34.5 MPa for the
SpaBond 340 LV adhesive. After visually inspecting the adhesive layer in Figure 5.69, voids were
observed. Voids effectively lessened the shear area used to determine the shear strength thereby
resulting in a shear strength value that is lower. However, the voids in Figure 5.69 appeared to cover
less than 20% of the shear area of the adhesive meaning that the actual shear strength would be at
most approximately 20 % more than the mean value i.e. approximately 15.3 MPa. This was still less
than half of the theoretical shear strength value suggesting there was one or more other factors
causing these differences.
5.2.2 Second test The second end cap design was prompted by the need to eliminate the formation of voids (see section
3.2.4 for more details). A fast hardener was used for SpaBond 340 LV adhesive in this case and thus,
the resulting theoretical shear strength was 33.3 MPa [108]. In addition, the dummy end caps used
for the second test were bonded onto the short CFRP tubes using a different adhesive application
method to the one used previously. This method involves the use of a syringe to inject resin directly
into the bond region between the end cap and the internal wall of the CFRP tube.
Results
The second end cap adhesive shear test results are recorded Table 5.20. The mean shear strength of
the adhesive for the second test showed a small increase from the first test (i.e. from 12.7 MPa to 14.7
Voids Adhesive bond
layer
Short CFRP
tube

97
MPa) though it still amounted to only 44 % of the theoretical shear strength of SpaBond 340 LV. The
increase in the mean shear strength value may have been due to the second adhesive application
method. The standard deviation was 2.9 MPa which indicated a slightly higher variation than the one
from the first tests.
Table 5.20: Second adhesive shear test results
Specimens Max Shear Force [kN]
Protruding Length [mm]
Bond Length
[mm]
Shear Area
[mm2]
Shear Strength
[MPa]
Specimen 1 25.468 11.77 13.2 1950 13.1
Specimen 2 19.360 12.60 12.4 1826 10.6
Specimen 3 47.655 8.39 16.6 2447 19.5
Specimen 4 29.496 12.18 12.8 1890 15.6
Specimen 5 17.1 17.13 7.87 1160 14.7
Average 14.7
Std dev 2.9
Expected 33.3
The graph in Figure 5.70 illustrated the results of the second shear test.
Figure 5.70: Graph showing the results for the second shear test
The graph shows that the trends for all five curves were similar initially which showed that the
specimens had a similar response when a shear force was applied. However, the graph also showed
that the shear strength peak values of the specimens varied by a greater amount than in the first test
0
5
10
15
20
25
0 0,5 1 1,5 2 2,5
Shea
r st
ress
[M
Pa]
Standard travel [mm]
Shear Test 2- Results
Specimen 1
Specimen 2
Specimen 3
Specimen 4
Specimen 5

98
which was consistent with the fact that the standard deviation was 20% of the mean shear strength
value.
In Figure 5.71 is a photograph of one of the specimens that failed in shear during the second adhesive
shear test. It was observed that the adhesive bond layer was uniform and had no voids like the
previous sample specimen used in the first test (see Figure 5.71). This strongly suggested that absence
of voids was the result of the change in the adhesive application method. The only mode of failure
observed for the second set of specimens was a shear failure on the end cap to adhesive layer
interface.
Figure 5.71: Photograph of a failed specimen from the second shear test
Discussion
There was a small improvement in the shear strength of the adhesive from the first test to the second
test i.e. from 12.7 MPa to 14.7 MPa. The second adhesive application method was implemented for
the dummy end caps used in the second set of shear tests as a way to counter the formation of voids.
The adhesive layer of all failed second test specimens were visually inspected, and no discernible voids
were observed as illustrated in Figure 5.71. This confirmed that the second adhesive application
method was successful in eliminating void formation in the adhesive layer. It could be concluded that
the increase in the shear strength of the adhesive was attributed to the absence of voids in the
adhesive layer. However, the mean shear strength remained less than 50% of the theoretical shear
strength value. The standard deviation also remained undesirably high at 20% of the mean which was
worse than that of the first test at 15% of its respective mean value. It was deduced that the surface
finish on the bond area of the dummy end cap was likely not consistent at all points which might have
caused the variation observed in both the first and second shear test results. As part of the surface
preparation, the bond area on the end cap was hand abraded with an 80-grit emery cloth before the
adhesive was applied which was the most likely cause of the uneven surface finish. It was also assumed
that increasing the surface roughness of the bond area on the end cap would increase the mechanical
Uniform adhesive layer
(no discernible voids)
Short CFRP
tube

99
grip of the adhesive layer which could possibly increase the mean shear strength value. Therefore, it
was decided that knurling be introduced on the bond area on the end cap for the third end cap design
which would be assessed in the third adhesive shear test.
5.2.3 Third test The third dummy end cap design included a knurled designated bond area. This was the only feature
that differentiated the third dummy end cap design with the second design. The fast hardener was
again used for the third set of adhesive shear test specimens.
Results
Table 5.5 summarizes the results from the third test. The average shear strength for the third shear
test of 13.3 MPa was lower than that of the second shear test by a margin of about 10%. Conversely,
the standard deviation value was only 4 % of the mean shear strength value which was at its lowest
as compared to the previous two tests. This was an indication that there were less inconsistencies in
the preparation of the specimens.
Table 5.5: Third adhesive shear test results
Specimens Max Shear Force [kN]
Protruding Length [mm]
Bond Length
[mm]
Shear Area
[mm2]
Shear Strength
[MPa]
Specimen 1 17.902 15.58 9.42 1391 12.87
Specimen 2 19.843 14.98 10.02 1480 13.41
Specimen 3 19.639 14.8 10.2 1506 13.04
Specimen 4 15.362 16.89 8.11 1197 12.83
Specimen 5 25.017 13.2 11.8 1742 14.36
Average 13.3
Std dev 0.57
Expected 33.3
Figure 5.72 shows the graph with the results of the third and final adhesive shear test that was
performed. The curves were observed to have a similar trend to the previous tests. It was also
observed that the adhesive layer was uniform as was the case in the second test (see Figure 5.71). As
with the first and second tests, the shear failure occurred on the end cap to adhesive layer interface.

100
Figure 5.72: Graph showing the results of the third shear test
Discussion
For the third adhesive shear test, the standard deviation dropped to 4% of the mean shear strength
value from 20 % in the second test. The low standard deviation value was desirable as it gave more
confidence in the calculated mean shear strength value of the adhesive layer. This was critical in the
choosing of a safety factor to use with regards to accounting for shear failure of the end cap. The
higher the standard deviation value, the higher the uncertainty which in turn meant increasing the
safety factor considerably. Increasing the safety factor for shear failure was undesirably because it
meant increasing the bond area length on the end cap which would in turn increase the size and mass
of the end cap as well as that of the entire pressure vessel. Therefore, knurling the bond area on the
end caps seemed to guarantee a low standard deviation in the mean shear strength value. Conversely,
between the second and the third shear test, the mean shear strength value dropped from 14.7 MPa
to 13.3 MPa. This suggested that knurling did not result in the improvement of the mechanical bond
which would increase the shear strength value as initially expected. The shear strength value for the
13.3 MPa was thus used in the design calculations for the third end cap design.
The shear failure was observed to be consistently occurring only on the end cap to adhesive layer
interface for all specimens in the three tests. In section 3.2.3 on sizing the end cap bond area, it was
assumed (based on calculation) that the adhesive layer would experience shear failure on the end cap
to adhesive layer interface i.e. limiting case. This was based on the fact that shear area of that interface
was less than that of the interface between the adhesive layer and the internal wall of the CFRP tube.
Therefore, the results from the shear tests proved that for this type of loading, the assumption that
failure would occur on the end cap to adhesive layer was reasonable.
5.3 Hydrostatic burst pressure tests According to the requirements stipulated by the ASME Pressure Vessel Code Section X for FRP
pressure vessels, the failure pressure of a CFRP pressure vessel had to be at least 2.25 times the
maximum working/design pressure [10]. Therefore, determining the failure pressure of a CFRP
0
2
4
6
8
10
12
14
16
0 0,5 1 1,5 2
Shea
r St
ress
[M
Pa]
Standard travel [mm]
End cap shear test 3 results
Specimen 1
Specimen 2
Specimen 3
Specimen 4
Specimen 5

101
pressure vessel was essential and was one of the primary objectives of the burst test. There were
various modes by which the CFRP pressure vessel could fail. These included bursting (i.e. failure of the
CFRP section of the vessel), shear failure of the end caps or leaking through the end caps. The second
objective of the burst test was to measure and analyse strain readings (for the longitudinal and hoop
directions). The specimen CFRP pressure vessels were fitted with strain gauges that could measure
longitudinal and hoop strain as the vessels were pressurised. The strain measurements would allow
the resulting deformation behaviour of the CFRP section of the vessel to be understood which would
be useful for future designs of similar CFRP tubes. In addition, the strain response or deformation
behaviour in the hoop and longitudinal directions would give information regarding the stiffness of
the CFRP tube. This information would allow the validation/correction of the initially estimated
stiffness properties (see sections 3.1.3 and 5.1.1) implemented in the CLT based calculations used for
designing the CFRP tubes.
5.3.1 First set of CFRP pressure vessels There were three CFRP pressure vessels that made up the first set of vessels and they all had a 4 mm
wall thickness. The first end cap design was used in vessel 1 whilst the second end cap design was used
for vessels 2 and 3. There were two sets of results, the first being of the recorded failure pressures
and modes, the second being the results of the strain measurements.
5.3.1.1 Results on failure pressures of the first set of burst tests The hydrostatic burst pressure tests were performed for each of the three 4 mm CFRP vessels until
failure occurred. The failure pressures, maximum design pressures and causes of the failures are
summarised in Table 5.21 below:
Table 5.22 shows the predicted pressures that were determined using the four failure theories from
section 5.1. It can be noted that none of the three vessels failed due to the bursting of the CFRP tube.
Therefore, the failure pressures of the three vessels in Table 5.21 could not be directly compared to
the predicted burst pressures in Table 5.22.
Table 5.22: Predicted burst pressures for 4 mm CFRP tube using the initial estimate strength properties
Failure theory Predicted Burst Pressure [bar]
Maximum Stress 360
Maximum Strain 500
Tsai-Hill 327
Tsai-Wu 344
Table 5.21: Failure pressures, maximum design pressure and modes for the first set of CFRP pressure vessels
Vessel No
Failure Pressure
[bar]
Max Design Pressure
[bar]
Failure mode and description
1 136 60 Shear failure between the end cap to adhesive layer interface resulting in the end cap being partially pushed out (Figure 5.73)
2 162 72 Leaking past the adhesive layer at one of the ends of the pressure vessel
3 220 98 An initial partial shear failure of one end cap to adhesive layer interface and then on the interface between the adhesive layer and the internal wall of the CFRP tube (Figure 5.75)
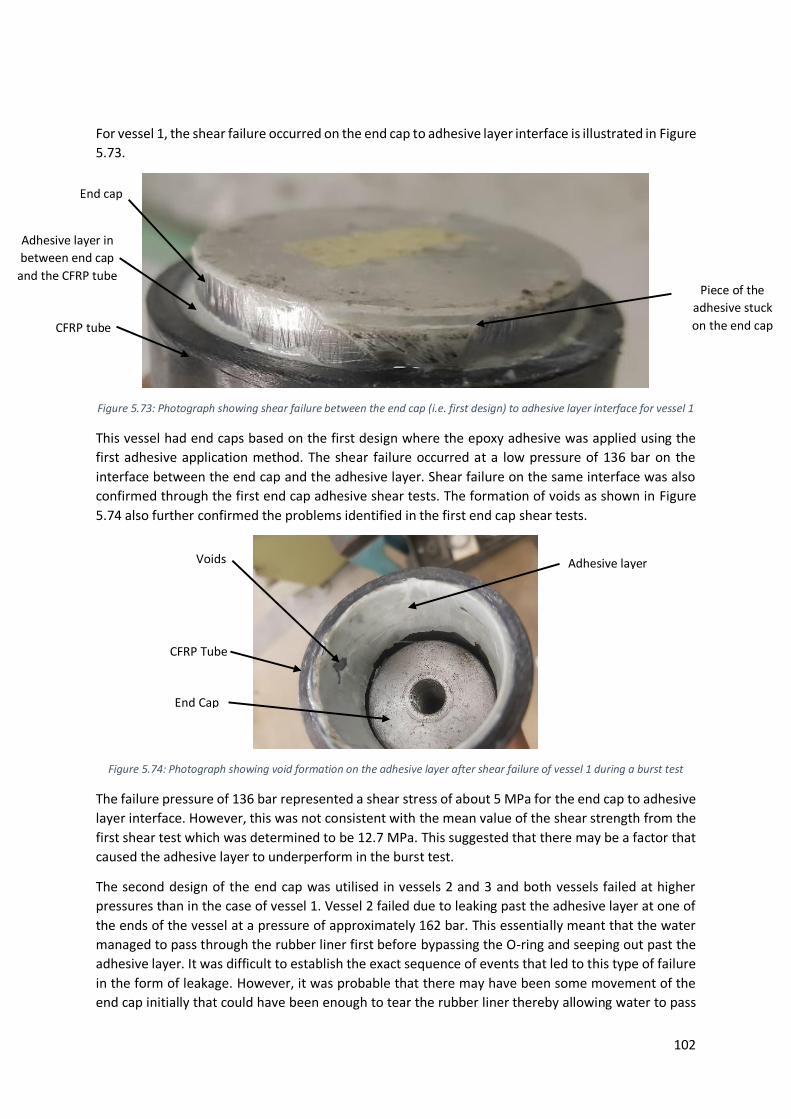
102
For vessel 1, the shear failure occurred on the end cap to adhesive layer interface is illustrated in Figure
5.73.
Figure 5.73: Photograph showing shear failure between the end cap (i.e. first design) to adhesive layer interface for vessel 1
This vessel had end caps based on the first design where the epoxy adhesive was applied using the
first adhesive application method. The shear failure occurred at a low pressure of 136 bar on the
interface between the end cap and the adhesive layer. Shear failure on the same interface was also
confirmed through the first end cap adhesive shear tests. The formation of voids as shown in Figure
5.74 also further confirmed the problems identified in the first end cap shear tests.
Figure 5.74: Photograph showing void formation on the adhesive layer after shear failure of vessel 1 during a burst test
The failure pressure of 136 bar represented a shear stress of about 5 MPa for the end cap to adhesive
layer interface. However, this was not consistent with the mean value of the shear strength from the
first shear test which was determined to be 12.7 MPa. This suggested that there may be a factor that
caused the adhesive layer to underperform in the burst test.
The second design of the end cap was utilised in vessels 2 and 3 and both vessels failed at higher
pressures than in the case of vessel 1. Vessel 2 failed due to leaking past the adhesive layer at one of
the ends of the vessel at a pressure of approximately 162 bar. This essentially meant that the water
managed to pass through the rubber liner first before bypassing the O-ring and seeping out past the
adhesive layer. It was difficult to establish the exact sequence of events that led to this type of failure
in the form of leakage. However, it was probable that there may have been some movement of the
end cap initially that could have been enough to tear the rubber liner thereby allowing water to pass
End Cap
CFRP Tube
Voids Adhesive layer
End cap
CFRP tube
Piece of the
adhesive stuck
on the end cap
Adhesive layer in
between end cap
and the CFRP tube

103
through. Secondly, the end cap movement could also have displaced the O-ring sufficiently so that it
would not be able to seal properly thereby allowing the pressurized water to pass through.
Consequently, the bond between one of the two interfaces can be considered to have failed for the
water to leak at the end cap.
Figure 5.75: Photograph showing multiple modes of failure of the adhesive layer on both interfaces for vessel 3
For vessel 3, there was a combination of failures that occurred on both interfaces of the adhesive layer
as shown in Figure 5.75. Initially, upwards movement of the end cap was observed as it was being
pushed out. However, when the end cap had slightly moved relative to the adhesive layer and tube it
temporarily stopped moving during the burst test. Shortly afterwards at a higher pressure just below
220 bar, there was upwards movement on the interface between the adhesive and CFRP tube before
water started leaking out. There was also a suggestion of delamination as can be seen by the
fragments of CFRP remaining on the adhesive layer to CFRP tube interface in Figure 5.75.
5.3.1.2 Results on strain measurements from the first set of burst tests
During the hydrostatic burst tests for the first set of three 4 mm thick CFRP tubes, the hoop and
longitudinal strain measurements were recorded. The strain measurements are plotted on graphs as
described in this sub-section.
The longitudinal strain for the 4 mm vessel in all three cases was observed to be negative as shown in
Figure 5.76 meaning the vessel was “shrinking” in the longitudinal direction. The deformation
behaviour of the three vessels in the longitudinal direction was linear showing that the stiffness (i.e.
inverse of the gradient) was constant for all pressures up to 220 bar. Furthermore, they also had had
similar gradient values (and therefore stiffness). The best fit line on the graph represented the average
deformation response of all three vessels in the longitudinal direction. The best fit line was also used
in the hoop direction as illustrated in Figure 5.77.
Shear failure on the
end cap-adhesive
layer interface
Shear failure on the
CFRP tube-adhesive
layer interface

104
Figure 5.76: Graph of the longitudinal strain vs the pressure for the first set of CFRP pressure vessels
The hoop strain was positive as shown in Figure 5.77 signifying an increase in diameter for all
pressures. The deformation behaviour of each of the three vessels was also linear in nature indicating
constant stiffness up until their respective failure pressures. The graph in Figure 5.77 also showed that
there was a very close agreement in the deformation behaviours of the three vessels as all the three
sets of data points essentially lay on top of each other. The data points from the three vessels were
practically on top of the best fit line indicating a strong correlation.
Figure 5.77: Graph of the hoop strain vs the pressure for the first set of CFRP pressure vessels
-2500
-2000
-1500
-1000
-500
0
0 50 100 150 200 250 300
Lon
gitu
din
al s
trai
n [
με]
Pressure [bar]
1st set - 4 mm vessels - Longitudinal strain vs Pressure
Best fit line 1 2 3
0
200
400
600
800
1000
1200
1400
1600
0 50 100 150 200 250 300
Ho
op
Str
ain
[μ
ε]
Pressure [bar]
1st set - Hoop strain vs Pressure
Best fit line 1 2 3

105
5.3.1.3 Discussion of the first burst test results
Failure pressures
Vessel 1 of the first set of CFRP 4 mm vessels failed due to shear at the interface between the end cap
and adhesive layer. Vessel 1 had the first end cap design and failed at a pressure of 136 bar that was
equivalent to an applied shear stress of 5 MPa which was significantly lower than anticipated. The
adhesive layer shown in Figure 5.74 showed the presence of voids that undermined the shear strength
of the adhesive layer as the actual shear area was lower than the one used in the calculations.
However, judging simply by the area that was occupied by voids in Figure 5.74, it could not have
accounted for the entire difference between the 5 MPa and 12.7 MPa values. There should have been
another cause which was probably related to the method of preparation and bonding of the end caps.
It could have been that the bond area on the end caps was not abraded enough to give the necessary
surface roughness to grip effectively onto the adhesive layer thereby resulting in a lower shear
strength value.
The remaining two vessels of the first set of vessels failed at higher pressures than the first vessel.
They both used end caps based on the second design. Vessel 2 failed due to leaking at the adhesive
layer’s interface(s) at a pressure of 162 bar. This suggested that the rubber liner and O-ring, failed to
prevent the water from leaking out at one of the ends of the vessel. The rubber liner should have
failed first as it is the first sealant in contact with water in the vessel. Since leaking did not occur in the
other two vessels, it is reasonable to suggest that vessel 2 likely had a unique defect which made it an
outlier.
The last vessel in the first set failed due to multiple failure methods at 220 bar (see Figure 5.75). The
partial shear failure on the end cap to adhesive layer interface occurred initially and facilitated the
upward movement of the end cap. The eventual failure occurred on the adhesive layer to CFRP tube
wall interface which appeared to be a combination of shear and delamination. Shear failure
dominated while there was a little delamination as only a small portion of a layer from the CFRP tube
wall was stuck on the adhesive layer. However, the occurrence of delamination possibly suggests that
the adhesive layer was under tension. This could have been possible if the CFRP tube was expanding
more in the hoop direction than the end cap. This tensile load would have then aided delamination of
the thin layer of the CFRP tube interfacing with the adhesive layer. Therefore, the combination of
shear and delamination at the adhesive layer to CFRP tube wall interface was what could have caused
the failure of the vessel.
It was noted that none of the three CFRP vessels of the first set of vessels failed due to bursting of the
CFRP tube section. The failure pressure/strength of the CFRP tube section of the vessel could not be
determined. Thus, it was established that the 4 mm CFRP tube could only fail at a pressure higher than
220 bar.
Strain measurements from the first set of burst tests
The longitudinal strain was negative which indicated compression of the CFRP tube in the longitudinal
direction. This supports the possibility of the adhesive layer being under tension. For both longitudinal
and hoop directions the strain response of the CFRP tube was linear. The stiffness of the CFRP tube
was represented by the inverse of the gradient and in both directions, the stiffness values were
constant. It can be noted that the stiffness values in the hoop and longitudinal directions were in close
agreement to each other as the scatter about the best fit line seemed minimal. This consistency in the
results for all three 4 mm CFRP tubes was expected and encouraging given that they were cut from
the same CFRP tube. The stiffness properties of the CFRP tube material were adjusted until the
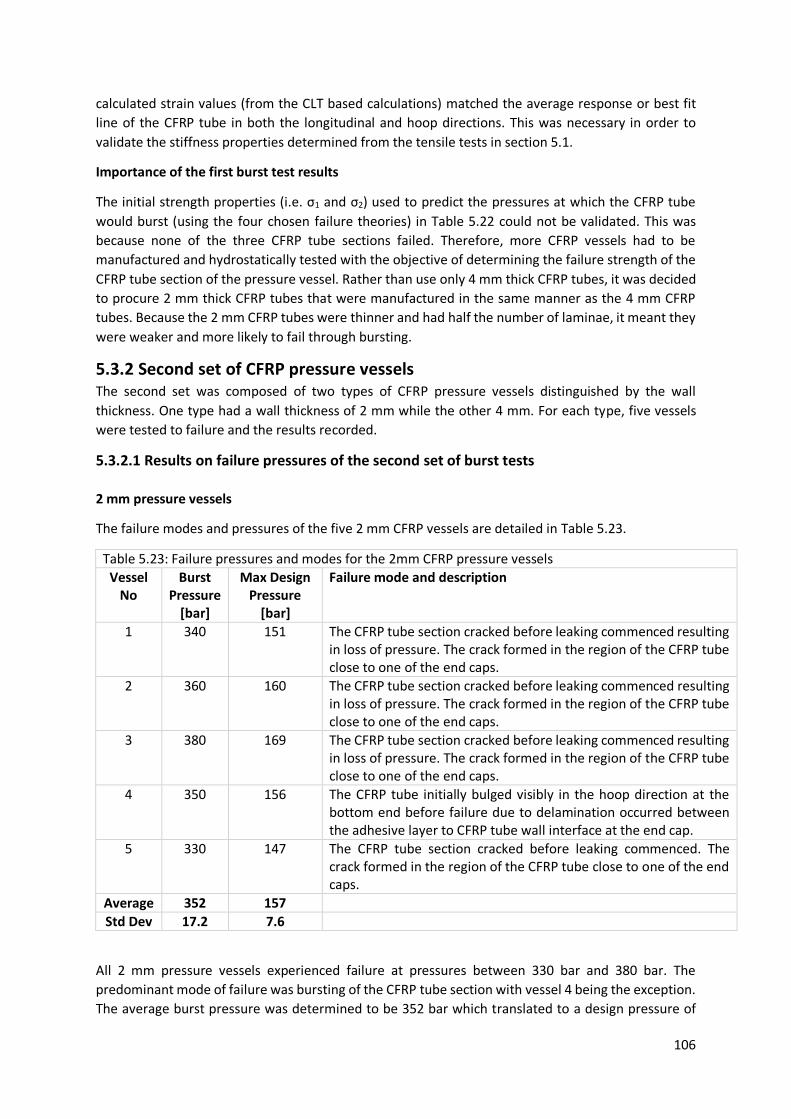
106
calculated strain values (from the CLT based calculations) matched the average response or best fit
line of the CFRP tube in both the longitudinal and hoop directions. This was necessary in order to
validate the stiffness properties determined from the tensile tests in section 5.1.
Importance of the first burst test results
The initial strength properties (i.e. σ1 and σ2) used to predict the pressures at which the CFRP tube
would burst (using the four chosen failure theories) in Table 5.22 could not be validated. This was
because none of the three CFRP tube sections failed. Therefore, more CFRP vessels had to be
manufactured and hydrostatically tested with the objective of determining the failure strength of the
CFRP tube section of the pressure vessel. Rather than use only 4 mm thick CFRP tubes, it was decided
to procure 2 mm thick CFRP tubes that were manufactured in the same manner as the 4 mm CFRP
tubes. Because the 2 mm CFRP tubes were thinner and had half the number of laminae, it meant they
were weaker and more likely to fail through bursting.
5.3.2 Second set of CFRP pressure vessels The second set was composed of two types of CFRP pressure vessels distinguished by the wall
thickness. One type had a wall thickness of 2 mm while the other 4 mm. For each type, five vessels
were tested to failure and the results recorded.
5.3.2.1 Results on failure pressures of the second set of burst tests 2 mm pressure vessels
The failure modes and pressures of the five 2 mm CFRP vessels are detailed in Table 5.23.
Table 5.23: Failure pressures and modes for the 2mm CFRP pressure vessels
Vessel No
Burst Pressure
[bar]
Max Design Pressure
[bar]
Failure mode and description
1 340 151 The CFRP tube section cracked before leaking commenced resulting in loss of pressure. The crack formed in the region of the CFRP tube close to one of the end caps.
2 360 160 The CFRP tube section cracked before leaking commenced resulting in loss of pressure. The crack formed in the region of the CFRP tube close to one of the end caps.
3 380 169 The CFRP tube section cracked before leaking commenced resulting in loss of pressure. The crack formed in the region of the CFRP tube close to one of the end caps.
4 350 156 The CFRP tube initially bulged visibly in the hoop direction at the bottom end before failure due to delamination occurred between the adhesive layer to CFRP tube wall interface at the end cap.
5 330 147 The CFRP tube section cracked before leaking commenced. The crack formed in the region of the CFRP tube close to one of the end caps.
Average 352 157
Std Dev 17.2 7.6
All 2 mm pressure vessels experienced failure at pressures between 330 bar and 380 bar. The
predominant mode of failure was bursting of the CFRP tube section with vessel 4 being the exception.
The average burst pressure was determined to be 352 bar which translated to a design pressure of

107
157 bar with a standard deviation of about 8 bar. The scatter of the burst pressures about the mean
was minimal as the standard deviation was approximately 5% of the mean. The predicted pressures
at which the bursting of the CFRP tube would occur according to the failure theories using the strength
properties from section 5.1 are listed in Table 5.24. All five 2 mm CFRP pressure vessels failed at higher
pressures than expected indicating that the predicted burst pressures were conservative.
Consequently, this implied that the initial strength properties used for burst pressure predictions were
also conservative.
Table 5.24: Initial predictions of the burst pressures for the 2 mm CFRP vessels using the initial strength properties
Failure theory Predicted Burst Pressure [bar]
Maximum Stress 178
Maximum Strain 295
Tsai-Hill 160
Tsai-Wu 169
It was observed that for all five 2 mm pressure vessels before the occurrence of failure, there was
bulging of the CFRP tube at the locations close to both end caps as shown in Figure 5.78.
Unfortunately, the bulging of the vessels could not be captured on camera during burst testing
because of the way in which the test was set up.
Figure 5.78: Visual representation of the deformation observed on of the 2 mm CFRP vessels before failure
The bulging phenomenon suggested that the CFRP tube was expanding more than the end cap in the
hoop direction. The phenomenon depicted in Figure 5.78 preceded either the cracking of the CFRP
tube or delamination of a layer of the CFRP at one of the ends of the vessel. For the failure due to
delamination, a thin layer of CFRP was “peeled” off the internal wall of the CFRP tube and became
stuck onto the adhesive layer which, with the end cap, was pushed out partially as illustrated in Figure
5.79.
Visible bulging was observed
in this region on both ends Bulging of the CFRP tube on
the other end CFRP tube Adhesive layer
(red) End cap

108
Figure 5.79: Photograph showing failure due to delamination between the adhesive to CFRP tube wall interface
4 mm pressure vessels
Five CFRP pressure vessels with a wall thickness of 4 mm were tested to failure through hydrostatic
burst pressure tests. Four of the five 4 mm pressure vessels failed due to the shear failure on the end
cap to adhesive layer interface as shown in Figure 5.80. This was consistent with the end cap shear
test results where all specimens failed on the end cap to adhesive layer interface.
Figure 5.80: Photograph showing shear failure on the end cap to adhesive layer interface for a 4 mm vessel
CFRP tube
Thin layer of CFRP
plucked from the tube
wall and stuck onto the
adhesive layer
CFRP tube
Upward movement
of the end cap on
the interface with
the adhesive layer
Knurling on the
bond area of the
end cap

109
However, vessel number 2 experienced multiple modes of failure as shown in Figure 5.81. This was
similar to what was experienced by vessel 3 from the first set of CFRP pressure vessels (see Figure
5.75).
Figure 5.81: Photograph showing multiple modes of failure modes for a 4 mm CFRP pressure vessel
It was highly likely that the initial mode of failure was the partial shear failure on the end cap to
adhesive interface which caused the end cap to move upwards slightly. Just like the case of vessel 3
from the first set, what followed was probably a combination of shear failure on the adhesive layer to
CFRP tube wall interface and delamination. The delamination was seemingly not as significant as the
shear failure on the adhesive to tube wall interface as only a small portion of the thin layer CFRP
material remained stuck onto the adhesive layer as shown in Figure 5.81. The multiple modes of failure
on both interfaces with the adhesive layer (shown in Figure 5.81) was different to what transpired
during the end cap adhesive shear tests described in section 5.2. The reason for this difference was
likely because the CFRP was expanding in the hoop direction in the burst pressure tests unlike in the
end cap adhesive shear tests where the only type of loading on the adhesive layer was shear.
Table 5.25 provides a summary of the recorded hydrostatic burst test results. In addition, the
equivalent shear strength values were calculated using the failure pressures as shear was considered
to be the predominant mode of failure.
Table 5.25: Failure results of the five 4 mm CFRP pressure vessels
Vessel No Failure Pressure [bar]
Max Design Pressure [bar]
End cap adhesive shear strength
[MPa]
1 425 189 12.6
2 430 191 12.8
3 450 200 13.4
4 430 191 12.8
5 410 182 12.2
Average 429 191 12.8
Standard deviation 12.8 5.7 0.39
A thin layer of the CFRP
tube delaminated and
stuck onto the
adhesive layer
CFRP tube
Slight movement of
the end cap on the
interface with the
adhesive layer

110
Comparing the determined mean shear strength of SpaBond 340 LV from Table 5.25 (12.8 MPa) with
the one from the third end cap shear test (13.3 MPa) showed only a 4% difference in the values. The
predominant failure mode for the 4 mm CFRP vessels was shear failure which was indication that the
pressure at which the CFRP tube section would burst was not reached.
The observed failure pressures for the five 4 mm CFRP pressure vessels ranged in the narrow band of
pressures between 410 bar and 450 bar with a mean value of 429 bar. The mean maximum design
pressure was determined to be 191 bar with a small standard deviation that was only 3 % of the mean.
The predicted burst pressures for the 4 mm CFRP pressure vessels (from Table 5.22) using the four
failure theories are shown in Table 5.26.
Table 5.26: Predicted burst pressures for 4 mm CFRP tube using the initial strength properties from the tensile tests
Failure theory Predicted Burst Pressure [bar]
Average Failure Pressure [bar]
Maximum Stress 360 429 Maximum Strain 500
Tsai-Hill 327
Tsai-Wu 344
The predictions were made using the initial strength properties determined from the tensile tests in
section 5.1. The actual mean failure pressure exceeded the predictions (with the exception of the
Maximum Strain failure theory) by a significant margin. Again, this was an indication that the initial
burst pressure predictions were conservative.
5.3.2.2 Results on strain measurements from the second set of burst tests
As was the case with the results of the failure pressures for the second set of pressure vessels, the
results of the strain measurements are presented separately for the 2 mm and 4 mm pressure vessels.
The graphs for the measured strains against the applied pressure are plotted and described
accordingly.
2 mm pressure vessels
The graph in Figure 5.82 displays the longitudinal strain response of the five 2 mm CFRP pressure
vessels. It was observed that all five curves were initially linear in the range from 0 bar to about 160
bar of internal pressure. The stiffness (i.e. inverse of the gradient) was constant for that range. It was
also observed that all five pressure vessels displayed the same deformation behaviour as the shape of
each of the curves was approximately the same. In that range, the strains on the best fit line were in
close agreement with the measured longitudinal strains. Above 160 bar, the value of the gradient of
the curves started to increase, and they became non-linear, which meant that the stiffness started to
decrease. The decrease in stiffness probably signified the onset of some form of damage sustained by
the CFRP tube that continued until the vessels eventually failed. Additionally, the variation between
the curves started to increase noticeably the further the pressure rose beyond 160 bar.

111
Figure 5.82: Graph of longitudinal strain vs pressure for five 2 mm vessels from the second set
The graph of the hoop strain against the pressure for the five 2 mm CFRP pressure vessels is shown in
Figure 5.83. For all tests, up to approximately 200 bar, all pressure vessels exhibited a linear
relationship between the applied pressure and the measured hoop strain.
Figure 5.83: Graph of hoop strain vs pressure for five 2 mm vessels from the second set
-18000
-16000
-14000
-12000
-10000
-8000
-6000
-4000
-2000
0
0 50 100 150 200 250 300 350
Lon
gitu
din
al s
trai
n [
με]
Pressure [bar]
2nd set - 2 mm vessels - Longitudinal Strain vs Pressure
Best fit line 1 2 3 4 5
0
5000
10000
15000
20000
25000
0 50 100 150 200 250 300 350
Ho
op
str
ain
[μ
ε]
Pressure [bar]
2nd set - 2 mm vessels - Hoop Strain vs Pressure
Best fit line 1 2 3 4 5

112
Above 200 bar, the gradient started to increase. This non-linearity was not as pronounced as
witnessed for the longitudinal strain behaviour according to the graph in Figure 5.83. Therefore, the
start of the decrease in stiffness in the hoop direction manifested at a slightly later pressure than in
the longitudinal direction.
4 mm pressure vessels
Figure 5.84 shows the longitudinal strain behaviour for the five burst tested 4 mm CFRP pressure
vessels under the effect of the applied pressure. In the longitudinal direction, all pressure vessels
exhibited the same deformation behaviour as the curves had the same trend. Up to approximately
250 bar, all the curves were observed to have a linear trend after which, the graphs started to curve
downwards as the gradients started increasing (negatively) which corresponded to a decrease in
stiffness. The best fit line was only in close agreement with the measured longitudinal strains for
pressures below approximately 250 bar. This is the region where the five vessels showed a linear
longitudinal strain behavioural response. Therefore, damage seemed to commence at a later stage for
the 4 mm vessels than the 2 mm vessels. This was probably because they were thicker and therefore,
stronger than the 2 mm vessels.
Alternatively, no significant decrease in longitudinal stiffness was observed in the first set of 4 mm
CFRP pressure vessels as seen in Figure 5.76. This was likely because the highest pressure reached for
the first set of 4 mm vessels was 220 bar. That failure pressure fell short of 250 bar which is when the
damage was observed to commence for the second set of 4 mm CFRP pressure vessels.
Figure 5.84: Graph of longitudinal strain vs pressure for five 4 mm vessels from the second set
In the hoop direction, the strain measurements for the five pressure vessels (see Figure 5.) exhibited
the same deformation behaviour and had the same linear trend for pressures below 280 bar.
-4000
-3500
-3000
-2500
-2000
-1500
-1000
-500
0
0 50 100 150 200 250 300 350 400 450
Lon
gitu
din
al S
trai
n [
με]
Pressure [bar]
2nd set - 4 mm vessels - Longitudinal Strain vs Pressure
1 2 3 4 5 Best fit line

113
Figure 5.85: Graph of hoop strain vs pressure for all five 4 mm vessels from the second set
Beyond 280 bar, the gradients started to increase albeit gradually which suggested the onset of
damage of the CFRP tube. Similar to the graph of the longitudinal strains for the 4 mm vessels (in
Figure 5.84), the data points for the pressure vessel agreed more with the predicted strain data below
this point. The stiffness was observed to start becoming non-linear at a higher pressure in the hoop
direction than the longitudinal direction. Therefore, in both cases of the second set of 2 mm and 4
mm CFRP vessels, the stiffness started to decrease (or the onset of the damage occurred) at a higher
pressure for the hoop direction than the longitudinal direction.
5.3.2.3 Discussion of the second burst test results Failure pressures of the 2 mm pressure vessels
Achieving bursting or failure of the CFRP tube section for all 2 mm CFRP vessels meant that the
adhesive layer on the end caps was able to withstand the shear force exerted on them because of the
internal pressure. The predicted burst pressures (from Table 5.24) for the 2 mm CFRP pressure vessels
were all found to be lower than the tested results. The Tsai-Hill and Tsai-Wu failure theories were
chosen as the references to which the actual burst strength values of the vessels were compared. This
was because of their expected higher levels of accuracy in predicting the burst strengths of CFRP
cylindrical pressure vessels as compared to the Maximum Stress and Strain failure theories [3, 4, 105].
The burst pressures predicted by the Tsai-Hill and Tsai-Wu failure theories (i.e. 160 bar and 169 bar
respectively) were very conservative in comparison with that minimum observed burst pressure value
of 330 bar. This result established that the initial strength property estimates (σ1 and σ2) of the CFRP
were too low as suspected in section 5.1.2.
0
1000
2000
3000
4000
5000
6000
7000
8000
0 50 100 150 200 250 300 350 400 450
Ho
op
Str
ain
[μ
ε]
Pressure [bar]
2nd set - 4 mm vessels - Hoop Strain vs Pressure
1 2 3 4 5 Best fit line

114
While the CFRP tube section cracked for most of the tested 2 mm CFRP vessels, one of them (i.e. Vessel
4) failed due to delamination at the adhesive layer to CFRP tube wall interface after having initially
experience bulging of the type shown in Figure 5.79. The bulging could only have been possible if the
CFRP tube section was expanding in the hoop direction significantly more than the aluminium end
cap. Because the portions of the CFRP tube at both ends were bonded to the adhesive layer on the
end caps, they could not deform as much as the CFRP tube portion in between the end caps. This
resulted in the adhesive layer being put under tension at its interface with the internal wall of the
CFRP tube. The tensile load could then have caused the inter-laminar failure of the CFRP tubes
laminate structure thereby resulting in the thin layer of CFRP being stuck on the adhesive layer (see
Figure 5.79).
Failure pressures of 4 mm pressure vessels
The predominant failure mode for the second set of 4 mm CFRP pressure vessels was shear failure on
the end cap to adhesive layer interface. As such, the pressure at which the CFRP tube would burst was
not reached. This established that the 4 mm CFRP tubes would burst at a mean pressure of not less
than 429 bar which meant that they were also stronger than initially predicted. The mean failure
pressure of 429 bar was indicative of the pressure at which the adhesive bond layer failed since it was
predominant failure mode. The shear stress on the SpaBond 340 LV adhesive at that pressure was
calculated to be 12.8 MPa (Table 5.25). This was only 0.5 MPa smaller than the mean shear strength
value from the third end cap shear tests. This minor difference may have been because there was an
additional hoop stress acting on the CFRP tubes that were burst tested while there was only a pure
shear load for the end cap adhesive shear tests.
Strain measurements from the second set of burst tests
For the second set of CFRP pressure vessels, it was observed that the strain response for the CFRP
tubes was initially linear showing a constant stiffness up to a certain pressure. Then it was observed
that the stiffness started to decrease with the responses becoming increasingly non-linear. For the 2
mm CFRP vessels, the decrease in stiffness started at a pressure of approximately 160 bar and it
occurred at about 250 bar for the 4 mm CFRP vessels. The decrease in stiffness could have been caused
by the onset of damage in the CFRP tubes’ laminate structures which could have come in the form of
localised fibre breakage, cracking due to matrix failure transverse to the fibre direction on a
microscale, etc. From the point the damage commenced, as the pressure increased, the stiffness
continued to decrease showing more damage occurring in the CFRP tubes until they failed. It should
be noted that damage in both 2 mm and 4 mm CFRP tubes started at an earlier pressure in the
longitudinal direction than in the hoop direction. This strongly suggested that both types of CFRP tubes
were stronger in the hoop direction than in the longitudinal direction. Since the winding angle was
50o, it followed that the fibres were more skewed towards the hoop direction than the longitudinal
direction. This would have meant that the CFRP tube had a higher strength to stress ratio in the hoop
direction than in the longitudinal direction.
It should be noted that the mean value of the determined maximum design pressure of the 2 mm
vessels (157 bar) was within the linear region of the longitudinal strain vs pressure graph in Figure
5.82. It was therefore reasonable to conclude that the maximum design pressure for the 2 mm vessels
was safe enough to reach without compromising the safety of the vessel. For the 4 mm vessel, the
maximum design pressure from the burst test was 191 bar which also fell within the linear region of
the longitudinal strain vs pressure plot in Figure 5.84. Therefore, it was also a safe pressure to reach
for the 4 mm CFRP vessel to reach. However, the maximum design pressure of 191 bar was derived
from predominant shear failures of the end caps and not the bursting of the CFRP tubes. The damage

115
in the 4 mm CFRP tubes only started occurring at approximately 250 bar suggesting that the 4 mm
CFRP pressure vessels could operate safely to a higher pressure than the one determined from the
burst tests. This decrease in stiffness behaviour was not observed at all in the first set of 4 mm vessels.
They only exhibited a linear deformation behaviour probably because they all failed at pressures
below 220 bar.
5.4 Hydraulic proof test One of each of the 2 mm and 4 mm CFRP pressure vessels were constructed and underwent hydraulic
proof tests as per the procedure detailed in section 4.3.2. The purpose of the test was to assess the
reliability and the ability to retain pressure for the two types of vessels.
5.4.1 Results The requirements for the proof test necessitate that the pressure of the vessel be held at the proof
pressure for at least 30 minutes before dropping and holding it at the design pressure for a further 10
minutes. However, the tests were performed for a longer duration of just over 24 hours. The vessels
were kept at their respective proof pressures for 30 mins before being dropped and left at the
respective design pressures for the remaining 24 hours. The pressure was kept at the respective design
pressures for 24 hours to assess the ability of the rubber liner to prevent leakage of water over a
longer period than the 10 minutes that were suggested. Table 5.15 summarises the results of the proof
test. It should be noted that the design pressures for both types of pressure vessels were the minimum
values determined from the second set of hydrostatic burst tests i.e. 147 bar for the 2 mm vessel
(Table 5.23) and 182 bar for the 4 mm vessel (Table 5.25).
Table 5.27: The respective design and proof pressures of the 2 mm and 4 mm CFRP pressure vessels
Type of pressure vessels Maximum Design Pressure
[bar]
Proof pressure [bar]
2 mm vessel 147 184
4 mm vessel 182 228
No damage or leaks were observed in either type of vessels at the proof and design pressures. This
indicated that the vessels were able to retain pressure and were reliable based on that criteria. After
cutting the 2 mm CFRP pressure vessel in half along its axis as shown in Figure 5.87, there were no
visible signs of damage on the rubber liner.
Figure 5.86: Photograph of the cross section of a 2 mm CFRP pressure vessel used during the hydraulic proof tests
Rubber liner Top end cap Bottom end cap

116
5.4.2 Discussion Both types of vessels managed to hold test and working pressures without failure, leakage or any
visible permanent deformation. Hence, both vessels successfully passed the test which meant the
rubber liner and the end caps were able to sufficiently seal the pressure vessels thereby preventing
the leakage of water.
5.5 Long term gas leak testing The objective of the long-term gas leak test was to assess the ability of the CFRP pressure vessel to
prevent leakage of a gas at the design pressure i.e. testing for long periods with a compressible fluid.
5.6.1 Results Before the first leak tests, the 2 mm and 4 mm CFRP pressure vessel specimens had to be
hydrostatically proof tested to check if they could safely maintain the respective design pressures.
These proof tests described previously were performed successfully without any leaking or failure
occurring. Initially, a gas leak test with only the steel pipe network setup was also performed for a
period of 120 hours (5 days). This was to ensure that they were no leaks from the joints or pipes that
would interfere with the leak test for its duration when the CFRP pressure vessels were connected
instead. The leak tests were then performed on four vessels at their respective design pressures
according to the stipulated requirements (see section 4.3.3.1). The leak test results are summarised
as shown in Table 5.28.
Table 5.28: Long term gas leak test result for the CFRP pressure vessels
Type of vessel
Vessel Number
Test Number
Duration of test
[hours]
Leak test pressure [bar]
Average leak rate
[bar/hour] Initial reading
Final Reading
2 mm vessels
1 1 48.75 146 130 0.328
2 0.72 144 130 19.4
2 1 46 146 136 0.217
2 0.17 146 130 94.1
4 mm vessels
1 1 65 172 100 0.947
2 8.45 172 0 20.3
2 1 17.1 160 104 3.27
2 0.42 174 152 52.4
It was observed that for all four vessels, there was leaking which varied between 0.328 bar/hour to
3.27 bar/hour for the first test run. A soapy water solution had been applied on both ends of all vessels
as well as on the CFRP tube section prior to the start of the test. In all cases, bubbling was observed
and appeared to be more concentrated on the adhesive layer between one of the end caps and the
internal CFRP tube wall as shown in Figure 5.87.

117
Figure 5.87: Photograph showing bubbling of the soapy water solution at one of the ends of a CFRP pressure vessel
However, significantly higher leak rates of at least 19 bar/hour were observed for the second test runs
(i.e. tests with number 2 from Table 5.28). The bubbling for those second leak test runs were more
aggressive indicating the leak rates were also higher. It should be noted that there was no obvious
deformation or movement of end caps observed during and after the testing.
Three of the four vessels were cut in half in a direction parallel to the axis of the CFRP cylindrical
pressure vessel for visual inspection. An example is the cut 2 mm CFRP pressure vessel shown in Figure
5.88. What is apparent is the bubbles (white spots) of trapped air underneath the rubber liner in this
case. They appeared to be concentrated near the bottom end cap where the bubbling was observed.
Figure 5.88: Photograph of the cross section of a 2 mm CFRP pressure vessel used during the long term leak tests
The rubber liner did not seem obviously damaged at that location, however, air must have leaked
through it on its way to the outside of the vessel past the two O-rings and the adhesive layer. It was
observed the portion of the rubber liner on the interface between the end cap and the CFRP tube
appeared thinner as if it had been stretched causing it to weaken as shown in Figure 5.89.
CFRP tube
Bubbling of the
soapy water
solution on one
of the end caps
Bubbles of trapped air
underneath the rubber liner Bottom end cap Top end cap Interface
between the end
cap and the CFRP
tube

118
Figure 5.89: Photograph showing the region near the bottom end cap in greater detail
This weakening of the rubber liner could have caused it to be porous which likely allowed more air
molecules to escape through. It should be noted that the weakening of the rubber liner was not
observed in a similar 2 mm CFRP pressure vessel that was proof tested with water (see Figure 5.86).
5.6.2 Discussion of the results The use of soapy water allowed for the identification the source of the leaking. In all the test runs, the
sources of leaking were at the ends of each vessel past the adhesive layer as shown in Figure 5.87. No
bubbling was observed from the CFRP tube section between the two end caps. This does not mean
that there was no leaking emanating from the CFRP tubes of each vessel as leaking may have been
taking place at a sufficiently slow rate that no discernible bubbling could be observed.
The portion of the rubber liner on the interface between the end cap and the CFRP tube appeared
thinner and weakened. The cause of this may have been some of air that did not escape through the
gap between the end cap and the CFRP tube but remained and likely peeled off the rubber liner from
the tube wall before forming trapped bubbles underneath it as shown in Figure 5.88. As the vessel
was being pressurized, more trapped air seemed to build up and then proceeded to peel off the liner
from the CFRP tube wall in several locations to form those bubbles or trapped air pockets. The trapped
air pockets appeared to have stretched the rubber liner in those locations thereby weakening it. The
tensile strength of the VytaFlex 60 series rubber is approximately 6 MPa which is less than half of the
design pressures for the two vessels tested (14.7 MPa and 18.2 MPa). Therefore, it was probable that
the exposed rubber liner was stretched beyond its elastic limit. The bubbles were more concentrated
near the interface between the CFRP tube and the end cap where bubbling was observed (see Figure
5.88). This suggested that at that the interface was the most likely location where most of the air
escaped past the rubber liner. This was reasonable to assume as it was established that the CFRP tube
expanded (although slightly) more in the hoop direction than the end cap which would have exposed
that interface as shown in Figure 5.90.
Bottom end cap Weakened rubber liner at the interface
between the end cap and the CFRP tube CFRP tube

119
Figure 5.90: Schematic illustrating what likely occurred at the interface between the end cap and CFRP tube during the long-term gas leak test
The stretching effect likely weakened or split the rubber liner sufficiently to let the pressurised air to
escape. The incompressible nature of water may have protected the rubber liner once water had
leaked through the liner (into the gap shown in Figure 5.90) during the hydraulic proof tests by
preventing further damage. This may explain why no leaks were detected during the proof tests.
Alternatively, because some of the air managed to bypass the two O-rings and the adhesive layer to
the outside, it suggested the two O-rings were also ineffective in sealing the vessel.
It was observed that for each vessel’s second leak test run, the average leak rates were significantly
higher (see Table 5.28). This trend was the same for all four vessels tested although the average leak
rate values varied considerably. Therefore, it was possible that the portion of the rubber liner could
have been further weakened after pressurization during the second test runs. It was possible that the
holes/gaps in the rubber liner could have been enlarged as a result.
According to a report by Bigelow [129], the maximum acceptable leakage rate for a 350 bar hydrogen
pressure vessel is 0.025 g/hour/kg of Hydrogen gas. Considering the lower design pressures of the two
types of vessels and their volumes while assuming that hydrogen is an ideal gas, the maximum
acceptable leakage rate was determined to be approximately 0.00455 bar/hour for both vessels (see
Appendix D for detailed calculations). However, the average leak rates were at least 50 times higher
than this value. Furthermore, air which has many larger molecule gases than hydrogen (e.g. oxygen
and carbon dioxide). It was therefore reasonable to assume that if a small molecule gas like hydrogen
or helium gas was used, the average leak rates would be higher. It could then be reasonably concluded
that the rubber liner was ineffective as the primary sealant in preventing leakage of air out of the
vessels.
5.7 Analysis of CFRP pressure vessel design based on experimental
results This section describes the process that was followed in critically analysing the experimental results in
relation to the how the CFRP pressure vessel was designed. The second objective would also be to
relate the design assumptions with the actual behaviour of the CFRP pressure vessel observed through
various tests.
End cap
Rubber liner
(Red)
CFRP tube
Exposed rubber liner at the interface
between the end cap and CFRP tube
Gap between CFRP
tube and end cap

120
5.7.1 CFRP material properties The CLT based calculations used the initial material stiffness and strength property values of the CFRP
tube that were determined from the tensile tests in section 5.1. This section aims to describe how
those initial property values were updated using the hydrostatic burst test data.
5.7.1.1 Stiffness properties
First set of CFRP vessels
The CLT based calculations in section 3.1.3 used the initial material stiffness property values (E1 and
E2) from the tensile test data. The strain values that were measured during the hydrostatic burst test
for the first set of vessels allowed for those initial estimated stiffness properties to be compared with.
Therefore, the elastic moduli values were adjusted such that the CLT based equations would give
strain values similar to what was given by the best fit lines for the longitudinal and hoop directions
(from Figure 5.76 and Figure 5.77 respectively). This step was performed for both the first and second
set of CFRP pressure vessels. The elastic moduli values that were found to give the same average
deformation response in the hoop and longitudinal direction as the first set of 4 mm CFRP tubes are
shown in Table 5.29.
Table 5.29: First set of the updated stiffness property values for the CFRP tube
Property Symbol Initial Estimate Values
Updated Values
Longitudinal Elastic Modulus E1 109 GPa 140 GPa
Transverse Elastic Modulus E2 6 GPa 9 GPa
These updated longitudinal and transverse elastic moduli were higher than the initial estimates. This
shows that the initial stiffness values were conservative. Therefore, the first set of three 4 mm CFRP
pressure vessels were stiffer than designed in both orientations i.e. in the fibre direction and in the
direction transverse to the fibres. The first set of 4 mm CFRP tubes used in the hydrostatic burst test
were constructed using a standard industrial automated filament winding process. This meant that
manufacturing inconsistencies and errors should have been kept to a minimum. However, this data
that was used to update the stiffness values was derived from only three CFRP pressure vessel
specimens. To improve the data, strain measurements were taken from the second set of tested CFRP
vessels.
Second set of CFRP vessels
The linear portions of the strain vs applied internal pressure graphs for the second set of 2 mm and 4
mm CFRP vessels using Figure 5.82 to Figure 5. were used in determining the second set of updated
stiffness values for the CFRP tube’s material. This information is shown in Table 5.30 where it is
compared with the first set of updated stiffness values.
Table 5.30: Second set of updated stiffness property values of the CFRP tubes
Property Symbol First Set of Updated Values
Second Set of Updated Values
Longitudinal Elastic Modulus E1 140 GPa 130.2 GPa
Transverse Elastic Modulus E2 9 GPa 10 GPa
There were small differences in the two elastic moduli values between the first and second update
likely because the CFRP tubes were derived from different tubes. This may have been partially
responsible for the slight variation in the values. For the linear portion of the strain responses of the

121
vessels, these updated stiffness properties as well as the CLT calculations could be used to predict the
behaviour of any CFRP tube with different fibre winding angles, wall thicknesses, etc for the same type
of CFRP material, laminate structure and manufacturing process.
5.7.1.2 Strength properties
The second set of 2 mm CFRP pressure vessels were the only vessels that experienced failure of the
CFRP tube section during the burst tests. Therefore, they provided the only set of results that could
be used to determine the actual strength property values that would update the initial estimated
values from the tensile tests. Because, the UTS for the direction transverse to the fibres was suggested
as the most conservative value in the design chapter, it was the property that was primarily adjusted
until the predicted burst pressures for the Tsai-Hill and Tsai-Wu failure theories were approximately
equal to 330 bar. The burst pressure of 330 bar was chosen because it was the minimum burst
pressure observed for all 2 mm pressure vessels from Table 5.23 The burst pressures were calculated
again using the failure theories’ equations and the local stresses calculated using the CLT equations to
give the new predicted burst failure pressures as shown in Table 5.31.
Table 5.31: Second predictions of burst pressures for the 2 mm CFRP vessels using updated strength properties
Failure theory Predicted Burst Pressure [bar]
Actual Burst Pressure [bar]
Maximum Stress 415 330 Maximum Strain 820
Tsai-Hill 324
Tsai-Wu 346
The updated strength properties that resulted in these new set of predicted pressures are shown in
Table 5.32 and were compared with the initial strength property values from the tensile tests:
Table 5.32: Updated strength property values based on the 2 mm CFRP vessel’s burst test compared to the initial values from the tensile tests
Property Symbol Initial values [MPa]
Updated values [MPa]
Ultimate Tensile Strength in the 0 O direction σ1-uts 1357 1650
Ultimate Tensile Strength in the 90 O direction σ2-uts 14.8 50
In both loading directions, the initial strength property values proved to be lower especially in the
direction transverse to the fibres where the updated value of the UTS was more than three times the
initial value. The updated values were also found to be similar to the values for typical standard CFRP
composites with similar constituent materials e.g. 1500–2000 MPa for σ1-uts and 50–65 MPa for σ2-uts
according to the sources [3-4, 81, 95].
Although none of the 4 mm CFRP tubes burst, their predicted burst pressures could now be estimated
using these updated strength values. It was assumed that the 2 mm CFRP tubes had essentially the
same strength properties as the 4 mm CFRP tubes as they were manufactured using the same process,
type of fibres and epoxy resin at the same time. Using the updated strength properties, the predicted
burst pressures for the 4 mm CFRP tubes are listed in Table 5.33.

122
Table 5.33: Predicted burst pressures for the 2 mm CFRP vessels using the updated strength properties
Failure theory Predicted Burst Pressure [bar]
Maximum Stress 606
Maximum Strain 1150
Tsai-Hill 584
Tsai-Wu 624
With the exception of the Maximum Strain failure theory prediction, the other three failure theories
predicted a burst failure pressure in the range between 584 bar and 624 bar for the 4 mm CFRP tube.
Thus, considering burst failure of the CFRP tube section, the maximum design pressure for the 4 mm
CFRP pressure vessel would be between 259 bar and 277 bar. Alternatively, the longitudinal strain vs
pressure graph for the second set of 4 mm of CFRP pressure vessels suggested that the 4 mm tubes
started sustaining damage at approximately 250 bar. Therefore, to obtain a maximum design pressure
of 250 bar, this corresponds to a burst pressure of approximately 563 bar for the 4 mm CFRP pressure
vessel which was reasonably close to and consistent with the predictions of the three failure theories.
5.7.2 End cap design The end cap was designed mainly to close off the ends of the CFRP tube and form a closed pressure
vessel. To bind them to the two ends of the internal wall of the CFRP tube required an adhesive
(SpaBond 340 LV) and it had to be sufficiently strong in shear to be able to resist the load due to the
pressure. To determine the actual shear strength of the adhesive, end cap adhesive shear tests were
performed. All three end cap adhesive shear tests (section 5.2) indicated that shear failure only
occurred at the interface between the end cap and the adhesive layer. This was not observed in two
of the hydrostatic burst tests where the pressure vessels experienced shear failure and delamination
on the interface between the adhesive layer and the CFRP tube.
For the end cap adhesive shear tests, the adhesive layer was loaded to cause pure shear which led to
failure at the interface between the end cap and the adhesive layer. However, for the burst tests, the
adhesive layer experienced multiple loads including expansion of the CFRP tube in the hoop direction
in addition to the shearing force due to the internal pressure. In the hoop direction, the CFRP tube
expanded more than the end cap. This subjected the adhesive layer to a tensile load which is what
eventually caused some CFRP delamination as illustrated by Figure 5.79. Initially during the design
phase, it was assumed that because the CFRP tube was significantly stiffer than the aluminium end
cap, the end cap would always be “pressed up” against the internal wall of the CFRP tube because of
the hemispherical dome.
5.7.3 Rubber liner In the hydraulic proof tests, no leaking of water was observed for both the 2 mm and 4 mm CFRP
pressure vessels for a period of approximately 24 hours. Therefore, this meant that the rubber liner
was successful as the primary seal in preventing water from leaking to the outside of the vessel(s).
However, for the long-term gas leak tests, all four vessels tested showed signs of leaking meaning the
rubber lining was unable to prevent pressurized air from leaking to the outside of the vessel. The
rubber liner showed signs of weakening at the gap/interface between the end cap and the CFRP tube
as it was thinner which probably made it possible for more air to escape through. The differential
expansion of the end cap and the CFRP tube was identified as the likely location where most of the air
escaped through the liner. The second test runs may have exacerbated the damage on the rubber

123
liner resulting in the drastic increase in leak rates of (from Table 5.28). Therefore, the rubber liner was
likely only suited for an incompressible fluid like water rather than a compressible fluid such as air.
5.8 Optimisation of the filament winding angle In the design chapter, the optimal filament winding angle was determined by using the Maximum
Stress failure theory for laminated composites. Some of the reasons it was the chosen failure theory
was because it was a simple method to apply. Because the initial estimate of the strength property
value transverse to the fibres was very low, it was assumed that it was probably the most likely mode
of failure for the CFRP pressure vessel. The optimum filament winding angle that would result in the
highest failure strength for the CFRP tube was 52o based on the Maximum Stress failure theory.
Alternative failure theories including Tsai-Hill and Tsai-Wu failure theories are deemed as more
accurate in predicting the burst failure pressure of the CFRP tube section of the pressure vessel
according to several literature sources [3, 106]. After determining the validated strength property
values from the burst test results, the Tsai-Hill and Tsai-Wu failure theories were then used to
determine the optimum filament winding angle for the CFRP pressure vessel by plotting a graph of the
anticipated burst pressure against the winding angle as shown in Figure 5.91. The Maximum Stress
and Strain failure theories were also plotted to provide a comparison. Since the burst failures of the
CFRP tube section was observed to occur on the 2 mm thin pressure vessels, the graph in Figure 5.91
is based on those results. The optimum winding angle differed according to each of the failure theories
though they were all in agreement that the optimal winding angle lay between 50o and 55o. The
Maximum Strain failure theory predicted an optimal winding angle of 51o. The predicted burst
pressure with this method is almost 1000 bar. This was considered unreasonable and disagreed with
the observed burst pressures in the range 330-380 bar for the 2 mm thin vessels. To a lesser extent,
the Maximum Stress failure theory was also insufficiently conservative in burst pressure predictions
though it also predicted an optimal winding angle of approximately 52o.
Figure 5.91: Graph comparing the expected burst pressures for various filament winding angles using the four failure theories for the 2 mm pressure vessel
0
200
400
600
800
1000
1200
30 35 40 45 50 55 60 65 70 75
Bu
rst
Pre
ssu
re [b
ar]
Winding angle [degrees]
2 mm vessel - Burst Pressure vs Winding Angle
Max Stress Max Strain Tsai-Hill Tsai-Wu

124
The Tsai-Hill and Tsai-Wu failure theories were closely matched as they predicted optimal angles in
the narrow band between 53o and 54o with the respective predicted burst pressures being also within
15% of each other. The optimal winding angle results are summarised in Table 5.34.
Table 5.34: Optimal winding angles for the different failure theories based on the 2 mm thin pressure vessels
Failure theory Optimal winding angle Predicted Peak Burst Pressures [bar]
Maximum Stress 52o 578
Maximum Strain 51o 1002
Tsai-Hill 53o-54o 411
Tsai-Wu 54o 470
Based on the predictions of the latter two failure theories, any winding angle from 53o to 55o, should
result in the highest possible burst pressures. According to Shultz et al [106], the Tsai-Hill predicts an
optimal winding angle of 52.5o while the Maximum Stress and Strain failure theories both predicted
optimal winding angle of 50.5o. These angles were in close agreement with those from Table 5.34.
The predicted peak burst pressures are ideal but more often than not, cannot be matched accurately
in practice. As with most manufacturing processes, there is an associated tolerance value that specifies
the upper and lower bounds within which the desired (property) values is acceptable. The filament
winding process used to manufacture the cylindrical CFRP tubes is no different. According to the curve
for the Maximum Stress failure theory in Figure 5.91, an accuracy of approximately ±1o is required for
the predicted burst pressures to be at least 88% of the peak value. For the Maximum Strain theory,
the accuracy would also have to be ±1o if the burst pressure is to be within 15% of the peak pressure.
However, an accuracy of approximately ±2o is required for the predicted burst pressures to be at least
90% of the peak value when it comes to curves for the Tsai-Hill and Tsai-Wu failure theories. The latter
two failure theories require less accuracy for the winding angle while still resulting in a predicted
pressure within 10% of the peak value. This is reasonable and more feasible for an automated filament
winding process. Again, supporting the use of the Tsai-Wu and Tsai-Hill failure theories as preferred
methods for calculating winding angles and burst pressures.
5.9 Cost of the novel CFRP pressure vessel The costs incurred in purchasing the raw materials essential for the manufacture of the 2mm CFRP
pressure vessels in comparison with Type IV 350 and 700 bar storage vessels are detailed in Appendix
E.
5.10 Summary of the results and discussion The tensile tests were performed and produced in-plane tensile property values that were significantly
lower than the expected theoretical property values (i.e. from micromechanics) of the CFRP material
in both the 0o and 90o loading directions. In addition, these property values were also very low
compared to reported values from literature. The reasons for this were traced back to the
manufacturing method of the CFRP tensile test specimens. These low in-plane tensile property values
were still used in the initial design of the CFRP tube as it was reasoned that they would give a
conservative design.
The three end cap adhesive shear tests all indicated mean shear strength values less than half of the
manufacturer’s reported data for SpaBond 340 LV. Visual inspection of the adhesive layer post-testing
showed void formation in the first test. The second test’s mean shear strength value was

125
approximately 15.7% higher than that of the first test. This improvement was attributed to the
absence of voids in the adhesive layer of the second test specimens. This meant the use of angled
holes which allowed for the direct injection of the adhesive into the bond area were a success.
However, there was a drop in the mean shear strength of about 10% from the second to the third test.
This result proved that knurling did not necessarily result in an increase in the bond shear strength
between the end cap and adhesive layer. However, the standard deviation as a percentage of the
mean is the lowest in the third test. From all tests, it was observed that shear failure occurred on the
adhesive layer to Aluminium end cap interface indicating that it was the limiting case.
The hydrostatic burst test was essential in determining the failure pressures of a pressure vessels and
the deformation behaviour of the CFRP tubes. There were three 4mm CFRP pressure vessels in the
first set and all failed at pressures in the range 136-220 bar due to either leakage or shear failure of
the adhesive bond. Therefore, none of these three vessels failed on the CFRP tube section. The second
set of vessels had five 2 mm and another five 4 mm CFRP pressure vessels all with end caps based on
the third design. The five 2 mm vessels predominantly failed due to bursting of the CFRP tube at a
mean pressure of 352 bar which was significantly higher than the predicted burst pressures from the
failure theories. This proved that the mechanical property values from the ASTM tensile tests were
too low. The other five 4 mm vessels failed principally due to shear failure on the adhesive layer to
end cap interface at a mean pressure of 429 bar. Therefore, this mean failure pressure value was
indicative of the pressure at which the bond on the adhesive layer to end cap interface would fail. This
translated to an applied shear stress value of 12.8 MPa which was consistent with the mean shear
strength value of 13.3 MPa from the third shear test. It was also established that the 4 mm CFRP tubes
would not fail at a mean pressure below 429 bar.
The results on the deformation behaviour of the 4 mm CFRP tubes from the first set of pressure vessels
showed a linear relationship between strain and applied pressure for both the hoop and longitudinal
directions. However, the strain measurements from the second set of CFRP pressure vessels showed
an initially linear relationship between the pressure and both types of strains until a certain pressure
value was reached. Beyond this pressure, the relationship became non-linear which translated to a
decrease in stiffness of the CFRP tubes. The start of the non-linear behaviour was possibly because
the CFRP tubes has started to sustain damage. The pressure at which the damage commenced was
approximately 160 bar for the 2 mm CFRP tubes and about 250 bar for the 4 mm CFRP tubes. The
maximum working pressures (determined from the failure pressure values) for the 2 mm and 4 mm
CFRP pressure vessels were lower than the pressures at which the damage commenced in the tubes
i.e. 147 bar and 182 bar respectively. This suggested it was safe to operate both 2 mm and 4 mm CFRP
pressure vessels at these working pressures.
For the hydraulic proof tests, new 2 mm and 4 mm CFRP pressure vessels were constructed. Both
types of vessels managed to retain pressure for just over 24 hours without failure, leakage or any
visible permanent deformation. This meant the rubber liner and the end caps were able to sufficiently
seal the pressure vessels thereby preventing leakage.
Long-term leak tests were performed at the respective maximum working pressures of the two types
of vessels. Leaking was observed in all vessels that were tested as there was a decrease in the pressure
over time. The occurrence of bubbling of soapy water determined that the end caps were the source
of the leak. Leaking was only possible if the air had passed through the rubber liner first before also
passing the two O-rings as well as between the adhesive layer the CFRP tube before escaping the
vessel. The observed average leak rates were at least 50 times higher than the maximum acceptable
leak rate for a typical 350 bar hydrogen gas storage pressure vessel. Air has many larger molecule
gases than hydrogen. Therefore, it was reasonable to conclude that the observed average leak rates

126
would even be higher if a small molecule gas like hydrogen gas was used. To that end, the rubber liner
as well as the O-rings were ineffective in preventing leakage of air out of the pressure vessels.
The results of the hydrostatic burst tests allowed for the validation of the in-plane property values
determined from the ASTM tensile tests. The strain measurements were essential in updating the in-
plane tensile stiffness property values i.e. E1 and E2. Furthermore, the burst pressure values (from the
2 mm CFRP pressure vessels) were essential for updating the in-plane tensile strength values i.e. σ1-
uts and σ2-uts. The updated in-plane tensile stiffness and strength property values proved that the
values from the tensile tests were too low.

127
6. Conclusions and recommendations
6.1 Conclusions This research work initially set out to investigate the feasibility and suitability of the novel, low-cost
CFRP pressure vessel concept for storing high pressure hydrogen gas for HFC applications. This
involved designing, manufacturing and assembling the components that made up the pressure vessel.
The CFRP pressure vessels were tested using various pressure tests to assess their strength, reliability
and leak-tightness. Based on the results of these tests presented and discussed in the previous
chapter, the CFRP pressure vessel design was determined to not be feasible for gas storage with the
main issues being the end cap design and the rubber liner used. However, other important conclusions
were drawn from the various tests performed. For instance, the hydrostatic burst tests provided an
innovative, convenient and quick means to determine some of the material properties of the CFRP
material without needing to perform comprehensive material characterisation tests which are costly
and time-consuming. The hydrostatic burst tests also provided crucial information with regards to the
deformation behaviour of the CFRP tubes. This information would be helpful in designing similar
filament wound CFRP tubes to be used in other applications. Other conclusions that were drawn
include the following:
6.1.1 End cap The end caps were designed under the assumption they would deform more than the CFRP
tube in the hoop direction because of the hemispherical dome geometry and thin walls.
However, the CFRP tubes expanded more in the hoop direction as noted from the hydrostatic
burst tests (see Figure 5.16). This was what most likely caused the two observed cases of
failure due to delamination at the adhesive layer to CFRP tube wall interface as resulted in a
tensile load on the adhesive layer which then pulled off a layer of the internal wall of the CFRP
tube. Therefore, it was likely the case that the aluminium end cap was stiffer than initially
hoped. Alternatively, it could also have been that the end cap was too thick in the sections
close to the hemispherical dome where the pressure acted such that the end cap’s
deformation in the hoop direction was not enough to cause it to be pressed up against the
CFRP tube internal wall.
The use of a double O-ring design in the end caps for the second set of CFRP pressure vessels
resulted in no water leaks during burst and proof tests while the use of one O-ring resulted in
one vessel experiencing leaks for the first set of vessels. This proved that the use of two O-
rings was more effective than using one O-ring.
The mean shear strength of the SpaBond 340 LV adhesive layer interface with the end cap was
established to be approximately 13 MPa during burst testing and 13.3 MPa during the third
end cap adhesive test. The second adhesive application method and knurling were proven to
give good and consistent results.
The shear failure at the end cap to adhesive layer interface was manifested as a gradual
movement of the end cap because of the pressure. This is considered safer from a design point
of view as it does not result in the end cap shooting out as a projectile.
6.1.2 CFRP tube The deformation behaviour for the CFRP tube sections of the pressure vessel was initially
linear until a certain pressure before sustaining some damage which manifested itself as a
decrease in stiffness. The decrease in stiffness occurred earlier in the longitudinal direction

128
than in the hoop because the CFRP tubes were less stiff in the longitudinal direction. The linear
strain response for the 2 mm and 4 mm CFRP tubes was observed until about 150 bar and 250
bar respectively. Therefore, those pressures represented the upper limit for design pressures
that the 2 mm and 4 mm CFRP pressure vessels could be operated at without the onset of
damage to the CFRP tubes.
The 2 mm CFRP tubes burst at a mean pressure of 357 bar. The 4 mm CFRP tubes could not
be caused to burst but it was established that they will not burst at a pressure below 450 bar.
However, the revised burst pressure calculations suggest that the 4 mm CFRP tubes would fail
at pressures between 584 bar and 624 bar based on the Tsai-Hill and Tsai-Wu failure theories.
The optimal filament winding angle for maximizing this CFRP pressure vessel design’s strength
was determined to be approximately 53o±1o using the Tsai-Hill and Tsai-Wu failure theories.
6.1.3 Rubber liner The method for applying the rubber liner took at least 16 hours for a single layer with a
thickness of between 0.20-0.25 mm primarily because of the curing time of the rubber. Four
layers of the rubber liner needed at least 3 days to apply and cure. This process was therefore
not commercially viable for mass producing similar CFRP pressure vessels as it takes too long.
The thin rubber liner was proven to be water-tight as there were no leaks observed during
proof tests of both the 2 mm and 4 mm CFRP pressure vessels in single tests for a period of
approximately 24 hours.
The thin rubber liner was however not air-tight as there were leaks that were observed during
the long-term gas leak tests. Air contains some gas molecules considerably larger than smaller
molecule gases like hydrogen. Therefore, it is reasonable to conclude that if the same rubber
liner (i.e. VytaFlex 60 series) was used when leak testing with hydrogen gas, the leak rates
would even be higher.
The VytaFlex 60 series rubber liner was used to prevent the air-water mixture pressurised and
maintained at 100 bar in the Ascension III water rocket for a duration of ten minutes before
launch. This was a short-term application of the CFRP pressure vessel. In comparison, the air
leak tests were performed for up to 72 hours and they proved that the CFRP pressure vessel
concept with the rubber liner could not retain pressure suitably over that long period.
6.2 Recommendations Although the CFRP pressure vessel design was determined to not be feasible for gas storage, certain
areas were identified that could be addressed in future works as highlighted in this section. The
following recommendations are made for future work pertaining to this research work:
6.2.1 End cap design To ensure that the end cap deforms at a rate at similar (or higher) than that of the CFRP tubes in the
hoop direction, the following options can be explored:
Use of a less stiff material for the end caps that would deform significantly more than
Aluminium 6082-T6 or the CFRP tube material for the same applied load. However, that
material should be able to sustain the load due to the internal pressure without deforming
permanently or fracturing. The material also should be inexpensive, easy to machine, readily
available and offer good chemical resistance. Examples of such materials could include PEEK
(polyetheretherketone), PBT (polybutylene terephthalate) and Nylon [130].

129
Alternatively continuing the use of aluminium for the end caps but alter the design of the end
cap such that it will have thinner sections on the end with the hemispherical dome. These
thinner sections would deform more in the hoop direction for the same applied load as
before. Analytical solutions and Finite Element Analysis (FEA) can be used to ensure that this
proposed end cap design will not yield or fracture.
6.2.2 CFRP tube The pressure at which the 4 mm CFRP tubes would fail was not determined because the shear
failure of the adhesive layer occurred first. The burst pressure was predicted to be between
584 bar and 624 bar. However, the 4 mm CFRP tubes will need to be hydrostatically burst
tested until the tube fails. This would likely require the end caps to have a sufficiently large
bond shear area and such that they will fail at pressures beyond at least 700 bar. New CFRP
tubes should be manufactured and tested to confirm this.
It was predicted the optimal filament winding angle that would maximize the burst pressure
was in the range 51o-54o using the four failure theories. To confirm that hypothesis, CFRP
tubes with winding angles of 50o, 51o, 52o, 53o, 54o and 55o should be made into pressure
vessels and be hydrostatically burst tested to failure.
6.2.3 Rubber liner The VytaFlex 60 series rubber lining failed to hinder the escape of pressurized air at the
respective design pressures of the 2 mm and 4 mm CFRP pressure vessels. Research into the
permeability of that rubber lining will need to be conducted independently to establish the
leak rate of air and possibly hydrogen gas over a given period of time as no such information
was readily provided by the manufacturer [115].
Using an alternative rubber liner with suitably low permeability rates, similar or lower mass
density and faster curing times than VytaFlex 60 series rubber. An example is Butyl rubber
which is easy to glue and ideal for applications where seals are required to be impermeable
to gases [131-132].

130
7. References [1] S. Swan, “Water rocket world record attempt - Engineering Project Report,” University of
Cape Town, Cape Town, 2015.
[2] A. G. Malan, “UCT Water Rocket World Record Documentary,” 2016. [Online]. Available: https://youtu.be/K8WP9QCa2co. [Accessed: 12-May-2017].
[3] A. K. Kaw, Mechanics of Composite Materials, 1st ed. United States of America: CRC Press LLC, 2006.
[4] D. Hull, An introduction to composite materials, 1st ed. Cambridge University Press, 1981.
[5] S. G. Swan and A. G. Malan, “Proposed PCT Patent Application,” P3127PC00, 2015.
[6] “Fuel Cells Information, Facts, and Technology.” [Online]. Available: https://www.nationalgeographic.com/environment/global-warming/fuel-cells/. [Accessed: 16-Oct-2018].
[7] “Hydrogen Fuel Cell Vehicles | Center for Climate and Energy Solutions.” [Online]. Available: https://www.c2es.org/technology/factsheet/HydrogenFuelCellVehicles#_edn11. [Accessed: 09-Aug-2017].
[8] “Fuel Cell Systems | Department of Energy.” [Online]. Available: https://www.energy.gov/eere/fuelcells/fuel-cell-systems. [Accessed: 08-Mar-2018].
[9] J. Garche and J. Ludwig, “Applications of Fuel Cell Technology : Status and Perspectives,” Electrochem. Soc. Interface, pp. 39–43, 2015.
[10] M. Alkin, ASME Boiler and Pressure Vessel Code - Section X - Fiber-Reinforced Plastic Pressure Vessels. New York: The American Society of Mechanical Engineers, 2015.
[11] Department of Labour-South Africa, “Pressure Equipment Standard - 17 July 2009.” 2009.
[12] “Fuel Cells | Hydrogenics.” [Online]. Available: http://www.hydrogenics.com/technology-resources/hydrogen-technology/fuel-cells/. [Accessed: 08-Mar-2018].
[13] “Fuel Cells | Department of Energy.” [Online]. Available: https://www.energy.gov/eere/fuelcells/fuel-cells. [Accessed: 08-Mar-2018].
[14] R. K. Ahluwalia, T. Q. Hua, and J. K. Peng, “On-board and Off-board performance of hydrogen storage options for light-duty vehicles,” Int. J. Hydrogen Energy, vol. 37, no. 3, pp. 2891–2910, 2012.
[15] D. Mori and K. Hirose, “Recent challenges of hydrogen storage technologies for fuel cell vehicles,” Int. J. Hydrogen Energy, vol. 34, no. 10, pp. 4569–4574, 2009.
[16] H. T. Hwang and A. Varma, “Hydrogen storage for fuel cell vehicles,” Curr. Opin. Chem. Eng., vol. 5, pp. 42–48, 2014.
[17] “Hydrogen Storage | Department of Energy.” [Online]. Available: https://energy.gov/eere/fuelcells/hydrogen-storage. [Accessed: 27-Jul-2017].
[18] “FCT - Fuel Cell Applications - Stationary.” [Online]. Available: http://www.fuelcelltoday.com/applications/stationary. [Accessed: 17-Mar-2018].
[19] “FCT - Fuel Cell Applications - Portable.” [Online]. Available: http://www.fuelcelltoday.com/applications/portable. [Accessed: 17-Mar-2018].

131
[20] “FCT - Fuel Cell Applications - Transport.” [Online]. Available: http://www.fuelcelltoday.com/applications/transport. [Accessed: 17-Mar-2018].
[21] S. W. Jorgensen, “Hydrogen storage tanks for vehicles: Recent progress and current status,” Curr. Opin. Solid State Mater. Sci., vol. 15, no. 2, pp. 39–43, 2011.
[22] M. R. Gardiner and A. Burke, “Comparison of hydrogen storage technologies: A focus on energy required for hydrogen input,” ACS Div. Fuel Chem. Prepr., vol. 47, no. 2, pp. 794–795, 2002.
[23] D. J. Durbin and C. Malardier-Jugroot, “Review of hydrogen storage techniques for on board vehicle applications,” Int. J. Hydrogen Energy, vol. 38, no. 34, pp. 14595–14617, 2013.
[24] H. Barthelemy, “Hydrogen Storage - Recent improvements and industrial prospectives,” Proc. Int. Conf. Hydrog. Safety, Sept. 11-13, pp. 1–19, 2013.
[25] N. L. Garland, D. C. Papageorgopoulos, and J. M. Stanford, “Hydrogen and fuel cell technology: Progress, challenges, and future directions,” Energy Procedia, vol. 28, pp. 2–11, 2012.
[26] H. Barthelemy, M. Weber, and F. Barbier, “Hydrogen storage: Recent improvements and industrial perspectives,” Int. J. Hydrogen Energy, vol. 42, no. 11, pp. 7254–7262, 2017.
[27] A. Kalanidhi, “Boil-off in long-term stored liquid hydrogen,” Int. J. Hydrogen Energy, vol. 13, no. 5, pp. 311–313, Jan. 1988.
[28] A. Zuttel, “Materials for hydrogen storage,” Mater. Today, vol. 6, no. 9, pp. 24–33, 2003.
[29] S. Satyapal, C. Read, G. Ordaz, N. Stetson, G. Thomas, and J. Petrovic, “Office of Hydrogen, Fuel Cells and Infrastructure Technologies 2 DOE (on assignment); retired, Sandia National Laboratory,” 2007.
[30] “Glossary | Publications and Other Information | BTSC.” [Online]. Available: https://brownfieldstsc.org/glossary.cfm?q=1. [Accessed: 14-Mar-2018].
[31] “Adsorption, Absorption and Desorption - What’s the Difference? Chromatography Today.” [Online]. Available: https://www.chromatographytoday.com/news/hplc-uhplc/31/breaking-news/adsorption-absorption-and-desorption-what39s-the-difference/31397. [Accessed: 07-Feb-2019].
[32] L. Schlapbach, L. Schlapbach, and A. Züttel, “Hydrogen-storage materials for mobile applications,” vol. 414, no. May 2016, pp. 353–358, 2001.
[33] K. L. Lim, H. Kazemian, Z. Yaakob, and W. R. W. Daud, “Solid-state Materials and Methods for Hydrogen Storage: A Critical Review,” Chem. Eng. Technol., vol. 33, no. 2, pp. 213–226, Feb. 2010.
[34] “Hydride | chemical compound | Britannica.com.” [Online]. Available: https://www.britannica.com/science/hydride. [Accessed: 14-Mar-2018].
[35] “DOE Technical Targets for Onboard Hydrogen Storage for Light-Duty Vehicles | Department of Energy.” [Online]. Available: https://www.energy.gov/eere/fuelcells/doe-technical-targets-onboard-hydrogen-storage-light-duty-vehicles. [Accessed: 24-Mar-2018].
[36] “Honda’s Hydrogen Fuel Cell Clarity Comes Loaded With Perks | WIRED.” [Online]. Available: https://www.wired.com/2017/04/honda-will-nearly-anything-get-hydrogen-car/. [Accessed: 16-Feb-2018].

132
[37] “Hydrogen Fuel Cell Car | Tucson Fuel Cell | Hyundai USA.” [Online]. Available: https://www.hyundaiusa.com/tucsonfuelcell/index.aspx. [Accessed: 16-Feb-2018].
[38] “Hydrogen Fuel Cell Car | Toyota Mirai.” [Online]. Available: https://ssl.toyota.com/mirai/fcv.html. [Accessed: 16-Feb-2018].
[39] K. Law, “Cost Analyses of Hydrogen Storage Materials and On- Board Systems Timeline Barriers Budget,” Cupertino, 2011.
[40] “Pressure vessel definition and meaning | Collins English Dictionary.” [Online]. Available: https://www.collinsdictionary.com/dictionary/english/pressure-vessel. [Accessed: 16-Oct-2018].
[41] “Pressure measurement: Compressible vs. incompressible media.” [Online]. Available: https://campaign.stssensors.com/blog/pressure-measurement-compressible-media. [Accessed: 28-Jan-2019].
[42] “Compressible Fluid - an overview | ScienceDirect Topics.” [Online]. Available: https://www.sciencedirect.com/topics/engineering/compressible-fluid. [Accessed: 28-Jan-2019].
[43] “Safety and Health Topics | Pressure Vessels | Occupational Safety and Health Administration.” [Online]. Available: https://www.osha.gov/SLTC/pressurevessels/index.html. [Accessed: 16-Oct-2018].
[44] J. Darlaston and J. Wintle, “Safety factors in the design and use of pressure equipment,” Eng. Fail. Anal., vol. 14, no. 3, pp. 471–480, 2007.
[45] “Tips for Pressure Vessel Design.” [Online]. Available: https://www.buckeyefabricating.com/post/tips-for-pressure-vessel-design. [Accessed: 16-Oct-2018].
[46] “The 3 Most Common Types of Pressure Vessels.” [Online]. Available: https://www.buckeyefabricating.com/post/the-3-most-common-types-of-pressure-vessels. [Accessed: 29-Jan-2018].
[47] “Types of Pressure Vessels.” [Online]. Available: http://www.oakleysteel.co.uk/types-of-pressure-vessels. [Accessed: 09-Apr-2018].
[48] “Pressure Vessels, Spherical Pressure vessels (Pressure Spheres), Cylindrical Pressure Vessels.” [Online]. Available: http://www.wermac.org/equipment/pressurevessel.html. [Accessed: 24-May-2017].
[49] M. J. Thattil and C. Pany, “Design and Analysis of Pressure Vessel with Hemispherical and Flat Circular End,” vol. 7, no. 5, pp. 12458–12469, 2017.
[50] R. J. Brogan, “HEAT EXCHANGERS,” A-to-Z Guide to Thermodynamics, Heat and Mass Transfer, and Fluids Engineering. Begellhouse, 2011.
[51] “What is a Process Vessel? - Definition from Corrosionpedia.” [Online]. Available: https://www.corrosionpedia.com/definition/1769/process-vessel. [Accessed: 09-Apr-2018].
[52] M. T. Altinbalik and S. İsencik, “Comparative Design and Cost Analysis of Cylindrical Storage Tanks with Different Head Types by Using COMPRESS,” pp. 1–8, 2016.
[53] S. Lawate and B. B. Deshmukh, “Analysis of Heads of Pressure Vessel,” Int. J. Innov. Res. Sci. Eng. Technol., vol. 4, no. 2, pp. 759–765, 2015.

133
[54] “Comparison Between Head Types: Hemi, SE, F&D and Flat – Pressure Vessel Engineering.” [Online]. Available: https://pveng.com/home/asme-code-design/comparison-between-head-types-hemi-se-fd-and-flat/. [Accessed: 14-May-2018].
[55] “ASME Boiler and Pressure Vessel Code,” 2017. [Online]. Available: https://www.asme.org/wwwasmeorg/media/ResourceFiles/Shop/Standards/New Releases/ASME-BPVC-Brochure-webview.pdf. [Accessed: 16-Oct-2018].
[56] European Parliament and Council, “Directive 2014/68/EU of the European Parliament and of the Council of 15 May 2014,” Off. J. Eur. Union, vol. 93, no. 765, pp. 164–259, 2014.
[57] European Parliament and Council, “Directive 2010/35/EU of the European Parliament and of the Council of 16 June 2010 on transportable pressure equipment,” Off. J. Eur. Union, vol. 2010, no. May, 2010.
[58] European Parliament and Council, “Directive 2009/105/EC of The European Parliament and of the Council of 16 September 2009 relating to simple pressure vessels,” Off. J. Eur. Union, no. 1025, pp. 1–25, 2013.
[59] C. Lower and S. Park, CODAP 2010 Sivision 1 & 2: Code for Construction of unfired pressure vessels, vol. 44, no. 0. Paris: SNCT Publications, 2012.
[60] Canadian Standards Association, “B51-09 Boiler, pressure vessel, and pressure piping code,” 2009.
[61] SABS, SANS 347 : 2012 - South African National Standard - Categorization and conformity assessment criteria for all pressure equipment, 2nd ed., no. 014. SABS Standards Division, 2012.
[62] “Pressure vessel tank types : CompositesWorld.” [Online]. Available: https://www.compositesworld.com/articles/pressure-vessel-tank-types. [Accessed: 09-Apr-2018].
[63] “Hydrogen storage | Innovation for Sustainable Energy | Washington State University.” [Online]. Available: https://hub.wsu.edu/ise/design/hydrogen-storage/. [Accessed: 17-Oct-2018].
[64] B. D. James, J. M. Huya-kouadio, and D. A. Desantis, “Final Report : Hydrogen Storage System Cost Analysis,” Doe Osti, no. September, 2016.
[65] “Physical Hydrogen Storage | Department of Energy.” [Online]. Available: https://www.energy.gov/eere/fuelcells/physical-hydrogen-storage. [Accessed: 17-Oct-2018].
[66] H. Barthelemy, “Hydrogen Storage – Industrial Prospectives,” pp. 1–14.
[67] “Destructive Testing (DT) - Inspecta.” [Online]. Available: https://www.inspecta.com/en/Our-Services/Testing/Destructive-Testing/. [Accessed: 17-Oct-2018].
[68] H. Division, “Pressure Test Procedures,” 2015. [Online]. Available: http://www-group.slac.stanford.edu/esh/eshmanual/references/pressureProcedTest.pdf.
[69] “Modern Techniques for Inspecting HighPressure Vessels.” [Online]. Available: https://www.asme.org/engineering-topics/articles/pressure-vessels/modern-techniques-for-inspecting-high-pressure. [Accessed: 12-Apr-2018].
[70] “Non Destructive Testing - Pressure Testing is a non-destructive test performed to ensure the integrity of the pressure shell on new pressure equipment.” [Online]. Available: http://www.wermac.org/others/ndt_pressure_testing.html. [Accessed: 17-Oct-2018].

134
[71] “Proof Pressure Testing - Maximator Test.” [Online]. Available: https://maximator-test.com/high-pressure-testing/proof-pressure-testing/. [Accessed: 16-Jul-2018].
[72] M. E. E. Joints, “Proof-Pressure Test and Leak Detection Test.” [Online]. Available: http://www.macoga.com/documents/products/metal-expansion-joints/proof-pressure-test-leak-detection-test.pdf.
[73] “Pressure Testing.” [Online]. Available: http://www.e-labsinc.com/pressure-testing.shtml. [Accessed: 17-Oct-2018].
[74] “Lecture 15-Stresses within a Pressure Vessel.” [Online]. Available: http://www.nptel.ac.in/courses/112107146/lects & picts/image/lect15/lecture15.htm. [Accessed: 25-Jan-2018].
[75] “Stress in Thick-Walled Cylinders - or Tubes.” [Online]. Available: https://www.engineeringtoolbox.com/stress-thick-walled-tube-d_949.html. [Accessed: 25-Jan-2018].
[76] R. C. Stephens and E. J. Hearn, “Mechanics of Materials 2,” 3rd ed., London: Butterworth-Heinemann, 1997.
[77] E. J. Hearn, “Mechanics of Materials 1,” 1st ed., Butterworth-Heinemann, 1970, pp. 198–214.
[78] R. M. Jones, Mechanics of Composite Materials, Second. Philadelphia: Taylor & Francis, 1999.
[79] I. Olofin and R. Liu, “The Application of Carbon Fibre Reinforced Polymer ( CFRP ) Cables in Civil Engineering Structures,” vol. 2, no. 7, pp. 1–5, 2015.
[80] “Carbon Fiber - Sit Back, It’s Time For A Lesson in Composites.” [Online]. Available: https://www.turnology.com/tech-stories/carbon-fiber-a-lesson-in-composites/. [Accessed: 11-Oct-2018].
[81] “Mechanical Properties of Carbon Fibre Composite Materials.” [Online]. Available: http://www.performance-composites.com/carbonfibre/mechanicalproperties_2.asp. [Accessed: 04-Jul-2017].
[82] “Carbon Fiber Properties.” [Online]. Available: https://www.christinedemerchant.com/carboncharacteristics.html. [Accessed: 09-Jan-2018].
[83] “Composite materials guide: Reinforcements - Fabric Types | NetComposites.” [Online]. Available: https://netcomposites.com/guide-tools/guide/reinforcements/fabric-types/. [Accessed: 06-Nov-2018].
[84] “Composite materials guide: Reinforcements - Unidirectional Fabric | NetComposites.” [Online]. Available: https://netcomposites.com/guide-tools/guide/reinforcements/unidirectional-fabric/. [Accessed: 07-Nov-2018].
[85] “Composite materials guide: Reinforcements - Woven Fabrics | NetComposites.” [Online]. Available: https://netcomposites.com/guide-tools/guide/reinforcements/woven-fabrics/. [Accessed: 07-Nov-2018].
[86] “Carbon fiber all patterns explained. Carbon.ee Blog.” [Online]. Available: https://www.carbon.ee/en/n/carbon-fiber-all-patterns-explained. [Accessed: 11-Oct-2018].
[87] P. R. Velmurugan, “Composite Materials-Manufacturing Techniques (Dept. of Aerospace Eng),” Madras.
[88] “Composites Manufacturing Processes | CompositesLab.” [Online]. Available:

135
http://compositeslab.com/composites-manufacturing-processes/. [Accessed: 17-Jan-2018].
[89] “Composite materials guide: Manufacturing - Filament Winding | NetComposites Now.” [Online]. Available: http://netcomposites.com/guide-tools/guide/manufacturing/filament-winding/. [Accessed: 22-Jun-2017].
[90] “Filament Winding - F - NetComposites.” [Online]. Available: https://netcomposites.com/guide-tools/glossary/f/filament-winding/. [Accessed: 08-Nov-2018].
[91] I. M. Daniel and O. Ishai, Engineering Mechanics of Composite Materials, 2nd ed. New York: Oxfor University Press, 2006.
[92] “Dry Winding - D - NetComposites.” [Online]. Available: https://netcomposites.com/guide-tools/glossary/d/dry-winding/. [Accessed: 08-Nov-2018].
[93] “Wet Winding - W - NetComposites.” [Online]. Available: https://netcomposites.com/guide-tools/glossary/w/wet-winding/. [Accessed: 08-Nov-2018].
[94] “HOW ARE FRP/GRP PIPE FILAMENT WINDING MACHINE WORKING? - Hebei Maple FRP Industry Co.,Ltd.” [Online]. Available: http://www.frpmachining.com/faqs/frpgrp-pipe-filament-winding-machine. [Accessed: 17-Jan-2018].
[95] V. V. Vasiliev and E. V. Morozov, Advanced Mechanics of Composite Materials, Third. Lomdon: Elsevier, 2013.
[96] ASTM, “Standard Guide for Testing Polymer Matrix Composite Materials 1,” Annu. B. ASTM Stand., pp. 1–22, 2012.
[97] A. Wube Dametew, “Design and Empirical Analysis of Selected Machine Elements from Composite Materials is Better to Use,” 2017.
[98] C. T. Sun, B. J. Quinn, and J. Tao, “Comparative evaluation of failure analysis methods for composite laminates,” U.S. Dep. Transp., no. May, p. 133, 1996.
[99] C. W. Bert, “Classical Lamination Theory,” in Manual on Experimental Methods for Mechanical Testing of Composites, Dordrecht: Springer Netherlands, 1989, pp. 11–16.
[100] S. T. Peters, Composite filament winding. ASM International, 2011.
[101] “Multi Axis Filament Winding.” [Online]. Available: http://ccp-gransden.com/index.php/multi-axis-filament-winding. [Accessed: 09-Oct-2018].
[102] Aerontech, “Epoxy AR600 +AH2336 Hardener -Technical data sheet,” 2010. [Online]. Available: https://www.aerontec.co.za/ar600-epoxy-resin-expands-range/. [Accessed: 15-Feb-2018].
[103] M. J. Hinton, A. S. Kaddour, and P. D. Soden, Failure Criteria in Fibre-Reinforced-Polymer Composites. 2004.
[104] N. Tiwari, “Introduction to Composite Materials and Structures - Lecture 28 - Failure of Unidirectional Composites,” Madras.
[105] “Stress in Thin-Walled Tubes or Cylinders.” [Online]. Available: https://www.engineeringtoolbox.com/stress-thin-walled-tube-d_948.html. [Accessed: 24-May-2018].
[106] M. Shultz and L. V Smith, “Optimal fiber orientation for fiber reinforced pressure vessels,” in 2004 SEM Annual Conference and Exposition of Experimental and Applied Mechanics, 2004,

136
pp. 1–7.
[107] “Thermal - Thermal Expansion | Characteristics of Fine Ceramics | FINE CERAMICS WORLD - All About Advanced Ceramics -.” [Online]. Available: https://global.kyocera.com/fcworld/charact/heat/thermaexpan.html. [Accessed: 09-Oct-2018].
[108] Gurit, “Spabond 340LV Epoxy Adhesive System - Technical Data Sheet.” [Online]. Available: www.gurit.com.
[109] “Granta’s CES EduPack 2017.” [Online]. Available: http://www.grantadesign.com/education/edupack/edupack2017.htm. [Accessed: 10-Sep-2018].
[110] “Aluminium Alloy - Commercial Alloy - 6082 - T6~T651 Plate.” [Online]. Available: http://www.aalco.co.uk/datasheets/Aluminium-Alloy_6082-T6~T651_148.ashx. [Accessed: 23-Apr-2018].
[111] Epoxy Technology Incorporated, “Bonding to Aluminum,” 2013. [Online]. Available: www.epotek.com.
[112] “Poisson’s ratio.” [Online]. Available: https://www.engineeringtoolbox.com/poissons-ratio-d_1224.html. [Accessed: 15-Aug-2018].
[113] G. Fernlund, J. Wells, L. Fahrang, J. Kay, and A. Poursartip, “Causes and remedies for porosity in composite manufacturing,” IOP Conf. Ser. Mater. Sci. Eng., vol. 139, p. 012002, 2016.
[114] K. Ishiguro, S. S. Sangari, and J. Seferis, “Microcrack initiation mechanism of CFRP under the thermal cycle,” Int. SAMPE Symp. Exhib., vol. 51, 2006.
[115] S. Inc., “VytaFlex Series Liquid Urethane Rubbers,” 2015. [Online]. Available: www.smooth-on.com. [Accessed: 06-Oct-2018].
[116] “Pressure Vessels - processdesign.” [Online]. Available: https://processdesign.mccormick.northwestern.edu/index.php/Pressure_Vessels. [Accessed: 16-Jan-2019].
[117] “AMT Composites.” [Online]. Available: https://www.amtcomposites.co.za/. [Accessed: 25-Jan-2019].
[118] T. Tenax, “Tenax HTS carbon fiber product datasheet,” 2011. [Online]. Available: https://www.tohotenax.com/. [Accessed: 30-May-2017].
[119] “Aerontec | Composite Materials, Flowcrete, Fibreglass, Epoxy Systems.” [Online]. Available: https://www.aerontec.co.za/. [Accessed: 25-Jan-2019].
[120] ASTM International, “ASTM D3039/D3039M - Standard Test Method for Tensile Properties of Polymer Matrix Composites,” Annual Book of ASTM Standards. ASTM International, West Conshohocken, PA, pp. 1–13, 2014.
[121] “Strain Gauges: Types, What It Is & How It Works | Omega.” [Online]. Available: https://www.omega.com/prodinfo/strain-gauges.html. [Accessed: 07-Feb-2019].
[122] “Measuring Strain with Strain Gages - National Instruments.” [Online]. Available: http://www.ni.com/white-paper/3642/en/. [Accessed: 24-Jul-2017].
[123] “Mechanics eBook: Strain Gages and Strain Rosette.” [Online]. Available: https://www.ecourses.ou.edu/cgi-

137
bin/ebook.cgi?doc=&topic=me&chap_sec=08.3&page=theory. [Accessed: 11-Aug-2017].
[124] “Strain Gauges-Rosettes.” [Online]. Available: http://www.continuummechanics.org/straingauges.html. [Accessed: 20-Jul-2017].
[125] Vishay Micro-Measurements, “Strain Gage Selection: Criteria, Procedures, Recommendations Strain Gages and Instruments MICRO-MEASUREMENTS,” 2017. [Online]. Available: http://www.vishaypg.com/docs/11055/tn505.pdf.
[126] “Strain Gage: Length.” [Online]. Available: http://www.efunda.com/designstandards/sensors/strain_gages/strain_gage_selection_length.cfm. [Accessed: 21-Jun-2018].
[127] “Coefficients of Linear Thermal Expansion.” [Online]. Available: https://www.engineeringtoolbox.com/linear-expansion-coefficients-d_95.html. [Accessed: 25-Jun-2018].
[128] I. Measurements Group, “P-3500 Portable Strain Indicator - User Guide,” 1992. [Online]. Available: http://www.groupes.polymtl.ca/mec6405/Instruments Spec/Vishay_P3500.pdf. [Accessed: 12-Oct-2018].
[129] Bigelow Erik, “Conformable Hydrogen Storage Coil Reservoir,” 2015.
[130] “Strong, Stiff, Hard Plastic Sheets | Curbell Plastics.” [Online]. Available: https://www.curbellplastics.com/Research-Solutions/Applications/Strong-and-Stiff. [Accessed: 21-Jan-2019].
[131] “Heat-resistant and gas-impermeable rubber sheets - Teknikum.” [Online]. Available: https://www.teknikum.com/en/heat-resistant-and-gas-impermeable-rubber-sheets/. [Accessed: 21-Jan-2019].
[132] “Highly Gas Impermeable Elastomeric Rubber-Rubber Blend Nano Composites | Gandhian Young Technological Innovation Award.” [Online]. Available: http://gyti.techpedia.in/project-detail/highly-gas-impermeable-elastomeric-rubber-rubber-blend-nano-composites/802. [Accessed: 21-Jan-2019].
[133] K. Law, J. Rosenfeld, V. Han, M. Chan, H. Chiang, and J. Leonard, “U.S. Department of Energy Hydrogen Storage Cost Analysis,” 2013.

138
Appendices
Appendix A: CFRP tubes
Appendix B: Detailed end cap drawings
Appendix C: Leak rate calculation
Appendix D: Material and product data sheets
Appendix E: Detailed costs associated with the novel CFRP pressure vessels
and the Type IV pressure vessels

139
Appendix A: CFRP tubes

140
1. Stress calculations

Introduction
These calcula ons were perfromed using PTC MathCAD Express so ware. The CFRP tube stress and strain calcula ons begin with defining the material proper es as well as the dimensions of the tube. The hoop and longitudinal stresses (i.e. global stresses) are then evaluated using the Cylinder Theories given by EJ Hearn [76]. The rest of the calcula ons are based on the Classical Lamina on Theory and can be found in sec on 2.3.4.2 and the steps taken are derived from the summary given on page 39.
Material properties and vessel dimensions
Pressure ≔po 350
Inner diameter ≔Di 50
Thickness of vessel ≔t 4
Outer diameter ≔Do =+Di ⋅2 t 58
Winding angle ≔α1 50
≔α2 -α1
Laminae thickness ≔tl 0.25
Number of laminae ≔nl =―t
tl
16
Laminate thickness ≔h =t 4
Longitudinal modulus ≔E1 109
Transverse modulus ≔E2 6
In-plane shear modulus
≔G12 5
Major Poisson's ratio ≔v12 0.30
Minor Poisson's ratio ≔v21 =―――⋅E2 v12
E1
0.017
Created with PTC Mathcad Express. See www.mathcad.com for more information.

Applied stresses on the pressure vessel
Inner radius ≔R1 =―Di
225
Outer radius ≔R2 =―Do
229 ≔K =―
R2
R1
1.16
Lame's constants ≔A ――――⋅po R1
2
⎛⎝ -R22
R12 ⎞⎠
≔B ――――⋅⋅po R1
2R2
2
⎛⎝ -R22
R12 ⎞⎠
Stresses evaluated at: ≔r =R1 0.025
Hoop stress ≔σH =―――――
⋅po
⎛⎜⎝
+⎛⎜⎝―R2
r
⎞⎟⎠
2
1⎞⎟⎠
-K2 1
237.546
Longitudinal stress ≔σL =――――⋅po R1
2
-R22
R12
101.273
Global stresses on the laminate ≔
σx
σy
τxy
⎡⎢⎢⎢⎣
⎤⎥⎥⎥⎦
σL
σH
0
⎡⎢⎢⎣
⎤⎥⎥⎦
Created with PTC Mathcad Express. See www.mathcad.com for more information.

Transformation Matrices
Transformational matrix ≔T
cos (( ))2
sin (( ))2
⋅⋅2 sin (( )) cos (( ))
sin (( ))2
cos (( ))2
-(( ⋅⋅2 sin (( )) cos (( ))))
⋅-sin (( )) cos (( )) ⋅sin (( )) cos (( )) -cos (( ))2
sin (( ))2
⎡⎢⎢⎢⎢⎣
⎤⎥⎥⎥⎥⎦
For laminae with °50
fibre winding angle =T1
0.413 0.587 0.9850.587 0.413 -0.985
-0.492 0.492 -0.174
⎡⎢⎢⎣
⎤⎥⎥⎦
For laminae with - °50
fibre winding angle=T2
0.413 0.587 -0.9850.587 0.413 0.9850.492 -0.492 -0.174
⎡⎢⎢⎣
⎤⎥⎥⎦
Reduced Stiffness Matrix
≔Q11 ――――E1
-1 ⋅v12 v21
≔Q12 ――――⋅v12 E2
-1 ⋅v12 v21
≔Q16 0
≔Q66 G12 ≔Q26 0
≔Q22 ――――E2
-1 ⋅v12 v21
≔Q =
Q11 Q12 Q16
Q12 Q22 Q26
Q16 Q26 Q66
⎡⎢⎢⎢⎣
⎤⎥⎥⎥⎦
109.543 1.809 01.809 6.03 00 0 5
⎡⎢⎢⎣
⎤⎥⎥⎦
Transformed Reduced Stiffness Matrix
≔m cos ⎛⎝α1⎞⎠ ≔n sin ⎛⎝α1
⎞⎠
≔Q11` ++⋅Q11 m4 ⋅⋅⋅2 ⎛⎝ +Q12 2 Q66
⎞⎠ n2
m2 ⋅Q22 n
4
≔Q12` +⋅⋅⎛⎝ -+Q11 Q22 ⋅4 Q66⎞⎠ m
2n
2 ⋅Q12⎛⎝ +n
4m
4 ⎞⎠
≔Q22` ++⋅Q11 n4 ⋅⋅⋅2 ⎛⎝ +Q12 2 Q66
⎞⎠ n2
m2 ⋅Q22 m
4
≔Q16` +⋅⋅⎛⎝ --Q11 Q12 ⋅2 Q66⎞⎠ m
3n ⋅⋅⎛⎝ +-Q12 Q22 ⋅2 Q66
⎞⎠ m n3
≔Q26` +⋅⋅⎛⎝ --Q11 Q12 ⋅2 Q66⎞⎠ m n
3 ⋅⋅⎛⎝ +-Q12 Q22 ⋅2 Q66⎞⎠ m
3n
≔Q66` +⋅⋅⎛⎝ --+Q11 Q22 ⋅2 Q12 ⋅2 Q66⎞⎠ m
2n
2 ⋅Q66⎛⎝ +n
4m
4 ⎞⎠
Created with PTC Mathcad Express. See www.mathcad.com for more information.

For laminae with fibre winding angle°50
≔Q`1 =
Q11` Q12` Q16`
Q12` Q22` Q26`
Q16` Q26` Q66`
⎡⎢⎢⎢⎣
⎤⎥⎥⎥⎦
26.5 24.1 21.5524.1 44.48 29.4221.55 29.42 27.3
⎡⎢⎢⎣
⎤⎥⎥⎦
For laminae with fibre winding angle- °50
=Q`2
26.5 24.1 -21.5524.1 44.48 -29.42
-21.55 -29.42 27.3
⎡⎢⎢⎣
⎤⎥⎥⎦ 4
Calculations of strains of each lamina in the laminate
Z-position of the bottom surface of the laminate
≔z0 =――-h
2-2
≔ 0
Z-positions for the top and bottom surfaces of each lamina
≔p =⎛⎝ +z0 ⋅l tl⎞⎠
-2-1.75-1.5-1.25-1-0.75-0.5-0.25
00.250.50.75⋮
0
1
2
3
4
5
6
7
8
9
10
11
⋮16
⎡⎢⎢⎢⎢⎢⎢⎢⎢⎢⎢⎢⎢⎢⎢⎣
⎤⎥⎥⎥⎥⎥⎥⎥⎥⎥⎥⎥⎥⎥⎥⎦
Created with PTC Mathcad Express. See www.mathcad.com for more information.

The extensional stiffness matrix
=A
0.106 0.096 00.096 0.178 00 0 0.109
⎡⎢⎢⎣
⎤⎥⎥⎦
⋅
The coupling stiffness matrix =B
0 0 00 0 00 0 0
⎡⎢⎢⎣
⎤⎥⎥⎦
⋅ 2
The bending stiffness matrix =D
0.141 0.129 0.0220.129 0.237 0.0290.022 0.029 0.146
⎡⎢⎢⎣
⎤⎥⎥⎦
⋅ 3
The resultant forces on the laminate per unit length
≔Nx =⌠⌡
d
――-h
2
―h
2
σx z ⎛⎝ ⋅4.051 105 ⎞⎠ ⋅ -1
≔Ny =⌠⌡
d
――-h
2
―h
2
σy z ⎛⎝ ⋅9.502 105 ⎞⎠ ⋅ -1
≔Nxy =⌠⌡
d
――-h
2
―h
2
τxy z 0 ⋅ -1
Created with PTC Mathcad Express. See www.mathcad.com for more information.

The resultant moments on the laminate per unit length
≔Mx =⌠⌡
d
――-h
2
―h
2
⋅σx z z 0
≔My =⌠⌡
d
――-h
2
―h
2
⋅σy z z 0
≔Mxy =⌠⌡
d
――-h
2
―h
2
⋅τxy z z 0
Mid-plane strains≔
ε`x
ε`y
γ`xy
⎡⎢⎢⎢⎣
⎤⎥⎥⎥⎦
=⋅
A,0 0
A,0 1
A,0 2
A,1 0
A,1 1
A,1 2
A,2 0
A,2 1
A,2 2
⎡⎢⎢⎢⎢⎣
⎤⎥⎥⎥⎥⎦
-1
Nx
Ny
Nxy
⎡⎢⎢⎢⎣
⎤⎥⎥⎥⎦
-0.00204330.00644810
⎡⎢⎢⎣
⎤⎥⎥⎦
Mid-plane curvatures≔
κ`x
κ`y
κ`xy
⎡⎢⎢⎢⎣
⎤⎥⎥⎥⎦
=⋅
D,0 0
D,0 1
D,0 2
D,1 0
D,1 1
D,1 2
D,2 0
D,2 1
D,2 2
⎡⎢⎢⎢⎢⎣
⎤⎥⎥⎥⎥⎦
-1
Mx
My
Mxy
⎡⎢⎢⎢⎣
⎤⎥⎥⎥⎦
000
⎡⎢⎢⎣
⎤⎥⎥⎦
―1
Global strains for all laminae≔
εx
εy
γxy
⎡⎢⎢⎢⎣
⎤⎥⎥⎥⎦
=+
ε`x
ε`y
γ`xy
⎡⎢⎢⎢⎣
⎤⎥⎥⎥⎦
⋅p0
κ`x
κ`y
κ`xy
⎡⎢⎢⎢⎣
⎤⎥⎥⎥⎦
- ⋅2.04327 10-3
⋅6.44806 10-3
- ⋅87.31476 10-36
⎡⎢⎢⎢⎣
⎤⎥⎥⎥⎦
Global Stresses
For laminae with °50
fibre winding angle ≔
σx
σy
τxy
⎡⎢⎢⎢⎣
⎤⎥⎥⎥⎦
=⋅Q`1
εx
εy
γxy
⎡⎢⎢⎢⎣
⎤⎥⎥⎥⎦
101.273237.546145.638
⎡⎢⎢⎣
⎤⎥⎥⎦
For laminae with - °50
fibre winding angle ≔
σx_2
σy_2
τxy_2
⎡⎢⎢⎢⎣
⎤⎥⎥⎥⎦
=⋅Q`2
εx
εy
γxy
⎡⎢⎢⎢⎣
⎤⎥⎥⎥⎦
101.273237.546
-145.638
⎡⎢⎢⎣
⎤⎥⎥⎦
Created with PTC Mathcad Express. See www.mathcad.com for more information.

Local Strains and Stresses
For laminae with °50
fibre winding angle ≔
ε1
ε2
γ12
⎡⎢⎢⎢⎣
⎤⎥⎥⎥⎦
=⋅T1
εx
εy
γxy
⎡⎢⎢⎢⎣
⎤⎥⎥⎥⎦
0.00293960.00146510.0041812
⎡⎢⎢⎣
⎤⎥⎥⎦
≔
σ1
σ2
τ12
⎡⎢⎢⎢⎣
⎤⎥⎥⎥⎦
=⋅T1
σx
σy
τxy
⎡⎢⎢⎢⎣
⎤⎥⎥⎥⎦
324.66714.15241.812
⎡⎢⎢⎣
⎤⎥⎥⎦
For laminae with - °50
fibre winding angle≔
ε1
ε2
γ12
⎡⎢⎢⎢⎣
⎤⎥⎥⎥⎦
=⋅T2
εx
εy
γxy
⎡⎢⎢⎢⎣
⎤⎥⎥⎥⎦
0.002940.00147
-0.00418
⎡⎢⎢⎣
⎤⎥⎥⎦
≔
σ1
σ2
τ12
⎡⎢⎢⎢⎣
⎤⎥⎥⎥⎦
=⋅T2
σx_2
σy_2
τxy_2
⎡⎢⎢⎢⎣
⎤⎥⎥⎥⎦
324.66714.152
-41.812
⎡⎢⎢⎣
⎤⎥⎥⎦
Created with PTC Mathcad Express. See www.mathcad.com for more information.

144
2. Strain measurements
2.1 First set of CFRP pressure vessels
Vessel 1
Pressure Reading
[bar]
Strain readings
0o [µε]
90o
[µε]
20 -80 62
28 -145 98
36 -218 159
68 -536 377
96 -795 543
116 -973 657
124 -1007 683
130 -1092 740
162 -1400 934
Vessel 3
Pressure Reading
[bar]
Strain readings
0o [µε]
90o
[µε]
22 -165 93
36 -313 183
55 -501 297
80 -755 453
99 -930 558
118 -1102 657
138 -1300 777
158 -1493 901
172 -1592 967
176 -1643 1015
198 -1898 1152
218 -2089 1256
220 - -
Vessel 2
Pressure Reading
[bar]
Strain readings
0o [µε]
90o
[µε]
22 -106 90
42 -233 199
46 -273 231
90 -595 500
100 -693 578
114 -796 662
136 -942 771

145
2.2 Second set of CFRP pressure vessels
2.2.1 CFRP tubes – 2 mm

146

147
2.2.2 CFRP tubes – 4 mm

148

149
Appendix B: Detailed End Cap Drawings

150
1.1 First end cap design

2018/12/05 Sheet11:1
Landscape
10
Quantity:
Material:
1
of
Drawing Number
Date:
Drawn By:
Title:
University of Cape TownDepartment of Mechanical Engineering
Part Finish Scale:
1
A4
End Cap-1
(MWRNYA002)Nyasha Mawire
3.2
First End Cap Design
SECTION A-A
Aluminium 6083
12
50
0
15
47
R19
9.6 1
.4
1 X 45°
0.05
49
.90
-
2.4
35
49.9
0 -0 0.
05
A
A
SOLIDWORKS Educational Product. For Instructional Use Only.

(MWRNYA002)Nyasha Mawire
Aluminium 6083
First End Cap Design
2018/12/05 Sheet11:1
Landscape
5
Quantity:
Material:
3
of
Drawing Number
Date:
Drawn By:
Title:
University of Cape TownDepartment of Mechanical Engineering
Part Finish Scale:
1
A4
End Cap-1-threaded
11.80 THRU ALLG1/4 - 6H THRU ALL
49
.90
A
ASECTION A-A
1 X 45°
1.4
0
R19
35
9.60 2.40
50
15
47
SOLIDWORKS Educational Product. For Instructional Use Only.

153
1.2 Second end cap design

10
Second End Cap Design
Note
1. All chamfers are 1 mm high at 45 degrees
Nyasha Mawire
(MWRNYA002)Aluminium 6083
SECTION A-A 2
.4
35
1.4
R19
72°
9.6
1.5
Sheet1 11:1
Landscape
2
Quantity:
Material:
1
of
Drawing Number
Date:
Drawn By:
Title:
University of Cape TownDepartment of Mechanical Engineering
Part Finish
2018/12/05
Scale:
A4
End Cap-2-Angled Holes
6 x 4 THRU
49
.90
AA
SOLIDWORKS Educational Product. For Instructional Use Only.

10
2018/12/05 Sheet11:1
Landscape
2
Quantity:
Material:
1
of
Drawing Number
Date:
Drawn By:
Title:
University of Cape TownDepartment of Mechanical Engineering
Part Finish Scale:
1
A4
End Cap-2-Angled Holes
SECTION A-A
R19
35
9.6
1.4 2.4
1.5
72°
Note
(MWRNYA002)
Second End Cap Design
1. All chamfers are 1 mm high at 45 degrees
Nyasha Mawire
Aluminium 6083
4 THRU6 x
49.9
0
11.80 THRU ALLG1/4 - 6H THRU ALL
AA
SOLIDWORKS Educational Product. For Instructional Use Only.

156
1.3 Third end cap design

159
Appendix C: Leak rate calculations

10
SolidWorks Academic - not for commercial use
Title:
Drawing Number :
University of Cape Town
1 of 1
Nyasha MawireDrawn By:
1:1 on A4 Department of Mechanical Engineering
Sheet :
Scale:
ISO 2768-mChecked :
ARev. :
All un-toleranced dimensions to adhere to
Material :
MWRNYA002‐004
Third End Cap Design‐Threaded
AA 6083
Third End Cap Design
50.4768 4
49.9
6 x 11.80 THRU ALL
G1/4 - 6H THRU ALLC
C
Knurled surface 55
SECTION C-C
2.4
47
72° R21.5
42
3.6
+ 0.050 44
00.
02 +
1.4
49
2.4 + 0.050
SOLIDWORKS Educational Product. For Instructional Use Only.

10
47 0.02
5 0.
009
-
49
.9 -
6 x 4 48.5747A
A
Knurled surface
55
SolidWorks Academic - not for commercial use
Title:
Drawing Number :
University of Cape Town
1 of 1
Nyasha MawireDrawn By:
1:1 on A4 Department of Mechanical Engineering
Sheet :
Scale:
ISO 2768-mChecked :
ARev. :
All un-toleranced dimensions to adhere to
Material :
AA 6083
Third End Cap Design
MWRNYA002‐003
SECTION A-A
1.4
0
R21.5
42
44
3.6
+ 0.02
72°
2.4 +
00.05
2.4 + 0.050
49
Third End Cap Design
SOLIDWORKS Educational Product. For Instructional Use Only.

161
Appendix D: Material and product data sheets

Toho Tenax Europe GmbH Kasinostraße 19-21 Tel.: +49 202 32 - 2339 www.tohotenax-eu.com 42103 Wuppertal, Deutschland Fax: +49 202 32 - 2360 [email protected] (04/2011)
Brand name Tenax® Tenax® Tenax®
Production site E E E
Fiber family & tensile properties HTS40 HTS40 HTS45
Sizing properties F13 F13 E23
Number of filaments 12K 24K 12K
Nominal linear density 1) [tex] 800 1600 800tex
Twist [t/m] 0/10Z 0/5Z 0
Running length per kg [m/kg] 1250 625 1250
Package weight, net [kg] 2 • 4 • 6 2 • 4 • 6 • 8 2 • 4 • 6
1) ohne Präparationsauftrag
Tensile Properties (typical values)
Tensile strength [MPa] 4300 4300 4500
Tensile modulus [GPa] 240 240 240
Characteristics (typical values)
Filament diameter [µm] 7
Density [g/cm3] 1,77
Elongation at break [%] 1,8
Specific heat capacity [J/kgK] 710
Thermal conductivity [W/mK] 10
Coefficient of thermal expansion [ [ 10-6/K] -0,1
Specific electrical resistance [Ω cm] 1,6 x 10⁻³
Sizing properties for fiber family HTS
HTS is a classic Tenax® high performance carbon fiber. The high tenacity (HT) fibers provide excellent mechanical laminate properties. E23 = Type with ca. 1,3 % sizing based on epoxy resin F13 = Type with ca. 1,0 % sizing based on polyurethane Please contact our sales team any time for choosing the right type. The stated numbers are typical values. For design purposes please request fiber specification. Please note the application (aerospace or industry & sports) on your order. The export or transfer of carbon fibers can be subject to authorization, depending on end-use and final destination.
Delivery programme and characteristics for Tenax® HTS filament yarn

- 1 -
Technical data sheet
Issued June 2010
Resin System for Composites Epoxy Resin AR 600 with Hardener AH 2336
(Requires heat cure for full properties) Introduction Epoxy resin AR 600 with hardener AH 2336 is a high performance
epoxy resin system for performance composite parts designed for wet lay-up, vacuum bagging, tooling / moulds, filament winding and resin-infusion. AR 600 is a low viscosity epoxy resin produced from bisphenol A/F and epichlorohydrin, and contains a proportion of E10P (glycidyl ester of neodecanoic acid) as a reactive diluent; AH 2336 is a unmodified cycloaliphatic polyamine hardener system. This system provides a unique combination of good mechanical properties and thermal properties. It is especially useful in high performance composite parts where fibre to resin ratio’s are important.
Features > Low viscosity, good, fast wet-out > Good mechanical properties > Good thermal and heat deflection temperatures > Long pot-life Suggested Uses > Advanced composite structures > Tooling / moulds > Filament winding / pultrusion > Resin transfer molding Typical Properties
AR 600 (Epoxy Resin) Property Test Method Unit Value Density at 23°C SMS 1347 kg/L 1,14 Flashpoint ASTM D93 °C 141 Viscosity at 23°C ASTM D445 Pa.s 0,7 – 1,1 Epoxy group content SMS 2026 mmol/kg 5280 EEW g 180 – 195 Colour ASTM D1209 Pt-Co 200 max

- 2 -
AH 2336 (Hardener) Property Test Method Unit Value Density at 23°C SMS 1347 kg/L 0.96 Flashpoint ASTM D93 °C 194 Viscosity at 23°C D-150F mPa.s 70 - 100 AHEW g/g 52,5 Amine value mgKOH/g 526 Formulas Material Pounds Kilograms AR 600 10 lbs 1,0 kg AH 2336 2,8 lbs 280 g Ratio 100 : 28 parts by weight Typical Cured State Properties
The physical properties of neat resin castings made with AR 600 with AH 2336 are given below. As these tests were done in a controlled environment, and it is suggested that appropriate tests are carried out for your own application and end use. Mix ratio
By weight 100 : 28 Glass transition (Tg) By Rheometrics, °C 182 By HDT, °C 180 Tensile strength At 23 °C, Mpa 73 - 81 Tensile modulus At 23 °C, MPa 2500 - 2600 Tensile elongation At 23 °C, % 5,5
Composite Fabrication Pot-life @ 23°C (128g) 200 – 400 mins
Curing – The curing cycle will depend on part size and thickness, method of heat application, and end properties required. Additional post curing is achieved by heating the composite structure up to the desired post-cure temperature. Temperature increase should be between 1,5 to 2,0°C per minute for best results, and to prevent thermal shock.

- 3 -
Typical Cure and Post Cure Schedule – 2 hours at 60°C + 3 hours at 80°C + 4 hours at 120°C + 2 to 6 hours at 160°C. Cooling down should also be slow, and should be left until room temperature is reached.
Product Precautions Uncured epoxies are toxic and may cause skin irritation. It is
strongly recommended to use gloves and safety glasses when working with epoxies. If gloves are not available, use a suitable barrier cream. In the event of skin contact, wipe off epoxy or hardener with paper towel and wash skin well with soap and water. Do not use solvents to wash epoxies off skin.
Product Storage Resin and hardeners should be stored in conditions so that
moisture is excluded, preferably in the original containers kept tightly closed. Under these normal storage conditions the storage life should be at least one year.
Disclaimer These are starting point formulations and are not proven for use in the user’s
particular application but are simply meant to demonstrate the efficacy of the products and to assist in the development of the user’s own formulations. It is the user’s responsibility to fully test and qualify the formulation, along with the ingredients, methods, applications, cure and post-cure cycles, or equipment identified herein, by the user’s knowledgeable formulator or scientist, and to determine the appropriate use conditions and legal restrictions, prior to use of any information.
ALL WARRANTIES OF ANY KIND ARE EXPRESSLY EXCLUDED AND DISCLAIMED, WITHOUT LIMITATION, NO REPRESENTATION IS MADE AND NO WARRANTY, EXPRESS OR IMPLIED, IS EXTENDED WITH RESPECT TO THE ACCURACY, REPRODUCIBILITY, COMPLETENESS, OR USEFULNESS OF THE INFORMATION TO MEET YOUR REQUIREMENTS, OR WITH RESPECT TO THE TITLE OR MERCHANTIBILITY OF THE INFORMATION PROVIDED, OR THE FITNESS OF THE INFORMATION PROVIDED FOR A PARTICULAR PURPOSE, OR THAT THE USE OF THE INFORMATION IS FREE FROM INFRINGEMENT OF ANY PATENT OR ANY OTHER INTELLECTUAL PROPERTY RIGHT, AND EACH OF THESE ARE THE SOLE AND EXCLUSIVE RESPONSIBILITY OF THE USER. USE OF THE INFORMATION AND PRODUCTS IS AT YOUR OWN RISK.
AERONTEC cc PO Box 683, Howard Place, 7450
Tel : 021-671 2114 [email protected]

PDS-Spabond 340LV-14-0515 1
Spabond 340LV EPOXY ADHESIVE SYSTEM
¬ High strength and toughness industrial adhesive
¬ Excellent gap filling properties
¬ Designed for cartridge and mixing machine dispense
¬ Three hardener speeds give a range of working times / clamp times
¬ Low exotherm and shrinkage
¬ Temperature performance up to 80°C
¬ Resin & hardener are pigmented to give a visual indication of mix quality
INTRODUCTION
Spabond 340LV is a high performance adhesive designed for bonding large structures such as yacht hulls and windturbine blades. It is a cost-effective system with good thermal and mechanical properties.
The components are pigmented to give a visual indication of mix quality, which is a useful feature when mixing byhand or with a machine. The system has a simple 2:1 mix ratio by weight and volume.
Spabond 340LV is available in cartridges, pails and 200 litre drums for machine mixing/dispense.

2 PDS-Spabond 340LV-14-0515
INSTRUCTIONS FOR USE
The product is optimised for use at 15 - 25°C. At lowertemperatures the components thicken and may eventuallybecome unworkable. To ensure accurate mixing and goodworkability pre-warm the resin & hardener as well as thesurfaces to be bonded before use.
Surface PreparationBefore using the product ensure that surfaces to be bonded areclean, dry and dust-free. Prepare all surfaces by abrading withmedium grit paper or other suitable abrasive, remove dust thenwipe with acetone or Gurit Fast Epoxy Solvent (Solvent A).
Metals usually require a chemical pre-treatment to create thebest bond. Please contact Gurit for a Guide to SurfacePreparation and Pre-treatments.
Ensure that polyester or vinylester laminates are fully curedbefore bonding, then prepare as above. When bonding epoxylaminates, the use of a suitable Peel Ply as the last stage in theirmanufacture is recommended, otherwise prepare as above.Trials may be required to test Peel Ply suitability.
For ferrocement, etch with 5% solution of hydrochloric acid,wash with fresh water, then dry.
For all timber, sand with abrasive paper across grain. Degreaseoily timber with a fast evaporating solvent (e.g. Gurit Fast EpoxySolvent). For resinous or gummy timber, etch with 2% causticsoda solution, wash off with fresh water and dry.
Mixing & HandlingThe Spabond 340 components are supplied pigmented in thefollowing colours:
Resin - yellowFast Hardener - redStandard - mauveSlow Hardener - purpleExtra Slow Hardener - blue
Spabond 340 resin should be combined with any one Spabond340 hardener in the following mix ratio:
Spabond 340LV resin Spabond 340 hardener
100 : 50 (by weight and volume)
Mix thoroughly for at least one minute, paying particularattention to the sides and bottom of the mixing vessel, toensure no streaks remain. Once fully mixed the adhesiveshould have a uniform colour. Use from pot quickly to maximiseresin working life.
Cartridge UseIf dispensing product from twin cartridges with a mixing /dispensing head , please discard the first mix head length ofresin and hardener components, prior to applying adhesive tothe job, in order to ensure thorough mixing of the system. Werecommend the use of a new mix head for each application,particularly where the time between each applicationapproaches the pot life.
PROPERTIES
Component Properties
Resin Fast Standard Slow Extra Slow
Mix Ratio (by weight) 100 50 50 50 50
Mix Ratio (by volume) 100 50 50 50 50
Viscosity @ 15°C (cP) 49000 59100 - 45000 44700
Viscosity @ 20°C (cP) 29000 38400 - 37920 36600
Viscosity @ 25°C (cP) 21000 25800 313000 30790 22400
Viscosity @ 30°C (cP) 13000 17100 - 23640 17500
Shelf Life (months) 24 24 24 24 24
Colour yellow red mauve purple blue
Mixed Colour - pink cream grey green
Component Dens. (g/cm3) 1.1 1.1 1.1 1.1 1.1
Mixed Density (g/cm3) 1.1 1.1 1.1 1.1 1.1
Hazard Definition Please refer to SDS

PDS-Spabond 340LV-14-0515 3
PROPERTIES (CONT’D)
Cured System Properties
Room Temp. Cure (28 days @ 21°C)Cured 24 hours @ 21°C +16 hours
@ 50°CCured 5 hrs @ 70°C
Fast Standard Slow Ex. Slow Fast Standard Slow Ex. Slow Fast Standard Slow Ex. Slow
Tg DMTA (Peak
Tanδ(°C)65.8 TBC 60.0 60.9 74.1 84.8 81.7 76.3 80.8 TBC 79.7 77.4
Tg Ult - DMTA (°C) 92.4 TBC 80.5 86.4 92.4 76.5 80.5 86.4 92.4 TBC 80.5 86.4
Tg2 - DSC (°C) 55.0 TBC 52.8 54.2 71.8 74.1 67.4 63.7 72.3 TBC 69.1 66.5
Tg1 - DMTA (°C) 54.9 TBC 50.4 51.5 63.3 74.1 67.5 65.1 69.2 TBC 68.5 67.1
Cured Density
(g/cm3)TBA TBA 1.16 TBA 1.12 TBC 1.11 1.09
Linear Shrinkage
(%)TBA TBA 1.92 TBC 1.91 1.94
Cleavage Strength
(kN)10.7 TBC 11.1 10.7 11.0 10.3 11.9 12.0 10.6 TBC 11.7 11.0
Shear Strength on
Steel (MPa)24.9 TBC 27.0 30.7 28.0 32.5 31.0 32.2 33.3 TBC 34.5 33.4
Shear Strength Wet
Retention (%) 70.5 TBC 75.6 80.2 TBA TBA
Working Properties
Resin/Fast Hardener Resin/Standard Hardener Resin/Slow Hardener Resin/Extra Slow Hardener
15°C 20°C 25°C 30°C 15°C 20°C 25°C 30°C 15°C 20°C 25°C 30°C 15°C 20°C 25°C 30°C
Initial Mixed Viscosity
(cP)43500 27600 19000 12500 - - 25500 - 42000 27000 20000 10000 48000 34000 21000 14300
†Pot Life - 500g mix in
air (hrs:mins)0:20 0:16 0:12 0:10 - 00:30 - - 01:00 00:45 00:34 00:26 3:10 2:20 1:40 1:15
*†Clamp Time
(hrs:mins)5:12 3:50 2:50 2:05 - 9:15 - - 23:00 17:40 13:30 10:20 33:50 24:00 14:50 10:30
Sag Resistance (mm) TBA 20 20 TBA - 20 - - TBA 20 20 TBA TBA 20 20 TBA
Notes: For an explanation of test methods used see ‘Formulated Products Technical Characteristics’.
All figures quoted are indicative of the properties of the product concerned. Some batch to batch variation may occur.
† All times are measured from when resin and hardener are first mixed together.
*Clamp time data shows the time taken to achieve a 2000N bond strength. This figure allows comparison of cure speed with other adhesive products of the Spabond range. However, because of the unusual cure development of this product at 15 - 30°C, the time to reach a safe handling strength should be extended by approximately 50%.
Alternatively, an elevated temperature posture should be applied before handling.

4 PDS-Spabond 340LV-14-0515
Clamp Time
Cleavage StrengthGlass Transition Temperature
MECHANICAL PROPERTIES
WORKING PROPERTIES
Shear Strength on Shotblasted Steel

PDS-Spabond 340LV-14-0515 5
HEALTH AND SAFETY
The following points must be considered:
1. Skin contact must be avoided by wearing protective gloves.Gurit recommends the use of disposable nitrile gloves formost applications. The use of barrier creams is notrecommended, but to preserve skin condition amoisturising cream should be used after washing.
2. Overalls or other protective clothing should be worn whenmixing, laminating or sanding. Contaminated work clothesshould be thoroughly cleaned before re-use.
3. Eye protection should be worn if there is a risk of resin,hardener, solvent or dust entering the eyes. If this occursflush the eye with water for 15 minutes, holding the eyelidopen, and seek medical attention.
4. Ensure adequate ventilation in work areas. Respiratoryprotection should be worn if there is insufficient ventilation.Solvent vapours should not be inhaled as they can causedizziness, headaches, loss of consciousness and can havelong term health effects.
5. If the skin becomes contaminated, then the area must beimmediately cleansed. The use of resin-removing cleansersis recommended. To finish, wash with soap and warmwater. The use of solvents on the skin to remove resins etcmust be avoided.
Washing should be part of routine practice:
n before eating or drinking
n before smoking
n before using the lavatory
n after finishing work
6. The inhalation of sanding dust should be avoided and if itsettles on the skin then it should be washed off. After more extensive sanding operations a shower/bath and hair washis advised.
Gurit produces a separate full Safety Data Sheet for allhazardous products. Please ensure that you have the correctSDS to hand for the materials you are using beforecommencing work. A more detailed guide for the safe use ofGurit resin systems is also available from Gurit, and can befound at www.gurit.com
APPLICABLE RISK & SAFETYPHRASES
Please refer to product SDS for up to date information specificto this product.

6 PDS-Spabond 340LV-14-0515
TRANSPORT & STORAGEThe resin and hardeners should be kept in securely closed containers during transport andstorage. Any accidental spillage should be soaked up with sand, sawdust, cotton waste or anyother absorbent material. The area should then be washed clean (see appropriate Safety DataSheet).
Adequate long term storage conditions will result in a shelf life of two years for both the resinand hardeners. Storage should be in a warm dry place out of direct sunlight and protectedfrom frost. The storage temperature should be kept constant between 10°C and 25°C, cyclicfluctuations in temperature can cause crystallization. Containers should be firmly closed.Hardeners, in particular, will suffer serious degradation if left exposed to air.
For more information on crystallization please refer to the Adhesives section on the Guritwebsite. (www.gurit.com)
NOTICE
All advice, instruction or recommendation is given in good faith but Gurit AG (the company)only warrants that advice in writing is given with reasonable skill and care. No further duty orresponsibility is accepted by the Company. All advice is given subject to the terms andconditions of sale (the Conditions) which are available on request from the Company or maybe viewed at the Company’s Website: http://www.gurit.com/terms-and-conditions.aspx
The Company strongly recommends that Customers make test panels and conductappropriate testing of any goods or materials supplied by the Company to ensure that they aresuitable for the Customer’s planned application. Such testing should include testing underconditions as close as possible to those to which the final component may be subjected. TheCompany specifically excludes any warranty of fitness for purpose of the goods other than asset out in writing by the Company. The Company reserves the right to change specificationsand prices without notice and Customers should satisfy themselves that information relied onby the Customer is that which is currently published by the Company on its website. Anyqueries may be addressed to the Technical Services Department.
Gurit are continuously reviewing and updating literature. Please ensure that you have thecurrent version, by contacting Gurit Marketing Communications or your sales contact andquoting the revision number in the bottom right-hand corner of this page.
W www.gurit.com

START BY PREPARING YOUR MODEL... Preparation - Store and use at room temperature (73°F/23°C). These products have a limited shelf life and should be used as soon as possible. Environmental humidity should be as low as possible. Good ventilation (room size) is essential. Wear safety glasses, long sleeves and rubber gloves to minimize contamination risk.
Some Materials Must Be Sealed - Urethanes are adhesive. To prevent adhesion between the rubber and model surface, models made of porous materials (gypsum plasters, concrete, wood, stone, etc.) must be sealed prior to applying a release agent. SuperSeal® (available from Smooth-On) or One Step® are fast drying sealers suitable for sealing porous surfaces without interfering with surface detail. Sonite Wax®or high-grade shellac is suitable for rough contours. A high quality Shellac is suitable for sealing modeling clays that contain sulfur or moisture (water based). Thermoplastics (polystyrene) must also be sealed with shellac or PVA. In all cases, the sealing agent should be applied and allowed to completely dry prior to applying a release agent.
Non-Porous Surfaces - Metal, glass, hard plastics, sulfur free clays, etc. require only a release agent.
PRODUCT OVERVIEWUsing Smooth-On’s exclusive “V-Polymer®” technology, VytaFlex® urethane rubbers offer superior physical and performance properties for casting concrete. VytaFlex® urethanes are available in 10A, 20A, 30A, 40A, 50A and 60A Shore hardness’s and feature convenient one-to-one by volume mix ratios.
Vacuum degassing is not necessary and VytaFlex® rubbers cure with negligible shrinkage to a durable rubber that will last in production.
VytaFlex® mold rubbers work especially well for casting pigmented / colored concrete. Molds made with VytaFlex® Series urethanes will render accurate and uniform colored castings.
VytaFlex® SeriesLiquid Urethane Rubbers
www.smooth-on.com
TECHNICAL OVERVIEW
Shrinkage: < .001 in./in. *All values measured after 7 days at 73°F/23°C
*Pot Life: VytaFlex® 10, 20, 30, 40: 30 minutes VytaFlex® 50, 60: 60 minutes
*Cure Time: VytaFlex® 20, 30, 40, 50, 60: Overnight/16 hours VytaFlex® 10: 24 hours
A:B
Mix
Rat
io
by V
olum
e
A:B
Mix
Rat
io
by W
eigh
t
Mix
ed V
isco
sity
(A
STM
D-2
393)
Spec
ific
Gra
vity
(g
/cc)
(AST
M D
-147
5)Sp
ecifi
c Vol
ume
(cu.
in./l
b.)
Colo
r
Shor
e A
Har
dnes
s (A
STM
D-2
240)
Tens
ile S
tren
gth
(AST
M D
-412
)
100%
Mod
ulus
(A
STM
D-4
12)
Elon
gatio
n
a
t Bre
ak %
(A
STM
D-4
12)
Die
C Te
ar S
tren
gth
(AST
M D
-624
)
VytaFlex® 10 1:1 pbv 1:1 pbw 3,100 cps 1.00 27.9 Off-White 10A 200 psi 25 1,000% 38 pli
VytaFlex® 20 1:1 pbv 1:1 pbw 1,000 cps 1.00 27.7 Clear Amber 20A 200 psi 50 1,000% 60 pli
VytaFlex® 30 1:1 pbv 1:1 pbw 1,800 cps 1.02 27.3 Off-White 30A 500 psi 65 1,000% 78 pli
VytaFlex® 40 1:1 pbv 1:1 pbw 2,000 cps 1.03 26.9 Off-White 40A 522 psi 100 660% 82 pli
VytaFlex® 50 1:1 pbv 1:1 pbw 2,000 cps 1.04 26.7 Off-White 50A 588 psi 215 400% 102 pli
VytaFlex® 60 1:1 pbv 1:1 pbw 2,000 cps 1.04 26.6 Off-White 60A 880 psi 300 480% 136 pli
PROCESSING RECOMMENDATIONS
011011-JR
Call Us Anytime With Questions About Your ApplicationToll-free: (800) 762-0744 Fax: (610) 252-6200
The new www.smooth-on.com is loaded with information about mold making, casting and more.
Applying A Release Agent - A release agent is necessary to facilitate demolding when casting into or over most surfaces. Use a release agent made specifically for mold making (Universal® Mold Release available from Smooth-On). A liberal coat of release agent should be applied onto all surfaces that will contact the rubber.
IMPORTANT: To ensure thorough coverage, lightly brush the release agent with a soft brush over all surfaces of the model. Follow with a light mist coating and let the release agent dry for 30 minutes. Because no two applications are quite the same, a small test application to determine suitability for your project is recommended if performance of this material is in question.
MEASURING & MIXING... Liquid urethanes are moisture sensitive and will absorb atmospheric moisture. Mixing tools and containers should be clean and made of metal or plastic. Materials should be stored and used in a warm environment (73°F/23°C).
IMPORTANT: Pre Mix the Part B before using. After dispensing equal amounts of Parts A and B into mixing container, mix thoroughly for at least 3 minutes making sure that you scrape the sides and bottom of the mixing container several times.
If Mixing Large Quantities (16 lbs./7 kgs. or more) at one time, use a mechanical mixer (i.e. Squirrel Mixer or equal) for 3 minutes followed by careful hand mixing for one minute as directed above. Then, pour entire quantity into a new, clean mixing container and do it all over again.
Although this product is formulated to minimize air bubbles in your the cured rubber, vacuum degassing prior to pouring rubber will further reduce entrapped air.
POURING, CURING & PERFORMANCE...For best results, pour your mixture in a single spot at the lowest point of the containment field. Let the rubber seek its level up and over the model. A uniform flow will help minimize entrapped air. The liquid rubber should level off at least 1/2” (1.3 cm) over the highest point of the model surface.
Curing - Allow rubber to cure a minimum of 16 – 24 hours at room temperature (73°F/23°C) before demolding. VytaFlex® 10 should cure for at least 24 hours before demolding. Cure time can be reduced with mild heat or by adding Smooth-On “Kick-It®” Cure Accelerator. Do not cure rubber where temperature is less than 65°F/18°C.
Post Curing - Optional . . . Following an overnight cure, heating the rubber to 150°F (65°C) for 4 to 8 hours will increase physical properties and performance.
Using The Mold - If using as a mold material, a release agent should be applied to the mold before each casting. In & Out® II Concrete Release Concentrate (available from Smooth-On) is recommended for releasing concrete.
Performance & Storage - Fully cured rubber is tough, durable and will perform if properly used and stored. The physical life of the rubber depends on how you use it.
Safety First!
The Material Safety Data Sheet (MSDS) for this or any Smooth-On product should be read prior to use and is available upon request from Smooth-On. All Smooth-On products are safe to use if directions are read and followed carefully.
Be careful.
Part A is a TDI prepolymer. Vapors, which can be significant if material is heated or sprayed, cause lung damage and sensitization. Use only with adequate ventilation. Contact with skin and eyes may cause severe irritation. Flush eyes with water for 15 minutes and seek immediate medical attention. Remove from skin with waterless hand cleaner followed by soap and water Prepolymers contain trace amounts of TDI which, if ingested, must be considered a potential carcinogen. Refer to MSDS .
Part B is irritating to the eyes and skin. If contaminated, flush eyes with water for 15 minutes and seek immediate medical attention. Remove from skin with soap and water. When mixing with Part A follow precautions for handling isocyanates.
Important: The information contained in this bulletin is considered accurate. However, no warranty is expressed or implied regarding the accuracy of the data, the results to be obtained from the use thereof, or that any such use will not infringe upon a patent. User shall determine the suitability of the product for the intended application and assume all risk and liability whatsoever in connection therewith.
IMPORTANT: Shelf life of product is reduced after opening. Remaining product should be used as soon as possible. Immediately replacing the lids on both containers after dispensing product will help prolong the shelf life of the unused product. XTEND-IT® Dry Gas Blanket (available from Smooth-On) will significantly prolong the shelf life of unused liquid urethane products.

162
Appendix E: Detailed costs associated with the novel CFRP
pressure vessels and Type IV pressure vessels The costs incurred in purchasing the raw materials essential for the manufacture of the 2mm and 4
mm CFRP pressure vessels are listed in the table below. In comparison, the costs associated
Table E1: Costs of the 2 mm CFRP pressure vessel compared to Type IV pressure vessels
Novel 2 mm pressure
vessel
Type IV 350 bar
pressure vessel [133]
Type IV 700 bar
pressure vessel [133]
Physical dimensions
Internal diameter 50 mm - -
Wall thickness 2 mm - -
Length 1 m - -
Volume 2 litres 258 litres 149 litres
Materials required
Mass of carbon fibre tow required
300 g 55 kg 69 kg
Mass of epoxy resin required 150 g 23 kg 29 kg
Rubber liner 20g - -
Costs of the materials
Carbon fibre tow per kg R775/kg R401/kg* R401/kg*
Epoxy resin per kg R272/kg R100/kg* R100/kg*
Rubber liner (VytaFlex 60) per kg R179/kg - -
End caps (material and machining included)
R110 - -
Mass of H2 stored (kg) 0.03 5.6 5.6
Total cost (R) R390 R36043* R40113*
Normalised cost (R/kg of H2) R13,000 R6,436 R7,163 *These values were quoted initially US dollars as of 2005 [133] before being converted into the SA Rand value and then inflated to match the value as of 2018. These values also roughly include the effect of inflation since the year 2015.
It should be noted that the total cost from the table above does not include the filament winding
manufacturing or labour costs for any of the three pressure vessels.
It can be seen from the table above that the Type IV pressure vessels have a normalised cost
approximately half of the cost of the 2 mm CFRP pressure vessel. This significant difference in cost is
due to the significantly dissimilar costs of the carbon fibres and epoxy resins used for the two types of
vessels. The costs of the carbon fibre as well as the epoxy resin used for the Type IV pressure vessels
are slightly higher than half of the costs pertaining to the 2 mm CFRP pressure vessel. Secondly, the
costs associated with the Type IV pressure vessel are given factoring in a production volume of 500,000

163
units which is advantageous in lowering the costs significantly as those materials can be bought in
large/bulk quantities at significant discounts [14], [64]. Thirdly, the cost of the carbon fibre used in the
construction of the novel 2 mm pressure vessel is higher because it was imported. This means that
import duty and shipping costs are also factored into the purchase price. Therefore, it is likely that the
normalised cost of the 2 mm CFRP pressure vessel may be very similar or better to that of the Type IV
pressure vessels if there were large production volumes and if the same carbon fibre and resin from
the Type IV vessel were used.