novel detection schemes of nuclear magnetic resonance and ... · of nuclear magnetic resonance and...
TRANSCRIPT

ANRV362-AC01-05 ARI 13 May 2008 7:21
Novel Detection Schemesof Nuclear MagneticResonance and MagneticResonance Imaging:Applications fromAnalytical Chemistryto Molecular SensorsElad Harel,1 Leif Schroder,1 and Shoujun Xu2
1Materials Sciences Division, Lawrence Berkeley National Laboratory,and Department of Chemistry, University of California, Berkeley, California 94720;email: [email protected]; [email protected] of Chemistry, University of Houston, Houston, Texas 77204;email: [email protected]
Annu. Rev. Anal. Chem. 2008. 1:133–163
First published online as a Review in Advance onJanuary 15, 2008
The Annual Review of Analytical Chemistry is onlineat anchem.annualreviews.org
This article’s doi:10.1146/annurev.anchem.1.031207.113018
Copyright c© 2008 by Annual Reviews.All rights reserved
1936-1327/08/0719-0133$20.00
Key Words
microfluidics, flow imaging, low field, atomic magnetometer,molecular imaging, chemical exchange saturation transfer (CEST)
AbstractNuclear magnetic resonance (NMR) is a well-established analyticaltechnique in chemistry. The ability to precisely control the nuclearspin interactions that give rise to the NMR phenomenon has led torevolutionary advances in fields as diverse as protein structure de-termination and medical diagnosis. Here, we discuss methods forincreasing the sensitivity of magnetic resonance experiments, mov-ing away from the paradigm of traditional NMR by separating theencoding and detection steps of the experiment. This added flexibil-ity allows for diverse applications ranging from lab-on-a-chip flowimaging and biological sensors to optical detection of magnetic reso-nance imaging at low magnetic fields. We aim to compare and discussvarious approaches for a host of problems in material science, biol-ogy, and physics that differ from the high-field methods routinelyused in analytical chemistry and medical imaging.
133
Click here for quick links to Annual Reviews content online, including:
• Other articles in this volume• Top cited articles• Top downloaded articles• Our comprehensive search
FurtherANNUALREVIEWS
Ann
ual R
evie
w o
f A
naly
tical
Che
mis
try
2008
.1:1
33-1
63. D
ownl
oade
d fr
om a
rjou
rnal
s.an
nual
revi
ews.
org
by e
lad
hare
l on
07/0
6/09
. For
per
sona
l use
onl
y.
ANRV362-AC01-05 ARI 13 May 2008 7:21
NMR: nuclear magneticresonance
MRI: magnetic resonanceimaging
Remote detection: generalmethodology in whichencoding and detectionoccur in different physicalor molecular environments
1. INTRODUCTION
Although nuclear magnetic resonance (NMR) is perhaps the most powerful analyticalmethod in chemistry, its usefulness is limited in many applications by poor sensitiv-ity. As a general rule, approximately 1015–1018 spins are needed for an inductivelydetectable signal at high magnetic field strengths. This is mainly due to the verysmall nuclear magnetic moment relative to kBT at room temperature. Consequently,NMR is performed on relatively large samples a few cubic centimeters in volume;for magnetic resonance imaging (MRI), the sample is typically several hundred cubiccentimeters. Much of the work on magnetic resonance over the past 60 years hasgone into combating this very problem, as the rewards for doing so are far-reaching.
High-resolution one-dimensional NMR is an everyday tool of the organic chemist(1). Multidimensional NMR allows for the structural determination of proteins insolution (2). MRI is one of the most valuable diagnostic tools available in medicine(3) and materials characterization (4).
Here, we describe a very general method, which we call remote detection, forincreasing the sensitivity in NMR or MRI experiments; this method is applicablewhen excitation and detection can be separated in some manner. This process mayinvolve actual physical separation of these stages of the experiment, or it may involvea chemical exchange in which information about a species in one environment isdetected by examination of it in another.
First, we give a general overview of the concept. We then provide examples of themethodology’s utility in various applications, including materials characterization,flow imaging, lab-on-a-chip devices, analytical chemistry, solid-state NMR, low-fieldMRI, optical detection of NMR and MRI, and biological sensors.
2. TRADITIONAL NUCLEAR MAGNETIC RESONANCE
The phenomenon of NMR is based on the interaction between an external magneticfield and the nonzero nuclear spin of certain atomic isotopes (5); this is known asthe Zeeman interaction. This interaction splits otherwise degenerate energy levelsand is responsible for the NMR spectrum. For molecules, the orbiting electrons ofnearby atoms slightly alter the magnetic field felt by the nuclear spin. The resultingchemical shift can only be observed at very high magnetic fields and under conditionsof extremely high field homogeneity. These opposing experimental conditions areresponsible for the very high costs and maintenance associated with high-field NMR.Other interactions between nuclear spins that are independent of the magnetic fieldstrength, the so-called indirect interactions, give rise to J-couplings and raise thepossibility of multidimensional NMR, which would allow unambiguous assignmentof peaks through a network of coupled spins. The power of NMR is in its ability toprecisely control these spin interactions and to observe them by applying sequencesof accurately timed radio frequency (rf) pulses and magnetic field gradients.
Such rf pulse sequences have been the focus of a tremendous amount of researchsince pulsed NMR was first proposed nearly 30 years ago (6). In pulsed NMR, the spinsare encoded into the desired quantum mechanical state. Detection is accomplished bythe reverse process, whereas a changing magnetization resulting from the ensemble
134 Harel · Schroder · Xu
Ann
ual R
evie
w o
f A
naly
tical
Che
mis
try
2008
.1:1
33-1
63. D
ownl
oade
d fr
om a
rjou
rnal
s.an
nual
revi
ews.
org
by e
lad
hare
l on
07/0
6/09
. For
per
sona
l use
onl
y.

ANRV362-AC01-05 ARI 13 May 2008 7:21
Effective transverserelaxation: spin dephasingin the transverse plane dueto the combined effects ofspin-spin interactions andmagnetic fieldinhomogeneities
Time of flight (TOF):time needed for an encodedspin to reach the detectionregion
FID: free induction decay
spin state is converted into a small but detectable electronic signal. Typically, encodingand detection are performed with a single rf coil, which surrounds the sample ofinterest. The coil may be ideal for encoding but will suffer drastically for detectionif the region of interest is small in comparison to the coil (7). This is often thecase for heterogeneous samples, including organs of the body, porous materials, andmicrofluidic devices. This restriction may also apply in the case of a very dilutechemical species surrounded by a large solvent bath, in which the former is difficultto detect.
3. REMOTE DETECTION BASICS
The first modality of remote detection that we discuss challenges this paradigm byphysically separating the encoding and detection steps of an NMR pulse sequenceso as to optimize each step individually. In remote detection NMR, a large rf coilencompasses the sample while a smaller coil concentrates the signal for more efficientand sensitive detection (8, 9). This separation allows for the possibility of moving awayfrom inductive detection altogether and implementing optical detection and othernoninductive schemes (discussed below). Regardless of the detection modality, theprinciple of separate encoding and decoding remains the same.
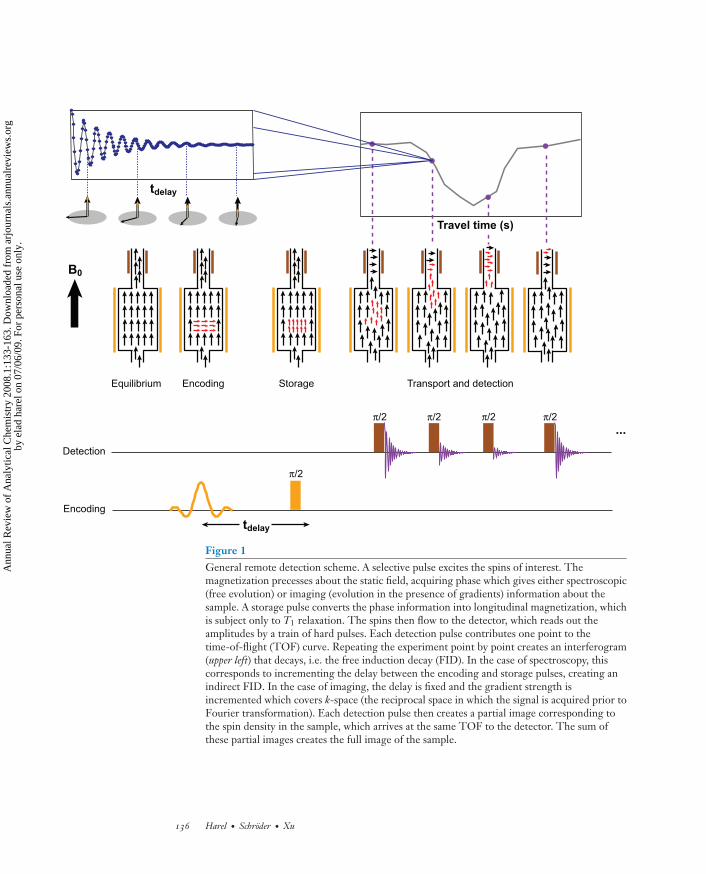
Figure 1 illustrates a generic remote detection scheme. At equilibrium the nuclearspins align in the direction of the static field. A selective pulse excites the spinsaccording to their location in space or chemical shift or both. As in any other NMR orMRI pulse sequence, the spins experience either free evolution or evolution accordingto a well-defined sequence of rf and gradient pulses, which places the magnetizationinto a certain desired state. In traditional magnetic resonance experiments, readoutis performed at this junction. In remote detection, the phase of the spins in thetransverse plane must be stored along the longitudinal direction so as to be affectedonly by spin-lattice relaxation, T1. Because T1 is typically much longer than T2
∗ , theeffective transverse relaxation time, the spins can effectively flow out to the detectorbefore an irreversible loss in signal occurs. At the detection stage, readout of thestored magnetization provides information about the phase, which in turn providesa complete description of the desired spin state (as in traditional NMR). Becausethe detector typically has a smaller volume than the encoding volume, several pulsesare needed to completely detect the encoded magnetization. This results in a travelcurve, which measures the time of flight (TOF) of encoded spins to the detector.
Because the first spins to arrive are typically unencoded, the signal is at a maximumvalue. As encoded spins arrive they mix with unencoded spins, causing a decrease inthe overall signal that can be observed by a dip in the TOF curve. As the encodedspins leave the detector, the signal is restored. The conventional time dimension isno longer available as the direct dimension because the encoding coil is used onlyto manipulate the magnetization, so encoding must proceed point by point. Forexample, a free induction decay (FID) is usually measured by exciting the spins intothe transverse plane and then acquiring the signal over time. In remote, points alongthe FID are recorded by delaying the time between the storage and detection pulses.Each point in the travel curve thus contributes one point to the indirect interferogram
www.annualreviews.org • Novel Detection Schemes of NMR and MRI 135
Ann
ual R
evie
w o
f A
naly
tical
Che
mis
try
2008
.1:1
33-1
63. D
ownl
oade
d fr
om a
rjou
rnal
s.an
nual
revi
ews.
org
by e
lad
hare
l on
07/0
6/09
. For
per
sona
l use
onl
y.
ANRV362-AC01-05 ARI 13 May 2008 7:21
B0
Equilibrium Encoding Storage Transport and detection
tdelay
Travel time (s)
π/2
π/2
π/2 π/2...
Encoding
Detection
π/2
tdelay
Figure 1General remote detection scheme. A selective pulse excites the spins of interest. Themagnetization precesses about the static field, acquiring phase which gives either spectroscopic(free evolution) or imaging (evolution in the presence of gradients) information about thesample. A storage pulse converts the phase information into longitudinal magnetization, whichis subject only to T1 relaxation. The spins then flow to the detector, which reads out theamplitudes by a train of hard pulses. Each detection pulse contributes one point to thetime-of-flight (TOF) curve. Repeating the experiment point by point creates an interferogram(upper left) that decays, i.e. the free induction decay (FID). In the case of spectroscopy, thiscorresponds to incrementing the delay between the encoding and storage pulses, creating anindirect FID. In the case of imaging, the delay is fixed and the gradient strength isincremented which covers k-space (the reciprocal space in which the signal is acquired prior toFourier transformation). Each detection pulse then creates a partial image corresponding tothe spin density in the sample, which arrives at the same TOF to the detector. The sum ofthese partial images creates the full image of the sample.
136 Harel · Schroder · Xu
Ann
ual R
evie
w o
f A
naly
tical
Che
mis
try
2008
.1:1
33-1
63. D
ownl
oade
d fr
om a
rjou
rnal
s.an
nual
revi
ews.
org
by e
lad
hare
l on
07/0
6/09
. For
per
sona
l use
onl
y.
ANRV362-AC01-05 ARI 13 May 2008 7:21
Hyperpolarization:polarization of spin statesthat significantly exceeds thestate populations given bythe Boltzmann distribution
EPI: echo planar imaging
(e.g., FID) built up by repeating the remote experiment, each time with a differentindirect point (e.g., time delay). In the following sections we illustrate these ideasmore concretely with several examples.
3.1. Gas Flow Imaging in Porous Materials
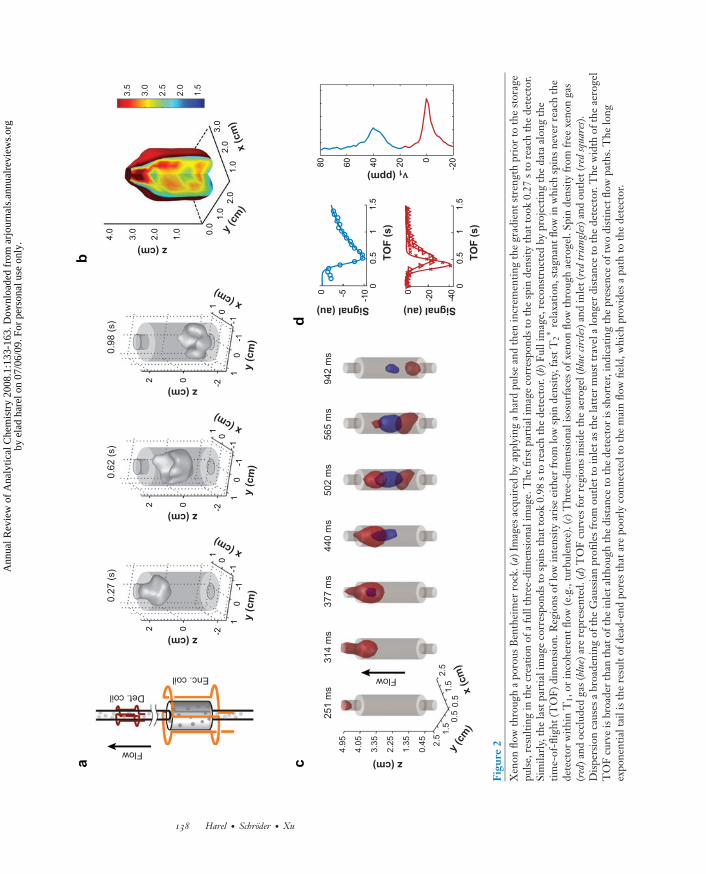
Figure 2a,b illustrates the results of a remote experiment using hyperpolarized xenongas flowing through a porous rock (10). Optical pumping methods allow thermallypolarized xenon to be enhanced from a thermal polarization of about 10−5 to 2–5%(11, 12), which corresponds to an increase in sensitivity of over three orders of magni-tude. The increased sensitivity allows gas mixtures containing xenon to be visualizedwith MRI even though the density of the gas is much lower than that of a liquid. Forapplications related to crude oil recovery, pore-level structural determination, andmaterials characterization, gas flow imaging is critical (13). The images in Figure 2were obtained using a simple phase-encoding scheme applied to xenon gas flowingthrough a Bentheimer sandstone rock with a porosity of about 22.5% and pore sizeof approximately 100 μm.
The entire data set consists of the spatial dimensions and the additional TOFdimension. Projecting along the TOF dimension provides the full three-dimensionalimage as shown in Figure 2b. Cutting a wedge out of the data set reveals flow inho-mogeneities, such as regions of spins that rapidly dephase either because of incoherentflow or T2
∗ relaxation or because of static spins that never reach the detector withinthe T1 relaxation time of the gas. A direct image would show such inhomogeneities inthe former case, but not the latter. Thus, by comparison with direct imaging, insightsinto the flow can be elucidated.
Notably, the partial images corresponding to different points along the TOF di-mension are not real-time images of the flow as in fast, direct imaging sequences suchas echo planar imaging (EPI) (14). Rather, they are a spatial representation of spinsthat take an equal amount of time to reach the detection region. Remote detection,therefore, is much more similar to chromatography used in chemical analysis. As aresult, the first images represent spins that typically initiate from the outlet region andthat take the least amount of time to reach the detection region. Later TOF valuescorrespond to spins that take longer to reach the detector. Therefore, the geometry ofthe sample plays an important role in determining the spatial profiles of each partialimage, as it determines to a large degree the necessary flow path for a given packetof encoded spins.
In this example, investigators utilized hyperpolarized xenon to trace gas flowthrough a porous material. However, xenon has another remarkable property in ad-dition to its ability to become highly polarized: It displays a wide range of chemicalshifts that are very sensitive to the chemical or physical environment (15). ProtonNMR exhibits a chemical shift range of about 8 ppm. Xenon, on the other hand, canexhibit a range of more than 7000 ppm arising from its highly polarizable electroncloud. In nanoporous materials such as silica aerogel, xenon shows a chemical shiftrange of up to ∼120 ppm depending on the size of the pore within which it is enclosed(16). In the large macropores of the aerogel, the xenon chemical shift approximates
www.annualreviews.org • Novel Detection Schemes of NMR and MRI 137
Ann
ual R
evie
w o
f A
naly
tical
Che
mis
try
2008
.1:1
33-1
63. D
ownl
oade
d fr
om a
rjou
rnal
s.an
nual
revi
ews.
org
by e
lad
hare
l on
07/0
6/09
. For
per
sona
l use
onl
y.
ANRV362-AC01-05 ARI 13 May 2008 7:21
1.5
2.0
2.5
3.0
3.5
z (cm)
y (c
m)
x (c
m)
1.0
2.0
3.0
1.0
2.0
0.0
1.0
2.0
3.0
4.0
ab
Flow0.
62 (
s)
0.98
(s)
0.
27 (
s)
z (cm)
y (c
m)
y (c
m)
y (c
m)
2 0 -2
01
-1
1
-10
x (cm)
z (cm) 2 0 -2
01
-1
1
-10
x (cm)
z (cm) 2 0 -2
01
-1
1
-10
x (cm)
Enc. coil
Det. coil
cd
251
ms
314
ms
377
ms
440
ms
502
ms
565
ms
942
ms
z (cm)
x (c
m)
y (c
m)
Flow
4.95
4.05
3.35
2.25
1.35
0.45 2.
52.
51.
51.
50.
50.
5
00.
51
1.5
-10-50
Signal (au)
TO
F (
s)
00.
51
1.5
-40
-200
Signal (au)
TO
F (
s)
80 60 40 20 0
-20
νν1(ppm)
Figu
re2
Xen
onflo
wth
roug
ha
poro
usB
enth
eim
erro
ck.(
a)Im
ages
acqu
ired
byap
plyi
nga
hard
puls
ean
dth
enin
crem
entin
gth
egr
adie
ntst
reng
thpr
ior
toth
est
orag
epu
lse,
resu
lting
inth
ecr
eatio
nof
afu
llth
ree-
dim
ensi
onal
imag
e.T
hefir
stpa
rtia
lim
age
corr
espo
nds
toth
esp
inde
nsity
that
took
0.27
sto
reac
hth
ede
tect
or.
Sim
ilarl
y,th
ela
stpa
rtia
lim
age
corr
espo
nds
tosp
ins
that
took
0.98
sto
reac
hth
ede
tect
or.(
b)Fu
llim
age,
reco
nstr
ucte
dby
proj
ectin
gth
eda
taal
ong
the
time-
of-fl
ight
(TO
F)di
men
sion
.Reg
ions
oflo
win
tens
ityar
ise
eith
erfr
omlo
wsp
inde
nsity
,fas
tT2∗
rela
xatio
n,st
agna
ntflo
win
whi
chsp
ins
neve
rre
ach
the
dete
ctor
with
inT
1,or
inco
here
ntflo
w(e
.g.,
turb
ulen
ce).
(c)T
hree
-dim
ensi
onal
isos
urfa
ces
ofxe
non
flow
thro
ugh
aero
gel.
Spin
dens
ityfr
omfr
eexe
non
gas
(red
)and
occl
uded
gas
(blu
e)ar
ere
pres
ente
d.(d
)TO
Fcu
rves
for
regi
ons
insi
deth
eae
roge
l(bl
uecir
cles)
and
inle
t(re
dtr
iang
les)
and
outle
t(re
dsq
uare
s).D
ispe
rsio
nca
uses
abr
oade
ning
ofth
eG
auss
ian
profi
les
from
outle
tto
inle
tas
the
latt
erm
ustt
rave
lalo
nger
dist
ance
toth
ede
tect
or.T
hew
idth
ofth
eae
roge
lT
OF
curv
eis
broa
der
than
that
ofth
ein
leta
lthou
ghth
edi
stan
ceto
the
dete
ctor
issh
orte
r,in
dica
ting
the
pres
ence
oftw
odi
stin
ctflo
wpa
ths.
The
long
expo
nent
ialt
aili
sth
ere
sult
ofde
ad-e
ndpo
res
that
are
poor
lyco
nnec
ted
toth
em
ain
flow
field
,whi
chpr
ovid
esa
path
toth
ede
tect
or.
138 Harel · Schroder · Xu
Ann
ual R
evie
w o
f A
naly
tical
Che
mis
try
2008
.1:1
33-1
63. D
ownl
oade
d fr
om a
rjou
rnal
s.an
nual
revi
ews.
org
by e
lad
hare
l on
07/0
6/09
. For
per
sona
l use
onl
y.

ANRV362-AC01-05 ARI 13 May 2008 7:21
that of the free gas, which is 0 ppm. In the mesoporous region, at about 20–30 nm, thexenon chemical shift measures ∼38 ppm at room temperature (17). The correlationbetween chemical shift and pore size allows MRI to indirectly probe the nanoporousenvironment of the aerogel even when the actual MRI spatial resolution is severalorders of magnitude lower than that needed to resolve the pore structure directly.
Radio frequency pulses can easily tag one spin species over another at large fre-quency separations by employing short bandwidth pulses. Figure 2c,d illustrates theresults of two experiments of xenon gas flow through aerogel, each selecting a differ-ent resonance peak (18). The flow of the free gas (0 ppm) can thus be distinguishedfrom the flow of the occluded gas (38 ppm).
Dispersion can be described in either the spatial domain or the time domain (19).In the former, the spreading of a fluid in a given time interval is measured, whereasin the latter, the arrival time distribution of a tagged fluid is examined. In remotedetection, this time distribution is represented by the TOF curve, the width of whichis a measure of dispersion. If we assume that the flow in an unrestricted geometryis described by a normal distribution, then we can assign a width and mean time foreach voxel in the image. The fit of a normal distribution to the TOF curve is fairlygood, validating this approximation. Mathematically, we have
s (t, r) = s0(r)�t exp(−(t − t0(r))2/2σ (r)2)/√
2πσ (r). (1)
Therefore, σ (r) and t0(r) can be assigned to each position r. For voxels inside theaerogel itself, however, this model no longer applies. Instead, we find that a Gaussianconvoluted with an exponential decay accurately models the TOF curves. Once again,we can assign σ (r) and t0(r) to each position r. Additionally, we can assign a timeconstant τ (r) to yield a measure of how well the occluded gas is connected to themain flow field, which provides a coherent path to the detection region. Therefore,by selecting each peak separately we are able to identify two completely separateflow paths and image each individually with a high time resolution (Figure 2c). Thephysical explanation for this observation is that the xenon inside the small mesoporesof the aerogel is not well connected to the main flow field, most likely due to thepresence of dead-end pores inside the sample.
Unlike other methods that identify porosity (20), pore-size distribution (21, 22),and other bulk values, remote detection flow imaging provides material hetero-geneities. That is, material properties can be measured for each voxel in the image. Itshould be noted that, even in principle, optical techniques could never perform suchan experiment because the occluded and free gas have identical physical properties.Furthermore, many samples of interest are opaque and thus inaccessible to opticalwavelengths. Numerous porous materials show a large chemical shift range for xenon(23) and are amenable to these methods.
3.2. Lab-on-a-Chip: Imaging and Spectroscopy
As a noninvasive spectroscopic technique, NMR presents an attractive complemen-tary approach to optics-based detection methods for lab-on-a-chip devices (24).Microfluidics shows great promise in the fields of biology, chemistry, and physics
www.annualreviews.org • Novel Detection Schemes of NMR and MRI 139
Ann
ual R
evie
w o
f A
naly
tical
Che
mis
try
2008
.1:1
33-1
63. D
ownl
oade
d fr
om a
rjou
rnal
s.an
nual
revi
ews.
org
by e
lad
hare
l on
07/0
6/09
. For
per
sona
l use
onl
y.
ANRV362-AC01-05 ARI 13 May 2008 7:21
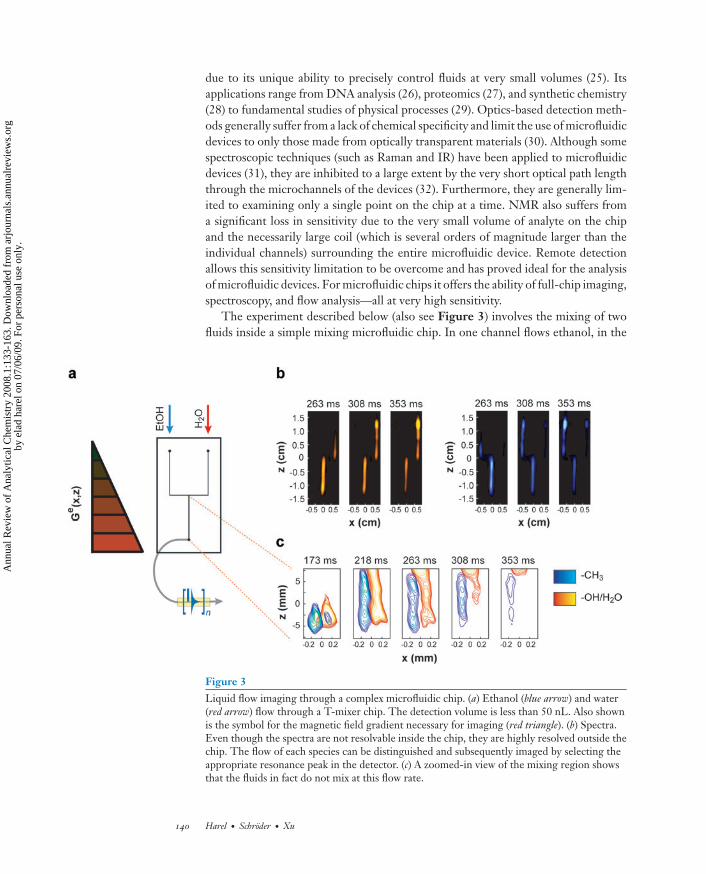
due to its unique ability to precisely control fluids at very small volumes (25). Itsapplications range from DNA analysis (26), proteomics (27), and synthetic chemistry(28) to fundamental studies of physical processes (29). Optics-based detection meth-ods generally suffer from a lack of chemical specificity and limit the use of microfluidicdevices to only those made from optically transparent materials (30). Although somespectroscopic techniques (such as Raman and IR) have been applied to microfluidicdevices (31), they are inhibited to a large extent by the very short optical path lengththrough the microchannels of the devices (32). Furthermore, they are generally lim-ited to examining only a single point on the chip at a time. NMR also suffers froma significant loss in sensitivity due to the very small volume of analyte on the chipand the necessarily large coil (which is several orders of magnitude larger than theindividual channels) surrounding the entire microfluidic device. Remote detectionallows this sensitivity limitation to be overcome and has proved ideal for the analysisof microfluidic devices. For microfluidic chips it offers the ability of full-chip imaging,spectroscopy, and flow analysis—all at very high sensitivity.
The experiment described below (also see Figure 3) involves the mixing of twofluids inside a simple mixing microfluidic chip. In one channel flows ethanol, in the
Figure 3Liquid flow imaging through a complex microfluidic chip. (a) Ethanol (blue arrow) and water(red arrow) flow through a T-mixer chip. The detection volume is less than 50 nL. Also shownis the symbol for the magnetic field gradient necessary for imaging (red triangle). (b) Spectra.Even though the spectra are not resolvable inside the chip, they are highly resolved outside thechip. The flow of each species can be distinguished and subsequently imaged by selecting theappropriate resonance peak in the detector. (c) A zoomed-in view of the mixing region showsthat the fluids in fact do not mix at this flow rate.
140 Harel · Schroder · Xu
Ann
ual R
evie
w o
f A
naly
tical
Che
mis
try
2008
.1:1
33-1
63. D
ownl
oade
d fr
om a
rjou
rnal
s.an
nual
revi
ews.
org
by e
lad
hare
l on
07/0
6/09
. For
per
sona
l use
onl
y.
ANRV362-AC01-05 ARI 13 May 2008 7:21
other flows water. As mentioned above, the chemical shift range of protons is rathersmall, thus magnetic field homogeneity is critical. Unfortunately, the interface be-tween the glass and fluid causes severe local magnetic field gradients because of thedifference in magnetic susceptibility between the different materials and their geom-etry (33). This effectively makes resolving the chemical shifts of the different speciesimpossible directly on the chip. Although there may be methods of overcoming thislimitation, such as using susceptibility-matched materials, they are not applicable toexisting microfluidic chip designs.
Remote detection can circumvent this inhomogeneity problem. Once the fluidsexit the chip and pass through the small solenoid detection coil, the spectrum is highlyresolvable (34). For this particular chip, the resolution decreases from 5 kHz to lessthan 50 Hz upon exiting the chip—an improvement of two orders of magnitude.This allows the flow of each species to be resolved even when the chemical shift is notdirectly resolvable. In this way, any number of species can be resolved and imaged ina single experiment as long as the residence time in the detection coil is long enoughto resolve the peaks.
Furthermore, unlike other methods that perform NMR on a chip, remote detec-tion is capable of imaging the entire chip or a section thereof with very high sensitivity.Direct NMR-on-a-chip methods fabricate the detection coil directly onto the chip,greatly enhancing sensitivity (35). However, this means that only a few coils can beplaced on the chip at once as their fingerprint is rather large (>1 mm in diameter); fur-thermore, the chip fabrication must be significantly altered. Again, magnetic suscep-tibility becomes a major problem as the addition of a new element, the copper surfacecoil, creates severe magnetic field distortions. Additionally, this method is not compat-ible with most of the chip fabrication techniques already in place. Nonetheless, NMRon a chip, whether remote or direct, promises to become a growing area of research.
3.3. Solid-State Nuclear Magnetic Resonance
So far we have discussed enhancing the detection sensitivity of liquid samples. It is alsopossible to employ a type of remote detection for very high sensitivity detection ofsolid samples. Due to the dipolar interaction between spins, which are averaged awayin isotropic samples, NMR spectra of solids are very broad unless spun at the “magic”angle, θ ∼ 54.7◦. This is because of the dominant term in the dipolar Hamiltonian,which has the form (3 cos2 θ − 1), where θ is the angle between the internuclear vectorand the external field. Magic angle spinning, which averages away these broadeningterms, does have a drawback: The spinning rotor needed to hold the sample is largecompared to mass-limited samples. The solution to this problem has been demon-strated in an experiment by Sakellariou et al. (36) in which two coils were used, a staticcoil for sample spin manipulation and detection that was inductively coupled to a verysensitive microcoil wrapped directly around a glass capillary containing the sample.Susceptibility problems were eliminated due to the presence of coil material and sam-ple interface in liquid microcoil designs (37). This method has important applicationsto the analysis of biological tissue, organic powders, and radioactive material.
www.annualreviews.org • Novel Detection Schemes of NMR and MRI 141
Ann
ual R
evie
w o
f A
naly
tical
Che
mis
try
2008
.1:1
33-1
63. D
ownl
oade
d fr
om a
rjou
rnal
s.an
nual
revi
ews.
org
by e
lad
hare
l on
07/0
6/09
. For
per
sona
l use
onl
y.

ANRV362-AC01-05 ARI 13 May 2008 7:21
3.4. Perspectives and In Vivo Applications
Remote detection, which was initially utilized solely to enhance sensitivity, is a verypowerful method for elucidating the fluid flow properties of porous materials. Addingspectroscopy in the encoding and detection regions allows the applicability of thismethod to a large class of systems, from porous rocks and nanoporous materials tomicrofluidics. In vivo applications, where spins are excited in the brain and detectedin the jugular where the blood collects, may also be possible (38). Such applicationswould allow much higher sensitivity imaging in regions of the brain far below thesurface of the skull where the head coil is most insensitive. Furthermore, such amodality would allow for optical detection of the NMR signal and, possibly, low-field encoding (see Figure 4 for an illustration of this potential medical application).Because flow is ubiquitous in nature, NMR remote detection may also be applicableto many other systems of biological significance, including diffusion across biologicalmembranes and the study of protein/ligand binding events.
In the following section, we provide an overview of another remote detectionmethod in which chemical exchange replaces the physical transport of a fluid, as inthe applications described earlier. This method has very important implications formolecular and biological sensors.
Figure 4Potential in vivo applications of remote detection. Although magnetic resonance imaging(MRI) offers very high resolution images of the brain, it suffers from a severe lack of sensitivityof regions buried deep inside the brain. Such regions, however, are critically important instroke and other diseases. Coil sensitivity falls steeply with the distance of the coil to theregion of interest. Blood flow in the brain, however, transfers blood from most regions of thebrain and collects at the jugular vein near the surface of the neck where a sensitive neck coilcould potentially be positioned for an increase in sensitivity. This may provide a modality forvery high resolution imaging in regions not currently accessible by current MRI methods.Detection could also proceed by optical detection which would measure the magnetic flux ofthe encoded blood.
142 Harel · Schroder · Xu
Ann
ual R
evie
w o
f A
naly
tical
Che
mis
try
2008
.1:1
33-1
63. D
ownl
oade
d fr
om a
rjou
rnal
s.an
nual
revi
ews.
org
by e
lad
hare
l on
07/0
6/09
. For
per
sona
l use
onl
y.

ANRV362-AC01-05 ARI 13 May 2008 7:21
Molecular imaging:illustrates the spatialdistribution of specificmolecules of biochemicalrelevance
CEST: chemical exchangesaturation transfer
4. INDIRECT NUCLEAR MAGNETIC RESONANCEDETECTION BASED ON CHEMICAL EXCHANGE
Biomedical NMR applications require enhanced sensitivity for diagnostic purposes inthe rapidly expanding field of molecular imaging. In this context, a special version ofremote detection comes into play. The inherently low sensitivity of NMR limits thedetection of molecules (other than water) for imaging in order to reveal biochemicalabnormalities at very early stages of diseases. Hence, proton MRI currently is notthe first choice for molecular imaging (39). To expand the capabilities of biomedicalNMR, the problem of sensitivity can be tackled by indirect detection methods thatrely on chemical exchange of selectively saturated magnetization. This is, in principle,an in situ version of remote detection that separates the molecular environment of thedetection from the encoded molecular information. There are two ways to implementthis approach in order to significantly amplify the signal from a low-concentrationtarget molecule: either via exchange with a huge reservoir of thermally polarizedspins, or by using a reservoir of only medium size that is, however, hyperpolarized.
Historically, the thermal polarization method was first realized by using chemicalexchange saturation transfer (CEST) (40) to detect exchangeable protons of the OH,NH2, and NH groups of several sugars, amino acids, nucleosides, and other com-pounds after selective saturation (i.e., depletion of the magnetization) at 1–6.5 ppmdownfield of the water resonance and subsequently observing changes in the abundantwater signal. An expansion of the concept involving xenon gas that was hyperpolarizedthrough laser polarization was presented recently (41) and differs from the formermethod in various aspects (discussed below).
Both concepts have the following principle in common: The chemical exchange incombination with adjustable, selective rf pulses allows detection of information fromthe molecular species at low concentration by encoding it in a way that enables remoteamplification, resulting in a high-intensity signal (Figure 5a). Whereas conventionaldetection acts like a snapshot technique, reading only signal from the few nucleithat are actually bound to the target molecule, the CEST approach involves manyhundreds to thousands of participating nuclei per second at each exchange site in thelabeling process and thus “stores” the preamplified information.
4.1. Theory of the Chemical Exchange Saturation TransferEnhancement Method
The basic idea of the CEST technique was first demonstrated in a double resonanceexperiment by Forsen & Hoffman (42) in a study of the chemical exchange betweentwo compounds of similar concentration. The authors analyzed their data based ondifferential equations describing the dynamics of a two-site exchange system as pro-posed by McConnell in terms of modified Bloch equations (43). The detection poolis denoted by index d and parameters of the saturated pool are indexed s; the observedlongitudinal magnetization, Md
z , decreases upon irradiation on the frequency of Msz .
The parameters to quantify the chemical exchange are the lifetimes τ d and τ s of theexchangeable nuclei in the two environments. Under the assumption of achieving
www.annualreviews.org • Novel Detection Schemes of NMR and MRI 143
Ann
ual R
evie
w o
f A
naly
tical
Che
mis
try
2008
.1:1
33-1
63. D
ownl
oade
d fr
om a
rjou
rnal
s.an
nual
revi
ews.
org
by e
lad
hare
l on
07/0
6/09
. For
per
sona
l use
onl
y.

ANRV362-AC01-05 ARI 13 May 2008 7:21
Mz,0d
2.02.53.03.54.04.55.05.56.06.57.07.58.0
CESTsaturation
Chemical shift (ppm)
Detection
Referencesaturation
6.06.26.46.66.87.0
Encoding
0 2 4 6 8 100
2
4
6
8
10
Ob
serv
ed s
ign
al (
a.u
.)
Saturation time (s)
0 2 4 6 8 100.0
0.1
0.2
0.3
0.4
0.5
0.6
PT
R
Saturation time (s)
b c
a
τd
T1d
Decrease due toreduced saturation
Mz,0sαksd
Mz,0d
Time constant:τ = 1/(R + k )1
d dssat
(k + R )ds1d
Mz,0d
Figure 5(a) Schematics of thechemical exchangesaturation transfer (CEST)method using molecularseparation of encoding anddetection for significantsignal amplification. Theresonance of the detectionmolecule at highconcentration (in this case,water) is observed afteroff-resonance saturation(blue spectrum) and afteron-resonance saturation (redspectrum) of a highly dilutedCEST agent. (b) Decreasein the observed signalassigned to Md
0 , assumingcomplete saturation of Ms
z .The time constant τ sat andthe amplitude of the newsteady-state magnetizationare determined by thelongitudinal relaxation rateR d
1 = 1/T d1 and the
exchange rate from thedetection pool into thesaturation pool, kds = 1/τ d .(c) Proton transfer ratio(PTR) from the data in(b) assuming an incompletesaturation with α = 0.8.
Spillover effect: unwanteddirect saturation of a spinensemble while saturatinganother spin ensemble atdifferent resonancefrequency
PTR: proton transfer ratio
Msz = 0 instantaneously, the new equilibrium of Md
z is reached in a monoexponentialdecay (Figure 5b).
An important precondition for CEST is that the saturation field be selectiveenough to neglect direct saturation of Md
z . The first papers on CEST illustrated theso-called spillover effect of the detected water resonance at 4.7 ppm in so-calledz-spectra (42, 44), which allow a comparison of the desired saturation effect at4.7 ppm + δ with a control signal after saturation at 4.7 ppm – δ. Although protonCEST experiments deal with chemical shift differences of at least 300 Hz, pulsedrf signals have a non-negligible minimum bandwidth. Therefore, their amplitudeis adjusted to minimize spillover effects. Realistic conditions are given by the weaksaturation pulse approximation that allows for incomplete (but still instantaneous)saturation of Ms
z . For this purpose, the concept of the proton transfer ratio (PTR) (45)
144 Harel · Schroder · Xu
Ann
ual R
evie
w o
f A
naly
tical
Che
mis
try
2008
.1:1
33-1
63. D
ownl
oade
d fr
om a
rjou
rnal
s.an
nual
revi
ews.
org
by e
lad
hare
l on
07/0
6/09
. For
per
sona
l use
onl
y.

ANRV362-AC01-05 ARI 13 May 2008 7:21
was introduced, which includes the saturation efficiency α of the saturated resonanceto modify the above-mentioned signal change (Figure 5c). Theoretical analysis ofthe underlying dynamics of CEST agents (45) yields:
PTR ≡ Mdz,0 − Md
z (t)Md
z,0= αk sd Ms
z,0
(kds + R d1 )Md
z,0
(1 − e−(kds +R d
1 )t)
. (2)
The time constant for the exponential behavior of both parameters is still 1/τsat. Themagnetizations Md
z (t) and Mdz,0 are determined from the signal intensities with on-
and off-resonant saturation and subsequent correction of so-called magnetic transfer(MT) effects that possibly overlap with the CEST effect (46, 47) (see Figure 6a).Equation 2 shows that the PTR is directly proportional to the concentration of the
1000 800 600 400 200 0 -200 -400 -600 -800 -10000.0
0.2
0.4
0.6
0.8
1.0
-δ+δ
No
rmal
ized
ob
serv
ed s
ign
al M
d z/M
d z,0
No
rmal
ized
ob
serv
ed s
ign
al M
d z/M
d z,0
Saturation frequency offset (Hz)
-15,000-10,000-50000500010,00015,0000.0
0.2
0.4
0.6
0.8
1.0
Saturation frequency offset (Hz)
HYPER-CEST at 7.05 T PARACEST at 4.7 T PARACEST at 7.05 T
ba
Pure MT componentfrom solid-like pool
No spillover, no MTWith spillover, no MTNo spillover, with MT
Figure 6(a) Schematic representation of z-spectra for different scenarios of chemical exchangesaturation transfer (CEST) with thermally polarized protons and no chemical shift reagents.Low saturation powers (black curve) yield profiles with one sharp peak at the resonance of theCEST agent (+δ) and one peak for direct water saturation with no spillover effect observed at–δ. Higher saturation powers (red curve) increase the saturation bandwidths and lead tounwanted saturation at –δ. Magnetic transfer (MT) effects can yield an additional signaldecrease that must be separated from the CEST effect. Such MT effects are only relevant inthe presence of a solid-like spin ensemble, such as immobilized water in vivo (dashed resonanceprofile), which causes an extremely broad dip in z-spectra. For further details, see References46 and 47. (b) z-spectra comparing a paramagnetic CEST (PARACEST) agent at 4.7 T(schematic representation according to results in Reference 55) with hyperpolarized xenonCEST (HYPER-CEST) of a functionalized xenon biosensor at 7.05 T. Both show frequencyseparations from the detection signal on the order of 10 kHz, but PARACEST is related tofast exchange, thus showing broad dips in the saturation profiles. The spillover effect, around–10 kHz, is negligible for both agents. Simulation of the PARACEST spectrum for 7.05 Tshows a better separation of the two saturation dips. However, the HYPER-CEST profile isstill sharper.
www.annualreviews.org • Novel Detection Schemes of NMR and MRI 145
Ann
ual R
evie
w o
f A
naly
tical
Che
mis
try
2008
.1:1
33-1
63. D
ownl
oade
d fr
om a
rjou
rnal
s.an
nual
revi
ews.
org
by e
lad
hare
l on
07/0
6/09
. For
per
sona
l use
onl
y.
ANRV362-AC01-05 ARI 13 May 2008 7:21
APT: amide proton transfer
saturated pool. α is defined via the power ω1 = γB1 of the saturation pulse in Hzand two parameters p and q that take transverse and longitudinal relaxation effectsinto account (for details, see Reference 48):
α = ω21
ω21 + pq
. (3)
Hence, powers must be adjusted to minimize the relevance of pq and to achieve α → 1(full saturation). One important contribution to incomplete saturation is exchange-line broadening that reduces T2 and increases p.
4.2. Diamagnetic Chemical Exchange Saturation TransferAgents and Applications
CEST experiments using thermally polarized protons can be divided into two groups:diamagnetic CEST (DIACEST) and paramagnetic CEST (PARACEST). The firstgroup represents the “classic” CEST agents that contain no paramagnetic shiftreagent. Several kinds of biochemical compounds were studied and yielded differentsignal enhancements due to various exchange characteristics. As seen in Equation 3,a high exchange rate kds and a slow (long) T1 relaxation are favorable to achievinga high PTR. Hence, such experiments are predestined for high magnetic fields toassure both small R d
1 = 1/T d1 and large chemical shift separation. The first CEST
candidates investigated by Ward and colleagues were studied at concentrations be-tween 62.5 mM and 250 mM to achieve saturations between 10–67% of the 111-Mwater proton signal (40). The enhancement of, for instance, barbituric acid underphysiological conditions (pH = 7.4, T = 37◦C) was quantified as 264-fold and usedfor demonstration of pH-sensitive imaging. Because the contrast depends on bothconcentration and the pH-adjustable exchange rate, Balaban and colleagues later in-troduced a method using agents with more than one type of exchangeable proton tocalibrate for pure pH–dependence while eliminating concentration effects (49).
The second generation of DIACEST agents included compounds with high num-bers of exchangeable protons. Cationic polymers at concentrations of ∼10−4 M werereported to cause water signal changes of 40–50% (50). Poly-l-lysine (PLL), for exam-ple, involves more than 7000 exchangeable sites, thus yielding an enhancement factorof more than 486,000. Polyuridilic acid, a polymer of 2000 uridine units, was observedat 10 μM with an enhancement factor of ∼10.8 × 10⁶ via its imino protons (51).
The amide protons of some endogenous compounds were used in a method calledamide proton transfer (APT) to detect pH changes via the exchange rate shown inEquation 3. This approach is of special biomedical interest because the rates reflecttissue pH and local biochemical parameters such as salt or metal content. It wasused to study ischemic brain related to acute stroke (46) and to reveal brain tumorsin mice (52). Two CEST-related methods have been proposed (53) to determinethe base catalyzed, the acid catalyzed, and the spontaneous exchange rate constantsfor very low concentrations of amide protons in polyamide-based APT agents. Insuch applications, conventional methods such as the quantification of exchange line
146 Harel · Schroder · Xu
Ann
ual R
evie
w o
f A
naly
tical
Che
mis
try
2008
.1:1
33-1
63. D
ownl
oade
d fr
om a
rjou
rnal
s.an
nual
revi
ews.
org
by e
lad
hare
l on
07/0
6/09
. For
per
sona
l use
onl
y.

ANRV362-AC01-05 ARI 13 May 2008 7:21
broadening would be very time consuming because of the low signal-to-noise ratiorelated to direct observation of such dilute protons.
4.3. Limitations of Conventional 1H Chemical Exchange SaturationTransfer Detection
One limiting factor of DIACEST compounds is the small chemical shift range ofprotons. This has two consequences: (a) the slow exchange condition needed for re-solving signals of two sites in exchange is relatively strict, thus limiting the maximumobservable rate; and (b) the spillover effect due to direct saturation of the relativelyclose detection signal requires a trade-off between saturation power and unwantedsignal reduction. Agents with a larger chemical shift separation would therefore sig-nificantly improve the capabilities of the CEST enhancement and could be detectedat lower concentrations.
Spillover effects are of minor importance as long as the amplitude of the satura-tion pulse (given in Hz) is negligible compared to the chemical shift difference (inHz) between the saturated and the observed resonance (54). At 4.7 T, the frequencyseparation of the saturated protons of PLL from the detected water signal is ap-proximately +700 Hz and a saturation pulse amplitude of 0.5 μT (corresponding to∼21 Hz) causes no spillover. In contrast, a 3-μT pulse (∼128 Hz) yields a CESTdecrease of ∼30%, but the off-resonance saturation at –700 Hz is also related to asignal change of –25%. Performing such studies at 11.7 T is one loophole (albeit anexpensive one) exploited to increase the chemical shift difference to approximately1.8 kHz. Then, saturation pulses up to 250 Hz (i.e., ∼6 μT) can be used, as thespillover-based signal decrease is only 3% (53).
4.4. Improvement through Paramagnetic Chemical ExchangeSaturation Transfer
Incorporation of paramagnetic shift reagents close to the exchangeable protons im-proves proton CEST agents by increasing the frequency difference between waterand the saturated pool. Introduced by Zhang et al. (55), the first agent was basedon saturation of the bound water signal of a Eu3+ complex formed by a DOTA-tetra(amide) derivative. With a chemical shift separation of 49.7 ppm (9.8 kHz at4.7 T) relative to free water, a saturation of 61% was achieved, whereas the referenceexperiment with saturation at –9.8 kHz showed no spillover effect. Some PARACESTagents are now used with saturation powers up to 250 μT (∼10.6 kHz) at 7 T (56).
Reviews by Sherry et al. (57, 58) summarize the factors that allow for construct-ing such agents by slowing down the usually very fast exchange of water at theinner-sphere coordination sites of lanthanide(III) derivatives of DOTA. However,the short lifetimes of the bound water cause broad saturation dips in the z-spectra(see Figure 6b) and decrease the selectivity of the PARACEST agents. A comparisonof different complexes showed that only those with Eu3+, Tb3+, Dy3+, and Ho3+
have the right combination of water-exchange time and induced chemical shift tobe potential candidates for B0 < ∼10 T (57). Nevertheless, these agents hold great
www.annualreviews.org • Novel Detection Schemes of NMR and MRI 147
Ann
ual R
evie
w o
f A
naly
tical
Che
mis
try
2008
.1:1
33-1
63. D
ownl
oade
d fr
om a
rjou
rnal
s.an
nual
revi
ews.
org
by e
lad
hare
l on
07/0
6/09
. For
per
sona
l use
onl
y.
ANRV362-AC01-05 ARI 13 May 2008 7:21
Xenon biosensor: amolecular construct usingencapsulated xenon and atargeting unit to sensebiochemical targets
potential in terms of detection threshold, as agents with highly shifted bound water(∼500 ppm) can be detected at concentrations of only 10 μM.
Exchangeable protons of NH groups in addition to the coordinated watermolecules in the same complex also turn PARACEST agents into sensitive pH probes(59, 60). Moreover, the use of different lanthanides makes PARACEST agents po-tential candidates for multiplexing (i.e., detecting different targets in the same setup).By using the different saturation resonances of bound water in an Eu3+ (+50 ppminduced shift) and a Tb3+ (–600 ppm induced shift) dotamGly complex, Aime andcolleagues demonstrated selective in vitro cell imaging of two marked cell populationsincubated with either of the PARACEST probes (40 mM concentration) (56).
4.5. Combining Chemical Exchange Saturation Transferwith Hyperpolarized Nuclei
Exchangeable hyperpolarized nuclei also allow for transferring NMR informationfrom a molecule into a different environment in terms of in situ remote detection(61, 62). Hence, the concept of combining the CEST amplification scheme with theadvantages of hyperpolarized nuclei such as 129Xe can resolve some of the remaininglimitations of PARACEST. As has been demonstrated (41), this combination signif-icantly increases the capabilities of NMR for sensing biochemical targets, especiallyfor molecular imaging (Figure 7a,b). The main improvements compared to thermallypolarized nuclei are as follows:
1. Signals of xenon associated with other molecules show an intrinsically hugechemical shift range compared to free dissolved xenon in solution (63). Hence,no paramagnetic agents are required to reduce spillover effects to negligible,even if experiments would be be performed at field strengths of ∼1 T. Unlike theprotons of PARACEST agents, however, the exchange rates of atomic xenon arerelatively slow and yield more selective saturation dips in z-spectra (Figure 6b)and can be used for multiplexing with different sensors at the same time (64).
2. At the same time, the slow exchange causes no problems in terms of transfer ef-ficiency because T1 relaxation for hyperpolarized xenon in solution is extremelyslow compared to the saturation time. Therefore, the depolarization is storedmuch more effectively in the bulk pool than in the case of thermally polar-ized protons that underlie competing relaxation effects. Complete saturationcan be easily achieved, and CEST with hyperpolarized xenon (HYPER-CEST)benefits from the full dynamic range of the bulk signal.
Implementation of HYPER-CEST was made possible by using molecular cagessuch as cryptophanes (65) as hosts to trap the noble gas for some milliseconds andmake it sensitive to selective saturation. To obtain biochemical specificity, such cagescan be incorporated in so-called xenon biosensors (66), in which the cages are linkedto targeting units for reporting a specific binding event (Figure 7c). This modularsetup allows, in principle, functionalization of the CEST-active site for any targetthat can bind a ligand or antibody. The prototype was a biotinylized cage constructedfor sensing avidin. Increasing temperature is known to accelerate chemical exchange
148 Harel · Schroder · Xu
Ann
ual R
evie
w o
f A
naly
tical
Che
mis
try
2008
.1:1
33-1
63. D
ownl
oade
d fr
om a
rjou
rnal
s.an
nual
revi
ews.
org
by e
lad
hare
l on
07/0
6/09
. For
per
sona
l use
onl
y.

ANRV362-AC01-05 ARI 13 May 2008 7:21
Xe
Xe
Xe
Xe
Xe
XXe
Microscopicstructure
with targetprotein
X
Xe
X
Xe
Xe
Xe
Xe
Xe
Encoding
Detection
Xenonbiosensor
1H MRI
129Xe MRI
a c
b
Figure 7(a) Proton magnetic resonance image (MRI) showing a two-compartment phantom withavidin-labeled agarose beads. The lower compartment also contains a xenon biosensor thattargets the protein. (b) 129Xe MRI obtained after subtracting the hyperpolarized xenonchemical exchange saturation transfer (HYPER-CEST) data set with on-resonant sensorsignal saturation from control data with off-resonant saturation. Only the area containing thesensor shows the CEST contrast; other areas remain dark in the difference image.(c) Functionalized biosensors act as host for exchangeable xenon that can be labeled using theCEST method for in situ remote detection of biochemical binding events. Data in (b) is from abiotinylized sensor that interacts with the protein avidin, which is attached to the surface ofmicroscopic agarose beads.
significantly for T > 25◦C (67) and can thus be used to enhance the contrast. Changesin pH are, however, negligible, but competing guest molecules can alter the exchangedynamics of xenon into the cage (65).
The signal transfer is very efficient and can reveal target molecules even at fairlylow concentrations. With molecular imaging, a high signal contrast of 50% wasachieved with only ∼1.3-μM concentration of NMR-active sensor and ∼2.1 μM ofdissolved, detectable xenon. Typical CEST experiments with signal changes of a fewpercent from thermally polarized protons require contrast agent concentrations ofat least ∼10 μM and are based on significantly higher concentrations of detectablenuclei (factor 2600 or 4400 for protons at 7 or 11 T, respectively, compared to xenonin Reference 41). The concentration of the detected target protein in the molecularimaging application was as low as 325 nM, and HYPER-CEST reduced acquisitiontime by 99.97% compared to conventional biosensor detection (41, 68).
For further optimization, the number of exchange sites can be significantly in-creased by dendrimeric amplification (69). Alternative detection techniques that arenot based on the weak NMR signal of Faraday induction will also help to improve
www.annualreviews.org • Novel Detection Schemes of NMR and MRI 149
Ann
ual R
evie
w o
f A
naly
tical
Che
mis
try
2008
.1:1
33-1
63. D
ownl
oade
d fr
om a
rjou
rnal
s.an
nual
revi
ews.
org
by e
lad
hare
l on
07/0
6/09
. For
per
sona
l use
onl
y.
ANRV362-AC01-05 ARI 13 May 2008 7:21
Low field: magnetic fieldfor encoding less than a fewmT
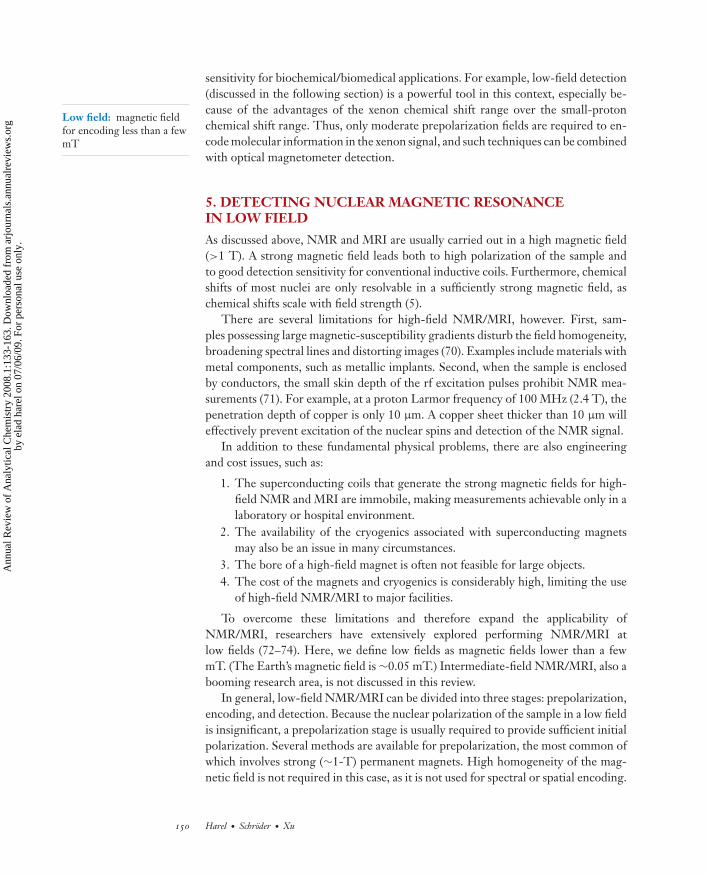
sensitivity for biochemical/biomedical applications. For example, low-field detection(discussed in the following section) is a powerful tool in this context, especially be-cause of the advantages of the xenon chemical shift range over the small-protonchemical shift range. Thus, only moderate prepolarization fields are required to en-code molecular information in the xenon signal, and such techniques can be combinedwith optical magnetometer detection.
5. DETECTING NUCLEAR MAGNETIC RESONANCEIN LOW FIELD
As discussed above, NMR and MRI are usually carried out in a high magnetic field(>1 T). A strong magnetic field leads both to high polarization of the sample andto good detection sensitivity for conventional inductive coils. Furthermore, chemicalshifts of most nuclei are only resolvable in a sufficiently strong magnetic field, aschemical shifts scale with field strength (5).
There are several limitations for high-field NMR/MRI, however. First, sam-ples possessing large magnetic-susceptibility gradients disturb the field homogeneity,broadening spectral lines and distorting images (70). Examples include materials withmetal components, such as metallic implants. Second, when the sample is enclosedby conductors, the small skin depth of the rf excitation pulses prohibit NMR mea-surements (71). For example, at a proton Larmor frequency of 100 MHz (2.4 T), thepenetration depth of copper is only 10 μm. A copper sheet thicker than 10 μm willeffectively prevent excitation of the nuclear spins and detection of the NMR signal.
In addition to these fundamental physical problems, there are also engineeringand cost issues, such as:
1. The superconducting coils that generate the strong magnetic fields for high-field NMR and MRI are immobile, making measurements achievable only in alaboratory or hospital environment.
2. The availability of the cryogenics associated with superconducting magnetsmay also be an issue in many circumstances.
3. The bore of a high-field magnet is often not feasible for large objects.4. The cost of the magnets and cryogenics is considerably high, limiting the use
of high-field NMR/MRI to major facilities.
To overcome these limitations and therefore expand the applicability ofNMR/MRI, researchers have extensively explored performing NMR/MRI atlow fields (72–74). Here, we define low fields as magnetic fields lower than a fewmT. (The Earth’s magnetic field is ∼0.05 mT.) Intermediate-field NMR/MRI, also abooming research area, is not discussed in this review.
In general, low-field NMR/MRI can be divided into three stages: prepolarization,encoding, and detection. Because the nuclear polarization of the sample in a low fieldis insignificant, a prepolarization stage is usually required to provide sufficient initialpolarization. Several methods are available for prepolarization, the most common ofwhich involves strong (∼1-T) permanent magnets. High homogeneity of the mag-netic field is not required in this case, as it is not used for spectral or spatial encoding.
150 Harel · Schroder · Xu
Ann
ual R
evie
w o
f A
naly
tical
Che
mis
try
2008
.1:1
33-1
63. D
ownl
oade
d fr
om a
rjou
rnal
s.an
nual
revi
ews.
org
by e
lad
hare
l on
07/0
6/09
. For
per
sona
l use
onl
y.
ANRV362-AC01-05 ARI 13 May 2008 7:21
EncodingPrepolarization
Thermal
Cryogenic
Optical Atomicmagnetometer
SQUID
Inductive coil
Detection
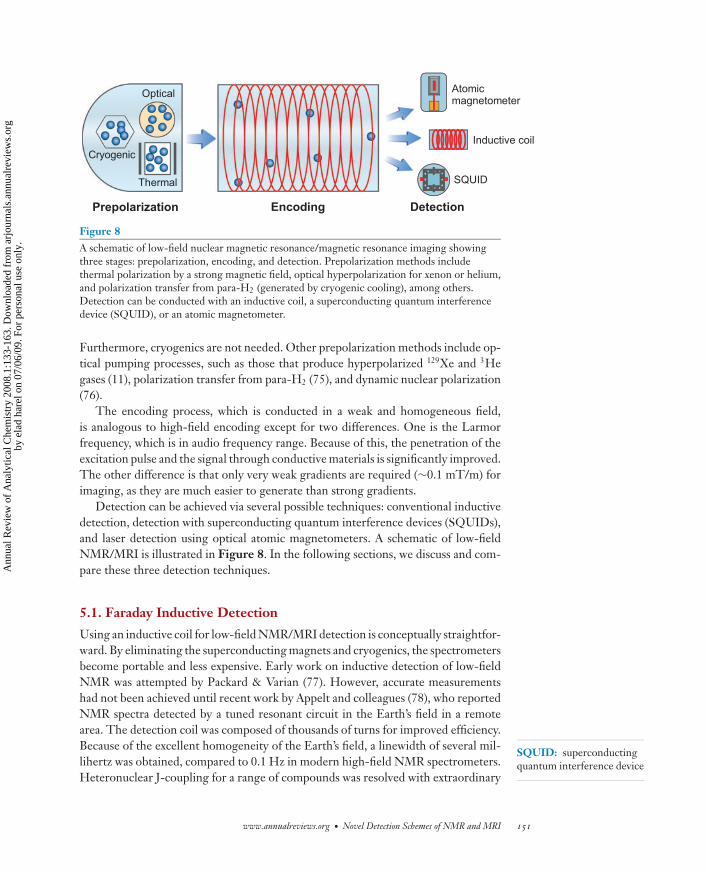
Figure 8A schematic of low-field nuclear magnetic resonance/magnetic resonance imaging showingthree stages: prepolarization, encoding, and detection. Prepolarization methods includethermal polarization by a strong magnetic field, optical hyperpolarization for xenon or helium,and polarization transfer from para-H2 (generated by cryogenic cooling), among others.Detection can be conducted with an inductive coil, a superconducting quantum interferencedevice (SQUID), or an atomic magnetometer.
SQUID: superconductingquantum interference device
Furthermore, cryogenics are not needed. Other prepolarization methods include op-tical pumping processes, such as those that produce hyperpolarized 129Xe and 3Hegases (11), polarization transfer from para-H2 (75), and dynamic nuclear polarization(76).
The encoding process, which is conducted in a weak and homogeneous field,is analogous to high-field encoding except for two differences. One is the Larmorfrequency, which is in audio frequency range. Because of this, the penetration of theexcitation pulse and the signal through conductive materials is significantly improved.The other difference is that only very weak gradients are required (∼0.1 mT/m) forimaging, as they are much easier to generate than strong gradients.
Detection can be achieved via several possible techniques: conventional inductivedetection, detection with superconducting quantum interference devices (SQUIDs),and laser detection using optical atomic magnetometers. A schematic of low-fieldNMR/MRI is illustrated in Figure 8. In the following sections, we discuss and com-pare these three detection techniques.
5.1. Faraday Inductive Detection
Using an inductive coil for low-field NMR/MRI detection is conceptually straightfor-ward. By eliminating the superconducting magnets and cryogenics, the spectrometersbecome portable and less expensive. Early work on inductive detection of low-fieldNMR was attempted by Packard & Varian (77). However, accurate measurementshad not been achieved until recent work by Appelt and colleagues (78), who reportedNMR spectra detected by a tuned resonant circuit in the Earth’s field in a remotearea. The detection coil was composed of thousands of turns for improved efficiency.Because of the excellent homogeneity of the Earth’s field, a linewidth of several mil-lihertz was obtained, compared to 0.1 Hz in modern high-field NMR spectrometers.Heteronuclear J-coupling for a range of compounds was resolved with extraordinary
www.annualreviews.org • Novel Detection Schemes of NMR and MRI 151
Ann
ual R
evie
w o
f A
naly
tical
Che
mis
try
2008
.1:1
33-1
63. D
ownl
oade
d fr
om a
rjou
rnal
s.an
nual
revi
ews.
org
by e
lad
hare
l on
07/0
6/09
. For
per
sona
l use
onl
y.
ANRV362-AC01-05 ARI 13 May 2008 7:21
precision, i.e., ± 5 mHz, which is more than one order of magnitude better thananalogous high-field measurements. The J-coupling values are thus capable of serv-ing as key parameters to distinguish chemicals containing heteronuclei, as chemicalshift information is not resolvable in such low fields.
Multidimensional NMR is a powerful tool for further clarification of chemi-cal structures. Robinson et al. reported the first two-dimensional correlation spec-troscopy spectra of 1,4-difluorobenzene and 2,2,2-trifluoroethanol in the Earth’s field(79). Both proton and fluorine nuclei appeared in the spectra: Higher frequency res-onances arose from the protons and lower ones from fluorine. The fact that bothtypes of nuclei appeared in the same spectrum is a unique feature of low-field NMR;this occurs because their Larmor frequencies are only slightly different comparedto the excitation pulse width and detection bandwidth. This technique thus allowsmeasurements of the relative abundance of these different nuclei in one chemical bya single NMR spectrum. The diagonal peaks reveal molecular orbital connectednessand atomic proximity, providing decisive and unambiguous information for structuralidentification.
Conventional inductive detection is also used for low-field MRI. Mohoric et al.reported a nicely designed MRI system for the Earth’s field (80). A reference signalfrom a separate spectrometer was used to monitor the fluctuation of the Earth’s field,creating a stable rotating frame for the measured signal. Sensitivity was improved bya rational design of the receiving coil and an audio frequency shield which resulted inan image with the smallest voxel on the order of 50 mm3. On the application front,Halse and colleagues showed MR images of a pepper in the Earth’s field (81). Becausethe B0 is only ∼0.05 mT, the imaging gradient is on the order of ∼0.1 mT/m, whichis 2–3 orders of magnitudes weaker than conventional MRI. Thus, no high-powergradient amplifiers are required, meaning that low-field MRI apparatus consume lesspower and are more portable. The exceptional size and excellent homogeneity ofthe Earth’s field enable imaging of samples of very large sizes. Practical applicationsinclude plant analysis and food inspection.
The major drawback of inductive detection in low field is its limited sensitivity,which is proportional to the strength of the magnetic field B0. In the examples men-tioned above, milliliters of samples are usually required, making inductive detectionin low field not feasible for analyzing trace amounts of chemicals. Trace chemicalanalysis is important for applications such as monitoring chemical reactions or bio-chemical processes occurring on lab-on-a-chip devices. In order for low-field NMRand MRI techniques to be applicable for efficient chemical analysis, alternative de-tection techniques need to be developed. For this purpose, among others, NMRdetection using SQUIDs and atomic magnetometers has been explored.
5.2. Superconducting Quantum Interference Devices
SQUIDs are based on the voltage oscillation of a superconducting loop interruptedby Josephson junctions (82). This oscillation is a function of the magnetic flux throughthe loop. Therefore, a SQUID acts as a flux-to-voltage transformer. Unlike a con-ventional inductive coil, SQUID can detect magnetic signal in an arbitrarily low
152 Harel · Schroder · Xu
Ann
ual R
evie
w o
f A
naly
tical
Che
mis
try
2008
.1:1
33-1
63. D
ownl
oade
d fr
om a
rjou
rnal
s.an
nual
revi
ews.
org
by e
lad
hare
l on
07/0
6/09
. For
per
sona
l use
onl
y.
ANRV362-AC01-05 ARI 13 May 2008 7:21
magnetic field without losing sensitivity; in other words, the sensitivity is indepen-dent of the magnetic field strength. The current state-of-the-art SQUID has reachedsensitivities below 1 fT/(Hz)1/2 for ac signal (83), sufficient for NMR measurements.
Initially, SQUID was used for detecting NMR signals of samples at liquid heliumtemperature, which was of limited practical potential. In the last decade, researchershave significantly expanded the applications of SQUID in NMR/MRI measurementsfor samples at room temperature. For example, McDermott et al. showed a SQUID-detected NMR spectrum of trimethyl phosphate (84). A linewidth of ∼1 Hz is ob-tained in a 1.8-μT B0 without shimming. The signature J-coupling between phos-phorous and protons in trimethyl phosphate is obtained.
To demonstrate the advantage of low-field MRI in imaging objects with largemagnetic-susceptibility gradients and objects enclosed in metal, Moβle and col-leagues reported SQUID-detected MR images of a grid with a titanium bar andimages of a pepper enclosed in an aluminum can, and compared them with corre-sponding high-field results (85). The first set of images revealed that the susceptibilitydistortion to the images due to the titanium bar was not pronounced in low field, incontrast to the images taken in high field. The images of the canned pepper showedno shielding factor of the metal for audio frequency excitation and signal, whereas im-ages of the pepper were not obtainable in high field because of the effective shieldingby the aluminum can.
Recent technical advances enable SQUID to be implemented for in vivo MRI.Moβle and coworkers employed a second-order SQUID gradiometer to obtain im-ages of human forearm in ∼100 μT (86). The subject was surrounded by a 3-mm-thinaluminum sheet to eliminate environmental noise. A 100-mT magnetic field was usedfor prepolarization. The resulting images clearly showed different tissues, with three-dimensional spatial resolution of 2 × 2 × 8 mm3. Thus, SQUID MRI in low fieldoffers a viable alternative for medical diagnosis.
One unique characteristic of MRI is its capacity to distinguish between differentsections of the imaging object via contrast. In low field, contrast based on T1 relaxationis greatly enhanced (87). SQUID detection of low-field MRI is well-suited to realizethis advantage because of its high sensitivity. Lee et al. (88) were able to demon-strate the outstanding T1 contrast of agarose solution (compared to solution withoutagarose) with a concentration as low as 0.25% at 0.01 mT, whereas no observablecontrast was seen at 300 mT. Even though inductive detection is also applicable tomeasuring the enhanced low-field T1 contrast via field cycling, direct detection withSQUID drastically simplifies the measuring procedure and reduces the requirementof field homogeneity.
The ultrahigh sensitivity and maturity with regard to engineering make SQUIDthe current state-of-the-art technique for low-field NMR/MRI detection. It is appli-cable to numerous fields, ranging from chemical analysis to medical imaging. Likeany other technique, however, SQUID also has several drawbacks. One is that thecryogens needed for the superconducting loop impose constraints for the portabil-ity and feasibility of this technique. In addition, the electronic components, whichimprove sensitivity and detection efficiency, become very complicated for arrayedSQUIDs. These issues will likely be addressed in the next generation of SQUIDs.
www.annualreviews.org • Novel Detection Schemes of NMR and MRI 153
Ann
ual R
evie
w o
f A
naly
tical
Che
mis
try
2008
.1:1
33-1
63. D
ownl
oade
d fr
om a
rjou
rnal
s.an
nual
revi
ews.
org
by e
lad
hare
l on
07/0
6/09
. For
per
sona
l use
onl
y.

ANRV362-AC01-05 ARI 13 May 2008 7:21
5.3. Optical Atomic Magnetometer
Another high-sensitivity magnetometer is the optical atomic magnetometer, whichhas long been used for precise measurement of magnetic fields and fundamentalphysics parameters (89, 90). An atomic magnetometer utilizes the magneto-opticalinteractions between a laser beam and an alkali vapor. First, the incident laser beam,which has a near-resonance frequency to one of the electronic transitions of the al-kali, generates a coherent ground state in the alkali vapor enclosed in a glass cell.The coherent alkali atoms interact with the probe beam (which can come fromthe same laser for pumping), resulting in an optical rotation of the polarization ofthe laser, or a dispersive absorption spectrum. The magneto-optical effects dependon the external magnetic field from the sample to be measured. Therefore, detec-tion of the magnetic field is dependent upon the detection of photons, which can bemeasured with very high sensitivity.
For a given alkali element, the sensitivity of atomic magnetometers depends onthe coherence time of the ground electronic state and the vapor density of the alkali(91). Two means of optimizing the sensitivity have been demonstrated. The Budkergroup used paraffin-coated alkali cells to minimize spin-destructive wall collisionsand improve the coherence time of the ground state. The vapor cell was filled withpure vapor of an alkali metal, so the atomic density was in the high-vacuum regime.The ground-state coherence was preserved during thousands of collisions betweenthe alkali atoms and the cell wall and lasted for seconds. The sensitivity of the mag-netometer was thereby significantly improved. In this method, a single laser beam isoften used for both pumping and probing, as the low-density alkali vapor only requiresa low-power laser. A near-dc sensitivity of ∼50 fT/(Hz)1/2 has been achieved with a1-cm3 87Rb cell (92). For ac signal detection, the sensitivity is several fT/(Hz)1/2 (93).
The other approach, developed by Romalis and colleagues, uses buffer gases toeliminate the coherence-destroying collisions (94). The alkali atoms reach a spin-exchange relaxation-free regime in near-zero magnetic fields. Here the atomic densityis much higher than that of the other approach. Two laser beams are usually used,one with relatively high power for pumping the high-density alkali vapor, one withlow power for detection. Recently, Savukov et al. demonstrated that subfemtoteslasensitivity at ∼20 Hz can be achieved (95), a rate comparable to that of a SQUIDmagnetometer.
Application of atomic magnetometers in NMR was initially demonstrated byYashchuk et al. (96), who measured the longitudinal magnetization of hyperpolar-ized xenon and obtained the T1 relaxation time of 14 min. Shortly after, a protonNMR spectrum at 20 Hz was obtained by Savukov et al. in ∼0.5 μT (97). These pio-neering works demonstrated that atomic magnetometry would become an alternativetechnique for the detection of faint NMR signals.
Since those experiments, other groups have employed novel NMR and MRI tech-niques with atomic magnetometry. Coupled with remote detection (described above),atomic magnetometers have been used in obtaining both NMR spectra and images. Ina study of flow, Xu et al. (98) first demonstrated MR images detected by an atomic mag-netometer with 1.6-mm spatial resolution and 0.1-s temporal resolution (Figure 9).
154 Harel · Schroder · Xu
Ann
ual R
evie
w o
f A
naly
tical
Che
mis
try
2008
.1:1
33-1
63. D
ownl
oade
d fr
om a
rjou
rnal
s.an
nual
revi
ews.
org
by e
lad
hare
l on
07/0
6/09
. For
per
sona
l use
onl
y.

ANRV362-AC01-05 ARI 13 May 2008 7:21
ba
0.5 s 0.7 s 0.9 s 1.1 s 1.3 s
1.5 s 1.7 s 1.9 s 2.1 s 2.3 s
c
50 100 150 200 250 300
yx
zH2O
Figure 9Magnetic resonance imagesdetected with an atomicmagnetometer. (a) Theencoding volume. The twochannels are 3.2 mm indiameter and 25 mm long,with a center-to-centerspacing of 5.1 mm.(b) Image of the crosssection perpendicular to theflow (xy plane) at t = 1.1 s.(c) Time-resolved images inthe yz plane. Measurementswere obtained with atemporal interval of 0.1 s.Reproduced withpermission fromReference 98. CopyrightPNAS.
The spatial resolution is considerably better than that by inductive detection at lowfields. It demonstrated the capability of atomic magnetometry as a viable and inex-pensive alternative to high-field MRI. Extensive applications of this detection schemecan be expected, such as slow dynamics in microchannels or porous materials. Re-cent developments have shown that submillimeter resolution is also achievable in theEarth’s field (S. Xu, et al., unpublished data).
For the in situ detection of NMR and MRI, atomic magnetometers need to beoperated in rf mode to measure the Larmor precession of the nuclei. Romalis andcolleagues pioneered rf atomic magnetometers and reported a sensitivity of ∼1 fT/Hzin a frequency range up to 99 kHz (99). A static water sample was prepolarized insitu and NMR spectra were obtained directly (100). The Romalis group offereda detailed discussion on implementing atomic magnetometry for NMR detection.Based on their simplified model, they concluded that atomic magnetometers havethe advantage in sensitivity over inductive coils when B0 is less than ∼1 T.
A major motivation for developing alternative NMR/MRI detection techniquesinvolves searching for a miniaturizable method for monitoring biological processesand chemical reactions on lab-on-a-chip devices. Atomic magnetometry has been
www.annualreviews.org • Novel Detection Schemes of NMR and MRI 155
Ann
ual R
evie
w o
f A
naly
tical
Che
mis
try
2008
.1:1
33-1
63. D
ownl
oade
d fr
om a
rjou
rnal
s.an
nual
revi
ews.
org
by e
lad
hare
l on
07/0
6/09
. For
per
sona
l use
onl
y.
ANRV362-AC01-05 ARI 13 May 2008 7:21
shown to possess such characteristics. Schwindt et al. used a magnetometer, with atotal height of less than 3 mm, with an outstanding sensitivity of 5 pT (101). Becausethe distance of this detector to the sample is greatly reduced, the overall detectionlimit is improved. Applications in microanalysis are currently under way.
5.4. Perspectives for Low-Field Magnetic Resonance
Among the three detection devices described above, SQUIDs and atomic magne-tometers offer much better sensitivity than inductive coils in low fields. These de-vices, therefore, have greater potential in low-field NMR and MRI. Developmentsin SQUID techniques have advanced much further than have those in atomic mag-netometry. Not surprisingly, the applications of SQUID in this field far surpass thoseof atomic magnetometers. However, compared to SQUID modality, atomic magne-tometry requires no cryogenics, a significant advantage in both cost and portability.In terms of electronics, atomic magnetometers require much less complicated in-strumentation as the signal is measured via photon detection, which allows for easiermultichannel detection and miniaturization.
In addition to the techniques mentioned herein, other novel tools have been in-vestigated for NMR detection without superconducting magnets. Rugar et al. (102)developed magnetic resonance force microscopy that is capable of measuring a sin-gle electron spin. Direct magneto-optical interaction between polarized nuclei anda laser beam has also been studied (103). All such innovative work will lead to morepossibilities for low-field NMR and MRI.
SUMMARY POINTS
1. Remote detection NMR and MRI allows significant signal amplification forlow-porosity systems due to the optimal filling factor of the detector.
2. TOF information allows material heterogeneities to be elucidated, makingTOF an ideal tool for studying porous systems and microfluidic devices.
3. Chemical exchange of saturated spin systems represents an in situ versionof remote detection with significant signal amplification.
4. Hyperpolarized, exchangeable xenon can be functionalized to encode spe-cific molecular information and is an ideal candidate for saturation transferexperiments with further sensitivity enhancement in molecular imaging.
5. SQUIDs and atomic magnetometers are viable for alternative detection oflow-field NMR and MRI.
FUTURE ISSUES
1. Remote detection will be applied for in vivo applications utilizing the naturalblood flow of the body’s circulatory system.
156 Harel · Schroder · Xu
Ann
ual R
evie
w o
f A
naly
tical
Che
mis
try
2008
.1:1
33-1
63. D
ownl
oade
d fr
om a
rjou
rnal
s.an
nual
revi
ews.
org
by e
lad
hare
l on
07/0
6/09
. For
per
sona
l use
onl
y.

ANRV362-AC01-05 ARI 13 May 2008 7:21
2. High-throughput chemical analysis and imaging for use with lab-on-a-chipdevices will be necessary.
3. Which of the many exogenous CEST agents will be suitable for in vivoapplications?
4. Will optimized CEST agents be able to compete with radionuclide tracers?
5. HYPER-CEST sensors for cell tracking will be demonstrated.
6. Complex pulse sequences in SQUID-detected and laser-detected NMR andMRI will be implemented.
7. SQUIDs and atomic magnetometers will be miniaturized.
DISCLOSURE STATEMENT
The authors are not aware of any biases that might be perceived as affecting theobjectivity of this review.
ACKNOWLEDGMENTS
We remain, as always, grateful to Alex Pines for his guidance, advice, and supportwhich reflect decades of innovation and the impact of magnetic resonance in chem-istry. Much of the data presented here is representative of the work of many of theso-called Pinenuts collected over the past few years. We are grateful for all their count-less hours of hard work, which has led to these exciting developments in magneticresonance.
This work is supported by the Director, Office of Science, Office of Basic EnergySciences and the Materials Sciences Division of the U.S. Department of Energyunder contract DE-AC03–76SF0098. E.H. is supported by a fellowship from theU.S. Department of Homeland Security under DOE contract number DE-AC05-00OR22750. L.S. is supported by the Deutsche Forschungsgemeinschaft (SCHR995/1-1) through an Emmy Noether Fellowship.
LITERATURE CITED
1. Breitmaier E. 1993. Structure Elucidation by NMR in Organic Chemistry. NewYork: Wiley
2. Wuthrich K. 1986. NMR of Proteins and Nucleic Acids. New York: Wiley3. Edelman R, Hesselink J, Zlatkin M. 1996. Clinical Magnetic Resonance Imaging.
Philadelphia: Saunders4. Callaghan PT. 1991. Principles of Nuclear Magnetic Resonance Microscopy. Oxford:
Oxford Univ. Press5. Abragham A. 1961. Principles of Nuclear Magnetism. Oxford: Oxford Univ. Press6. Farrar TC, Becker ED. 1971. Pulse and Fourier Transform NMR. New York:
Academic
www.annualreviews.org • Novel Detection Schemes of NMR and MRI 157
Ann
ual R
evie
w o
f A
naly
tical
Che
mis
try
2008
.1:1
33-1
63. D
ownl
oade
d fr
om a
rjou
rnal
s.an
nual
revi
ews.
org
by e
lad
hare
l on
07/0
6/09
. For
per
sona
l use
onl
y.

ANRV362-AC01-05 ARI 13 May 2008 7:21
7. Hoult DI, Richards RE. 1976. The signal-to-noise ratio of the nuclear magneticresonance experiment. J. Magn. Reson. 24:71–85
8. Moule AJ, Spence MM, Han SI, Seeley JA, Pierce KL, et al. 2003. Amplifica-tion of xenon NMR and MRI by remote detection. Proc. Natl. Acad. Sci. USA100:9122–27
9. Seeley JA, Han SI, Pines A. 2004. Remotely detected high-field MRI of poroussamples. J. Magn. Reson. 167:282–90
10. Granwehr J, Harel E, Han SI, Garcia S, Pines A, et al. 2005. Time-of-flightflow imaging using NMR remote detection. Phys. Rev. Lett. 95:075503
11. Walker TG, Happer W. 1997. Spin-exchange optical pumping of noble gasnuclei. Rev. Mod. Phys. 69:629
12. Goodson BM. 2002. Nuclear magnetic resonance of laser-polarized noble gasesin molecules, materials, and organisms. J. Magn. Reson. 155:157–216
13. Cohen MH, Mendelson KS. 1982. Nuclear magnetic resonance and the internalgeometry of sedimentary rocks. J. Appl. Phys. 53:1127–35
14. Mansfield P, Turner R, Stehling MK. 1991. Echo-planar imaging: magneticresonance imaging in a fraction of a second. Science 254:43–50
15. Gregory DM, Gerald RE, Botto RE. 1998. Pore-structure determinations of sil-ica aerogels by 129Xe NMR spectroscopy and imaging. J. Magn. Reson. 131:327–35
16. Terskikh VV, Moudrakovski IL, Mastikhin VM. 1993. 129Xe nuclear magneticresonance studies of the porous structure of silica gels. J. Chem. Soc. FaradayTrans. 89:4239–43
17. Terskikh VV, Moudrakovski IL, Breeze SR, Lang S, Ratcliffe CI, et al. 2002. Ageneral correlation for the 129Xe NMR chemical shift-pore size relationship inporous silica-based materials. Langmuir 18:5653–56
18. Harel E, Granwehr J, Seeley JA. 2006. Multiphase imaging of gas flow in ananoporous material using remote-detection NMR. Nat. Mater. 5:321–27
19. Taylor G. 1953. Dispersion of soluble matter in solvent flowing slowly througha tube. Proc. R. Soc. London Ser. A 219:186–203
20. Reichenauer G, Stumpf C, Fricke J. 1995. Characterization of SiO2, rf andcarbon aerogels by dynamic cas expansion. J. Non-Cryst. Solids 186:334–41
21. Emmerling A, Fricke J. 1992. Small angle scattering and the structure of aero-gels. J. Non-Cryst. Solids 145:113–20
22. Schaefer DW, Keefer KD. 1986. Structure of random porous materials: silicaaerogel. Phys. Rev. Lett. 56:2199–202
23. Bonardet JL, Fraissard J, Gedeon A, Springuel-Huet MA. 1999. Nuclear mag-netic resonance of physisorbed Xe-129 used as a probe to investigate poroussolids. Catal. Rev.-Sci. Eng. 41:115–225
24. Hilty C, McDonnell EE, Granwehr J, Pierce KL, Han SI, Pines A. 2005. Mi-crofluidic gas-flow profiling using remote-detection NMR. Proc. Natl. Acad. Sci.USA 102:14960–63
25. Stone HA, Stroock AD, Ajdari A. 2004. Engineering flows in small devices:microfluidics toward a lab-on-a-chip. Annu. Rev. Fluid Mech. 36:381–411
26. Koop MU, de Mello AJ, Manz A. 1998. Chemical amplifications: continuous-flow PCR on a chip. Science 280:1046–48
158 Harel · Schroder · Xu
Ann
ual R
evie
w o
f A
naly
tical
Che
mis
try
2008
.1:1
33-1
63. D
ownl
oade
d fr
om a
rjou
rnal
s.an
nual
revi
ews.
org
by e
lad
hare
l on
07/0
6/09
. For
per
sona
l use
onl
y.

ANRV362-AC01-05 ARI 13 May 2008 7:21
27. Figeys D, Pinto D. 2001. Proteomics on a chip: promising developments.Electrophoresis 22:208–16
28. Haswell SJ, Middleton RJ, O’Sullivan B, Skelton V, Watts P, Styring P. 2001.The application of micro reactors to synthetic chemistry. Chem. Commun.2001:391–98
29. Hong JW, Studer V, Hang G, Anderson WF, Quake SR. 2004. A nanoliter-scalenucleic acid processor with parallel architecture. Nat. Biotechnol. 22:435–39
30. Stroock AD, Dertinger SK, Ajdari A, Mezic I, Stone HA, Whitesides GM. 2002.Chaotic mixer for microchannels. Science 295:647–51
31. Cristobal G, Arbouet L, Sarrazin F, Talaga D, Bruneel J-L, et al. 2006. On-line laser Raman spectroscopic probing of droplets engineered in microfluidicdevices. Lab Chip 6:1140–46
32. Zhu L, Lee CS, DeVoe DL. 2006. Integrated microfluidic UV absorbancedetector with attomol-level sensitivity for BSA. Lab Chip 6:115–20
33. Wensink H, Benito-Lopez F, Hermes DC, Verboom W, Gardeniers HJGE,et al. 2005. Measuring reaction kinetics in a lab-on-a chip by microcoil NMR.Lab Chip 5:280–84
34. Harel E, Hilty C, Koen K, McDonnell EE, Pines A. 2007. Time-of-flightflow imaging of two-component flow inside a microfluidic chip. Phys. Rev. Lett.98:017601
35. Ehrmann K, Gersbach M, Pascoal P, Vincent F, Massin C, et al. 2006. Samplepatterning on NMR surface microcoils. J. Magn. Reson. 178:96–105
36. Sakellariou D, Le Goff G, Jacquinot J-F. 2007. High-resolution, high-sensiti-vity NMR of nanolitre anisotropic samples by coil spinning. Nature 447:694–97
37. Olson DL, Peck TL, Webb AG, Magin RL, Sweedler JV. 1995. High-resolution microcoil 1H-NMR for mass-limited, nanoliter-volume samples. Sci-ence 270:1967–70
38. Bouchard LS, Budker D, Harel E, Ledbetter M, Lowery T, et al. 2007. U.S.patent pending
39. Massoud TF, Gambhir SS. 2003. Molecular imaging in living subjects: seeingfundamental biological processes in a new light. Genes Dev. 17:545–80
40. Ward KM, Aletras AH, Balaban RS. 2000. A new class of contrast agents forMRI based on proton chemical exchange dependent saturation transfer (CEST).J. Magn. Res. 143:79–87
41. Schroder L, Lowery TJ, Hilty C, Wemmer DE, Pines A. 2006. Molecularimaging using a targeted magnetic resonance hyperpolarized biosensor. Science314:432–33
42. Forsen S, Hoffman R. 1963. Study of moderately rapid chemical exchangereactions by means of nuclear magnetic double resonance. J. Chem. Phys.39(11):2892–901
43. McConnell HM. 1958. Reaction rates by nuclear magnetic resonance. J. Chem.Phys. 28:430–31
44. Bryant RG. 1996. The dynamics of water-protein interactions. Annu. Rev. Bio-phys. Biomol. Struct. 25:29–53
www.annualreviews.org • Novel Detection Schemes of NMR and MRI 159
Ann
ual R
evie
w o
f A
naly
tical
Che
mis
try
2008
.1:1
33-1
63. D
ownl
oade
d fr
om a
rjou
rnal
s.an
nual
revi
ews.
org
by e
lad
hare
l on
07/0
6/09
. For
per
sona
l use
onl
y.

ANRV362-AC01-05 ARI 13 May 2008 7:21
45. Zhou J, Wilson DA, Zhe Sun P, Klaus JA, van Zijl PCM. 2004. Quantitativedescription of proton exchange processes between water and endogenous andexogenous agents for WEX, CEST, and APT experiments. Magn. Reson. Med.51:945–52
46. Zhou J, Payen J-F, Wilson DA, Traystman RJ, van Zijl PCM. 2003. Using theamide proton signals of intracellular proteins and peptides to detect pH effectsin MRI. Nat. Med. 9:1085–90
47. van Zijl PCM, Zhou J, Mori N, Payen J-F, Wilson D, Mori S. 2003. Mechanismof magnetization transfer during on-resonance water saturation: a new approachto detect mobile proteins, peptides, and lipids. Magn. Reson. Med. 49:440–49
48. Zhou J, van Zijl PCM. 2006. Chemical exchange saturation transfer imagingand spectroscopy. Progr. NMR Spectrosc. 48:109–36
49. Ward KM, Balaban RS. 2000. Determination of pH using water protons andchemical exchange dependent saturation transfer (CEST). Magn. Reson. Med.44:799–802
50. Goffeney N, Bulte JW, Duyn J, Bryant LH Jr, van Zijl PC. 2001. SensitiveNMR detection of cationic-polymer-based gene delivery systems using satura-tion transfer via proton exchange. J. Am. Chem. Soc. 123:8628–29
51. Snoussi K, Bulte JW, Gueron M, van Zijl PCM. 2003. Sensitive CEST agentsbased on nucleic acid imino proton exchange: detection of poly(rU) and of adendrimer-poly(rU) model for nucleic acid delivery and pharmacology. Magn.Reson. Med. 49:998–1005
52. Zhou J, Lal B, Wilson DA, Laterra J, van Zijl PCM. 2003. Amide proton transfer(APT) contrast for imaging of brain tumors. Magn. Reson. Med. 50:1120–26
53. McMahon MT, Gilad AA, Zhou J, Sun PZ, Bulte JW, van Zijl PC. 2006. Quan-tifying exchange rates in chemical exchange saturation transfer agents using thesaturation time and saturation power dependencies of the magnetization trans-fer effect on the magnetic resonance imaging signal (QUEST and QUESP):Ph calibration for poly-L-lysine and a starburst dendrimer. Magn. Reson. Med.55:836–47
54. Sun PZ, van Zijl PCM, Zhou J. 2005. Optimization of the irradiation power inchemical exchange dependent saturation transfer experiments. J. Magn. Reson.175:193–200
55. Zhang S, Winter P, Wu K, Sherry DK. 2001. A novel europium(III)-based MRIcontrast agent. J. Am. Chem. Soc. 123:1517–18
56. Aime S, Carrera C, Delli Castelli D, Geniatti Crich S, Terreno E. 2005. Tunableimaging of cells labeled with MRI-PARACEST agents. Angew. Chem. Int. Ed.44:1813–15
57. Zhang S, Merritt M, Woessner DE, Lenkinski RE, Sherry DA. 2003.PARACEST agents: modulating MRI contrast via water proton exchange. Acc.Chem. Res. 36:783–90
58. Woods M, Woessner DE, Sherry DA. 2006. Paramagnetic lanthanide complexesas PARACEST agents for medical imaging. Chem. Soc. Rev. 35:500–11
59. Aime S, Delli Castelli D, Terreno E. 2002. Novel pH-reporter MRI contrastagents. Angew. Chem. Int. Ed. 41(22):4334–36
160 Harel · Schroder · Xu
Ann
ual R
evie
w o
f A
naly
tical
Che
mis
try
2008
.1:1
33-1
63. D
ownl
oade
d fr
om a
rjou
rnal
s.an
nual
revi
ews.
org
by e
lad
hare
l on
07/0
6/09
. For
per
sona
l use
onl
y.
ANRV362-AC01-05 ARI 13 May 2008 7:21
60. Terreno E, Delli Castelli D, Cravotto G, Milone L, Aime S. 2004. Ln(III)-DOTAMGly complexes: a versatile series to assess the determinants of the effi-cacy of paramagnetic chemical exchange saturation transfer agents for magneticresonance imaging applications. Invest. Radiol. 39:235–43
61. Spence MM, Ruiz EJ, Rubin SM, Lowery TJ, Winssinger N, et al. 2004. De-velopment of a functionalized xenon biosensor. J. Am. Chem. Soc. 126:15287–94
62. Garcia S, Chavez L, Lowery TJ, Han S-I, Wemmer DE, Pines A. 2007. Sensi-tivity enhancement by exchange mediated magnetization transfer of the xenonbiosensor signal. J. Magn. Reson. 184(1):72–77
63. Goodson BM. 1999. Using injectable carriers of laser-polarized noble gases forenhancing NMR and MRI. Concepts Magn. Reson. 11(4):203–23
64. Lowery TJ, Rubin SM, Ruiz EJ, Spence MM, Winssinger N, et al. 2003. Ap-plications of laser-polarized 129Xe to biomolecular assays. Magn. Reson. Imag.21(10):1235–39
65. Bartik K, Luhmer L, Dutasta J-P, Collet A, Reisse J. 1998. 129Xe and 1H NMRstudy of the reversible trapping of xenon by cryptophane-A in organic solution.J. Am. Chem. Soc. 120(4):784–91
66. Spence MM, Rubin SM, Dimitrov IE, Ruiz EJ, Wemmer DE, et al. 2001.Functionalized xenon as a biosensor. Proc. Natl. Acad. Sci. USA 98:10654–57
67. Lowery TJ, Garcia S, Chavez L, Ruiz EJ, Wu T, et al. 2006. Optimization ofxenon biosensors for detection of protein interactions. ChemBioChem 7:65–73
68. Hilty C, Lowery TJ, Wemmer DE, Pines A. 2006. Spectrally resolved magneticresonance imaging of a xenon biosensor. Angew. Chem. Int. Ed. 45(1):70–73
69. Mynar JL, Lowery TJ, Wemmer DE, Pines A, Frechet JM. 2006. Xenon biosen-sor amplification via dendrimer-cage supramolecular constructs. J. Am. Chem.Soc. 128(19):6334–35
70. Ludecke KM, Roschmann P, Tischler R. 1993. Susceptibility artefacts in NMRimaging. Magn. Reson. Imaging 3:329–43
71. Bennett CR, Wang PS, Donahue MJ. 1996. Artifacts in magnetic resonanceimaging from metals. J. Appl. Physiol. 79:4712–14
72. Bene GJ. 1980. Nuclear magnetism of liquid system in the Earth field range.Phys. Rep. 58:213–67
73. Stepisnik J, Kos M, Planinsic G, Erzen V. 1994. Strong non-uniform mag-netic field for self-diffusion measurement by NMR in the earth’s magnetic field.J. Magn. Reson. A 107:167–72
74. Appelt S, Hasing FW, Kuhn H, Perlo J, Blumich B. 2005. Mobile high reso-lution xenon nuclear magnetic resonance spectroscopy in the earth’s magneticfield. Phys. Rev. Lett. 94:197602
75. Bowers CR, Weitekamp DP. 1986. Transformation of symmetrization orderto nuclear-spin magnetization by chemical reaction and nuclear magnetic res-onance. Phys. Rev. Lett. 57:2645–48
76. Slichter CP. 1990. Principles of Nuclear Magnetic Resonance. New York: Springer-Verlag
77. Packard M, Varian R. 1954. Free nuclear induction in the Earth’s magnetic field.Phys. Rev. 93:941
www.annualreviews.org • Novel Detection Schemes of NMR and MRI 161
Ann
ual R
evie
w o
f A
naly
tical
Che
mis
try
2008
.1:1
33-1
63. D
ownl
oade
d fr
om a
rjou
rnal
s.an
nual
revi
ews.
org
by e
lad
hare
l on
07/0
6/09
. For
per
sona
l use
onl
y.

ANRV362-AC01-05 ARI 13 May 2008 7:21
78. Appelt S, Kuhn H, Hasing FW, Blumich B. 2006. Chemical analysis byultrahigh-resolution nuclear magnetic resonance in the Earth’s magnetic field.Nat. Phys. 2:105–9
79. Robinson JN, Coy A, Dykstra R, Eccles CD, Hunter MW, et al. 2006.Two-dimensional NMR spectroscopy in Earth’s magnetic field. Magn. Reson.182:343–47
80. Mohoric A, Planinsic G, Kos M, Duh A, Stepisnik J. 2004. Magnetic resonanceimaging system based on Earth’s magnetic field. Instrum. Sci. Technol. 32:655–67
81. Halse ME, Coy A, Dykstra R, Eccles C, Hunter M, et al. 2006. A practicaland flexible implementation of 3D MRI in the Earth’s magnetic field. J. Magn.Reson. 182:75–83
82. Clarke J. 1996. SQUID fundamentals. In SQUID Sensors: Fundamentals, Fab-rication, and Applications, ed. H Weinstock, pp. 1–62. Dordrecht, Netherlands:Kluwer Acad.
83. Kleiner R, Koelle F, Ludwig F, Clarke J. 2004. Superconducting quantum in-terference devices: state of the art and applications. Proc. IEEE 92:1534–48
84. McDermott R, Trabesinger AH, Muck M, Hahn EL, Pines A, et al. 2002.Liquid-state NMR and scalar couplings in microtesla magnetic fields. Science295:2247–49
85. Moβle M, Han S-I, Myers WR, Lee S-K, Kelso N, et al. 2006. SQUID-detectedmicrotesla MRI in the presence of metal. J. Magn. Reson. 179:146–51
86. Moβle M, Myers WR, Lee S-K, Kelso N, Hatridge M, et al. 2005. SQUID-detected in vivo MRI at microtesla magnetic fields. IEEE Trans. Appl. Supercond.15:757–60
87. Macovski A, Conolly S. 1993. Novel approaches to low-cost MRI. Magn. Reson.Med. 30:221–30
88. Lee SK, Moβle M, Myers WR, Kelso N, Trabesinger AH, et al. 2005.SQUID-detected MRI at 132 microT with T1-weighted contrast established at10 microT–300 mT. Magn. Reson. Med. 53:9–14
89. Dehmelt HG. 1957. Modulation of a light beam by precessing absorbing atoms.Phys. Rev. 105:1924–25
90. Dupont-Roc J, Haroche S, Cohen-Tannoudji C. 1969. Detection of very weakmagnetic fields (10–9 gauss) by Rb 87 zero-field level crossing resonances. Phys.Lett. A 28:638–39
91. Budker D, Romalis MV. 2007. Optical magnetometry. Nat. Phys. 3:227–3492. Xu S, Rochester SM, Yashchuk VV, Donaldson MH, Budker D. 2006. Con-
struction and applications of an atomic magnetic gradiometer based on nonlin-ear magneto-optical rotation. Rev. Sci. Instrum. 77:083106
93. Ledbetter MP, Acosta VM, Rochester SM, Budker D, Pustelny S, et al. 2007.Detection of radio-frequency magnetic fields using nonlinear magneto-opticalrotation. Phys. Rev. A 75:023405
94. Allred JC, Lyman RN, Komack TW, Romalis MV. 2002. High-sensitivityatomic magnetometer unaffected by spin-exchange relaxation. Phys. Rev. Lett.89:130801
95. Kominis IK, Kornack TW, Allred JC, Romalis MV. 2003. A subfemtoteslamultichannel atomic magnometer. Nature 422:596–99
162 Harel · Schroder · Xu
Ann
ual R
evie
w o
f A
naly
tical
Che
mis
try
2008
.1:1
33-1
63. D
ownl
oade
d fr
om a
rjou
rnal
s.an
nual
revi
ews.
org
by e
lad
hare
l on
07/0
6/09
. For
per
sona
l use
onl
y.

ANRV362-AC01-05 ARI 13 May 2008 7:21
96. Yashchuk VV, Granwehr J, Kimball DF, Rochester SM, Trabesinger AH, et al.2004. Hyperpolarized xenon nuclear spins detected by optical atomic magne-tometry. Phys. Rev. Lett. 93:160801
97. Savukov IM, Romalis MV. 2005. NMR detection with an atomic magnetometer.Phys. Rev. Lett. 94:123001
98. Xu S, Yashchuk VV, Donaldson MH, Rochester SM, Budker D, Pines A. 2006.Magnetic resonance imaging with an optical atomic magnetometer. Proc. Natl.Acad. Sci. USA 103:12668–71
99. Savukov IM, Seltzer SJ, Romalis MV, Sauer KL. 2005. Tunable atomic mag-netometer for detection of radio-frequency magnetic fields. Phys. Rev. Lett.95:063004
100. Savukov IM, Selter SJ, Romalis MV. 2007. Detection of NMR signals with aradio-frequency atomic magnetometer. J. Magn. Reson. 185:227–33
101. Schwindt PDD, Lindseth B, Knappe S, Shah V, Kitching J, et al. 2007. A chip-scale atomic magnetometer with improved sensitivity using the Mx technique.Appl. Phys. Lett. 90:081102
102. Rugar D, Budakian R, Mamin HJ, Chui BW. 2004. Single spin detection bymagnetic resonance force microscopy. Nature 430:329–32
103. Savukov IM, Lee SK, Romalis MV. 2006. Optical detection of liquid-stateNMR. Nature 442:1021–24
www.annualreviews.org • Novel Detection Schemes of NMR and MRI 163
Ann
ual R
evie
w o
f A
naly
tical
Che
mis
try
2008
.1:1
33-1
63. D
ownl
oade
d fr
om a
rjou
rnal
s.an
nual
revi
ews.
org
by e
lad
hare
l on
07/0
6/09
. For
per
sona
l use
onl
y.

AR362-FM ARI 13 May 2008 9:33
Annual Review ofAnalyticalChemistry
Volume 1, 2008Contents
A Personal Journey of Discovery: Developing Technology andChanging BiologyLee Hood � � � � � � � � � � � � � � � � � � � � � � � � � � � � � � � � � � � � � � � � � � � � � � � � � � � � � � � � � � � � � � � � � � � � � � � � � � � � � � � � � � � � �1
Spectroscopic and Statistical Techniques for Information Recoveryin Metabonomics and MetabolomicsJohn C. Lindon and Jeremy K. Nicholson � � � � � � � � � � � � � � � � � � � � � � � � � � � � � � � � � � � � � � � � � � � � � � � � 45
Mass Spectrometry for Rapid Characterization of MicroorganismsPlamen A. Demirev and Catherine Fenselau � � � � � � � � � � � � � � � � � � � � � � � � � � � � � � � � � � � � � � � � � � � � 71
Scanning Electrochemical MicroscopyShigeru Amemiya, Allen J. Bard, Fu-Ren F. Fan, Michael V. Mirkin,and Patrick R. Unwin � � � � � � � � � � � � � � � � � � � � � � � � � � � � � � � � � � � � � � � � � � � � � � � � � � � � � � � � � � � � � � � � � � � � � 95
Novel Detection Schemes of Nuclear Magnetic Resonance andMagnetic Resonance Imaging: Applications from AnalyticalChemistry to Molecular SensorsElad Harel, Leif Schröder, and Shoujun Xu � � � � � � � � � � � � � � � � � � � � � � � � � � � � � � � � � � � � � � � � � � � �133
Chemical Cytometry: Fluorescence-Based Single-Cell AnalysisDaniella Cohen, Jane A. Dickerson, Colin D. Whitmore, Emily H. Turner,Monica M. Palcic, Ole Hindsgaul, and Norman J. Dovichi � � � � � � � � � � � � � � � � � � � � � � � � � � �165
Chemical Analysis of Single CellsLaura M. Borland, Sumith Kottegoda, K. Scott Phillips,and Nancy L. Allbritton � � � � � � � � � � � � � � � � � � � � � � � � � � � � � � � � � � � � � � � � � � � � � � � � � � � � � � � � � � � � � � � � � �191
Ion Chemistry in the Interstellar MediumTheodore P. Snow and Veronica M. Bierbaum � � � � � � � � � � � � � � � � � � � � � � � � � � � � � � � � � � � � � � � � � �229
Plasma Diagnostics for Unraveling Process ChemistryJoshua M. Stillahn, Kristina J. Trevino, and Ellen R. Fisher � � � � � � � � � � � � � � � � � � � � � � � � �261
Biomolecule Analysis by Ion Mobility SpectrometryBrian C. Bohrer, Samuel I. Merenbloom, Stormy L. Koeniger,Amy E. Hilderbrand, and David E. Clemmer � � � � � � � � � � � � � � � � � � � � � � � � � � � � � � � � � � � � � � � � � �293
In Vitro Electrochemistry of Biological SystemsKelly L. Adams, Maja Puchades, and Andrew G. Ewing � � � � � � � � � � � � � � � � � � � � � � � � � � � � � �329
vii
Ann
ual R
evie
w o
f A
naly
tical
Che
mis
try
2008
.1:1
33-1
63. D
ownl
oade
d fr
om a
rjou
rnal
s.an
nual
revi
ews.
org
by e
lad
hare
l on
07/0
6/09
. For
per
sona
l use
onl
y.

AR362-FM ARI 13 May 2008 9:33
Current Applications of Liquid Chromatography/Mass Spectrometryin Pharmaceutical Discovery After a Decade of InnovationBradley L. Ackermann, Michael J. Berna, James A. Eckstein, Lee W. Ott,and Ajai K. Chaudhary � � � � � � � � � � � � � � � � � � � � � � � � � � � � � � � � � � � � � � � � � � � � � � � � � � � � � � � � � � � � � � � � � �357
Optical Probes for Molecular Processes in Live CellsYoshio Umezawa � � � � � � � � � � � � � � � � � � � � � � � � � � � � � � � � � � � � � � � � � � � � � � � � � � � � � � � � � � � � � � � � � � � � � � � � � �397
Cell Culture Models in Microfluidic SystemsIvar Meyvantsson and David J. Beebe � � � � � � � � � � � � � � � � � � � � � � � � � � � � � � � � � � � � � � � � � � � � � � � � � �423
Peptides in the Brain: Mass Spectrometry–Based MeasurementApproaches and ChallengesLing jun Li and Jonathan V. Sweedler � � � � � � � � � � � � � � � � � � � � � � � � � � � � � � � � � � � � � � � � � � � � � � � � � �451
Analysis of Atmospheric AerosolsKimberly A. Prather, Courtney D. Hatch, and Vicki H. Grassian � � � � � � � � � � � � � � � � � � � �485
Multiplexed Spectroscopic DetectionsKyle D. Bake and David R. Walt � � � � � � � � � � � � � � � � � � � � � � � � � � � � � � � � � � � � � � � � � � � � � � � � � � � � � � � �515
Terrestrial Analysis of the Organic Component of Comet DustScott A. Sandford � � � � � � � � � � � � � � � � � � � � � � � � � � � � � � � � � � � � � � � � � � � � � � � � � � � � � � � � � � � � � � � � � � � � � � � � �549
High-Resolution Mass SpectrometersAlan G. Marshall and Christopher L. Hendrickson � � � � � � � � � � � � � � � � � � � � � � � � � � � � � � � � � � � �579
Surface-Enhanced Raman SpectroscopyPaul L. Stiles, Jon A. Dieringer, Nilam C. Shah, and Richard P. Van Duyne � � � � � � �601
Time-Resolved Microdialysis for In Vivo NeurochemicalMeasurements and Other ApplicationsKristin N. Schultz and Robert T. Kennedy � � � � � � � � � � � � � � � � � � � � � � � � � � � � � � � � � � � � � � � � � � � � � �627
Applications of Ultrafast Lasers for Optical Measurementsin Combusting Flows
James R. Gord, Terrence R. Meyer, and Sukesh Roy � � � � � � � � � � � � � � � � � � � � � � � � � � � � � � � � � � �663
Matrix-Assisted Laser Desorption/Ionization Imaging MassSpectrometry for the Investigation of Proteins and PeptidesKristin E. Burnum, Sara L. Frappier, and Richard M. Caprioli � � � � � � � � � � � � � � � � � � � � � �689
Formation and Characterization of Organic Monolayerson Semiconductor Surfaces
Robert J. Hamers � � � � � � � � � � � � � � � � � � � � � � � � � � � � � � � � � � � � � � � � � � � � � � � � � � � � � � � � � � � � � � � � � � � � � � � � �707
Nanoscopic Porous SensorsJohn J. Kasianowicz, Joseph W.F. Robertson, Elaine R. Chan, Joseph E. Reiner,and Vincent M. Stanford � � � � � � � � � � � � � � � � � � � � � � � � � � � � � � � � � � � � � � � � � � � � � � � � � � � � � � � � � � � � � � � � �737
viii Contents
Ann
ual R
evie
w o
f A
naly
tical
Che
mis
try
2008
.1:1
33-1
63. D
ownl
oade
d fr
om a
rjou
rnal
s.an
nual
revi
ews.
org
by e
lad
hare
l on
07/0
6/09
. For
per
sona
l use
onl
y.

AR362-FM ARI 13 May 2008 9:33
Combining Self-Assembled Monolayers and Mass Spectrometryfor Applications in BiochipsZachary A. Gurard-Levin and Milan Mrksich � � � � � � � � � � � � � � � � � � � � � � � � � � � � � � � � � � � � � � � � �767
Liposomes: Technologies and Analytical ApplicationsAldo Jesorka and Owe Orwar � � � � � � � � � � � � � � � � � � � � � � � � � � � � � � � � � � � � � � � � � � � � � � � � � � � � � � � � � � �801
Fundamentals of Protein Separations: 50 Years of Nanotechnology,and Growing
David A. Egas and Mary J. Wirth � � � � � � � � � � � � � � � � � � � � � � � � � � � � � � � � � � � � � � � � � � � � � � � � � � � � �833
Functional and Spectroscopic Measurements with Scanning TunnelingMicroscopyAmanda M. Moore and Paul S. Weiss � � � � � � � � � � � � � � � � � � � � � � � � � � � � � � � � � � � � � � � � � � � � � � � � � �857
Coherent Anti-Stokes Raman Scattering Microscopy: ChemicalImaging for Biology and MedicineConor L. Evans and X. Sunney Xie � � � � � � � � � � � � � � � � � � � � � � � � � � � � � � � � � � � � � � � � � � � � � � � � � � � � �883
Contents ix
Ann
ual R
evie
w o
f A
naly
tical
Che
mis
try
2008
.1:1
33-1
63. D
ownl
oade
d fr
om a
rjou
rnal
s.an
nual
revi
ews.
org
by e
lad
hare
l on
07/0
6/09
. For
per
sona
l use
onl
y.