novel composite coded pattern fo r small angle … composite coded pattern fo r small angle...
TRANSCRIPT

Novel composite coded pattern for small angle measurement using imaging method
Suguna Sree Nukala*a, Sai Siva Gorthi a and Kameswara Rao Lollaa
aDepartment of Instrumentation, Indian Institute of Science, Bangalore-560012, India.
ABSTRACT
A novel approach for measurement of small rotation angles using imaging method is proposed and demonstrated. A plane mirror placed on a precision rotating table is used for imaging the newly designed composite coded pattern. The imaged patterns are captured with the help of a CCD camera. The angular rotation of the plane mirror is determined from a pair of the images of the pattern, captured once before and once after affecting the tilt of the mirror. Both simulation and experimental results suggest that the proposed approach not only retains the advantages of the original imaging method but also contributes significantly to the enhancement of its measuring range (±4.13º with accuracy of the order of 1 arcsec). Keywords: Small-rotation–angle measurement, imaging method, composite coded pattern, FFT analysis, phase unwrapping, measurement range.
1. INTRODUCTION Optical apparatus for precision small angle measurement find applications in many areas such as construction of
electro optical assemblies, calibration of machine tools, precise alignment of mechanical systems, for control systems in industry etc. Laser based interferometers 1, 2 or autocollimators3 are currently, the most commonly used optical tools for non contact angle measurement. In both these systems, an optical beam is directed at a reflective surface and the information about the angular rotation of the device is derived, either from the interference effects of reflected beam with the reference beam or by sensing the position of the returned beam. The interferometric methods for angle measurement are generally more accurate but are extremely sensitive to the external disturbances. The autocollimator methods are relatively easier to handle but suffer from limited spatial resolution11.
Few other non contact methods for angle measurement have also grown in popularity. They include approaches
based on internal reflection effect4,6, heterodyne interferometry5, double exposure speckle photography7, speckle shearing interferometry8, parallel interference patters (PIP) 9, phase characteristics of surface plasma resonance (SPR) 10
e.t.c. . All these methods rely upon the coherence properties of the laser beam. The coherent noise makes the associated systems and processing procedures relatively complex. Recently, a few non coherent light based methods such as Lau interferometry11 and fringe analysis12, 13, 14 have also been reported for angle measurement. The use of non-coherent light for measurement makes the system operationally robust.
The present communication proposes a modified approach for small angle measurement using imaging method. The basic methodology is similar to the one earlier reported by Suzuki et.al.12. The novelty in the present approach lies in the use of a ‘composite coded pattern’ as the object for imaging and its associated processing algorithms for calculation of angular rotation. The proposed approach seeks to enhance the performance of the imaging method in respect of its maximum measurable range. The details of the proposed approach are discussed below.
*E-mail: [email protected]; Phone 080-2293-2741; Fax: +91- 080-23600135
Novel Optical Systems Design and Optimization IX, edited by José M. Sasian, Mary G. Turner,Proceedings of SPIE Vol. 6289, 62891D, (2006) · 0277-786X/06/$15 · doi: 10.1117/12.678792
Proc. of SPIE Vol. 6289 62891D-1

Image-A
Image-B
2. METHOD 2.1 Working Principle of the Imaging Method
The principle of small rotation angle measurement using imaging method is as shown in Fig.112. It involves a computer generated gray scale sinusoidal grating of pitch ‘P’, which is imaged by a plane mirror (M) placed on a precision rotating table. A CCD camera is used to capture the grating pattern imaged by the said mirror. The rotation of the mirror about the point O is estimated by processing a pair of images of the grating pattern, one of them captured before the tilt (Image-A) and the other, after affecting a tilt (Image-B). Effectively, the rotation of the mirror by an angle θ shifts the Image-B relative to the Image-A by an amount ‘S’. The patterns corresponding to the Image-A and the Images-B as they appear, when observed through a fixed window, are shown below. From a measurement of the shift ‘S’, the angular rotation of the mirror ‘θ’ is estimated using the relation
θ = 0.5 × arctan(S/d) (1)
Where S= (P/2Π) ×∆α
Fig. 1. Schematic diagram of angular measurement
2.1.1 Shift Measurement using Fourier Transform Method
The sinusoidal intensity variation in the grating pattern used as the object for imaging, facilitates the calculation of the shift ‘S’ using Fourier Transform approach. At any fixed observation point (x,y) in the image plane, a lateral shift ‘S’ in the images due to mirror rotation, effectively corresponds to a net change in the phase of the sinusoidal signal
Proc. of SPIE Vol. 6289 62891D-2
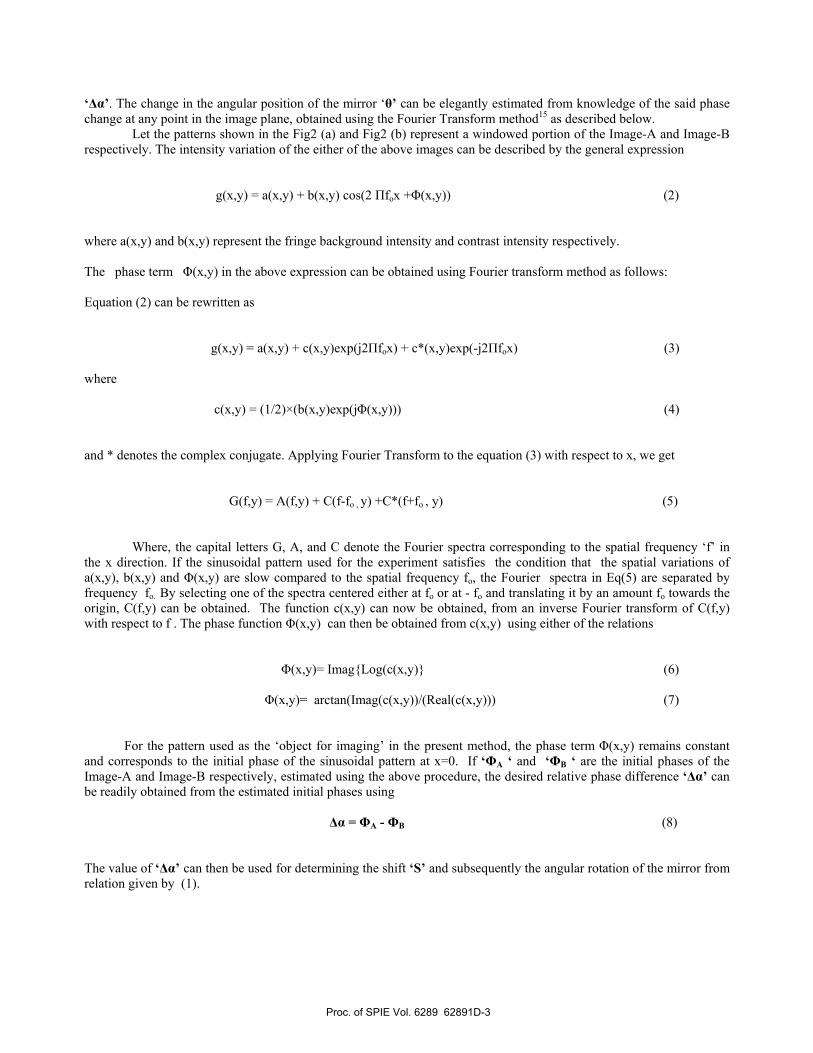
‘∆α’. The change in the angular position of the mirror ‘θ’ can be elegantly estimated from knowledge of the said phase change at any point in the image plane, obtained using the Fourier Transform method15 as described below.
Let the patterns shown in the Fig2 (a) and Fig2 (b) represent a windowed portion of the Image-A and Image-B respectively. The intensity variation of the either of the above images can be described by the general expression
g(x,y) = a(x,y) + b(x,y) cos(2 Πfox +Φ(x,y)) (2) where a(x,y) and b(x,y) represent the fringe background intensity and contrast intensity respectively. The phase term Φ(x,y) in the above expression can be obtained using Fourier transform method as follows: Equation (2) can be rewritten as
g(x,y) = a(x,y) + c(x,y)exp(j2Πfox) + c*(x,y)exp(-j2Πfox) (3) where
c(x,y) = (1/2)×(b(x,y)exp(jΦ(x,y))) (4)
and * denotes the complex conjugate. Applying Fourier Transform to the equation (3) with respect to x, we get
G(f,y) = A(f,y) + C(f-fo , y) +C*(f+fo , y) (5)
Where, the capital letters G, A, and C denote the Fourier spectra corresponding to the spatial frequency ‘f’ in the x direction. If the sinusoidal pattern used for the experiment satisfies the condition that the spatial variations of a(x,y), b(x,y) and Φ(x,y) are slow compared to the spatial frequency fo, the Fourier spectra in Eq(5) are separated by frequency fo. By selecting one of the spectra centered either at fo or at - fo and translating it by an amount fo towards the origin, C(f,y) can be obtained. The function c(x,y) can now be obtained, from an inverse Fourier transform of C(f,y) with respect to f . The phase function Φ(x,y) can then be obtained from c(x,y) using either of the relations
Φ(x,y)= Imag{Log(c(x,y)} (6)
Φ(x,y)= arctan(Imag(c(x,y))/(Real(c(x,y))) (7) For the pattern used as the ‘object for imaging’ in the present method, the phase term Φ(x,y) remains constant and corresponds to the initial phase of the sinusoidal pattern at x=0. If ‘ΦA ‘ and ‘ΦB ‘ are the initial phases of the Image-A and Image-B respectively, estimated using the above procedure, the desired relative phase difference ‘∆α’ can be readily obtained from the estimated initial phases using
∆α = ΦA - ΦB (8)
The value of ‘∆α’ can then be used for determining the shift ‘S’ and subsequently the angular rotation of the mirror from relation given by (1).
Proc. of SPIE Vol. 6289 62891D-3
2.1.2 Phase Problem
The initial phase of the windowed image estimated from either (6) or (7) is indeterminate to 2Π due to use of arctan function. In other words, the phase difference ‘∆α’ obtained from the relation (8) is wrapped in the range of – Π to + Π. The true value of the phase difference ∆αuw in an experiment can be larger than ∆α and is given by
∆αuw = ∆α + 2nΠ (9) where n is an integer. In the remaining part of this communication, ∆αuw and ∆α will be referred to as unwrapped and wrapped phase differences respectively. The phase value of ‘∆α’, when wrapped in the range of – Π to + Π, restricts the ‘maximum measurable range’ for the imaging method based on the single gray scale sinusoidal pattern. Its range is given by
θmax = 0.5×arctan(p/d) (10)
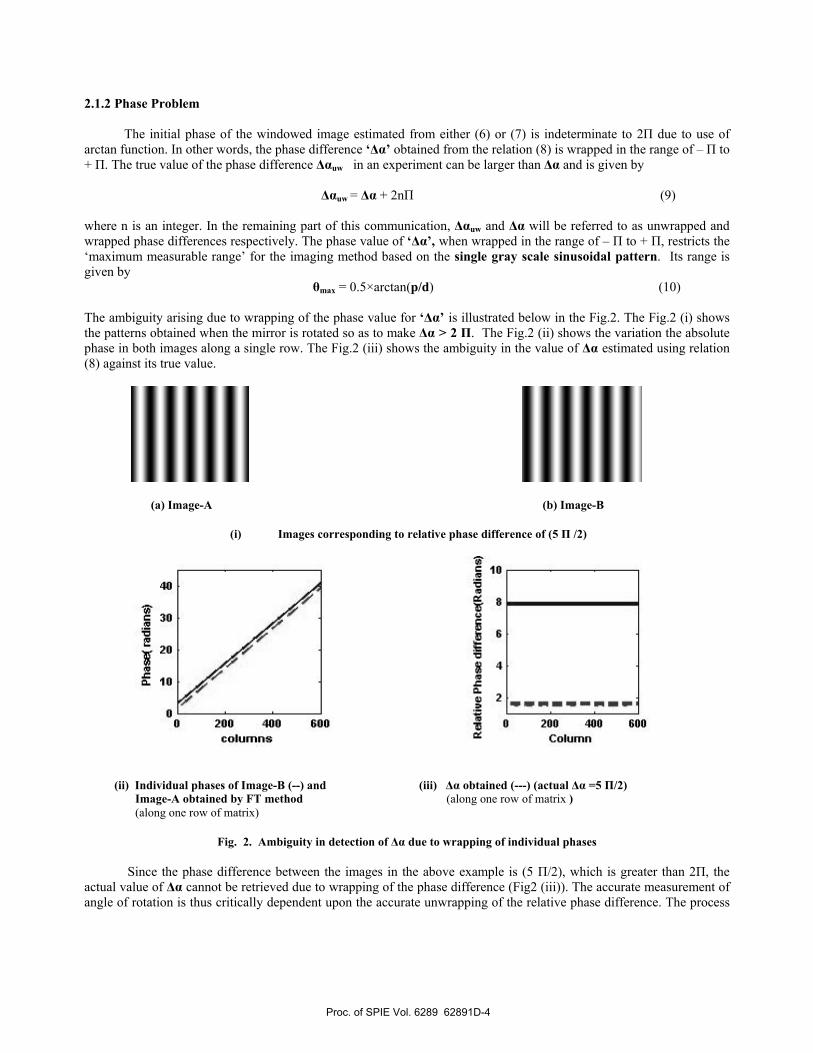
The ambiguity arising due to wrapping of the phase value for ‘∆α’ is illustrated below in the Fig.2. The Fig.2 (i) shows the patterns obtained when the mirror is rotated so as to make ∆α > 2 Π. The Fig.2 (ii) shows the variation the absolute phase in both images along a single row. The Fig.2 (iii) shows the ambiguity in the value of ∆α estimated using relation (8) against its true value.
(a) Image-A (b) Image-B
(i) Images corresponding to relative phase difference of (5 Π /2)
(ii) Individual phases of Image-B (--) and (iii) ∆α obtained (---) (actual ∆α =5 Π/2) Image-A obtained by FT method (along one row of matrix ) (along one row of matrix)
Fig. 2. Ambiguity in detection of ∆α due to wrapping of individual phases
Since the phase difference between the images in the above example is (5 Π/2), which is greater than 2Π, the actual value of ∆α cannot be retrieved due to wrapping of the phase difference (Fig2 (iii)). The accurate measurement of angle of rotation is thus critically dependent upon the accurate unwrapping of the relative phase difference. The process
Proc. of SPIE Vol. 6289 62891D-4
of unwrapping is a process of determining the value of n shown in the relation (9) and essentially involves addition/ subtraction of proper integer multiples of 2Π to ‘∆α’ obtained from the relation (8). To overcome this problem, Suzuki et al proposed a two-grating method, wherein, two sinusoidal patterns of different pitches were used12. The sinusoidal grating of higher pitch is used for unwrapping the relative phase difference obtained from the other sinusoidal pattern of the lower pitch. It has been shown that the measurement range from this approach is solely determined by the sinusoidal pattern of the larger pitch. 2.2 Proposed approach
The present approach overcomes the aforementioned problem by using a novel composite coded pattern. The proposed coded pattern facilitates a simple unwrapping method, for determination of number of 2Π’s to be added to the wrapped phase obtained from the sinusoidal pattern using FFT analysis. The details of the design features of the composite coded pattern and its associated processing algorithm for unambiguous calculation of rotational angle are described in the following sections. 2.2.1 Composite Coded Pattern
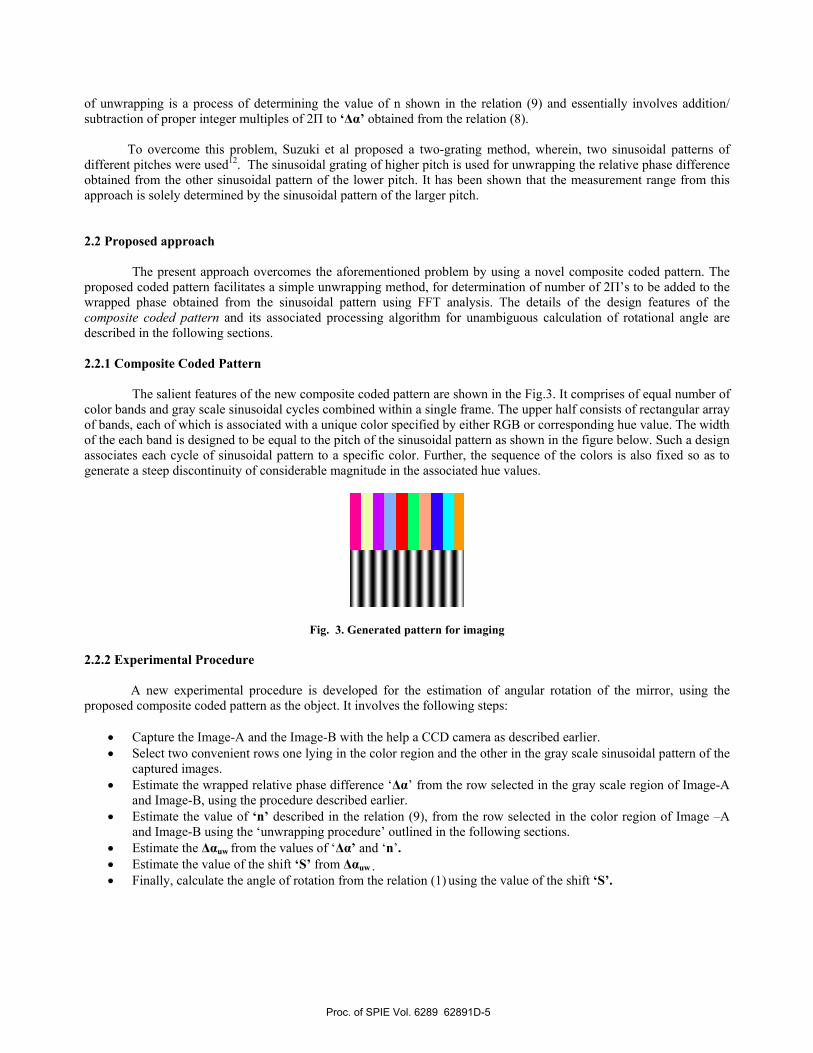
The salient features of the new composite coded pattern are shown in the Fig.3. It comprises of equal number of color bands and gray scale sinusoidal cycles combined within a single frame. The upper half consists of rectangular array of bands, each of which is associated with a unique color specified by either RGB or corresponding hue value. The width of the each band is designed to be equal to the pitch of the sinusoidal pattern as shown in the figure below. Such a design associates each cycle of sinusoidal pattern to a specific color. Further, the sequence of the colors is also fixed so as to generate a steep discontinuity of considerable magnitude in the associated hue values.
Fig. 3. Generated pattern for imaging
2.2.2 Experimental Procedure A new experimental procedure is developed for the estimation of angular rotation of the mirror, using the proposed composite coded pattern as the object. It involves the following steps:
• Capture the Image-A and the Image-B with the help a CCD camera as described earlier. • Select two convenient rows one lying in the color region and the other in the gray scale sinusoidal pattern of the
captured images. • Estimate the wrapped relative phase difference ‘∆α’ from the row selected in the gray scale region of Image-A
and Image-B, using the procedure described earlier. • Estimate the value of ‘n’ described in the relation (9), from the row selected in the color region of Image –A
and Image-B using the ‘unwrapping procedure’ outlined in the following sections. • Estimate the ∆αuw from the values of ‘∆α’ and ‘n’. • Estimate the value of the shift ‘S’ from ∆αuw . • Finally, calculate the angle of rotation from the relation (1) using the value of the shift ‘S’.
Proc. of SPIE Vol. 6289 62891D-5
2.2.3 Unwrapping Procedure The color bands of the composite coded pattern, provides the necessary key for determining the value of ‘n’. The basic processing for the extraction of the color information (and hence ‘n’) involves the following steps:
• Select a particular convenient point on the chosen row lying in the color region of the Image-A and Image-B • Determine the corresponding indices at the selected point in said images, using the procedure outlined in the
following section • Estimate the value of ‘n’ from the numerical difference of the indices • Unwrap the measured ‘∆α’ using the value of ‘n’.
.
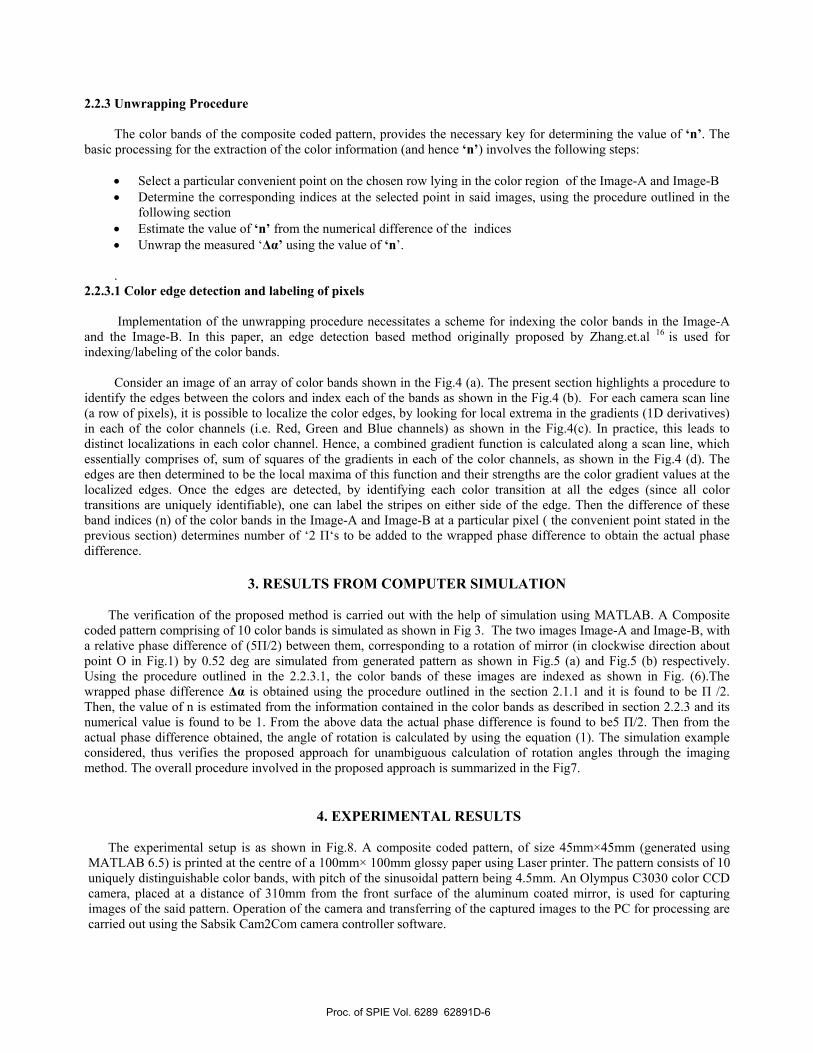
2.2.3.1 Color edge detection and labeling of pixels Implementation of the unwrapping procedure necessitates a scheme for indexing the color bands in the Image-A and the Image-B. In this paper, an edge detection based method originally proposed by Zhang.et.al 16 is used for indexing/labeling of the color bands. Consider an image of an array of color bands shown in the Fig.4 (a). The present section highlights a procedure to identify the edges between the colors and index each of the bands as shown in the Fig.4 (b). For each camera scan line (a row of pixels), it is possible to localize the color edges, by looking for local extrema in the gradients (1D derivatives) in each of the color channels (i.e. Red, Green and Blue channels) as shown in the Fig.4(c). In practice, this leads to distinct localizations in each color channel. Hence, a combined gradient function is calculated along a scan line, which essentially comprises of, sum of squares of the gradients in each of the color channels, as shown in the Fig.4 (d). The edges are then determined to be the local maxima of this function and their strengths are the color gradient values at the localized edges. Once the edges are detected, by identifying each color transition at all the edges (since all color transitions are uniquely identifiable), one can label the stripes on either side of the edge. Then the difference of these band indices (n) of the color bands in the Image-A and Image-B at a particular pixel ( the convenient point stated in the previous section) determines number of ‘2 Π‘s to be added to the wrapped phase difference to obtain the actual phase difference.
3. RESULTS FROM COMPUTER SIMULATION
The verification of the proposed method is carried out with the help of simulation using MATLAB. A Composite
coded pattern comprising of 10 color bands is simulated as shown in Fig 3. The two images Image-A and Image-B, with a relative phase difference of (5Π/2) between them, corresponding to a rotation of mirror (in clockwise direction about point O in Fig.1) by 0.52 deg are simulated from generated pattern as shown in Fig.5 (a) and Fig.5 (b) respectively. Using the procedure outlined in the 2.2.3.1, the color bands of these images are indexed as shown in Fig. (6).The wrapped phase difference ∆α is obtained using the procedure outlined in the section 2.1.1 and it is found to be Π /2. Then, the value of n is estimated from the information contained in the color bands as described in section 2.2.3 and its numerical value is found to be 1. From the above data the actual phase difference is found to be5 Π/2. Then from the actual phase difference obtained, the angle of rotation is calculated by using the equation (1). The simulation example considered, thus verifies the proposed approach for unambiguous calculation of rotation angles through the imaging method. The overall procedure involved in the proposed approach is summarized in the Fig7.
4. EXPERIMENTAL RESULTS
The experimental setup is as shown in Fig.8. A composite coded pattern, of size 45mm×45mm (generated using
MATLAB 6.5) is printed at the centre of a 100mm× 100mm glossy paper using Laser printer. The pattern consists of 10 uniquely distinguishable color bands, with pitch of the sinusoidal pattern being 4.5mm. An Olympus C3030 color CCD camera, placed at a distance of 310mm from the front surface of the aluminum coated mirror, is used for capturing images of the said pattern. Operation of the camera and transferring of the captured images to the PC for processing are carried out using the Sabsik Cam2Com camera controller software.
Proc. of SPIE Vol. 6289 62891D-6
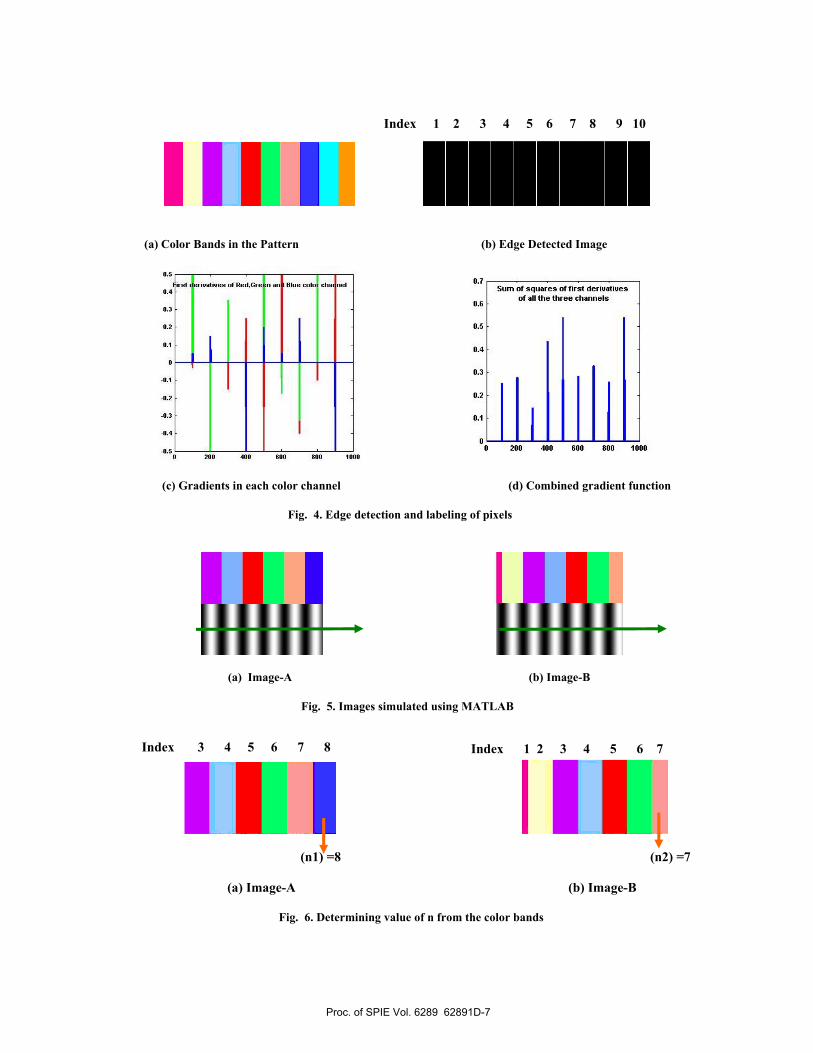
(a) Color Bands in the Pattern (b) Edge Detected Image
(c) Gradients in each color channel (d) Combined gradient function Fig. 4. Edge detection and labeling of pixels
(a) Image-A (b) Image-B Fig. 5. Images simulated using MATLAB
(n1) =8 (n2) =7 (a) Image-A (b) Image-B Fig. 6. Determining value of n from the color bands
Index 1 2 3 4 5 6 7 8 9 10
Index 3 4 5 6 7 8 Index 1 2 3 4 5 6 7
Proc. of SPIE Vol. 6289 62891D-7

Generated Pattern
Image-A Image -B
Fig.7 Procedure involved in calculation of rotation angle
Convert RGB to Gray
Apply FT Method to the row
Get Individual Phases (ΦA,ΦB)
Find wrapped Phase Difference
(∆α = ΦA-ΦB)
∆αunw = ∆α + 2*Π*n
Index the color bands in Image-A and Image-B
Get corresponding Indices
(n1/n2)
Find difference of Indices (n=n1~n2)
Calculate angle of rotation
Proc. of SPIE Vol. 6289 62891D-8

Fig.8 Experimental Arrangement
(a) Image -A (b) Image-B
Fig.9 Images captured by CCD camera
(i) Without Correction Factor (ii) With correction factor Fig.10 Relation between the angular rotation of mirror and unwrapped relative phase difference
Proc. of SPIE Vol. 6289 62891D-9
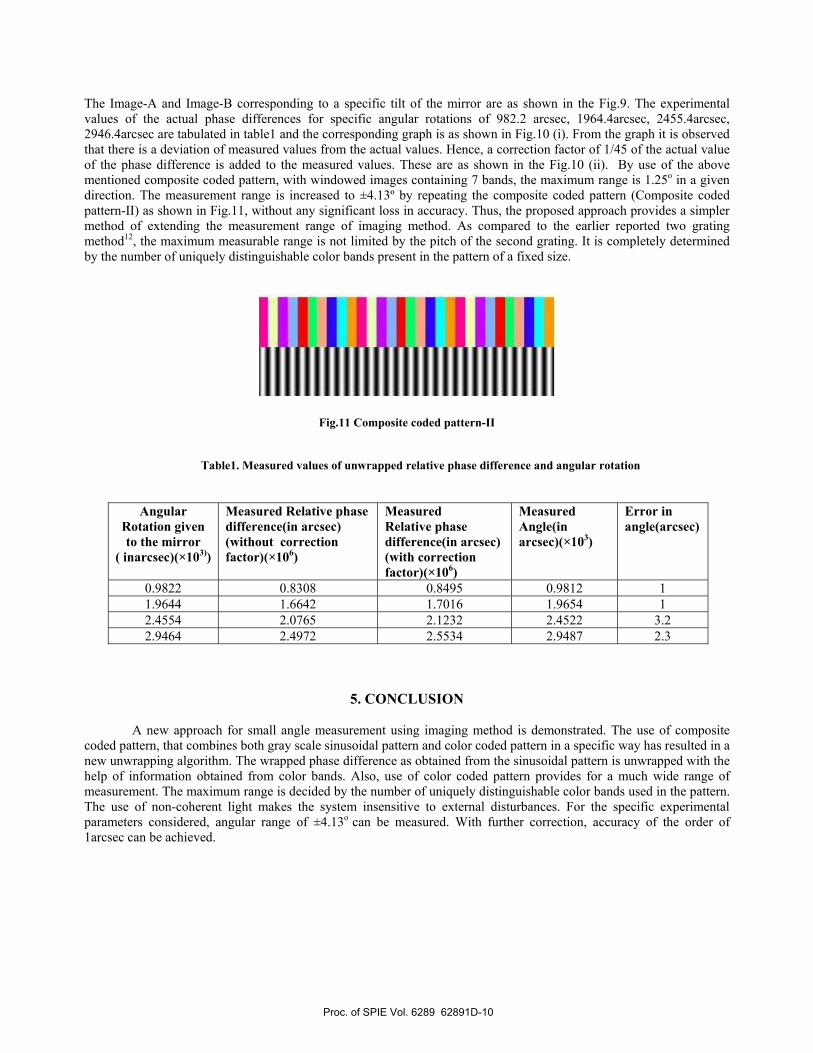
The Image-A and Image-B corresponding to a specific tilt of the mirror are as shown in the Fig.9. The experimental values of the actual phase differences for specific angular rotations of 982.2 arcsec, 1964.4arcsec, 2455.4arcsec, 2946.4arcsec are tabulated in table1 and the corresponding graph is as shown in Fig.10 (i). From the graph it is observed that there is a deviation of measured values from the actual values. Hence, a correction factor of 1/45 of the actual value of the phase difference is added to the measured values. These are as shown in the Fig.10 (ii). By use of the above mentioned composite coded pattern, with windowed images containing 7 bands, the maximum range is 1.25o in a given direction. The measurement range is increased to ±4.13º by repeating the composite coded pattern (Composite coded pattern-II) as shown in Fig.11, without any significant loss in accuracy. Thus, the proposed approach provides a simpler method of extending the measurement range of imaging method. As compared to the earlier reported two grating method12, the maximum measurable range is not limited by the pitch of the second grating. It is completely determined by the number of uniquely distinguishable color bands present in the pattern of a fixed size.
Fig.11 Composite coded pattern-II
Table1. Measured values of unwrapped relative phase difference and angular rotation
Angular Rotation given to the mirror
( inarcsec)(×103))
Measured Relative phase difference(in arcsec) (without correction factor)(×106)
Measured Relative phase difference(in arcsec) (with correction factor)(×106)
Measured Angle(in arcsec)(×103)
Error in angle(arcsec)
0.9822 0.8308 0.8495 0.9812 1 1.9644 1.6642 1.7016 1.9654 1 2.4554 2.0765 2.1232 2.4522 3.2 2.9464 2.4972 2.5534 2.9487 2.3
5. CONCLUSION
A new approach for small angle measurement using imaging method is demonstrated. The use of composite coded pattern, that combines both gray scale sinusoidal pattern and color coded pattern in a specific way has resulted in a new unwrapping algorithm. The wrapped phase difference as obtained from the sinusoidal pattern is unwrapped with the help of information obtained from color bands. Also, use of color coded pattern provides for a much wide range of measurement. The maximum range is decided by the number of uniquely distinguishable color bands used in the pattern. The use of non-coherent light makes the system insensitive to external disturbances. For the specific experimental parameters considered, angular range of ±4.13o can be measured. With further correction, accuracy of the order of 1arcsec can be achieved.
Proc. of SPIE Vol. 6289 62891D-10

6. REFERENCES
1. Malacara D and Harris O, “Interferometric Measurement of Angles,” Appl. Opt. 9(7), 1630-1633 (1970). 2. Masroor Ikram and Ghazanfar Hussain, “Michelson interferometer for precision angle measurement,” Appl.Opt.
38(1), 113-120 (1999). 3. Jie Yuan and Xingwu Long, “CCD-area-based autocollimator for precision small-angle measurement,” Review
of Scientific Instruments. 74(3), 1362-1365(2003). 4. Weidong Zhou and Lilong Cai, “Interferometer for small-angle measurement based on total internal reflection,”
Appl.Opt. 37(25), 5957-5963 (1998). 5. M.H.Chiu and D.C.Su, “Angle measurement using total internal reflection heterodyne interferometry,” Opt.Eng.
36(6), 1750-1753 (1997). 6. M.H.Chiu and D.C.Su, “Improved technique for measuring small angles,” Appl. Opt. 36(28), 7104-7106
(1997). 7. K.S.Darmasaktu, A.Kumar, K.Singh, “Measurement of tilt of a diffuse object by double-exposure speckle
photography using speckle fanning in a photo refractive BaTiO3 crystal,” Opt. Lasers Eng. 36,331-344 (2001). 8. R.S.Sirohi, A.R.Ganesan, and B.C.Tan, “Tilt measurement using digital speckle shear interferometry,” Opt.
Laser Technol. 24(5), 257-261 (1992). 9. Xiaoli Dai, Osami Sasaki, Jhon E.Greivenkamp, and Takamasa Suzuki, “High accuracy, wide range, rotation
angle measurement by the use of two parallel interference patterns,” Appl. Opt. 36(25), 6190-6195 (1997). 10. G.Margheri, A.Mannoni, and F.Quercioli, “High-resolution angular and displacement sensing based on the
excitation of surface plasma waves,” Appl. Opt. 36(19), 4521-4525 (1997). 11. Shashi Prakash, Sumitra Singh, and Santosh Rana, “Automated small tilt angle measurement using Lau
interferometry,” Appl. Opt. 44(28), 5905-5909 (2005). 12. Takamasa Suzuki, Hideki Nakamura, Osami Sasaki, John E. Greivenkamp, “Small-rotation-angle measurement
using an imaging method,” Opt. Eng. 40(3), 426-432 (2001). 13. Zongtao Ge and Mitsuo Takeda,”High-resolution two-dimensional angle measurement technique based on
fringe analysis,” Appl.Opt. 34(42), 6859-6868 (2003). 14. Takamasa Suzuki, Takanori Endo, Osami Sasaki, John E Greivenkamp, “Two-dimensional small-rotation-
angle measurement using an imaging method,” 45(4), (043604-1)-(043604-7) (April 2006). 15. Mitsuo Takeda and Kazuhiro Mutoh, “Fourier transform profilometry for the automatic measurement of 3-D
object shapes,” Appl. Opt. 22(24), 3977-3982 (1983). 16. L. Zhang, B. Curless, and S. M. Seitz, “Rapid shape acquisition using color structured light and multi-pass dynamic programming,” In IEEE 3D Data Processing Visualization and Transmission, 2002.
Proc. of SPIE Vol. 6289 62891D-11