novatek, moscow, russia 23 december 2008
TRANSCRIPT
Strategy Update 2009 – Conference CallStrategy Update 2009 Conference Call
NOVATEK, Moscow, Russia
23 December 2008
Disclaimer
This presentation does not constitute or form part of, and should not be construed as, an offer to sell or issue or the solicitation of anoffer to buy or acquire securities of the Company or any of its subsidiaries in any jurisdiction or an inducement to enter intoinvestment activity in any jurisdiction Neither this presentation nor any part thereof nor the fact of its distribution shall form theinvestment activity in any jurisdiction. Neither this presentation nor any part thereof, nor the fact of its distribution, shall form thebasis of, or be relied on in connection with, any contract or commitment or investment decision whatsoever. The informationcontained in this presentation has not been independently verified. The information in this presentation is subject to verification,completion and change without notice and neither the Company is under any obligation to update or keep current the informationcontained herein. Accordingly, no representation or warranty, express or implied, is made or given by or on behalf of the Companyor any of its respective members, directors, officers or employees nor any other person accepts any liability whatsoever (iny p , , p y y p p y y (negligence or otherwise) for any loss howsoever arising from any use of this presentation or its contents or otherwise arising inconnection therewith.
This presentation and the information contained herein does not constitute and should not be construed as an offer to sell or thesolicitation of an offer to buy securities in the United States as defined in Regulation S under the US Securities Act of 1933 (the"Securities Act"). Any securities of the Company may not be offered or sold in the United States absent registration or an exemptionfrom registration under the Securities Act. The Company has not registered and does not intend to register any portion of theOffering in the United States or to conduct a public offering of securities in the United States.
This presentation does not constitute a public offering or an advertisement of securities in the Russian Federation and does notconstitute an offer or a proposal to make offers or to acquire any securities in the Russian Federationconstitute an offer or a proposal to make offers or to acquire any securities in the Russian Federation.
This presentation contains "forward-looking statements" which include all statements other than statements of historical fact. Suchforward-looking statements can often be identified by words such as "plans," "expects," "intends," "estimates," "will," "may,""continue," "should" and similar expressions. Such forward-looking statements involve known and unknown risks, uncertainties andother important factors beyond the Company’s control that could cause the actual results, performance or achievements of thep y p y , pCompany to be materially different from future results, performance or achievements expressed or implied by such forward-lookingstatements. Such forward-looking statements are based on numerous assumptions regarding the Company’s present and futurebusiness strategies and the environment in which the Company will operate in the future. By their nature, forward-lookingstatements involve risks and uncertainties because they relate to events and depend on circumstances that may or may not occur inthe future. These forward-looking statements speak only as at the date as of which they are made, and none of the Company or any
2
of its respective agents, employees or advisors intends or has any duty or obligation to supplement, amend, update or revise any ofthe forward-looking statements contained herein to reflect any change in the Company’s expectations with regard thereto or anychange in events, conditions or circumstances on which any such statements are based. The information and opinions contained inthis presentation are provided as at the date of this presentation and are subject to change without notice.
Presentation Team
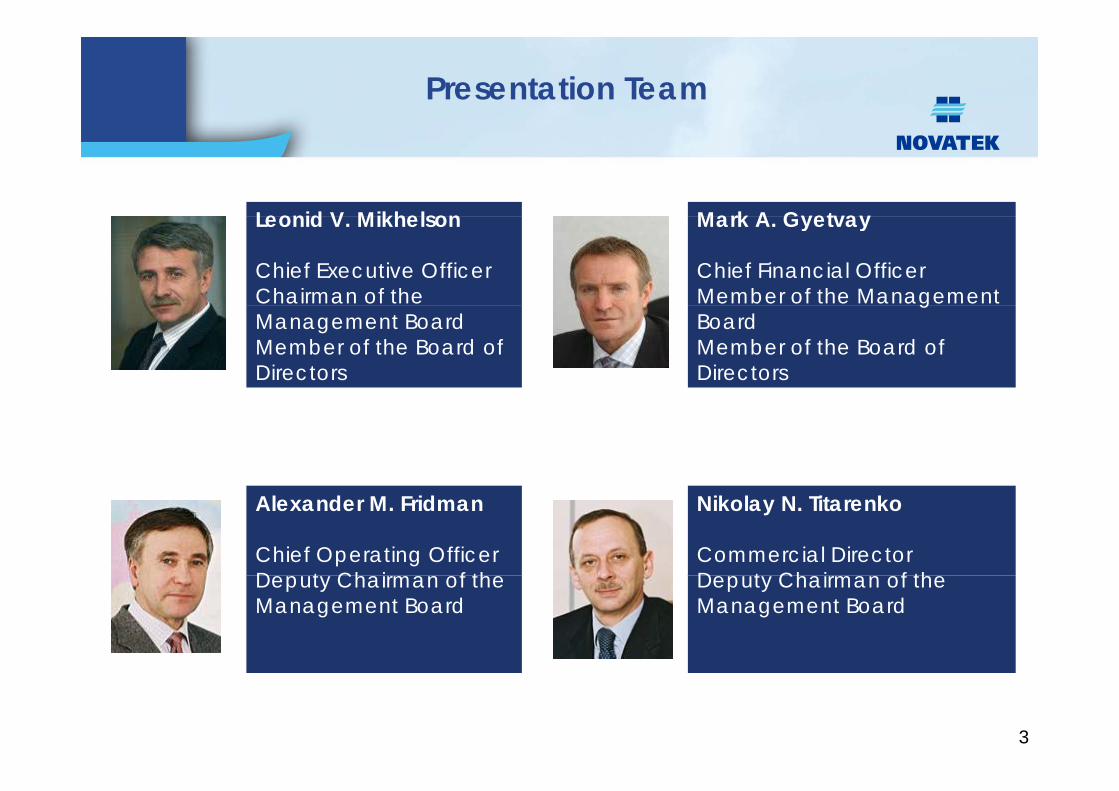
Leonid V Mikhelson Mark A GyetvayLeonid V. Mikhelson
Chief Executive Officer Chairman of the
Mark A. Gyetvay
Chief Financial Officer Member of the Management
Management BoardMember of the Board of Directors
gBoardMember of the Board of Directors
Alexander M. Fridman
Chief Operating Officer D t Ch i f th
Nikolay N. Titarenko
Commercial Director D t Ch i f thDeputy Chairman of the
Management BoardDeputy Chairman of the Management Board
3
Agenda
Section Slide #
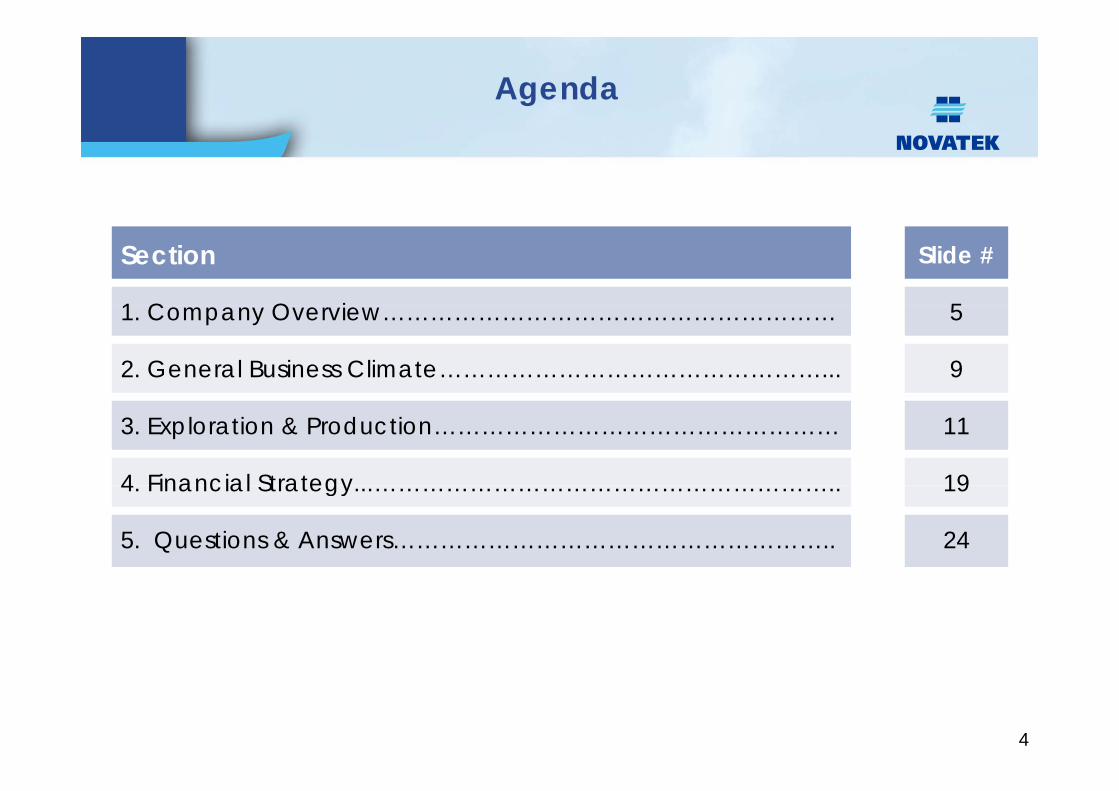
1 C O i 51. Company Overview………………………………………………… 5
2. General Business Climate…………………………………………... 9
3. Exploration & Production…………………………………………… 11
4 Financial Strategy 194. Financial Strategy...………………………………………………….. 19
5. Questions & Answers……………………………………………….. 24
4

Section 1: C O iCompany Overview
5
Our Strategy In Motion
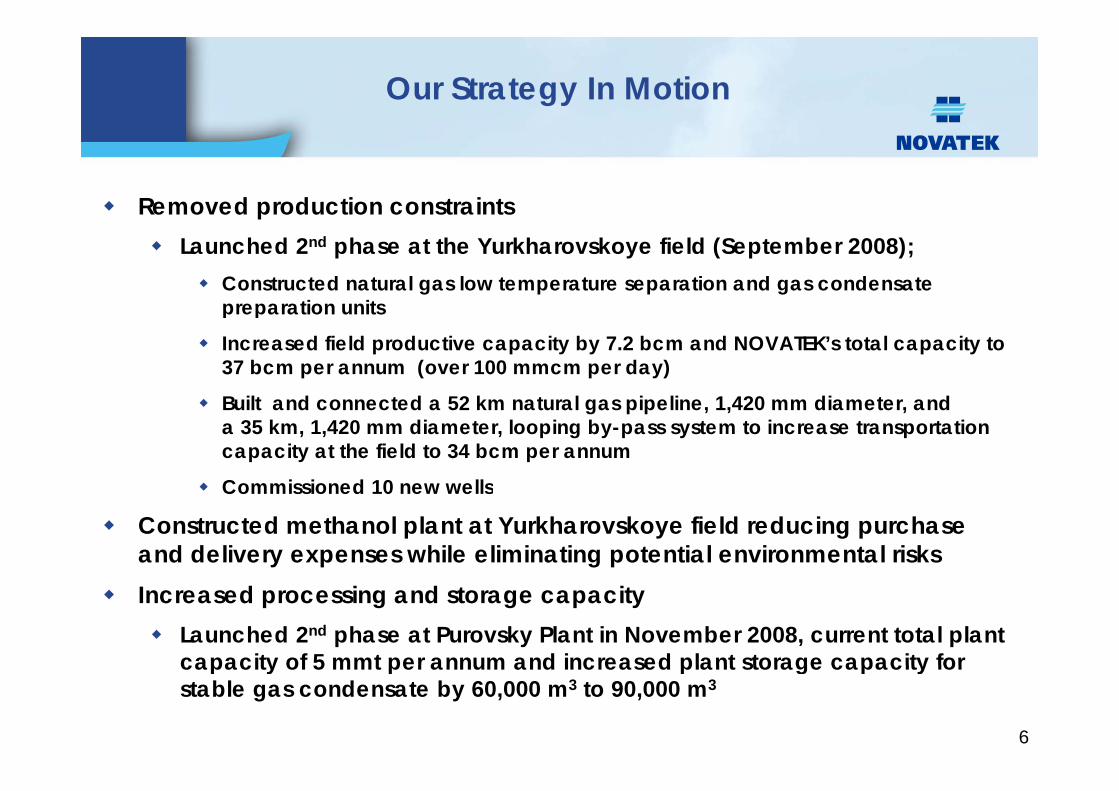
Removed production constraintspLaunched 2nd phase at the Yurkharovskoye field (September 2008);
Constructed natural gas low temperature separation and gas condensate preparation unitspreparation units
Increased field productive capacity by 7.2 bcm and NOVATEK’s total capacity to 37 bcm per annum (over 100 mmcm per day)
ilt d t d 2 k t l i li 420 di t dBuilt and connected a 52 km natural gas pipeline, 1,420 mm diameter, and a 35 km, 1,420 mm diameter, looping by-pass system to increase transportation capacity at the field to 34 bcm per annum
Commissioned 10 new wellsCommissioned 10 new wells
Constructed methanol plant at Yurkharovskoye field reducing purchase and delivery expenses while eliminating potential environmental risksIncreased processing and storage capacity
Launched 2nd phase at Purovsky Plant in November 2008, current total plant capacity of 5 mmt per annum and increased plant storage capacity forcapacity of 5 mmt per annum and increased plant storage capacity for stable gas condensate by 60,000 m3 to 90,000 m3
6
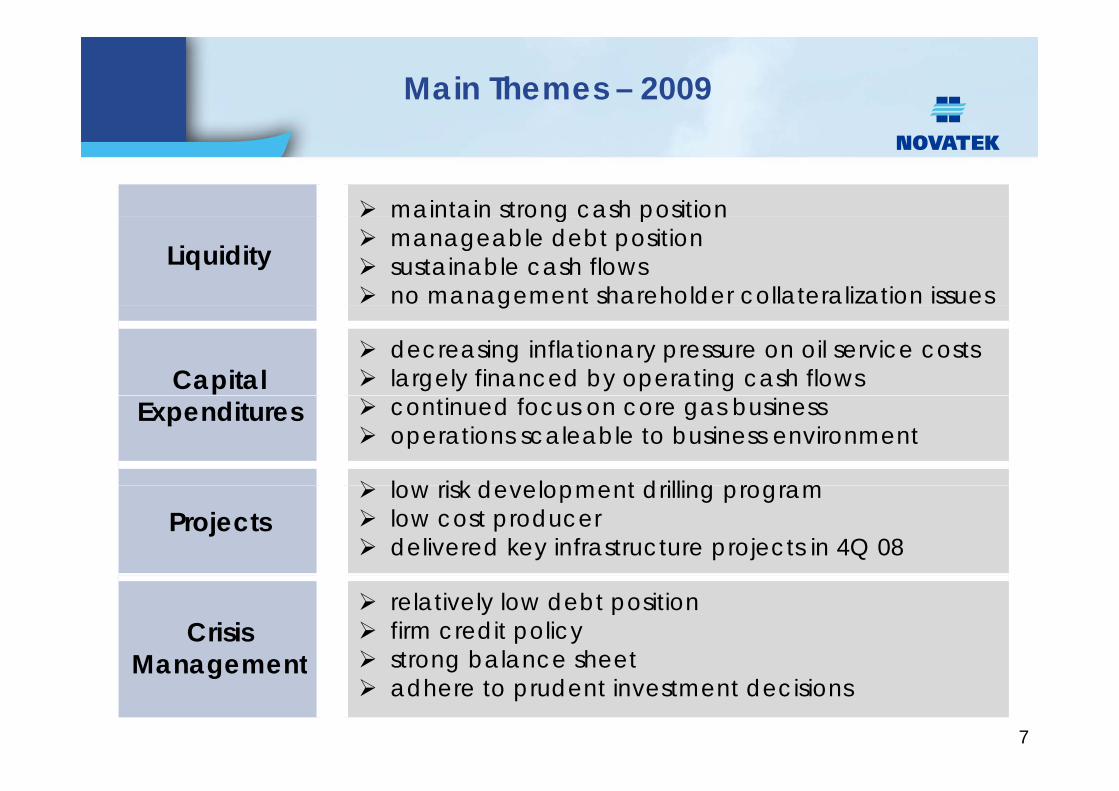
Main Themes – 2009
maintain strong cash position
Liquiditymaintain strong cash positionmanageable debt positionsustainable cash flowsno management shareholder collateralization issuesg
Capital decreasing inflationary pressure on oil service costslargely financed by operating cash flows
Expenditures continued focus on core gas businessoperations scaleable to business environment
low risk development drilling programProjects
low risk development drilling programlow cost producerdelivered key infrastructure projects in 4Q 08
Crisis Management
relatively low debt positionfirm credit policystrong balance sheetManagement strong balance sheetadhere to prudent investment decisions
7
Looking Ahead - Focus On Core Gas Segment
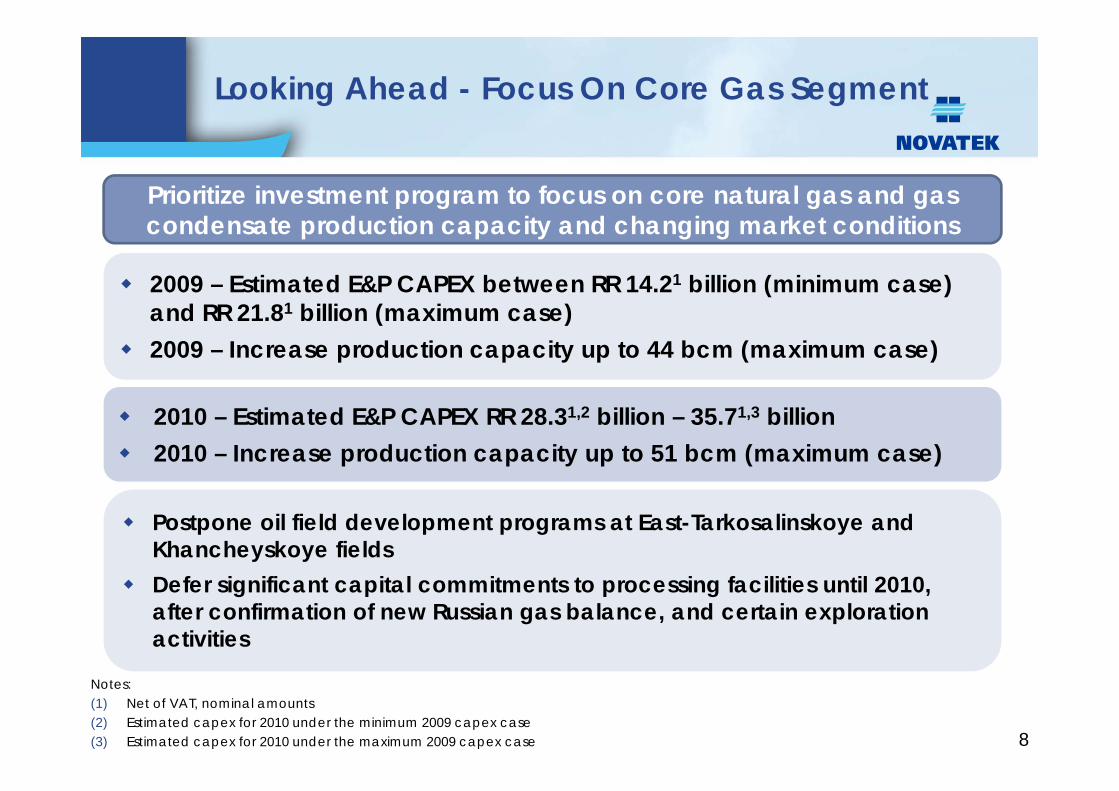
Prioritize investment program to focus on core natural gas and gas d t d ti it d h i k t diti
2009 – Estimated E&P CAPEX between RR 14.21 billion (minimum case) d RR 21 81 billi ( i )
condensate production capacity and changing market conditions
and RR 21.81 billion (maximum case)2009 – Increase production capacity up to 44 bcm (maximum case)
2010 – Estimated E&P CAPEX RR 28.31,2 billion – 35.71,3 billion2010 – Increase production capacity up to 51 bcm (maximum case)
Postpone oil field development programs at East-Tarkosalinskoye and Khancheyskoye fields Defer significant capital commitments to processing facilities until 2010, after confirmation of new Russian gas balance, and certain exploration activities
8
Notes:(1) Net of VAT, nominal amounts(2) Estimated capex for 2010 under the minimum 2009 capex case(3) Estimated capex for 2010 under the maximum 2009 capex case
Section 2: G l B i Cli tGeneral Business Climate
9
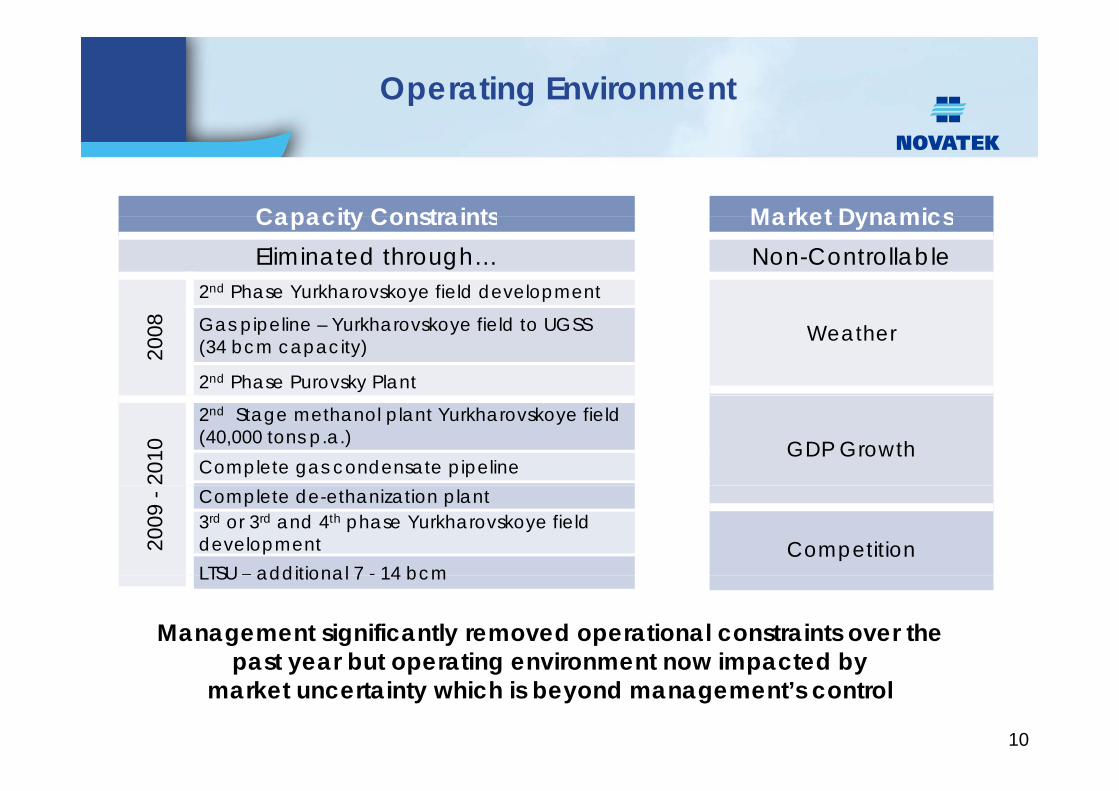
Operating Environment
Capacity Constraints Market DynamicsCapacity Constraints Market DynamicsEliminated through… Non-Controllable
2nd Phase Yurkharovskoye field development
2008 WeatherGas pipeline – Yurkharovskoye field to UGSS
(34 bcm capacity)
2nd Phase Purovsky Plant
GDP Growth
2010
2nd Stage methanol plant Yurkharovskoye field (40,000 tons p.a.)Complete gas condensate pipeline
2009
- Complete de-ethanization plant
Competition3rd or 3rd and 4th phase Yurkharovskoye field developmentLTSU – additional 7 - 14 bcmLTSU additional 7 14 bcm
Management significantly removed operational constraints over the past year but operating environment now impacted by
10
past year but operating environment now impacted by market uncertainty which is beyond management’s control
Section 3: E l ti & P d tiExploration & Production
11
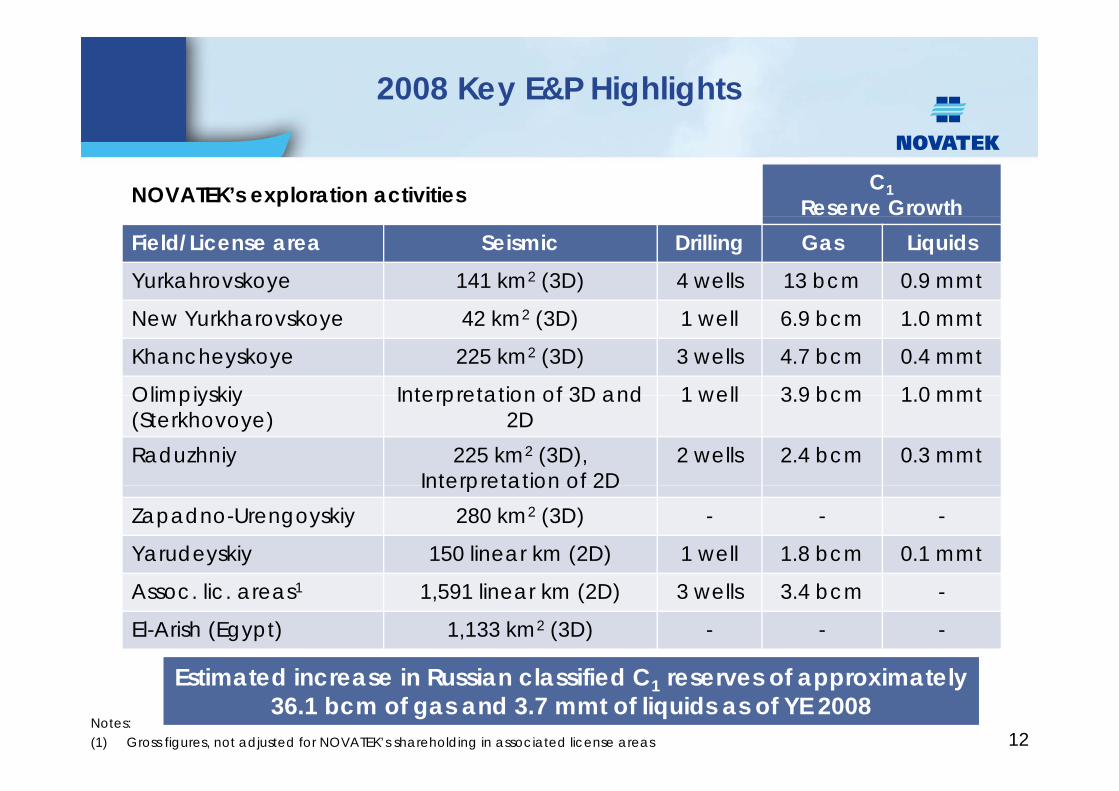
2008 Key E&P Highlights
NOVATEK’s exploration activities C1Reserve Growth
Field/License area Seismic Drilling Gas LiquidsYurkahrovskoye 141 km2 (3D) 4 wells 13 bcm 0.9 mmt
New Yurkharovskoye 42 km2 (3D) 1 well 6.9 bcm 1.0 mmt
Khancheyskoye 225 km2 (3D) 3 wells 4.7 bcm 0.4 mmt
Olimpiyskiy Interpretation of 3D and 1 well 3 9 bcm 1 0 mmtOlimpiyskiy(Sterkhovoye)
Interpretation of 3D and2D
1 well 3.9 bcm 1.0 mmt
Raduzhniy 225 km2 (3D),Interpretation of 2D
2 wells 2.4 bcm 0.3 mmtInterpretation of 2D
Zapadno-Urengoyskiy 280 km2 (3D) - - -
Yarudeyskiy 150 linear km (2D) 1 well 1.8 bcm 0.1 mmt
Assoc. lic. areas1 1,591 linear km (2D) 3 wells 3.4 bcm -
El-Arish (Egypt) 1,133 km2 (3D) - - -
12
Estimated increase in Russian classified C1 reserves of approximately 36.1 bcm of gas and 3.7 mmt of liquids as of YE 2008
Notes:(1) Gross figures, not adjusted for NOVATEK’s shareholding in associated license areas
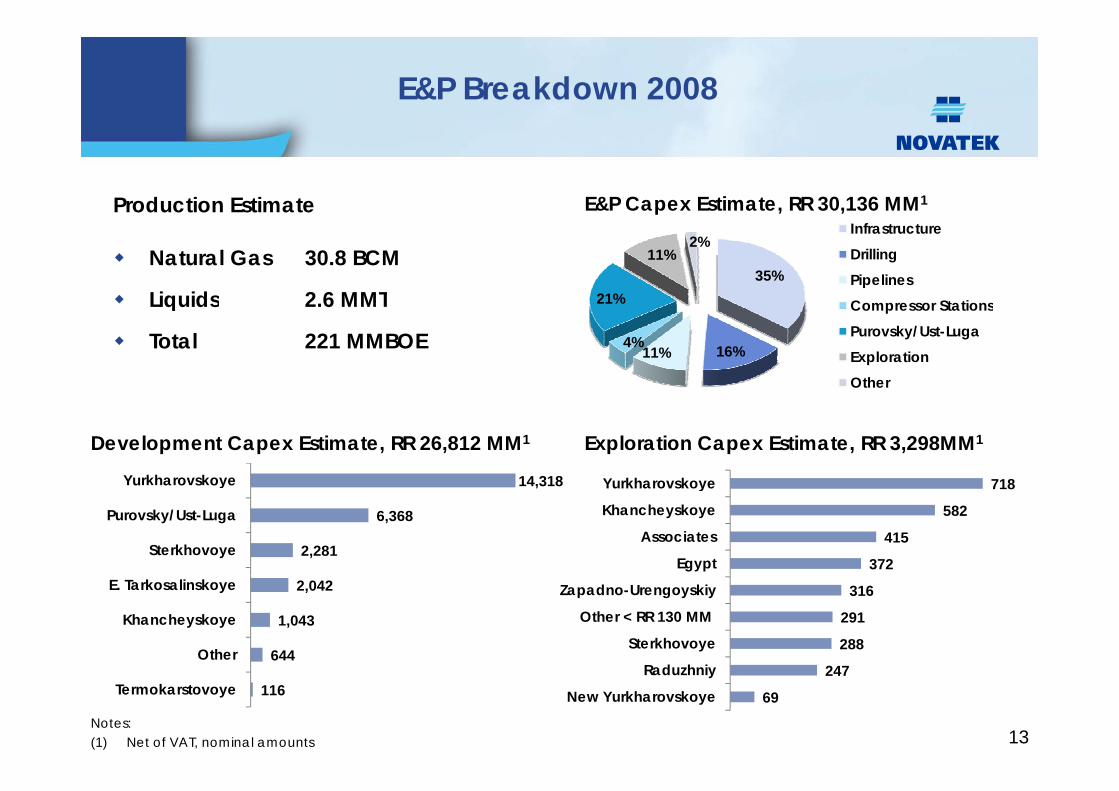
E&P Breakdown 2008
Production Estimate E&P Capex Estimate, RR 30,136 MM1
Natural Gas 30.8 BCM
Liquids 2.6 MMT35%
21%
11%2%
InfrastructureDrillingPipelinesCompressor StationsLiquids 2.6 MMT
Total 221 MMBOE 16%11%4%
Compressor StationsPurovsky/Ust-LugaExplorationOther
Exploration Capex Estimate, RR 3,298MM1Development Capex Estimate, RR 26,812 MM1
14,318Yurkharovskoye 718Yurkharovskoye
2,281
6,368
14,318
Sterkhovoye
Purovsky/Ust-Luga
u a o s oye
372
415
582
718
Egypt
Associates
Khancheyskoye
Yurkharovskoye
644
1,043
2,042
Other
Khancheyskoye
E. Tarkosalinskoye
288
291
316
R d h i
Sterkhovoye
Other < RR 130 MM
Zapadno-Urengoyskiy
Notes:(1) Net of VAT, nominal amounts
116Termokarstovoye
13
69
247New Yurkharovskoye
Raduzhniy
E&P Program 2009 and 2010
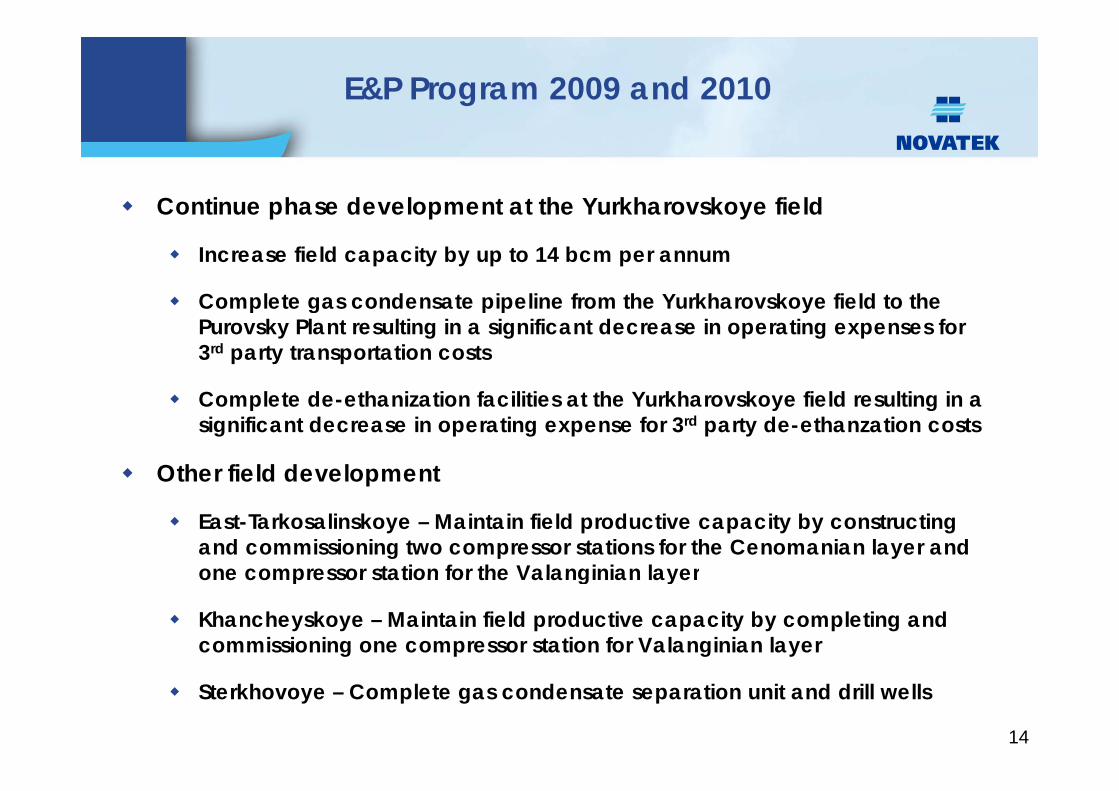
Continue phase development at the Yurkharovskoye field p p y
Increase field capacity by up to 14 bcm per annum
Complete gas condensate pipeline from the Yurkharovskoye field to theComplete gas condensate pipeline from the Yurkharovskoye field to the Purovsky Plant resulting in a significant decrease in operating expenses for 3rd party transportation costs
Complete de ethanization facilities at the Yurkharovskoye field resulting in aComplete de-ethanization facilities at the Yurkharovskoye field resulting in a significant decrease in operating expense for 3rd party de-ethanzation costs
Other field developmentp
East-Tarkosalinskoye – Maintain field productive capacity by constructing and commissioning two compressor stations for the Cenomanian layer and one compressor station for the Valanginian layerone compressor station for the Valanginian layer
Khancheyskoye – Maintain field productive capacity by completing and commissioning one compressor station for Valanginian layer
Sterkhovoye – Complete gas condensate separation unit and drill wells
14
E&P Program 2009 and 2010
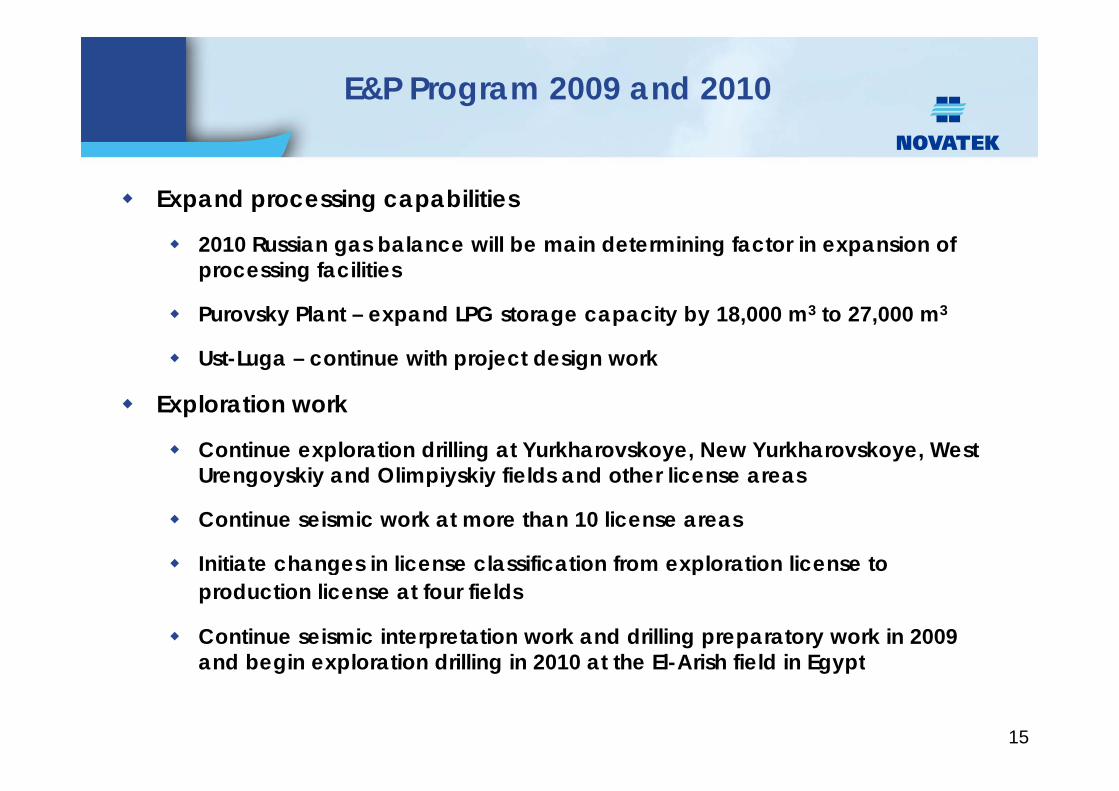
Expand processing capabilities
2010 Russian gas balance will be main determining factor in expansion of processing facilities
k l d G i b 8 000 3 2 000 3Purovsky Plant – expand LPG storage capacity by 18,000 m3 to 27,000 m3
Ust-Luga – continue with project design work
E l ti kExploration work
Continue exploration drilling at Yurkharovskoye, New Yurkharovskoye, West Urengoyskiy and Olimpiyskiy fields and other license areasg y y p y y
Continue seismic work at more than 10 license areas
Initiate changes in license classification from exploration license to gproduction license at four fields
Continue seismic interpretation work and drilling preparatory work in 2009 and begin exploration drilling in 2010 at the El-Arish field in Egyptand begin exploration drilling in 2010 at the El-Arish field in Egypt
15
E&P CAPEX Forecast - 2009
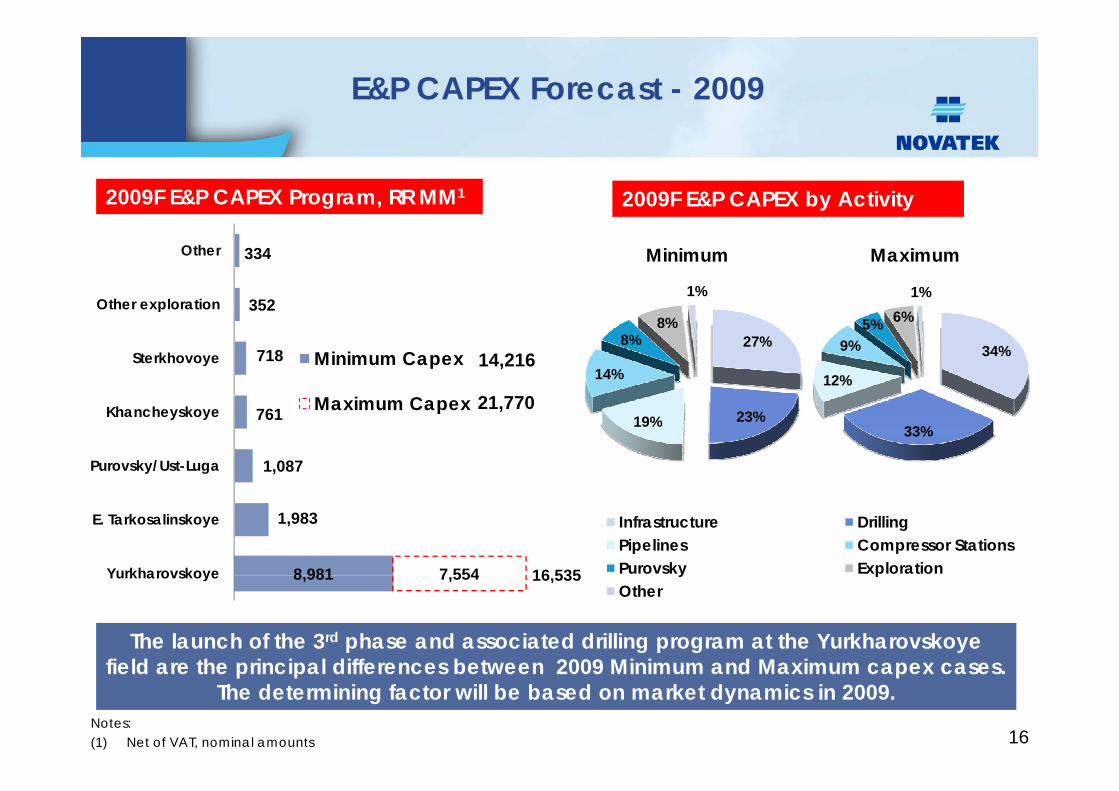
2009F E&P CAPEX Program, RR MM1 2009F E&P CAPEX by Activity
352
334
Other exploration
Other
1%1%
Minimum Maximum
718
352
Sterkhovoye
Other exploration
Minimum Capex 14,216
21 770
34%
12%
9%5% 6%
27%
14%
8%8%
1,087
761
Purovsky/Ust-Luga
Khancheyskoye Maximum Capex 21,77033%
23%19%
8 981
1,983
7 554Yurkharovskoye
E. Tarkosalinskoye
16 535
Infrastructure DrillingPipelines Compressor StationsPurovsky Exploration
The launch of the 3rd phase and associated drilling program at the Yurkharovskoye field are the principal differences between 2009 Minimum and Maximum capex cases
8,981 7,554Yurkharovskoye 16,535 y pOther
field are the principal differences between 2009 Minimum and Maximum capex cases. The determining factor will be based on market dynamics in 2009.
16Notes:(1) Net of VAT, nominal amounts
Yurkharovskoye Field Development Plan – 2009
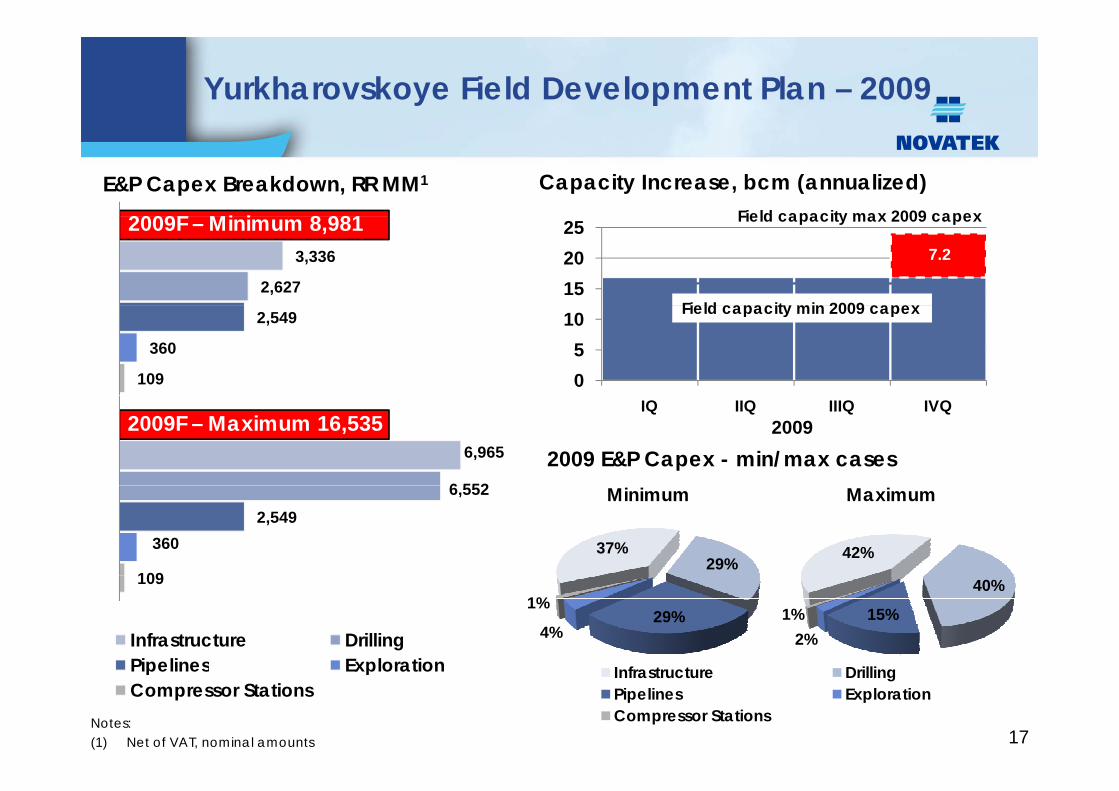
E&P Capex Breakdown, RR MM1 Capacity Increase, bcm (annualized)Field capacity max 2009 capex2009F Mi i 8 981
2,627
3,336
152025
7.2
Field capacity min 2009 capex
Field capacity max 2009 capex2009F – Minimum 8,981
109
360
2,549
05
10 Field capacity min 2009 capex
6 552
6,965
IQ IIQ IIIQ IVQ2009
2009 E&P Capex - min/max cases2009F – Maximum 16,535
109
360 2,549
6,552
42%37%29%
Minimum Maximum
109
Infrastructure DrillingPipelines Exploration
40%
15%2%
1%29%4%
1%
Pipelines ExplorationCompressor Stations
17
Infrastructure DrillingPipelines ExplorationCompressor StationsNotes:
(1) Net of VAT, nominal amounts
Yurkharovskoye Field Development Plan
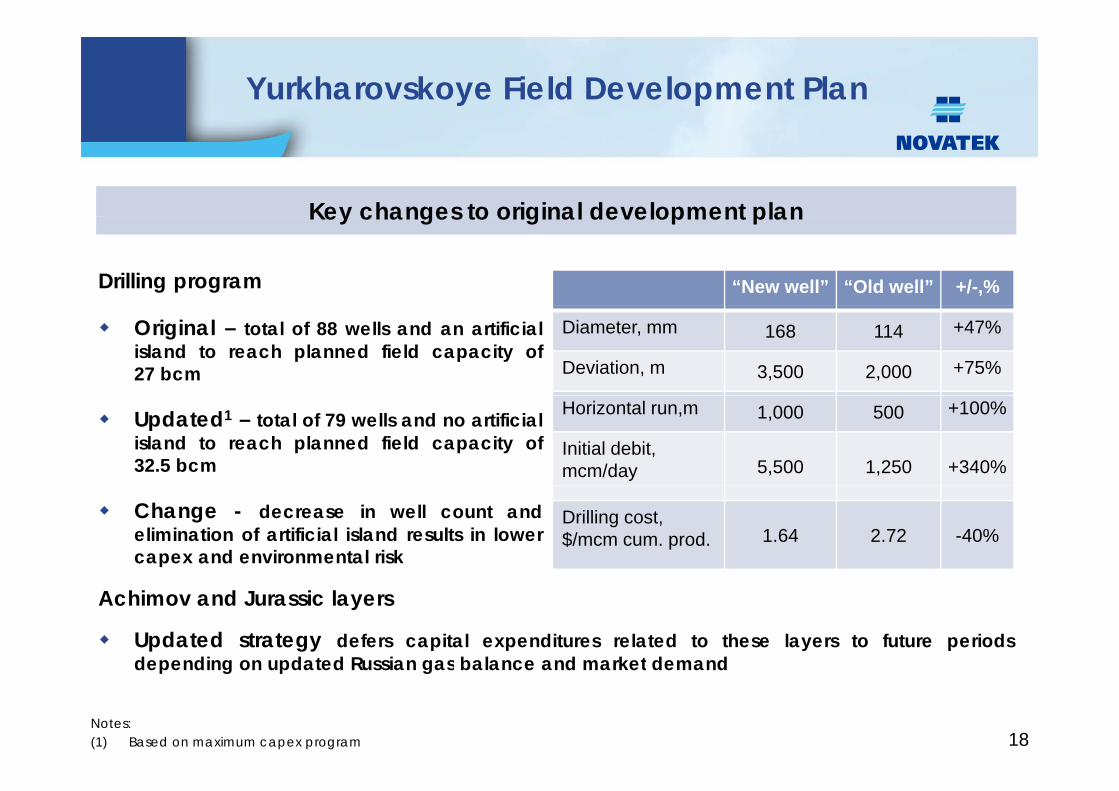
Key changes to original development planKey changes to original development plan
“New well” “Old well” +/-,%Drilling program
Diameter, mm 168 114 +47%
Deviation, m 3,500 2,000 +75%
Original – total of 88 wells and an artificialisland to reach planned field capacity of27 bcm
Horizontal run,m 1,000 500 +100%
Initial debit, mcm/day 5,500 1,250 +340%
Updated1 – total of 79 wells and no artificialisland to reach planned field capacity of32.5 bcm
Drilling cost, $/mcm cum. prod. 1.64 2.72 -40%
Change - decrease in well count andelimination of artificial island results in lowercapex and environmental risk
Achimov and Jurassic layers
Updated strategy defers capital expenditures related to these layers to future periodsdepending on updated Russian gas balance and market demand
18
depending on updated Russian gas balance and market demand
Notes:(1) Based on maximum capex program
Section 4: Fi i l St tFinancial Strategy
19
Current Financial Status
Balance Sheet
Strong positive cash position
Reconfirmed access to available credit lines
Debt ratios – among the lowest in industry peer group
Limited bad debt exposure – Prepayments and Offtaker bank guarantees
Currency exposure partially mitigated by USD denominated revenue from liquids
sales
Outstanding Operating Leverage
Limited downside price risk for majority of revenue stream
Low cost producer
Expected savings in Opex and Capex due to price deflation and field
optimization
20
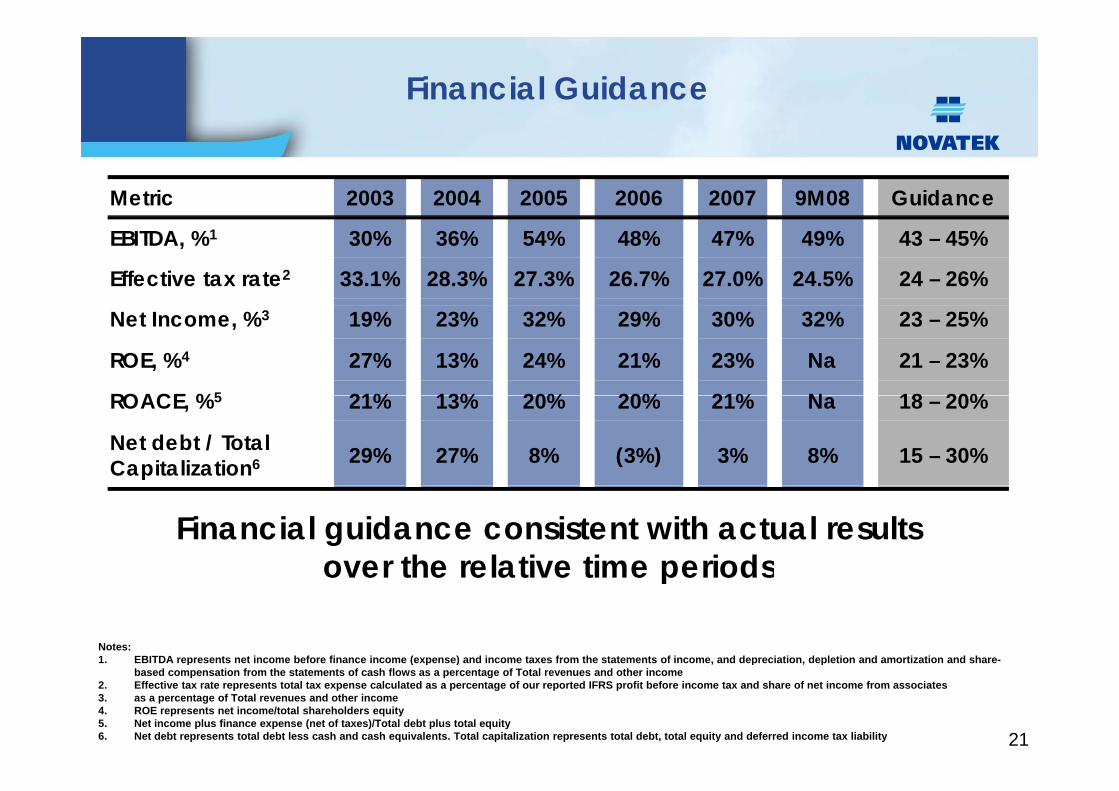
Financial Guidance
Metric 2003 2004 2005 2006 2007 9M08 Guidance
EBITDA, %1 30% 36% 54% 48% 47% 49% 43 – 45%
Effective tax rate2 33.1% 28.3% 27.3% 26.7% 27.0% 24.5% 24 – 26%
Net Income, %3 19% 23% 32% 29% 30% 32% 23 – 25%
ROE, %4 27% 13% 24% 21% 23% Na 21 – 23%
ROACE %5 21% 13% 20% 20% 21% N 18 20%ROACE, %5 21% 13% 20% 20% 21% Na 18 – 20%
Net debt / Total Capitalization6 29% 27% 8% (3%) 3% 8% 15 – 30%
Financial guidance consistent with actual results over the relative time periods
Notes:1. EBITDA represents net income before finance income (expense) and income taxes from the statements of income, and depreciation, depletion and amortization and share-
over the relative time periods
21
p ( p ) p pbased compensation from the statements of cash flows as a percentage of Total revenues and other income
2. Effective tax rate represents total tax expense calculated as a percentage of our reported IFRS profit before income tax and share of net income from associates3. as a percentage of Total revenues and other income4. ROE represents net income/total shareholders equity5. Net income plus finance expense (net of taxes)/Total debt plus total equity6. Net debt represents total debt less cash and cash equivalents. Total capitalization represents total debt, total equity and deferred income tax liability
Operational Metrics
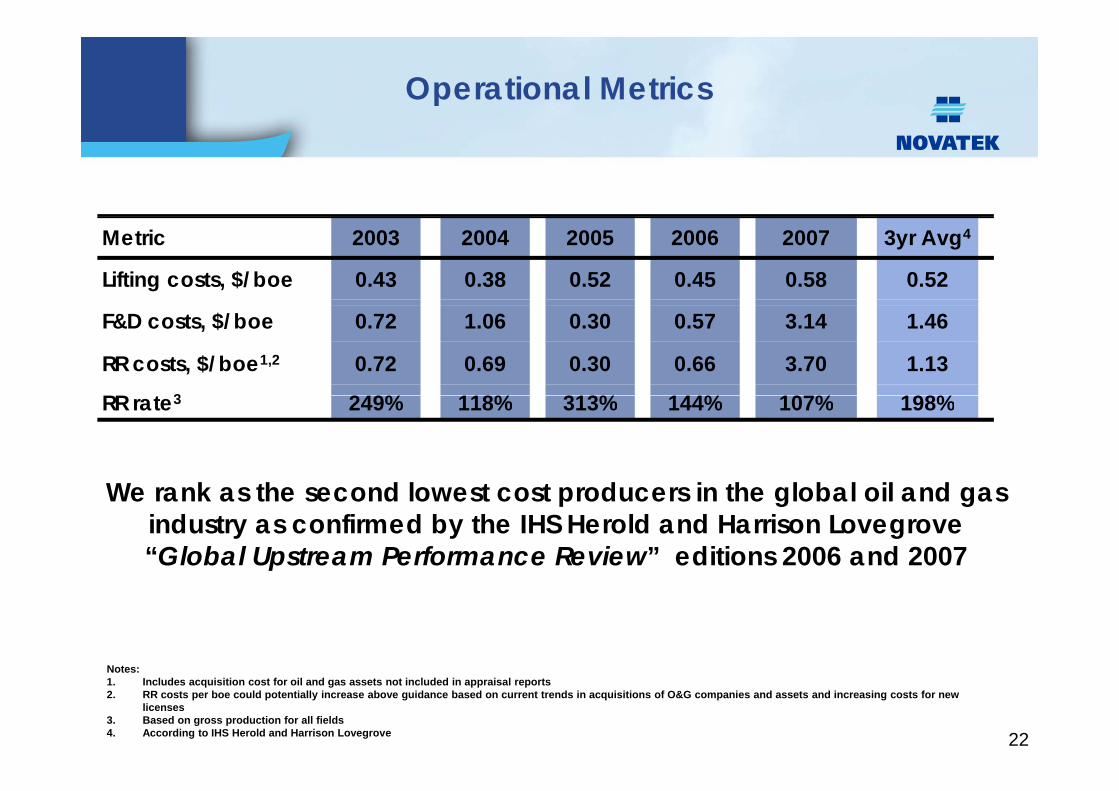
Metric 2003 2004 2005 2006 2007 3yr Avg4
Lifting costs, $/boe 0.43 0.38 0.52 0.45 0.58 0.52
F&D costs, $/boe 0.72 1.06 0.30 0.57 3.14 1.46
RR costs, $/boe1,2 0.72 0.69 0.30 0.66 3.70 1.13
RR t 3 249% 118% 313% 144% 107% 198%RR rate3 249% 118% 313% 144% 107% 198%
W k th d l t t d i th l b l il dWe rank as the second lowest cost producers in the global oil and gas industry as confirmed by the IHS Herold and Harrison Lovegrove “Global Upstream Performance Review” editions 2006 and 2007
22
Notes:1. Includes acquisition cost for oil and gas assets not included in appraisal reports2. RR costs per boe could potentially increase above guidance based on current trends in acquisitions of O&G companies and assets and increasing costs for new
licenses3. Based on gross production for all fields4. According to IHS Herold and Harrison Lovegrove
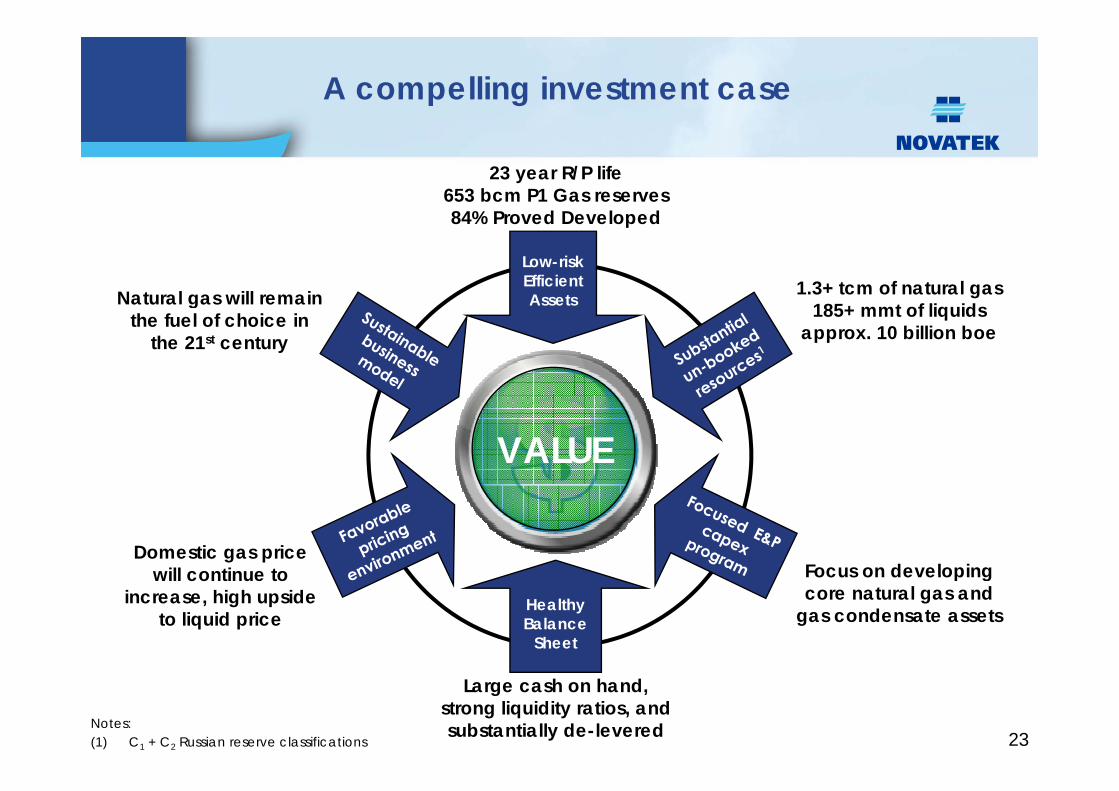
A compelling investment case
23 year R/P life653 bcm P1 Gas reserves84% Proved Developed
Low-riskEfficientAssets
84% Proved Developed
1.3+ tcm of natural gas185+ t f li idNatural gas will remain 185+ mmt of liquids
approx. 10 billion boe
gthe fuel of choice in
the 21st century
VALUE
Domestic gas pricewill continue to Focus on developing
Healthy Balance
Sheet
will continue to increase, high upside
to liquid price
Focus on developingcore natural gas and
gas condensate assets
23
Large cash on hand,strong liquidity ratios, andsubstantially de-leveredNotes:
(1) C1 + C2 Russian reserve classifications

Questions & AnswersQuestions & Answers
24