novartis q2 and h1 2015 condensed interim financial … · condensed interim financial report –...
TRANSCRIPT

Novartis International AG Novartis Global Communications CH-4002 Basel Switzerland http://www.novartis.com
CONDENSED INTERIM FINANCIAL REPORT – SUPPLEMENTARY DATA Novartis Q2 and H1 2015 Condensed Interim Financial Report – Supplementary Data INDEX Page
GROUP AND DIVISIONAL OPERATING PERFORMANCE Q2 AND H1 2015
Group 2
Pharmaceuticals 6
Alcon 14
Sandoz 17
Discontinued operations 19
CASH FLOW AND GROUP BALANCE SHEET 22
INNOVATION REVIEW 25
CONDENSED INTERIM CONSOLIDATED FINANCIAL STATEMENTS
Condensed consolidated income statements 34
Condensed consolidated statements of comprehensive income 36
Condensed consolidated balance sheets 37
Condensed consolidated changes in equity 38
Condensed consolidated cash flow statements 39
Notes to condensed interim consolidated financial statements, including update on legal proceedings 41
SUPPLEMENTARY INFORMATION 52
CORE RESULTS
Reconciliation from IFRS to core results 54
Group 56
Pharmaceuticals 58
Alcon 60
Sandoz 62
Corporate 64
Discontinued operations 65
Condensed consolidated changes in net debt / Share information 67
Free cash flow 68
Net sales of the top 20 Pharmaceuticals products 69
Pharmaceuticals sales by business franchise 71
Net sales by region 73
Currency translation rates / Income from associated companies 75
DISCLAIMER 76

2/77
GROUP AND DIVISIONAL OPERATING PERFORMANCE
Key figures1 Q2 2015 Q2 2014 % change H1 2015 H1 2014 % change
USD m USD m USD cc2 USD m USD m USD cc2
Net sales to third parties from continuing operations 12 694 13 347 -5 6 24 629 26 114 -6 4
Divisional operating income from continuing operations 2 329 3 121 -25 -11 5 260 6 004 -12 2
Corporate income & expense, net from continuing operations -48 63 nm nm -194 -5 nm nm
Operating income from continuing operations 2 281 3 184 -28 -14 5 066 5 999 - 16 -1
As % of net sales 18.0 23.9 20.6 23.0
Income from associated companies 121 185 -35 -34 136 400 -66 - 66
Interest expense -164 -166 1 -1 -343 -334 -3 -8
Other financial income and expense -82 - 56 -46 -49 -25 - 81 69 67
Taxes -300 -424 29 15 -672 -807 17 2
Net income from continuing operations 1 856 2 723 -32 -18 4 162 5 177 -20 -5
Net loss/income from discontinued operations -18 -138 87 93 10 681 376 nm nm
Net income 1 838 2 585 -29 -14 14 843 5 553 nm nm
Basic earnings per share from continuing operations (USD) 0.77 1.11 -31 -16 1.72 2.10 -18 -3
Basic loss/earnings per share from discontinued operations (USD) -0.01 -0.06 83 93 4.43 0.16 nm nm
Total basic earnings per share (USD) 0.76 1.05 -28 -12 6.15 2.26 nm nm
Free cash flow from continuing operations2 2 064 2 693 - 23 3 529 3 845 -8
Core2
Core operating income from continuing operations 3 593 3 859 - 7 6 7 244 7 659 - 5 8
As % of net sales 28.3 28.9 29.4 29.3
Core net income from continuing operations 3 074 3 335 -8 5 6 273 6 668 -6 7
Core net loss from discontinued operations - 59 - 52 -13 -18 -142 -173 18 26
Core net income 3 015 3 283 - 8 5 6 131 6 495 - 6 8
Core earnings per share from continuing operations (USD) 1.27 1.36 - 7 7 2.60 2.71 - 4 9
Core loss per share from discontinued operations (USD) -0.02 -0.02 0 -20 -0.06 -0.07 14 24
Total core earnings per share (USD) 1.25 1.34 -7 7 2.54 2.64 -4 10
nm = not meaningful
Following the announcement of our portfolio transformation on April 22, 2014, Novartis reported the Group’s financial results for the current and prior years as “continuing operations” and “discontinued operations.” See page 42 for full explanation. Unless otherwise noted, the commentary below focuses on continuing operations, which include the businesses of Pharmaceuticals, Alcon, Sandoz and Corporate activities, and starting on March 2, the results from the new oncology assets acquired from GSK and the 36.5% interest in the GSK consumer healthcare joint venture (the latter reported as part of income from associated companies). We also provide information on discontinued operations’ performance on page 19. Second quarter Net sales Net sales amounted to USD 12.7 billion (-5%, +6% cc). Growth Products3 contributed USD 4.4 billion or 35% of net sales, up 24% (USD) over the prior-year quarter.
1 Continuing and discontinued operations are defined on page 42. Net income from discontinued operations and net income of the Group include exceptional divestment gains. 2 Constant currencies (cc), core results and free cash flow are non-IFRS measures. An explanation of non-IFRS measures can be found on page 52. Unless otherwise noted, all growth rates in this Report refer to the same period in the prior year. 3 "Growth Products" are an indicator of the rejuvenation of the portfolio, and comprise products launched in a key market (EU, US, Japan) in 2010 or later, or products with exclusivity in key markets until at least 2019 (except Sandoz, which includes only products launched in the last 24 months). They include the acquisition effect of the GSK oncology assets.

3/77
Corporate income and expense, net Corporate income and expense, which includes the cost of Group management and central services, amounted to a net expense of USD 48 million in the second quarter compared to a net income of USD 63 million in the prior-year period, mainly on account of a commercial settlement gain related to intellectual property rights recorded in the prior year. Operating income Operating income was USD 2.3 billion (-28%, -14% cc), down mainly due to the amortization of the new oncology assets as well as a commercial settlement gain related to intellectual property in the prior-year period, partly offset by strong operating performance. The adjustments made to operating income to arrive at core operating income amounted to USD 1.3 billion (2014: USD 0.7 billion). The increased adjustment in 2015 was mainly on account of USD 0.3 billion of higher amortization charges and an additional USD 69 million of acquisition-related costs from the oncology acquisition in Pharmaceuticals, a USD 119 million intangible asset impairment in Alcon, and USD 144 million of exceptional charges mainly related to the planned closure of two manufacturing sites in Sandoz, whereas 2014 included USD 0.3 billion of exceptional revenue from a commercial settlement gain related to intellectual property. Excluding these items, core operating income was USD 3.6 billion (-7%, +6% cc). Core operating income margin in constant currencies increased 0.3 percentage points, mainly due to higher sales and productivity initiatives. Currency had a negative impact of 0.9 percentage points, resulting in a net decrease of 0.6 percentage points in USD to 28.3% of net sales. Income from associated companies Income from associated companies amounted to USD 121 million compared to USD 185 million in the prior-year quarter. The decrease was mainly due to a lower estimated net income contribution from Roche Holding AG. Core income from associated companies remained stable at USD 237 million compared to USD 236 million in the second quarter of 2014, mainly due to the estimated share in core results of the consumer healthcare joint venture with GSK of USD 25 million, which compensated the lower estimated core income contribution from Roche compared to the prior-year quarter. Interest expense and other financial income/expense Interest expense was USD 164 million, broadly in line with USD 166 million in the prior-year period. Other financial income and expense amounted to an expense of USD 82 million compared to an expense of USD 56 million in the prior-year period, mainly due to a decrease in the net currency result of USD 10 million and an increase of the monetary loss from hyperinflation accounting of USD 10 million. Taxes The tax rate for continuing operations (taxes as percentage of pre-tax income) in the second quarter increased to 13.9% from 13.5% in the prior-year quarter as a result of a change in profit mix from lower to higher tax jurisdictions. The core tax rate for continuing operations (core taxes as percentage of core pre-tax income) increased to 14.7% from 13.9% in the prior-year quarter, mainly as a result of a change in profit mix from lower to higher tax jurisdictions. Net income and EPS Net income from continuing operations was USD 1.9 billion (-32%, -18% cc), declining more than operating income from continuing operations mainly due to lower income from associated companies. EPS from continuing operations was USD 0.77 (-31%, -16% cc), declining less than net income from continuing operations due to the lower number of average outstanding shares. Core net income from continuing operations was USD 3.1 billion (-8%, +5% cc), broadly in line with core operating income from continuing operations. Core EPS from continuing operations was USD 1.27 (-7%, +7% cc), growing ahead of core net income from continuing operations due to the lower number of average outstanding shares.

4/77
First half Net sales Net sales amounted to USD 24.6 billion (-6%, +4% cc) in the first half. Growth Products contributed USD 8.1 billion or 33% of net sales, up 19% (USD) over the first half of 2014. Corporate income and expense, net Corporate income and expense, which includes the cost of Group management and central services, amounted to an expense of USD 194 million in the first half compared to USD 5 million in the prior-year period, mainly due to a commercial settlement gain related to intellectual property. Operating income Operating income was USD 5.1 billion (-16%, -1% cc), down mainly due to the amortization of the new oncology assets as well as a commercial settlement gain in the prior-year period, mostly offset by strong operating performance. Operating income margin in constant currencies decreased 1.2 percentage points; currency had a negative impact of 1.2 percentage points, resulting in a net decrease of 2.4 percentage points to 20.6% of net sales. The adjustments made to operating income to arrive at core operating income amounted to USD 2.2 billion (2014: USD 1.7 billion). The increase was mainly driven by USD 0.4 billion of higher amortization charges and USD 110 million of acquisition-related costs from the oncology acquisition in Pharmaceuticals, the USD 119 million intangible asset impairment in Alcon, and USD 180 million of exceptional charges mainly related to for the planned closure of two manufacturing sites in Sandoz, whereas 2014 included USD 0.3 billion of exceptional revenue from a commercial settlement gain related to intellectual property. Excluding these items, core operating income was USD 7.2 billion (-5%, +8% cc). Core operating income margin in constant currencies increased 0.9 percentage points, mainly due to higher sales and productivity initiatives. Currency had a negative impact of 0.8 percentage points, resulting in a net increase of 0.1 percentage points to 29.4% of net sales. Income from associated companies Income from associated companies amounted to USD 136 million compared to USD 400 million in the prior-year period. The decrease was mainly due to a lower estimated income from Roche Holding AG of USD 135 million compared to USD 321 million in the prior-year period, and to the gain of USD 64 million recorded in 2014 on the Novartis Venture Fund investments in associated companies. In addition, in the first half of 2015 we estimated our share of income from our 36.5% share in the consumer healthcare joint venture with GSK to be negligible due to integration charges expected to be recognized in the second quarter. This estimate for the first half of 2015 will be adjusted to actual results in the next quarter. Core income from associated companies decreased from USD 528 million in the prior-year period to USD 458 million in the first half of 2015. The decrease was due to a lower estimated share of core results from Roche, and to the gain recorded in the prior-year period on the Novartis Venture Funds investments in associated companies. These decreases were partially compensated by our estimated share in core results from the consumer healthcare joint venture with GSK, which amounts to USD 75 million in the first half of 2015. Interest expense and other financial income/expense Interest expense was USD 343 million, broadly in line with USD 334 million in the prior-year period. Other financial income and expense amounted to an expense of USD 25 million compared to USD 81 million in the prior-year period, mainly due to an increase in the net currency result of USD 97 million, partially offset by an increase of the monetary loss from hyperinflation accounting of USD 34 million. Taxes The tax rate for continuing operations (taxes as percentage of pre-tax income) in the first half increased to 13.9% from 13.5% in the prior-year period as a result of a change in profit mix from lower to higher tax jurisdictions. The core tax rate for continuing operations (core taxes as percentage of core pre-tax income) increased to 14.7% from 14.2% in the prior-year period, mainly as a result of a change in profit mix from lower to higher tax jurisdictions.

5/77
Net income and EPS Net income from continuing operations was USD 4.2 billion (-20%, -5% cc), declining more than operating income from continuing operations mainly due to lower income from associated companies. EPS from continuing operations was USD 1.72 (-18%, -3% cc), declining less than net income from continuing operations due to the lower number of average outstanding shares. Core net income from continuing operations was USD 6.3 billion (-6%, +7% cc), broadly in line with core operating income from continuing operations. Core EPS from continuing operations was USD 2.60 (-4%, +9% cc), growing ahead of core net income from continuing operations due to the lower number of average outstanding shares.

6/77
CONTINUING OPERATIONS1 Pharmaceuticals Q2 2015 Q2 2014 % change
H1 2015 H1 2014 % change
USD m USD m USD cc USD m USD m USD ccNet sales 7 847 8 199 -4 6 14 987 16 006 -6 4Operating income 1 986 2 406 -17 -4 4 285 4 627 -7 6 As % of net sales 25.3 29.3 28.6 28.9 Core operating income 2 477 2 593 -4 9 4 897 5 132 -5 9 As % of net sales 31.6 31.6 32.7 32.1 Second quarter Net sales Net sales reached USD 7.8 billion (-4%, +6% cc), with volume growth of 13 percentage points, which includes the new oncology assets acquired from GSK on March 2, 2015 (sales of USD 0.5 billion in Q2), and a positive price impact of 1 percentage point, partly offset by the negative impact of generic competition (-8 percentage points), largely for Diovan monotherapy, Exforge and Vivelle-Dot in the US. Growth Products2 – which include Gilenya, Lucentis, Afinitor, Tasigna, Xolair, the COPD portfolio3, the Tafinlar/Mekinist combination and Jakavi – generated USD 3.5 billion or 44% of division net sales. These products grew 38% (cc) over the same period last year. Regionally, US sales (USD 2.7 billion, +8% cc) grew, mainly due to growth of Gleevec/Glivec, Gilenya and Votrient, which more than offset generic competition for Diovan monotherapy, Exforge and Vivelle-Dot. European sales (USD 2.5 billion, +5% cc) grew, driven by Growth Products, partially offset by generic competition and Galvus in Germany, where distribution was stopped on July 1, 2014. Japan sales (USD 0.6 billion, -8% cc) decreased, mainly due to a continued decline in Diovan sales. Emerging Growth Markets sales increased 10% (cc) to USD 2.0 billion. Oncology sales increased 30% (cc) to USD 3.5 billion. Excluding the new oncology assets acquired from GSK, sales increased 11% (cc). Growth drivers included Tasigna (USD 412 million, +21% cc), Gleevec/Glivec (USD 1.2 billion, +6% cc), Afinitor (USD 423 million, +19% cc) and Jakavi (USD 98 million, +68% cc). In Neuroscience, Gilenya (USD 700 million, +26% cc) saw double-digit growth in the US and most ex-US markets. In Retina, Lucentis grew 2% (cc) to USD 537 million, as the wet age-related macular degeneration (AMD) indication stabilized and new indications experienced slower growth as a result of competition entering the market. Respiratory performance was underpinned by continued uptake of the COPD portfolio (USD 151 million, +57% cc) and Xolair (USD 194 million, +18% cc), and in Cardio-Metabolic, Galvus (USD 273 million, -1% cc) declined slightly due to zero sales in Germany, which offset growth in many markets (ex-Germany, Galvus grew 5% cc). The Immunology & Dermatology franchise sales increased 5% (cc) to USD 483 million; initial Cosentyx sales were booked in some European countries, the US and Japan. Operating income Operating income decreased 17% (-4% cc) to USD 2.0 billion, as amortization of intangible assets of USD 384 million and net acquisition-related costs of USD 69 million, mainly related to the new oncology assets, were partly offset by solid operating performance. Adjustments to arrive at core operating income for the quarter amounted to USD 491 million. Prior-year core adjustments amounted to USD 187 million, which included USD 71 million for the amortization of intangible assets. Core operating income was USD 2.5 billion (-4%, +9% cc). Core margin in constant currencies increased by 1.0 percentage point; currency had a negative impact of 1.0 percentage point, resulting in a core margin of 31.6% of net sales.
1 Continuing operations include the businesses of Pharmaceuticals, Alcon, Sandoz and Corporate activities, and starting on March 2, the results from the new oncology assets acquired from GSK and the 36.5% interest in the GSK consumer healthcare joint venture (the latter reported as part of income from associated companies). See page 42 for full explanation. 2 Growth products are an indicator of the rejuvenation of the portfolio, and comprise products launched in a key market (EU, US, Japan) in 2010 or later, or products with exclusivity in key markets until at least 2019. They include the acquisition effect of the GSK oncology assets. 3 The chronic obstructive pulmonary disease (COPD) portfolio includes Onbrez Breezhaler/Arcapta Neohaler, Seebri Breezhaler and Ultibro Breezhaler.

7/77
Core gross margin as a percentage of net sales improved by 1.7 percentage points (cc), mainly due to productivity efforts and a favorable sales mix, which decreased production costs. Core R&D expenses increased by 0.5 percentage points (cc), reflecting additional investments in the Cell and Gene Therapies Unit and in Oncology. Core M&S and core G&A expenses improved by 0.3 percentage points (cc), as ongoing productivity efforts offset investments in key launch products. Core Other Income and Expense, net decreased the margin by 0.5 percentage points (cc), mainly due to launch provisions. First half Net sales Pharmaceuticals delivered net sales of USD 15.0 billion (-6%, +4% cc) in the first half, driven by volume growth (+12 percentage points), which more than offset the impact of generic competition (-8 percentage points). Pricing impact was negligible. European sales (USD 5.0 billion, +4% cc) benefited from the performance of Growth Products, partially offset by generic competition. The US (USD 5.0 billion, 0% cc) was impacted by generic competition for Diovan monotherapy, Exforge and Vivelle-Dot. Japan’s performance (USD 1.1 billion, -9% cc) declined versus prior year, mainly due to a decline in Diovan sales. Emerging Growth Markets sales increased 11% (cc) to USD 3.9 billion. Operating income Operating income was USD 4.3 billion (-7%, +6% cc) for the first half. Included in operating income were USD 552 million of amortization of intangible assets and USD 110 million of net acquisition-related costs, mainly related to the new oncology assets acquired from GSK. Adjustments to arrive at core operating income amounted to USD 612 million. Prior-year core adjustments amounted to USD 505 million, which included USD 140 million for the amortization of intangible assets. Core operating income was USD 4.9 billion (-5%, +9% cc), generating core operating leverage in constant currencies through the continued reduction of functional costs and ongoing productivity initiatives. Core margin in constant currencies improved by 1.6 percentage points; currency had a negative impact of 1.0 percentage point, resulting in a net margin expansion of 0.6 percentage points to 32.7% of net sales. Core gross margin as a percentage of net sales improved by 1.0 percentage point (cc) due to lower production costs. Core R&D expenses were flat (cc). Core M&S and core G&A expenses improved by 0.6 percentage points (cc), as continuing productivity efforts offset additional investments in new product launches. Core Other Income and Expense, net remained flat (cc).

8/77
Pharmaceuticals product review All comments below focus on second quarter movements in constant currencies. ONCOLOGY Q2 2015 Q2 2014 % change H1 2015 H1 2014 % change USD m USD m USD cc USD m USD m USD cc Gleevec/Glivec 1 184 1 199 -1 6 2 254 2 296 -2 6 Tasigna 412 373 10 21 784 710 10 21 Subtotal Bcr-Abl franchise 1 596 1 572 2 10 3 038 3 006 1 9Afinitor/Votubia 423 384 10 19 811 741 9 19 Sandostatin 413 417 -1 9 798 801 0 8 Exjade/Jadenu 262 244 7 17 456 452 1 11 Votrient 165 0 nm nm 222 0 nm nm Jakavi 98 69 42 68 188 126 49 76 Tafinlar/Mekinist1 131 0 nm nm 171 0 nm nm Femara 80 91 -12 -1 162 185 -12 -2 Revolade/Promacta 116 0 nm nm 152 0 nm nm Zykadia 18 7 157 166 34 7 nm nm Other 234 167 40 50 383 310 24 33 Total Oncology 3 536 2 951 20 30 6 415 5 628 14 241 Majority of sales for Mekinist and Tafinlar are combination, but both can be used as a monotherapy nm = not meaningful
Our Bcr-Abl franchise, consisting of Tasigna and Gleevec/Glivec, reached USD 1.6 billion (+10% cc) in sales in the second quarter, driven by growth of both products. Gleevec/Glivec (USD 1.2 billion, +6% cc) experienced solid growth in the second quarter, driven by US performance. In the US, Novartis Pharmaceuticals Corporation settled its litigation with a subsidiary of Sun Pharmaceutical Industries Ltd. relating to Novartis patents covering the use of certain polymorphic forms of Gleevec/Glivec, which expire in 2019 (including pediatric exclusivity). The basic compound patent for Gleevec/Glivec expired in the US on July 4, 2015. As a result of the settlement, Novartis will permit Sun’s subsidiary to market a generic version of Gleevec/Glivec in the US commencing on February 1, 2016. Tasigna (USD 412 million, +21% cc) grew double-digit in the second quarter, driven by strong growth in the US and other markets. Tasigna is a more effective, targeted therapy than Gleevec/Glivec for adult patients newly diagnosed with Philadelphia chromosome-positive (Ph+) chronic myeloid leukemia (CML) in the chronic phase, and is also approved for the treatment of adult patients with Ph+ CML in the chronic or accelerated phase who are resistant or intolerant to at least one prior therapy including Gleevec/Glivec. Afinitor/Votubia (USD 423 million, +19% cc) performance in the second quarter was driven by growth in the US, Japan and several other markets. Afinitor is an oral inhibitor of the mTOR pathway approved in combination with exemestane for the treatment of patients with HR+/HER2- advanced breast cancer after failure with a non-steroidal aromatase inhibitor, for advanced renal cell carcinoma (aRCC) following vascular endothelial growth factor-targeted therapy (in the US, specifically following sunitinib and sorafenib) and for the treatment of advanced pancreatic neuroendocrine tumors (NET). Afinitor is also approved for subependymal giant cell astrocytoma and renal angiomyolipoma associated with tuberous sclerosis complex. Everolimus, the active ingredient in Afinitor/Votubia, is available under the trade names Zortress/Certican for use in other non-oncology indications and is exclusively licensed to Abbott and sublicensed to Boston Scientific for use in drug-eluting stents. Sandostatin (USD 413 million, +9% cc) continued to benefit from the increasing use of Sandostatin LAR (long-acting release) in key markets. Sandostatin is a somatostatin analogue used to treat patients with acromegaly as well as NET. In NET, it is used for patients with symptoms of carcinoid syndrome as well as those with advanced NET of the midgut or unknown primary tumor location (currently approved in 52 countries). An enhanced presentation of Sandostatin LAR, which includes a diluent, safety needle and vial adapter, has been approved in more than 60 countries, with additional filings underway. Sandostatin and Sandostatin LAR are the most studied and prescribed somatostatin analogues in the world, with more than 600 clinical trials, 6,000 scientific publications and a cumulative patient exposure of 1,000,000 patient years.

9/77
Exjade/Jadenu (USD 262 million, +17% cc) experienced double-digit growth due in part to the launch of Jadenu in the US. Exjade is a once-daily dispersible tablet approved in more than 100 countries for chronic transfusional iron overload, as well as for the treatment of chronic iron overload in patients with non-transfusion-dependent thalassemia in more than 70 countries, with additional regulatory reviews underway. Jadenu, a new oral film-coated tablet formulation that can be swallowed whole, was approved by the FDA on March 30, 2015 for the same indications as Exjade. Regulatory applications for Jadenu have been submitted in the EU, Canada and Switzerland. Applications for the new formulation are currently being planned in other countries. Votrient (USD 165 million) is a small molecule tyrosine kinase inhibitor that targets a number of intracellular proteins to limit tumor growth and cell survival. Votrient is approved in the US for the treatment of patients with advanced renal cell carcinoma (aRCC), and in the EU for first-line treatment of adult patients with aRCC and for patients who have received prior cytokine therapy for advanced disease. RCC is the most common type of kidney cancer in adults, and nearly one-fifth of patients have aRCC at the time of diagnosis. Votrient is also indicated for the treatment of certain types of advanced soft tissue sarcoma (aSTS) after prior chemotherapy. STS is a type of cancer which can arise from a wide variety of soft tissues including muscle, fat, blood vessel and nerves. Votrient is approved in 99 countries worldwide for aRCC and in 87 countries for aSTS. Jakavi (USD 98 million, +68% cc), an oral inhibitor of the JAK 1 and JAK 2 tyrosine kinases, experienced strong growth in the second quarter. It is the first JAK inhibitor indicated for the treatment of disease-related splenomegaly or symptoms in adult patients with primary myelofibrosis (also known as chronic idiopathic myelofibrosis), post-polycythemia vera myelofibrosis or post-essential thrombocythemia myelofibrosis. Jakavi is currently approved in more than 80 countries, including EU member states, Japan and Canada. In March 2015, the EC approved Jakavi for the treatment of adult patients with polycythemia vera (PV) who are resistant to or intolerant of hydroxyurea. Jakavi is the first targeted treatment approved by the EC for these patients. Regulatory applications have also been submitted in Switzerland, Japan and other countries for Jakavi in the PV indication. Novartis licensed ruxolitinib from Incyte Corporation for development and commercialization outside the US. Ruxolitinib is marketed in the US by Incyte under the brand name Jakafi®. Tafinlar/Mekinist (USD 131 million) grew dynamically. It is the first approved combination therapy for the treatment of patients with BRAF V600 mutation positive unresectable or metastatic melanoma, as detected by a validated test, in the US and Canada and several other markets. The combination was approved in the US under accelerated approval and is contingent upon further FDA verification of clinical benefit from two recently completed Phase III confirmatory trials. Tafinlar targets the serine/threonine kinase BRAF in the RAS/RAF/MEK/ERK pathway and Mekinist targets the threonine/tyrosine kinases MEK1 and MEK2 in the MAP kinase pathway, resulting in dual blockade of this pathway, which is the main escape mechanism for resistance. This is the first combination of BRAF/MEK inhibitors to demonstrate a statistically significant overall survival benefit for this patient population in two Phase III studies, with the combination of Tafinlar and Mekinist showing more than a six month survival improvement compared to BRAF monotherapies, the current standard of care in this subgroup of BRAF V600 mutation positive unresectable or metastatic melanoma patients. Tafinlar and Mekinist are also approved as single agents for the treatment of patients with unresectable or metastatic melanoma in more than 45 and 30 countries worldwide, respectively. In addition, Tafinlar has Breakthrough Therapy designation in the US for treatment of non-small cell lung cancer (NSCLC) patients with BRAF V600E mutations who have received at least one prior line of platinum-containing chemotherapy. In July 2015, the combination therapy Tafinlar and Mekinist also received Breakthrough Therapy designation in the US for NSCLC patients with BRAF V600E mutations. Revolade (USD 116 million), also known as Promacta in the US, grew. It is the only approved once-daily oral thrombopoietin receptor agonist, and works by stimulating bone marrow cells to produce platelets. It is approved in more than 100 countries worldwide for the treatment of thrombocytopenia in adult patients with chronic immune (idiopathic) thrombocytopenic purpura (ITP) who have had an inadequate response or are intolerant to other treatments. In June 2015, Promacta was approved by the FDA for the treatment of children six years and older with chronic ITP who have had an insufficient response to corticosteroids, immunoglobulins or splenectomy, and is currently under review for this same indication with the EMA. Following Breakthrough Therapy designation and priority review, Promacta was approved by the FDA in August 2014 for the treatment of patients with severe aplastic anemia who have had an insufficient response to immunosuppressive therapy. Revolade/Promacta is also approved in more than 50 countries worldwide for the treatment of thrombocytopenia in patients with chronic hepatitis C to allow them to initiate and maintain interferon-based therapy.

10/77
Zykadia (USD 18 million, +166% cc), an oral, selective inhibitor of anaplastic lymphoma kinase (ALK), an important therapeutic target in lung cancer, has experienced continued uptake in the US following launch in May 2014. Zykadia is approved in more than 40 countries worldwide. It is approved in the US for the treatment of patients with ALK-positive (ALK+) metastatic NSCLC who have progressed on or are intolerant to crizotinib. This indication was approved under accelerated approval and is contingent upon further verification of clinical benefit in confirmatory trials. In May 2015, the EC approved Zykadia to treat adult patients with ALK+ advanced NSCLC previously treated with crizotinib. Zykadia is also approved in countries in North America, South America, Central America and Asia. Additional regulatory reviews for Zykadia are underway worldwide. NEUROSCIENCE Q2 2015 Q2 2014 % change H1 2015 H1 2014 % change USD m USD m USD cc USD m USD m USD cc Gilenya 700 606 16 26 1 338 1 158 16 26 Exelon/Exelon Patch 208 246 -15 -8 441 508 -13 -6 Comtan/Stalevo 72 92 -22 -7 148 189 -22 -9 Other 36 59 -39 -32 71 121 -41 -35 Total Neuroscience 1 016 1 003 1 11 1 998 1 976 1 11
Gilenya (USD 700 million, +26% cc), the first once-daily oral therapy to treat relapsing forms of multiple sclerosis, continued to show solid double-digit growth in keeping with strong trends towards oral treatments with higher efficacy. In the second quarter, Gilenya continued to see volume growth through new patient initiations (including new patient starts, i.e. naïve patients, re-starts and switches) in both the US and ex-US markets. Gilenya is approved in over 80 countries around the world. As of May 2015, it is estimated that Gilenya has been used to treat approximately 125,000 patients in clinical trials and the post-marketing setting. The total patient exposure is over 240,000 patient years. Gilenya is licensed from Mitsubishi Tanabe Pharma. Exelon/Exelon Patch (USD 208 million, -8% cc) sales declined due to generic competition for Exelon Patch in the EU, which offset growth for Exelon Patch in the US and other markets. Exelon Patch is approved for the treatment of mild-to-moderate Alzheimer’s disease (AD) dementia in more than 90 countries, including more than 20 countries where it is also approved for Parkinson’s disease dementia. Exelon Patch is also indicated for the treatment of patients with severe AD in 14 countries, including the US. In the US, no ANDA filer has received FDA approval for a generic version of Exelon Patch. If one or more does receive such approval, then under certain circumstances there may be generic entry during 2015. RETINA Q2 2015 Q2 2014 % change H1 2015 H1 2014 % change USD m USD m USD cc USD m USD m USD cc Lucentis 537 619 -13 2 1 076 1 239 -13 1 Other 15 17 -12 -9 28 34 -18 -11 Total Retina 552 636 -13 2 1 104 1 273 -13 1
Lucentis (USD 537 million, +2% cc) grew: the wet AMD indication is stabilizing and new indications – diabetic macular edema (DME), macular edema secondary to central and branch retinal vein occlusion (CRVO and BRVO), and choroidal neovascularization secondary to pathologic myopia) – are experiencing slower growth as a result of new competitors entering the market. The Lucentis pre-filled syringe continued to perform solidly after its successful launch in 22 countries. Lucentis is an anti-VEGF therapy specifically designed for the eye, minimizing systemic exposure. It has demonstrated significant efficacy and has a well-established safety profile supported by extensive clinical studies and real-world experience. Lucentis is licensed from Genentech/Roche, and Novartis holds the rights to commercialize the product outside the US. Genentech/Roche holds the rights to commercialize Lucentis in the US.

11/77
IMMUNOLOGY & DERMATOLOGY Q2 2015 Q2 2014 % change H1 2015 H1 2014 % change USD m USD m USD cc USD m USD m USD cc Neoral/Sandimmun(e) 145 179 -19 -7 291 347 -16 -4 Myfortic 100 123 -19 -9 199 256 -22 -15 Zortress/Certican 80 81 -1 15 161 156 3 19 Ilaris 61 47 30 43 116 89 30 44 Other1 71 43 65 82 133 86 55 67 Total I&D (excl. everolimus stent drug)
457 473 -3 9 900
934 -4 8
Everolimus stent drug 26 43 -40 -39 50 108 -54 -54
Total I&D
483 516 -6 5 950
1 042 -9 2 1 Includes Cosentyx. Xolair sales for all indications are reported in the Respiratory franchise Cosentyx (USD 30 million), launched in February 2015, is a novel human monoclonal antibody that selectively neutralizes circulating interleukin-17A (IL-17A). In January, Cosentyx (at a dose of 300 mg) became the first and only IL-17A inhibitor approved in Europe as a first-line systemic treatment of moderate-to-severe plaque psoriasis in adult patients, and in the US as a treatment for moderate-to-severe plaque psoriasis in adult patients who are candidates for systemic therapy or phototherapy. In addition to the EU and US, Cosentyx has been approved in Switzerland, Canada and various other markets for the treatment of moderate-to-severe plaque psoriasis. In Japan, it is approved for the treatment of moderate-to-severe plaque psoriasis and active psoriatic arthritis. Cosentyx has now been launched in the US, Switzerland, Japan, Canada, and in some EU countries. Xolair continued to grow strongly globally. Xolair is currently approved in the EU, Switzerland and 40 other countries as a treatment for chronic spontaneous urticaria (CSU), also known as chronic idiopathic urticaria (CIU), for which it is approved in the US, Canada and Australia. Xolair has been launched for CSU/CIU in 39 countries, including the US, Switzerland, Canada, and several EU countries. Novartis co-promotes Xolair with Genentech/Roche in the US and shares a portion of the operating income, but does not book US sales. Xolair as a treatment for moderate-to-severe or severe persistent allergic asthma is addressed in the Respiratory section below. All sales (ex-US) are booked in the Respiratory franchise. Neoral/Sandimmun(e) (USD 145 million, -7% cc), two formulations of cyclosporine, including a micro-emulsion formulation, is an immunosuppressant to prevent organ rejection following a kidney, liver, heart or lung transplant. Additionally, it is indicated for treating selected autoimmune disorders, such as psoriasis and rheumatoid arthritis. Although sales are declining as expected due to generic competition and mandatory price reductions, most notably in Europe and Japan, the decrease is not as rapid as has been the case in other therapeutic areas, due to the special characteristics of the solid organ transplant market. First launched in 1995, Neoral/Sandimmun(e) is marketed in approximately 100 countries. Myfortic (USD 100 million, -9% cc), a transplantation medicine, has experienced a sales decline after the expected launch of generic competition in the US in early 2014. Myfortic has continued to grow in some geographies without generic competition. Marketing authorizations have been granted in European countries. Zortress/Certican (USD 80 million, +15% cc), available in more than 90 countries to prevent organ rejection in adult heart and kidney transplant patients, continued to show strong growth in the second quarter. It is also approved for liver transplant patients in over 70 countries, including the EU and US, and has been submitted for use in pediatric kidney transplant patients in the EU. Everolimus, the active ingredient in Zortress/Certican, is marketed for other indications under the trade names Afinitor/Votubia. Everolimus is exclusively licensed to Abbott and sublicensed to Boston Scientific for use in drug-eluting stents. Ilaris (USD 61 million, +43% cc) continued to grow as a treatment for adults and children suffering from cryopyrin-associated periodic syndrome, for which it is approved in more than 70 countries. Additionally, Ilaris is approved for the treatment of active systemic juvenile idiopathic arthritis in the US, EU and other countries – an important growth driver for the product. Ilaris is also available for the symptomatic treatment of refractory acute gouty arthritis in the EU and is being developed for hereditary periodic fever syndromes.

12/77
RESPIRATORY Q2 2015 Q2 2014 % change H1 2015 H1 2014 % change USD m USD m USD cc USD m USD m USD cc Ultibro Breezhaler 66 22 200 255 118 36 228 295 Onbrez Breezhaler/Arcapta Neohaler 47 56 -16 -2 90 109 -17 -3 Seebri Breezhaler 38 37 3 24 75 67 12 34 COPD portfolio 151 115 31 57 283 212 33 60Xolair1 194 197 -2 18 374 370 1 19 Other 70 72 -3 4 134 168 -20 -14 Total Respiratory 415 384 8 27 791 750 5 231 Revenue, which is ex-US only, reflects Xolair sales for all indications (i.e. Xolair SAA and Xolair CSU/CIU, which are managed by the Immunology & Dermatology franchise) The COPD portfolio, which includes Ultibro Breezhaler, Onbrez Breezhaler/Arcapta Neohaler and Seebri Breezhaler, grew +57% (cc) to USD 151 million in the second quarter. Ultibro Breezhaler (USD 66 million, +255% cc), a LABA/LAMA approved as a first-in-class once-daily dual bronchodilator in over 70 countries outside the US (including EU and Japan) and launched in over 40 countries (now including France and Italy), continued to grow strongly. Ultibro Breezhaler is a fixed-dose combination of indacaterol and glycopyrronium bromide, and, in the EU, is indicated as a maintenance bronchodilator treatment to relieve symptoms in adult patients with chronic obstructive pulmonary disease (COPD). A regulatory application has been submitted in the US. Seebri Breezhaler (USD 38 million, +24% cc), a once-daily inhaled LAMA, continued to grow worldwide. Indicated as a maintenance bronchodilator treatment to relieve symptoms of patients with COPD, Seebri Breezhaler (glycopyrronium bromide) is approved in over 80 countries and a new drug application has been submitted in the US. Glycopyrronium bromide was exclusively licensed to Novartis in April 2005 by Vectura and its co-development partner Sosei. Onbrez Breezhaler/Arcapta Neohaler (USD 47 million, -2% cc), a once-daily inhaled LABA, declined slightly versus last year. Onbrez Breezhaler/Arcapta Neohaler (indacaterol) is indicated as maintenance bronchodilator treatment of airflow obstruction in adult patients with COPD, approved in over 100 countries including the US. Both are delivered via the low-resistance Breezhaler/Neohaler inhalation device. Xolair (USD 194 million, +18% cc), currently approved in more than 90 countries as a treatment for moderate-to-severe or severe persistent allergic asthma, continued to grow strongly globally. Xolair is the first biologic approved for adults and children with moderate-to-severe allergic asthma (SAA). Novartis co-promotes Xolair with Genentech/Roche in the US and shares a portion of the operating income, but does not book US sales. Xolair as a treatment for CSU/CIU is addressed earlier in the Immunology & Dermatology section. All sales (ex-US) are booked in the Respiratory franchise. CARDIO-METABOLIC Q2 2015 Q2 2014 % change H1 2015 H1 2014 % change USD m USD m USD cc USD m USD m USD cc Galvus 273 328 -17 -1 565 636 -11 4 Other 0 8 nm nm 0 8 nm nm Total Cardio-Metabolic 273 336 -19 -4 565 644 -12 2nm = not meaningful
Galvus Group (USD 273 million, -1% cc) includes Galvus, an oral treatment for type 2 diabetes, and Eucreas, a single-pill combination of vildagliptin (the active ingredient in Galvus) and metformin. Galvus sales declined (cc) in the second quarter, despite double-digit volume growth across many markets around the world. Sales grew 5% (cc) ex-Germany, where distribution was stopped on July 1, 2014. The focus for Galvus remains on patients whose diabetes is uncontrolled on metformin, as well as on expansion of usage in key segments, such as elderly and renal-impaired patients. The Galvus Group is currently approved in more than 120 countries.

13/77
ESTABLISHED MEDICINES Q2 2015 Q2 2014 % change H1 2015 H1 2014 % change USD m USD m USD cc USD m USD m USD cc Diovan 333 743 -55 -52 705 1 546 -54 -51 Exforge 272 370 -26 -16 553 733 -25 -14 Voltaren/Cataflam1 136 161 -16 -4 270 309 -13 -2 Ritalin/Focalin 108 132 -18 -13 210 242 -13 -8 Other2 723 967 -25 -17 1 426 1 863 -23 -15 Total Established Medicines 1 572 2 373 -34 -26 3 164 4 693 -33 -26 1 Pharmaceuticals Division sales only 2 The “Other” category is composed of more than 100 brands
Diovan Group (USD 333 million, -52% cc), consisting of Diovan monotherapy and the combination product Co-Diovan/Diovan HCT, saw a continued sales decline worldwide due to generic competition in most markets including the US (following the July 7, 2014 Diovan monotherapy generic entry), many EU countries and Japan (generic entry in June 2014). Exforge Group (USD 272 million, -16% cc), which includes Exforge and Exforge HCT, declined due to the entry of generic competition in the US for both Exforge (October 2014) and Exforge HCT (November 2014). Sales declined in the EU, but continued to experience significant growth in China and other emerging markets. Exforge is now available in more than 100 countries. Exforge HCT is available in over 60 countries. Voltaren/Cataflam (USD 136 million, -4% cc) is the leading international brand by sales in the plain non-steroidal anti-inflammatory drugs (NSAIDs) market for the relief of symptoms in rheumatic diseases such as rheumatoid arthritis and osteoarthritis, and for various other inflammatory and pain conditions. Voltaren/Cataflam was first registered in 1973 and is available in more than 140 countries. This product, which is subject to generic competition, is marketed by the Pharmaceuticals Division in a wide variety of dosage forms, including tablets, drops, suppositories, ampoules and topical therapy. In addition, in various countries, Sandoz markets generic versions of Voltaren and Alcon markets Voltaren for ophthalmic indications. Ritalin/Focalin (USD 108 million, -13% cc) is a treatment for attention deficit hyperactivity disorder (ADHD) in children. Ritalin and Ritalin LA are available in more than 70 and 30 countries, respectively, and are also indicated for narcolepsy. To date in 2015, Ritalin LA has been granted the adult ADHD indication in 18 countries. Focalin and Focalin XR are available in the US and Focalin XR is additionally indicated for adults. Focalin XR is also approved in Switzerland. Ritalin Immediate Release has generic competition in most countries. Some strengths of Ritalin and Focalin are subject to generic competition in the US.

14/77
Alcon Q2 2015 Q2 2014 % change
H1 2015 H1 2014 % change
USD m USD m USD cc USD m USD m USD ccNet sales 2 559 2 817 -9 0 5 117 5 459 -6 2Operating income 150 471 -68 -41 503 851 -41 -12 As % of net sales 5.9 16.7 9.8 15.6 Core operating income 796 1 031 -23 -10 1 690 1 956 -14 -1 As % of net sales 31.1 36.6 33.0 35.8 Second quarter Net sales Alcon net sales amounted to USD 2.6 billion (-9%, 0% cc) in the second quarter. Surgical sales (-1% cc) declined, driven by lower equipment sales and competitive pressure on intraocular lenses (IOLs). Ophthalmic Pharmaceuticals sales (0% cc) were flat, as growth in glaucoma fixed-dose combination and inflammation products was offset mostly by shipment phasing. Vision Care sales (-1% cc) were impacted by a continued decline in contact lens care. Regionally, US sales were down (-2%), mainly due to flat Surgical growth with lower equipment sales, as well as softer sales in Vision Care and Ophthalmic Pharmaceuticals. Europe, the Middle East and Africa (+2% cc) saw modest growth in all franchises. Japan sales were up (+7% cc), driven by solid growth in Ophthalmic Pharmaceuticals and improving performance in Surgical and Vision Care. Emerging Growth Market sales were flat (cc). Operating income Operating income (-68%, -41% cc) was USD 150 million, reflecting a USD 119 million intangible asset impairment. Adjustments to arrive at core operating income for the quarter amounted to USD 646 million, including USD 519 million for the amortization of intangible assets in addition to the USD 119 million intangible asset impairment. Prior-year adjustments amounted to USD 560 million due to amortization, restructuring charges and other net costs. Core operating income (-23%, -10% cc) was USD 796 million, primarily impacted by product mix and slightly higher revenue provisions, as well as higher spending in R&D and M&S. Core operating income margin in constant currencies decreased by 3.7 percentage points; currency had a negative impact of 1.8 percentage points, resulting in a net decrease of 5.5 percentage points to 31.1% of net sales. Core gross margin as a percentage of net sales decreased by 1.7 percentage points (cc) versus prior year, driven by softer sales of high-margin US Ophthalmic Pharmaceuticals products (as a result of shipment phasing). Core R&D expenses increased 0.5 percentage points (cc), driven by investments in key pipeline projects including RTH258 for wet age-related macular degeneration (AMD). Core M&S and core G&A expenses increased 2.1 percentage points (cc), mainly driven by investments in the business despite flat sales. Core Other Income and Expense, net increased the margin by 0.6 percentage points (cc). First half Net sales Net sales amounted to USD 5.1 billion (-6%, +2% cc) in the first half. Surgical franchise sales (+2% cc) grew modestly in constant currencies, as solid cataract and vitreoretinal consumables sales were partly offset by lower equipment sales, as well as softer sales of IOLs despite total IOL unit growth. Ophthalmic Pharmaceuticals grew in constant currencies (+3% cc), driven by double-digit growth of Systane in Dry Eye and fixed-dose combination products in Glaucoma, offset by weaker sales in the US and Asia. Vision Care (+1% cc) was driven by continued strong uptake of Dailies Total1 and AirOptix Colors, offset by weaker second quarter sales of contact lenses in the US and a continued decline in contact lens care solutions.

15/77
Operating income Operating income was USD 503 million (-41%, -12% cc), reflecting the second quarter intangible asset impairment of USD 119 million. Adjustments to arrive at core operating income for the first half amounted to USD 1.2 billion, consisting of USD 1.0 billion for the amortization of intangible assets, the USD 119 million intangible asset impairment, USD 20 million for restructuring costs, and other net costs of USD 11 million. Prior-year adjustments amounted to USD 1.1 billion due to amortization, restructuring charges, and other net costs. Core operating income (-14%, -1% cc) was USD 1.7 billion, primarily impacted by product mix and slightly higher revenue provisions, as well as higher spending in M&S. Core operating income margin in constant currencies decreased by 1.1 percentage points; currency had a negative impact of 1.7 percentage points, resulting in a net decrease of 2.8 percentage points to 33.0% of net sales. Core gross margin as a percentage of net sales decreased by 0.8 percentage points (cc) versus prior year. Core R&D expenses decreased 0.2 percentage points (cc) compared to prior year, driven by continued project prioritization, which offset investments in key clinical trials including RTH258 for wet AMD. Core M&S and core G&A expenses increased by 0.8 percentage points (cc). Core Other Income and Expense, net increased the margin by 0.3 percentage points (cc). Alcon product review All comments below focus on second quarter movements in constant currencies. SURGICAL Q2 2015 Q2 2014 % change H1 2015 H1 2014 % change USD m USD m USD cc USD m USD m USD cc Cataract products 716 821 -13 -4 1 454 1 564 -7 2 IOLs 294 331 -11 -2 578 642 -10 -1 Vitreoretinal products 150 150 0 11 295 302 -2 7 Refractive/Other 74 76 -3 2 128 144 -11 -5 Total Surgical 940 1 047 -10 -1 1 877 2 010 -7 2
Global Surgical sales were USD 940 million (-1% cc) for the quarter, with continued solid uptake of cataract and vitreoretinal consumables offset by lower equipment sales, particularly for LenSx technology, in Asia and the US. Sales of IOLs were impacted by a volume decline in ReSTOR multifocal lenses, as well as competitive pressure on monofocal lenses despite 5% unit growth. OPHTHALMIC PHARMACEUTICALS Q2 2015 Q2 2014 % change H1 2015 H1 2014 % change USD m USD m USD cc USD m USD m USD cc Glaucoma 303 330 -8 5 603 651 -7 5 Allergy/Otic/Nasal 226 262 -14 -12 496 537 -8 -4 Infection/Inflammation 281 278 1 9 516 520 -1 6 Dry Eye/Tears 149 156 -4 5 301 297 1 11 Other 69 90 -23 -15 139 164 -15 -4 Total Ophthalmic Pharmaceuticals 1 028 1 116 -8 0 2 055 2 169 -5 3
Global sales in Ophthalmic Pharmaceuticals amounted to USD 1.0 billion (0% cc) in the quarter. Glaucoma sales were driven by strong performance of fixed-dose combination products including Azarga, DuoTrav, and Simbrinza, partly offset by generic competition in monotherapies Travatan and Azopt. Otic and Allergy sales, including Pataday/Patanol products, declined due to the phasing of product shipments and continued generic competition to Patanase in the US. Strong sales uptake in Ilevro and Durezol drove growth within the Infection/Inflammation segment. Dry Eye sales showed moderate growth, impacted by softer sales in the US and Russia.

16/77
VISION CARE Q2 2015 Q2 2014 % change H1 2015 H1 2014 % change USD m USD m USD cc USD m USD m USD cc Contact Lenses 446 480 -7 2 902 949 -5 4 Contact Lens Care 145 174 -17 -11 283 331 -15 -9 Total Vision Care 591 654 -10 -1 1 185 1 280 -7 1
Vision Care global product sales were USD 591 million (-1% cc) for the quarter. Contact lenses showed modest growth, as continued strong uptake for Dailies Total1, AirOptix Colors, Dailies AquaComfort Plus (DACP) Toric and DACP Multifocal was partly offset by trade inventory reductions in the US. Contact lens care declined as a result of the continued market shift to daily disposable lenses and competitive pressure.

17/77
Sandoz Q2 2015 Q2 2014 % change
H1 2015 H1 2014 % change
USD m USD m USD cc USD m USD m USD ccNet sales 2 288 2 331 -2 11 4 525 4 649 -3 10 Operating income 193 244 -21 -26 472 526 -10 -7 As % of net sales 8.4 10.5 10.4 11.3 Core operating income 423 351 21 30 829 738 12 23 As % of net sales 18.5 15.1 18.3 15.9 Second quarter Net sales Net sales reached USD 2.3 billion (-2%, +11% cc) in the second quarter, as volume growth of 17 percentage points more than compensated for 6 percentage points of price erosion. Regionally, US sales were USD 879 million (+23% cc), driven by the launch of Glatopa, the first generic version of Copaxone® 20mg, continued strong growth in Dermatology, and other recent launches. Sales in Western Europe grew 2% (cc) to USD 632 million, driven by Italy (+14% cc) and Spain (+12% cc), partially offset by Germany (+2% cc) due to a shift in customer seasonal stocking patterns, as well as France (-17% cc), which continued to be impacted by a change in market model. Central and Eastern Europe was flat (cc) at USD 269 million, as strong growth in South Eastern Europe (+15% cc) and the Baltics (+31% cc) was offset by declines in Russia, given the weaker economy, and in Ukraine from the political instability. Asia-Pacific (including Japan) achieved sales of USD 164 million (+11% cc), led by strong growth in China and Thailand. Latin America sales were USD 72 million (+27% cc), driven by high double-digit growth in Brazil (+44% cc) due to a recent launch in Onco-Injectables, in line with our geographic prioritization. Global sales of Biopharmaceuticals, which include biosimilars, biopharmaceutical contract manufacturing and Glatopa, grew 57% (cc) to USD 222 million, driven in part by shipping of initial trade inventories of Glatopa in June. Sandoz continued to strengthen its leading global position in biosimilars, as the three in-market products – Omnitrope (human growth hormone), Binocrit (epoetin alfa), and Zarzio (filgrastim) – remain the leading biosimilars in their respective market segments. Anti-Infectives franchise sales, consisting of partner label and finished dosage form sales, were up 20% (cc) to USD 338 million due to restored production capacities after quality upgrades in the prior year and favorable market conditions. Operating income Operating income amounted to USD 193 million (-21%, -26% cc), significantly impacted by USD 144 million of restructuring charges mainly related to our manufacturing footprint initiative. Adjustments to arrive at core operating income for the quarter amounted to a net expense of USD 230 million, including the aforementioned USD 144 million and amortization of intangible assets of USD 88 million. Core operating income increased 21% (+30% cc) to USD 423 million, driven by strong base business performance and the launch of Glatopa. Core operating income margin in constant currencies increased 2.6 percentage points; currency had a positive impact of 0.8 percentage points, resulting in a net increase of 3.4 percentage points to 18.5% of net sales. Core gross margin as a percentage of net sales increased by 1.0 percentage point (cc), driven by overall favorable product and country mix, resulting from our new geographic prioritization strategy, as well as ongoing productivity improvements, partially offset by price erosion. Core R&D expenses decreased by 0.4 percentage points (cc), as higher sales in the quarter more than compensated for increased investments in biosimilar clinical trials. Core M&S expenses and Core G&A expenses decreased by 0.7 and 0.1 percentage points (cc), respectively, driving operating leverage. Core Other Income and Expense, net increased the margin by 0.4 percentage points (cc).

18/77
First half Net sales Net sales were USD 4.5 billion (-3%, +10% cc) as volume growth of 15 percentage points more than offset 5 percentage points of price erosion. All regions grew in the first half of the year, led by double-digit growth in the US (+20% cc), Asia-Pacific (+13% cc) and Latin America (+23% cc). Brazil led the growth in Latin America at a high double-digit rate, while China was the biggest growth driver in Asia-Pacific. Central and Eastern Europe grew 3% (cc), led by Hungary and Turkey, while Western Europe grew 4% (cc), including mid-single digit growth in Germany. Global sales of Biopharmaceuticals increased 45% (cc) to USD 368 million. Anti-Infectives franchise sales were USD 724 million (+16% cc), supported by a strong flu season in the first months of the year, restored production capacities after quality upgrades in the prior year and favorable market conditions. Operating income Operating income was USD 472 million (-10%, -7% cc), including USD 180 million of restructuring charges mainly related to our manufacturing footprint initiative. Adjustments to arrive at core operating income amounted to a net expense of USD 357 million, including the aforementioned USD 180 million and USD 178 million for the amortization of intangible assets. Core operating income increased 12% (+23% cc) to USD 829 million. Core operating income margin in constant currencies increased by 1.8 percentage points; currency had a positive impact of 0.6 percentage points, resulting in a net increase of 2.4 percentage points to a core operating income margin of 18.3% of net sales. Core gross margin as a percentage of net sales increased by 0.9 percentage points (cc), driven by sales mix and ongoing productivity programs, partially offset by continued price erosion. Core R&D expenses decreased by 0.2 percentage points (cc), as higher sales compensated for increased investments in biosimilar clinical trials. Core M&S expenses and core G&A expenses decreased by 0.6 and 0.1 percentage points (cc), respectively, driving operating leverage. Core Other Income and Expense, net was flat (cc) in the first half of the year.

19/77
DISCONTINUED OPERATIONS1 Q2 2015 Q2 2014 % change
H1 2015 H1 2014 % change
USD m USD m USD cc USD m USD m USD ccNet sales 39 1 290 nm nm 587 2 545 nm nmOperating loss/income -96 -89 nm nm 12 526 585 nm nm As % of net sales nm -6.9 nm 23.0 Core operating loss -72 -62 -16 -23 -174 -205 15 22 As % of net sales nm -4.8 -29.6 -8.1 nm = not meaningful
Second quarter Net sales Operational results for discontinued operations in the second quarter of 2015 include a full quarter of results from the influenza Vaccines business. Animal Health, OTC and non-influenza Vaccines are not included, as the divestments were closed in the first quarter of 2015. The prior-year period included the results of all divested units during the three months. Influenza Vaccines sales for the quarter amounted to USD 39 million, compared to USD 29 million in the prior-year period. Operating income Operating loss for discontinued operations was USD 96 in the quarter compared to a loss of USD 89 million in the prior-year period. Net loss from discontinued operations amounted to USD 18 million compared to a net loss of USD 138 million in the prior-year quarter. Core operating loss for discontinued operations amounted to USD 72 million compared to a loss of USD 62 million in the prior-year quarter. First half Net sales Operational results for discontinued operations in the first half of 2015 include six months of results from the influenza Vaccines business, as well as results from the non-influenza Vaccines business and OTC until their divestment date on March 2, 2015. Operational results from the Animal Health business, which was divested on January 1, 2015, include only the divestment gain. The prior year included the results of all divested units during the first half. Net sales for the non-influenza Vaccines business and OTC up to March 2 amounted to USD 75 million and USD 456 million, respectively. Influenza Vaccines sales amounted to USD 56 million, compared to USD 81 million in the prior-year period, mainly due to the acceleration of first quarter southern hemisphere shipments to the fourth quarter of 2014 and an exceptional shipment to the Pan American Health Organization in the prior-year period. Operating income Operating income for discontinued operations includes preliminary exceptional pre-tax gains of USD 12.8 billion from the divestment of Animal Health (USD 4.6 billion) and from the transactions with GSK (USD 2.8 billion for the non-influenza Vaccines business and USD 5.9 billion arising from the contribution of Novartis OTC into the consumer healthcare joint venture). In addition, the GSK transactions resulted in approximately USD 0.5 billion of additional transaction-related expenses. The remaining operating loss of USD 0.3 billion came from the operating performance of OTC and the non-influenza Vaccines business up to their divestment date, as well as a full six months of the influenza Vaccines business.
1 Discontinued operations are defined on page 42.

20/77
Net income from discontinued operations amounted to USD 10.7 billion, mainly due to the exceptional gains from the GSK and Lilly transactions, compared to USD 0.4 billion in the first half of 2014, which included the exceptional gain from the divestment of the blood transfusion diagnostics to Grifols. Core operating loss for discontinued operations, which excludes these exceptional items, amounted to USD 174 million in first half of 2015, compared to a loss of USD 205 million in the prior-year period.

21/77
Consolidated interim financial statements reflecting the portfolio transformation Following the announcement of our portfolio transformation transactions on April 22, 2014, Novartis reported the Group’s financial results for the current and prior years as “continuing operations” and “discontinued operations.” For continuing operations, operational results include the businesses of Pharmaceuticals, Alcon, Sandoz and Corporate activities. Starting on March 2, 2015, the date of the completion of the GSK transactions, continuing operations also includes the results from the new oncology assets acquired from GSK and the 36.5% interest in the GSK consumer healthcare joint venture (the latter reported as part of income from associated companies). For discontinued operations, operational results include the results from the influenza Vaccines business, as well as results from the non-influenza Vaccines business and OTC until March 2, 2015. Operational results from the Animal Health business, which was divested on January 1, 2015, include only the divestment gain. The prior year included the results of all divested units during the second quarter and first half. Discontinued operations also includes, in the first half, the preliminary exceptional pre-tax gains of USD 12.8 billion from the divestment of Animal Health (USD 4.6 billion) and from the transactions with GSK (USD 2.8 billion for the non-influenza Vaccines business and USD 5.9 billion arising from the contribution of Novartis OTC into the consumer healthcare joint venture). In addition, the GSK transactions resulted in approximately USD 0.5 billion of additional transaction-related expenses. Novartis expects the previously-announced divestment of the influenza Vaccines business to CSL Limited (CSL) to be completed in the second half of 2015, subject to customary closing conditions including regulatory approvals. Novartis remains fully committed to the influenza Vaccines business until it is divested to CSL.

22/77
CASH FLOW AND GROUP BALANCE SHEET Cash flow Second quarter Cash flow from operating activities of continuing operations in the second quarter amounted to USD 3.0 billion compared to USD 3.6 billion in the prior-year period. The decrease was mainly due to lower operating income, partially offset by lower net working capital and higher hedging gains. The cash flows used in operating activities from discontinued operations were USD 45 million compared to USD 237 million in the prior-year period. The cash outflow for investing activities of continuing operations amounted to USD 1.1 billion compared to USD 0.8 billion in the prior-year period. The current year amount includes a net outflow of USD 0.9 billion for the purchase of property, plant and equipment and other non-current assets, broadly in line with the prior year-period. The increased outflow of USD 0.3 billion as compared to the prior-year period was mainly due to higher payments for the acquisition of businesses and net investments in marketable securities. The cash flow used in investing activities from discontinued operations was USD 0.7 billion compared to USD 0.3 billion in the prior-year period. This increase was mainly due to capital gain taxes related to the divested business. Cash flow used in financing activities in the second quarter amounted to USD 2.5 billion compared to USD 2.6 billion in the prior-year period. The decrease was mainly due to higher net inflows from other financing activities. The current year includes a net cash outflow of USD 0.6 billion for treasury share transactions and a net decrease in financial debts of USD 2.0 billion, due to the repayment at maturity of a USD 2.0 billion bond and a Swiss franc denominated bond of USD 0.9 billion, partially offset by other short-term financial debts including commercial papers. The prior-year period includes a net cash outflow of USD 1.9 billion for treasury share transactions and a net decrease in financial debts of USD 0.7 billion. The free cash flow for continuing operations in the second quarter was USD 2.1 billion (-23%), a decrease of USD 0.6 billion compared to the prior-year period. This was primarily due to lower operating income, including a negative currency impact on operations, partially offset by lower net working capital and higher hedging gains. For the total Group, free cash flow for the second quarter amounted to USD 2.0 billion compared to USD 2.4 billion in the prior-year period. First half Cash flow from operating activities of continuing operations in the first half of 2015 amounted to USD 4.9 billion compared to USD 5.3 billion in the prior-year period. The decrease was mainly due to lower operating income, partially offset by lower net working capital and higher hedging gains. The cash flow used in operating activities from discontinued operations was USD 0.2 billion, compared to USD 0.6 billion in the prior-year period. The cash outflow for investing activities of continuing operations amounted to USD 17.6 billion, compared to an inflow of USD 0.5 billion in the prior-year period. The current year amount includes a net outflow of USD 1.3 billion for the purchase of property, plant and equipment and other non-current assets, in line with the prior year-period. The increased outflow compared to the prior-year period is primarily due to the acquisition of the new oncology assets from GSK of USD 16.0 billion, and an outflow for marketable securities of USD 0.1 billion compared to an inflow of USD 1.9 billion. Cash inflows from investing activities of discontinued operations amounted to USD 9.2 billion, mainly on account of the net divestment proceeds from the portfolio transformation transactions. The prior-year cash inflow of USD 1.3 billion consisted mainly of proceeds from the divestment of the blood transfusion diagnostics unit. Cash flow used in financing activities amounted to USD 4.2 billion, compared to USD 6.3 billion in the prior-year period. The current year amount includes a cash outflow for dividends of USD 6.6 billion compared to USD 6.8 billion in the prior-year period. The inflow from the increase in financial debt of USD 3.0 billion in the current year was due to the issuance of commercial papers of USD 4.4 billion and three Swiss franc denominated bonds for a total amount of USD 1.5 billion, partially offset by the repayment at maturity of a USD 2.0 billion bond and a Swiss franc denominated bond of USD 0.9 billion. Treasury share transactions resulted in an outflow of USD 0.5 billion, compared to USD 1.9 billion in the prior-year period.

23/77
The free cash flow for continuing operations in the first half of 2015 was USD 3.5 billion (-8%), a decrease of USD 0.3 billion compared to the prior-year period. This was primarily due to the negative currency impact on operations, partially offset by lower net working capital and higher hedging gains. For the total Group, free cash flow for the first half of 2015 amounted to USD 3.2 billion, in line with the prior year-period. Balance sheet Assets Total non-current assets of USD 110.7 billion at June 30, 2015 increased by USD 22.8 billion compared to December 31, 2014. Intangible assets other than goodwill increased by USD 12.1 billion to USD 35.9 billion mainly on account of the new oncology assets acquired from GSK which added product rights amounting to USD 13.1 billion to the intangible assets of the Group. This increase was partially offset by the amortization of USD 1.8 billion on intangible assets. Goodwill increased by USD 2.0 billion to USD 31.3 billion mainly on account of the goodwill of USD 2.3 billion recorded on the new oncology assets, partially offset by currency translation adjustments of USD 0.3 billion. Financial and other non-current assets increased by USD 8.9 billion to USD 27.6 billion, mainly on account of the 36.5% investment in the GSK consumer healthcare joint venture valued at USD 7.5 billion while the investment in property, plant and equipment remained nearly in line with last year. Total current assets decreased by USD 12.8 billion to USD 24.7 billion at June 30, 2015, as the assets held for sale reduced by USD 6.5 billion to USD 0.3 billion as a result of the closing of the transactions with Lilly and GSK in 2015. Cash and cash equivalent decreased by USD 8.0 billion to USD 5.9 billion mainly on account of the net payment to GSK for the acquisition of the oncology assets as well as the dividend payment. Trade receivables increased by 0.5 billion, other current assets increased by USD 0.7 billion and inventory increased by USD 0.5 billion. The Group has an equivalent of approximately USD 0.6 billion of cash in Venezuela in local currency, which is only slowly being approved for remittance outside of the country. As a result, the Group is exposed to a potential devaluation loss in the income statement on its total intercompany balances with its subsidiaries in Venezuela, which at June 30, 2015 amounted to USD 0.5 billion. The subsidiaries in Venezuela restate non-monetary items in the balance sheet in line with the requirements of IAS 29 “Financial Reporting in Hyperinflationary Economies.” The corresponding monetary loss of USD 19 million is included in the second quarter 2015 and H1 2015 financial results. The Group continues to use for the consolidation of the financial statements of its Venezuelan subsidiaries the official exchange rate of VEF 6.3/USD, which is applied for health and food imports as published by the Venezuelan Centro Nacional de Comercio Exterior (CENCOEX, formerly CADIVI). The currently evolving debt crisis in Greece could lead to increased concentration of credit risk for the Group. As of June 30, 2015, a net total of USD 216 million of trade receivables is outstanding from customers in Greece, of which USD 188 million is with public sector institutions. Novartis continues to provide products and services to patients in Greece and will continue to monitor the situation closely. Liabilities Total financial debt, including derivatives, amounted to USD 23.3 billion at June 30, 2015 compared to USD 20.4 billion at December 31, 2014. Long-term debt decreased by USD 0.5 billion to USD 13.3 billion at June 30, 2015, mainly due to the reclassification to short-term debt of a euro denominated bond of USD 1.7 billion, partially offset by the issuance of three Swiss franc denominated bonds totaling USD 1.5 billion in the first half of 2015. Short-term borrowings increased to USD 10.0 billion at June 30, 2015 from USD 6.6 billion at December 31, 2014, mainly due to the issuance of additional commercial papers of USD 4.4 billion and the reclassification from long-term debt of a euro denominated bond of USD 1.7 billion, partially offset by the repayment at maturity of a USD 2.0 billion and a Swiss franc denominated bond of USD 0.9 billion. Trade payables, other current and non-current liabilities of USD 33.1 billion increased by USD 1.4 billion compared to USD 31.7 billion at the prior year-end. The increase was mainly due to other current liabilities of USD 1.5 billion, partially offset by a reduction in the trade payables of USD 0.3 billion. Liabilities related to discontinued operations reduced from USD 2.4 billion at the beginning of the year to USD 0.2 billion as a result of the closing of the transactions with Lilly and GSK.

24/77
Group equity The Group’s equity increased by USD 8.0 billion to USD 78.8 billion at June 30, 2015, mainly due to net income of discontinued and continuing operations of USD 14.8 billion. Share-based compensation and favorable currency translation differences also contributed USD 0.6 billion and USD 0.7 billion, respectively. This increase was partially offset by the USD 6.6 billion dividend payment, an increase in the contingent liability under the share repurchase agreement of USD 1.2 billion and net purchases of treasury shares of USD 0.6 billion. Net debt and debt/equity ratio The Group’s liquidity amounted to USD 5.9 billion at June 30, 2015 compared to USD 13.9 billion at December 31, 2014, and net debt increased over the same period by USD 10.9 billion to USD 17.4 billion. The debt/equity ratio increased to 0.30:1 at June 30, 2015 compared to 0.29:1 at December 31, 2014.

25/77
INNOVATION REVIEW Benefiting from our continued focus on innovation, Novartis has one of the industry’s most competitive pipelines with more than 200 projects in clinical development, including 141 in Pharmaceuticals. Key developments from the second quarter of 2015 include: New approvals and positive opinions
On July 7, the FDA approved Entresto (sacubitril/valsartan, formerly LCZ696) for the
treatment of heart failure with reduced ejection fraction. Entresto will be available on prescription for patients whose condition is classified NYHA class II-IV, indicated to reduce the risk of cardiovascular death and heart failure hospitalization. It is usually administered in conjunction with other heart failure therapies, in place of an ACE inhibitor or other angiotensin receptor blocker.
The EC approved Zykadia (ceritinib, formerly LDK378) to treat adult patients with ALK-positive (ALK+) advanced non-small cell lung cancer (NSCLC) previously treated with crizotinib. Zykadia is the first treatment option approved for patients in Europe for this patient population.
The FDA approved Promacta (eltrombopag) for the treatment of children six years and older
with chronic immune thrombocytopenia (ITP) who have had an insufficient response to corticosteroids, immunoglobulins or splenectomy.
Farydak (panobinostat, formerly LBH589) received a positive opinion from the CHMP, which recommended approval, in combination with bortezomib and dexamethasone, for the treatment of patients with multiple myeloma (MM) who have received at least two prior regimens, including bortezomib and an immunomodulatory agent.
On July 3, Farydak was approved by Japan’s Pharmaceuticals & Medical Devices Agency for
use in combination with bortezomib and dexamethasone for the treatment of patients with relapsed and refractory MM.
The CHMP adopted a positive opinion for Odomzo (sonidegib, formerly LDE225) to treat adult patients with locally advanced basal cell carcinoma (laBCC) not amenable to curative surgery or radiation therapy. Sonidegib is expected to provide an important treatment option for patients suffering from this advanced form of the disease.
Galvus received a first-line monotherapy approval in China for type 2 diabetes.
Sandoz received FDA approval of Glatopa, the first fully substitutable generic version of
Copaxone® (glatiramer acetate) 20 mg/ml one-time-daily injection for relapsing forms of multiple sclerosis. Glatopa, which was developed in collaboration with Momenta, was launched in the US in June 2015.
Alcon achieved European CE mark for AcrySof IQ PanOptix presbyopia-correcting IOL, a
trifocal IOL providing improved near to intermediate vision in addition to distance vision for cataract patients. PanOptix was launched in July.
Alcon achieved European CE mark for UltraSert IOL delivery device, a preloaded delivery system for Alcon IOLs that enables lens implantation through a 2.2mm incision during cataract surgery. UltraSert is expected to launch in the third quarter of 2015.
The FDA approved Alcon’s AcrySof IQ ReSTOR +2.5D Multifocal IOL in the US for the treatment of cataracts in patients who desire near, intermediate and distance vision with increased spectacle independence following cataract surgery.
Alcon registered VerifEye+ in the US and obtained European CE mark for the enhanced intraoperative diagnostic tool, which provides improved precision during cataract surgery, in July 2015. VerifEye+ is a result of our WaveTec acquisition in August 2014.
26/77
Alcon received European CE mark for Systane Hydration Lubricating Eye Drops (Unit-Dose and Multi-Dose) for the temporary relief of burning and irritation due to dry eye symptoms. The drops can also be used when wearing contact lenses.
Regulatory submissions and filings
Global regulatory submissions have been filed for Cosentyx (secukinumab) in ankylosing spondylitis and psoriatic arthritis.
Regulatory applications for the combination of Tafinlar and Mekinist for the treatment of
patients with BRAF V600 mutation-positive metastatic melanoma were submitted in Europe and Japan. The submissions include the results from the Phase III COMBI-d and COMBI-v final analyses.
Results from both the COMBI-d and COMBI-v final analyses for the combination of Tafinlar and Mekinist were submitted to the FDA to meet conditions of full approval.
In July, the FDA granted Breakthrough Therapy status to combination therapy Tafinlar and Mekinist in patients with BRAF V600E mutation-positive NSCLC.
A regulatory application for Zykadia in ALK+ advanced NSCLC has been submitted in Japan.
In July, a regulatory application for Arzerra for use as maintenance therapy in patients with relapsed chronic lymphocytic leukemia was submitted in Europe.
Results from ongoing trials and other highlights
Data from the final analysis of the Phase III COMBI-d study presented at the American Society
of Clinical Oncology (ASCO) Annual Meeting showed that the combination of Tafinlar and Mekinist achieved a statistically significant overall survival (OS) benefit compared to Tafinlar monotherapy (median of 25.1 months vs. 18.7 months; Hazard Ratio (HR) 0.71 [95% Confidence Interval (CI), 0.55-0.92], p=0.011). More than half of the patients were still alive on the combination therapy after 2 years, compared to 42% of patients on Tafinlar monotherapy. The safety results were consistent with the profile observed to date for the combination and no new safety concerns were observed.
Long-term data from a Phase I-II study presented at ASCO showed a three-year OS rate of 38% (95% CI, 25%, 51%) after treatment with the combination of Tafinlar and Mekinist in all patients with BRAF V600 E/K mutation-positive metastatic melanoma. Safety results from this study were consistent with those observed in other trials evaluating the combination.
Data from a Phase II study of Tafinlar in combination with Mekinist presented at ASCO demonstrated an overall response rate (ORR) of 63% [95% CI: 40.6, 81.2%] in patients with metastatic BRAF V600E mutation-positive NSCLC who had failed at least one round of chemotherapy. The most common adverse events (incidence >20%) among patients included in this analysis were pyrexia, diarrhea, nausea, vomiting, decreased appetite, asthenia, cough, peripheral edema and rash.
The Phase III RADIANT-4 trial met its primary endpoint and found that Afinitor significantly
extended progression-free survival (PFS) compared to placebo in patients with advanced nonfunctional NET of gastrointestinal or lung origin. Full results will be submitted for presentation at a major medical meeting, and worldwide regulatory filings are planned for 2015. The RADIANT-4 study is part of one of the largest clinical trial programs in NET.
Results from the Phase II RECORD-4 study were presented at ASCO. The open-label trial prospectively evaluated Afinitor exclusively as a second-line therapy in 134 patients with advanced renal cell carcinoma (aRCC) who had progressed following a first-line treatment, including various different vascular endothelial growth factor (VEGF) receptor inhibitors or cytokine therapy. The overall median PFS was 7.8 months (95% CI: 5.7-11.0). PFS was 5.7 months (3.7-11.3) after sunitinib in the first line, 7.8 months (5.7-11.0) after other anti-VEGF therapies in the first line, and 12.9 months (2.6-not evaluable) after first-line cytokine therapy. The safety results were consistent with the known safety profile of Afinitor.

27/77
New one-year study results from the MEASURE 2 pivotal Phase III study of Cosentyx in ankylosing spondylitis (AS) were presented at the European League Against Rheumatism (EULAR) Annual Meeting in Rome. Approximately 74% of patients on secukinumab achieved clinically significant improvement in their symptoms after one year of treatment, as measured by ASAS20, a standard tool used to assess clinical improvement in AS.
New data was presented at the World Congress of Dermatology in Vancouver, Canada, which showed that Cosentyx met the primary endpoints in two new clinical studies (GESTURE and TRANSFIGURE), showing superior efficacy compared to placebo in patients with psoriasis of the palms, soles and nails, all difficult-to-treat locations of plaque psoriasis. Cosentyx (at a dose of 300 mg) is the first and only interleukin-17A (IL-17A) inhibitor approved to treat adult patients with moderate-to-severe plaque psoriasis.
Secukinumab Phase III data in psoriatic arthritis (FUTURE 2) published in The Lancet in June demonstrated rapid onset of action and was significantly superior to placebo in improving signs and symptoms of psoriatic arthritis, with efficacy sustained over one year.
The Phase III BELLE-2 trial of oral BKM120 (buparlisib) in combination with fulvestrant (Faslodex®) met its primary objective, demonstrating a statistically significant improvement in PFS in postmenopausal women with HR+/HER2- advanced breast cancer whose disease progressed or recurred on or after treatment with an aromatase inhibitor when compared to fulvestrant alone. The observed moderate PFS result in the overall study population and the prospective analyses in certain predefined subgroups, including patients with PIK3CA mutation assessed in archival tumor samples and circulating tumor DNA, will be discussed with the health authorities before proceeding with the regulatory submissions. In addition, the updated survival analysis will be available in the second half of 2016.
Data from the Phase III COMPLEMENT 2 study presented at the European Hematology
Association (EHA) Congress in June showed that treatment with Arzerra (ofatumumab) plus fludarabine and cyclophosphamide significantly improved median PFS by 54% compared to treatment with fludarabine and cyclophosphamide alone (28.9 months vs. 18.8 months, respectively; p=0.0032) in patients with relapsed chronic lymphocytic leukemia (CLL).
Results presented at EHA from a pivotal Phase III clinical trial exploratory subgroup analysis
showed a 7.8-month improvement in median PFS when using Farydak in combination with bortezomib and dexamethasone in patients with relapsed or relapsed and refractory multiple myeloma who had received two or more prior regimens, including bortezomib and an immunomodulatory agent.
Long-term safety and efficacy results from the pivotal Phase III RESPONSE study evaluating
Jakavi (ruxolitinib) for the treatment of patients with inadequately controlled polycythemia vera (PV) who are resistant to or intolerant of hydroxyurea were presented at EHA. A preplanned analysis of the study at 18 months demonstrated that, in the patients treated with Jakavi who responded at Week 32, 80% experienced a durable response of sustaining hematocrit less than 45% without the use of phlebotomy and reducing spleen size, two key measures of disease control, for at least one year. Jakavi is the only targeted therapy approved for PV in the EU.
Results from the Phase IIIb ENEST1st study in more than 1,000 patients with newly-diagnosed, Bcr-Abl positive CML presented at EHA confirmed the benefits of first-line Tasigna treatment seen in earlier trials. At 18 months, 38.4% of Tasigna-treated patients reached MR4.0. The rate of disease progression in the study was low, with six patients, or 0.6%, advancing to the accelerated phase/blast crisis stage of the disease. Despite the higher median age of patients in ENEST1st than in previous Tasigna studies, the safety results were consistent with the known safety profile of Tasigna.

28/77
Results from the ASCEND-2 and ASCEND-3 trials presented at ASCO reinforce the efficacy of Zykadia in patients with ALK+ NSCLC who had received previous treatment with an ALK inhibitor and in those receiving an ALK-targeted therapy for the first time. Overall response rates (ORR) seen in these trials were 38.6% and 63.7%, respectively, based upon investigator assessment. Brain metastases at baseline were seen in 71.4% and 40.3% of patients, respectively. Comparable ORR results were observed in patients with ALK+ NSCLC who entered the studies with brain metastases (33% and 58%, respectively).
Findings from an ongoing Phase II study, presented at ASCO, of CTL019 in adults with
relapsed or refractory (r/r) diffuse large B-cell lymphoma (DLBCL) and follicular lymphoma (FL) found an ORR of 100% in patients with FL and 50% in patients with DLBCL. In the study, 13 of 19 evaluable patients responded to the therapy. 11 achieved a complete response and two experienced a partial response to treatment. Two patients developed cytokine release syndrome of grade three or higher at peak T-cell expansion. Additional CTL019 data presented at ASCO included preliminary safety and efficacy findings of a Phase I study investigating the use of CTL019 in the treatment of multiple myeloma (MM). The data on four patients treated suggest that CTL019 can be manufactured from and safely administered to refractory MM patients.
Novartis initiated a Phase II multicenter global study of CTL019 in pediatric patients with r/r
acute lymphoblastic leukemia (ALL). The study has opened in the US, with the intention of expanding into other countries as soon as possible. Further, Novartis has begun to process patient cells at its cell processing facility in Morris Plains, NJ, and will utilize the facility in the Phase II multi-center global study. The facility is the first FDA-approved Good Manufacturing Practices quality site for a cell therapy.
At the American Thoracic Society (ATS) International Conference, Novartis presented results from two positive US Phase III programs in COPD for QVA149 and NVA237. QVA149 improved lung function, breathlessness and health related quality of life in moderate-to-severe COPD patients, according to EXPEDITION trial results. GEM 1 & 2 studies showed NVA237 provided significant and clinically meaningful improvements in lung function in moderate-to- severe COPD patients.
Ophthotech completed patient recruitment of the first Phase III pivotal trial of anti-PDGF therapy OAP030 (E10030/Fovista®) in combination with Lucentis in patients with wet age-related macular degeneration (AMD).
The database has been locked for an interim analysis of six-month data for the Lucentis PROMETHEUS study, a 12-month, randomized, double-masked, sham-controlled, multicenter study to evaluate the efficacy and safety of 0.5 mg ranibizumab intravitreal injections in patients with rare diseases causing visual impairment due to vascular endothelial growth factor (VEGF)-driven macular edema.
Alcon presented further details from the Phase II clinical studies of RTH258 in wet AMD patients during the Association for Research in Vision and Ophthalmology (ARVO) Annual Meeting. Alcon initiated the second Phase III study of RTH258 in June 2015 and is currently enrolling patients in multiple countries around the world.
Novartis entered into an agreement to acquire Spinifex Pharmaceuticals, a privately held company focused on developing a peripheral approach to treat neuropathic pain. The acquisition, which is expected to close in the second half of 2015, will add EMA401, a novel angiotensin II Type 2 receptor antagonist, to the Novartis neuroscience pipeline. Positive results from a Phase II clinical trial of EMA401 showing its efficacy in post-herpetic neuralgia, a painful condition that develops in some people following herpes zoster (shingles), have been published in The Lancet. No central nervous system side effects or any serious adverse events have been observed in the study.

29/77
Selected approvals: US, EU and Japan Product Active ingredient/
Descriptor Indication Approval date
Entresto (LCZ696) Sacubitril/valsartan Chronic heart failure with reduced ejection fraction
US - Jul. 2015
Farydak (LBH589) Panobinostat Multiple myeloma JP - Jul. 2015 Promacta/ Revolade
Eltrombopag Pediatric chronic immune thrombocytopenia (ITP)
US - Jun. 2015
Zykadia (LDK378) Ceritinib ALK+ advanced NSCLC, post crizotinib
EU - May 2015
Glatopa Generic version of Copaxone® (glatiramer acetate) 20 mg/ml one-time-daily injection
Relapsing forms of MS US - Apr. 2015
AcrySof IQ ReSTOR 2.5D
IOL Cataract US - Apr. 2015 EU - Feb. 2012 JP - Apr. 2014
AcrySof IQ ReSTOR Toric IOL 2.5D
IOL Cataract JP - Jan. 2015 EU - Jun. 2012
AcrySof IQ PanOptix
IOL Cataract EU - Jun. 2015
AcrySof IQ Aspheric IOL with UltraSert
Pre-loaded IOL delivery device
Cataract EU - Jun. 2015
Systane Hydration Lubricating Eye Drops (Unit-Dose)
OTC Dry Eye EU - Apr. 2015
Selected projects awaiting regulatory decisions Completed submissions Product Indication US EU Japan News update Arzerra CLL maintenance - Regulatory application submitted in EU
July 2015 Farydak (LBH589)
Multiple myeloma Approved Q2 2014 Approved - Orphan drug designation in Japan - CHMP positive opinion granted Jun
2015 Jadenu Iron overload Approved Q1 2015 Jakavi Polycythemia
vera Approved1 Approved Q3 2014
Promacta/ Revolade
Pediatric chronic immune thrombocytope-nia (ITP)
Approved Q1 2015 (PfOS)
Q1 2015
Severe aplastic anemia (SAA)
Approved Q4 2014
Tafinlar + Mekinist
BRAF V600+ metastatic melanoma
Approved Q2 2015 Q2 2015 - Regulatory applications submitted in EU and Japan; submissions include results from the Phase III COMBI-d and COMBI-v final analyses
- COMBI-d final analysis submitted to FDA to meet conditions of full approval
Zykadia (LDK378)
ALK+ advanced NSCLC, post crizotinib
Approved Approved Q2 2015 - EU approval May 2015 - Orphan Drug Application approved in
Japan LCZ696 Approved Q4 2014 - FDA approval July 7, 2015
1 Novartis licensed ruxolitinib from Incyte Corporation for development and commercialization outside the US. Ruxolitinib is marketed in the US by Incyte under the brand name Jakafi.

30/77
Cosentyx (AIN457)
Psoriatic arthritis Q2 2015 Q2 2015 Approved - US and EU submissions completed
Ankylosing spondylitis
Q2 2015 Q2 2015 - US and EU submissions completed
NVA237 Chronic obstructive pulmonary disease (COPD)
Q4 2014 Approved Approved - US application submitted Dec. 2014
QVA149 COPD Q4 2014 Approved Approved - US application submitted Dec. 2014
Selected Pharmaceuticals pipeline projects Project/ Compound
Potential indication/ Disease area
First planned submissions
Current Phase
News update
ABL001 Hematologic tumors ≥ 2019 I ASB183 Solid and hematological
tumors ≥ 2019 I
Ilaris (ACZ885) Hereditary periodic fevers (crFMF, HIDS, TRAPS)
2016 III
ACZ885 (canakinumab)
Secondary prevention of cardiovascular events
2017 III - Study fully enrolled
Afinitor/Votubia Non-functioning GI/lung NET
2015 III - RADIANT-4 trial met primary endpoint of statistically significant PFS for everolimus vs placebo; data will be submitted to regulatory authorities
TSC seizure 2016 III - Phase III study enrolling Diffuse large B-cell lymphoma
2018 III
Arzerra Chronic lymphocytic lymphoma (maintenance)
2015 III
Chronic lymphocytic lymphoma (relapse)
2015 III
Non-Hodgkins lymphoma (refractory)
2017 III
Non-Hodgkins lymphoma (relapse)
2018 III
BAF312 Secondary progressive MS
≥ 2019 III
BCT197 COPD ≥ 2019 II BGJ398 Solid tumors ≥ 2019 II BGS649 Obese hypogonadotropic
hypogonadism ≥ 2019 II
BKM120 + fulvestrant
Metastatic breast cancer ER+ AI resistant mTOR naive
2015 III - BELLE-2 trial met primary endpoint - Data to be shared with regulatory
authorities Metastatic breast cancer
ER+ post AI and mTOR inhibitor
2016 III
BKM120 Solid tumors ≥ 2019 I BYL719 Solid tumors ≥ 2019 I BYM338 Sporadic inclusion body
myositis 2016 III
Hip fracture ≥ 2019 II Sarcopenia ≥ 2019 II CAD106 Alzheimer’s disease ≥ 2019 II CJM112 Immune disorders ≥ 2019 I Cosentyx (AIN457)
Non-radiographic axial spondyloarthritis
2018 III
CNP520 Alzheimer’s disease ≥ 2019 I

31/77
CTL019 Adult & pediatric acute lymphoblastic leukemia
2016 II
Diffuse large B-cell lymphoma
2017 II
EGF816 Solid tumors 2018 I / II EMA401 Neuropathic pain ≥ 2019 II - Spinifex transaction signed on June
27; closing pending and expected in second half of 2015
FCR001 Renal transplant ≥ 2019 II Gilenya Chronic inflammatory
demyelinating polyradiculoneuropathy
2017 III
HSC835 Stem cell transplantation ≥ 2019 II INC280 NSCLC 2018 II KAE609 Malaria 2017 II KAF156 Malaria ≥ 2019 II LCI699 Cushing’s disease 2017 III LCZ696 Chronic heart failure with
preserved ejection fraction
≥ 2019 III
LEE011 + letrozole
HR+/HER2- postmenopausal advanced breast cancer 1st line
2016
III
- Phase III registration study fully enrolled
LEE011 + tamoxifen + goserelin or NSAI + goserelin
HR+/HER2- premenopausal advanced breast cancer 1st line
2018 III - Phase III registration study enrolling
LEE011 + fulvestrant
HR+/HER2- postmenopausal advanced breast cancer 1st/2nd line
≥ 2019 III - Phase III registration study enrolling
LEE011 Solid tumors 2018 I LJM716 Solid tumors ≥ 2019 I Lucentis Choroidal
neovascularization and macular edema in rare diseases
2016 III
Retinopathy of prematurity
2018 III
OAP030 (E10030/Fovista®)
Wet AMD 2016 III - Patient recruitment completed of the first Phase III pivotal trial of OAP030 in combination with Lucentis
PIM447 Hematologic tumors ≥2019 I PKC412
Aggressive systemic mastocytosis
2015 II - Final results from pivotal Phase II trial presented at American Society of Hematology Annual Meeting
Acute myeloid leukemia 2015 III Promacta/ Revolade
Myelodysplastic syndrome / Acute myeloid leukemia associated thrombocytopenia
2016 II
Myelodysplastic syndrome
2017 III
QAW039 Asthma ≥ 2019 II Atopic dermatitis ≥ 2019 II QAX576 Allergic diseases ≥ 2019 II QGE031 Asthma ≥ 2019 II QMF149 Asthma 2018 III - Phase III trials planned to start in
2015 QVM149 Asthma 2018 III - Phase III trials planned to start in
2015

32/77
RLX030 (serelaxin)
Acute heart failure 2016 III
Signifor LAR Cushing’s disease 2016 III Tafinlar + Mekinist BRAF V600+ NSCLC 2016 II - FDA Breakthrough Therapy
designation in Jul. 2015 BRAF V600+ melanoma (adjuvant)
2017 III
BRAF V600+ colorectal cancer
≥ 2019 I/II
Tasigna CML treatment-free remission
2016 II - Study fully enrolled
Tekturna Chronic heart failure 2016 III - Study fully enrolled Votrient Renal cell carcinoma
(adjuvant) 2017 III
Zykadia (LDK378)
ALK+ advanced NSCLC (1st line, treatment naïve)
2017 III - Phase III study enrolling
ALK+ NSCLC (brain metastases)
2018 II - Study enrolling
Selected Alcon pipeline projects Project/ Compound
Potential indication/ Disease area
Planned submissions
Current Phase
News update
SURGICAL AcrySof IQ ReSTOR Toric IOL 2.5D
Cataract US 2015 Advanced
AcrySof IQ ReSTOR 3.0D Toric IOL
Cataract Advanced - FDA Advisory Panel positive recommendation Nov. 2014
- FDA action Sep. 2015 OPHTHALMIC PHARMACEUTICALS RTH258 Retina (age-related
macular degeneration) Phase III - First Phase III clinical studies
initiated Dec. 2014 - Second Phase III clinical
studies initiated Jun. 2015 Jetrea Retina (vitreomacular
traction) JP 2015 Phase III
Nepafenac (0.3%) Retina (macular edema) EU 2015 Advanced VISION CARE Clear Care/AOSept Plus with HydraGlyde
Contact lens care JP 2015
Advanced
AirOptix HydraGlyde Sphere contact lens
Contact lens US 2016 EU 2015 JP 2016
Advanced Advanced Advanced
Selected Sandoz pipeline projects (biosimilars) Project/ Compound
Potential indication/ Disease area
Planned submissions
Current Phase
News update
GP2013 (rituximab)
Non-Hodgkin lymphoma, chronic lymphocytic leukemia, rheumatoid arthritis, granulomatosis with polyangiitis (also known as Wegener’s granulomatosis), and microscopic polyangiitis and others (same as originator)
II and III - Recruitment in Phase III follicular lymphoma trial completed in Jan. 2015
GP2015 (etanercept)
Arthritidies (rheumatoid arthritis, ankylosing spondylitis, psoriatic arthritis), plaque psoriasis and others (same as originator)
III - Patient enrollment complete
GP2017 (adalimumab)
Arthritidies (rheumatoid arthritis, ankylosing spondylitis, psoriatic arthritis), plaque psoriasis and others (same as originator)
III - Patient enrollment completed in Mar. 2015

33/77
LA-EP2006 (pegfilgrastim)
Chemotherapy-induced neutropenia and others (same as originator)
III - Trial complete
HX575 (epoetin alfa)
Chronic kidney disease, chemotherapy-induced anemia and others (same as originator)
US III - Trial complete
HX575 s.c. (epoetin alfa)
Chronic kidney disease EU (extension nephrology, approved as Binocrit since 2007)
III - Trial complete
Selected influenza Vaccines pipeline projects Project/ Compound
Potential indication/ Disease area
Planned submissions
Current Phase
News update
Flucelvax (US) Prevention of influenza disease in persons 18 years of age and older
Complete Approved - Approved by FDA for adults (18+) - Safety study completed and
published - US BLA for age 4 and older
submitted in Q4 2014 Fluad (US) Prevention of seasonal
influenza (trivalent subunit vaccine with MF59 adjuvant)
2014 Filing - US BLA submitted in Q4 2014
Quadrivalent Influenza Vaccine (QIV)
Prevention of seasonal influenza
≥2015
III - US BLA submitted in Q2 2015
Pandemic influenza vaccines
Universal vaccination in case of an influenza pandemic
NA NA - H7N9 clinical study completed - US government purchased
stockpile

34/77
CONDENSED INTERIM CONSOLIDATED FINANCIAL STATEMENTS
Consolidated income statements
Second quarter (unaudited) Q2 2015 Q2 2014 Change
USD m USD m USD m
Net sales to third parties from continuing operations 12 694 13 347 -653
Sales to discontinued segments 0 64 -64
Net sales from continuing operations 12 694 13 411 -717
Other revenues 202 538 -336
Cost of goods sold -4 487 -4 378 -109
Gross profit from continuing operations 8 409 9 571 -1 162
Marketing & Sales -3 016 -3 188 172
Research & Development -2 206 -2 178 -28
General & Administration -601 -638 37
Other income 357 207 150
Other expense -662 -590 -72
Operating income from continuing operations 2 281 3 184 -903
Income from associated companies 121 185 -64
Interest expense -164 -166 2
Other financial income and expense -82 -56 -26
Income before taxes from continuing operations 2 156 3 147 -991
Taxes -300 -424 124
Net income from continuing operations 1 856 2 723 -867
Net loss from discontinued operations -18 -138 120
Net income 1 838 2 585 -747
Attributable to:
Shareholders of Novartis AG 1 836 2 555 -719
Non-controlling interests 2 30 -28
Average number of shares outstanding – Basic (million) 2 418 2 436 -18
Basic earnings per share from continuing operations (USD) 1 0.77 1.11 -0.34
Basic loss per share from discontinued operations (USD) 1 -0.01 -0.06 0.05
Total basic earnings per share (USD) 1 0.76 1.05 -0.29
Average number of shares outstanding – Diluted (million) 2 451 2 471 -20
Diluted earnings per share from continuing operations (USD) 1 0.76 1.09 -0.33
Diluted loss per share from discontinued operations (USD) 1 -0.01 -0.06 0.05
Total diluted earnings per share (USD) 1 0.75 1.03 -0.28
1 Earnings per share (EPS) is calculated on the amount of net income attributable to shareholders of Novartis AG.
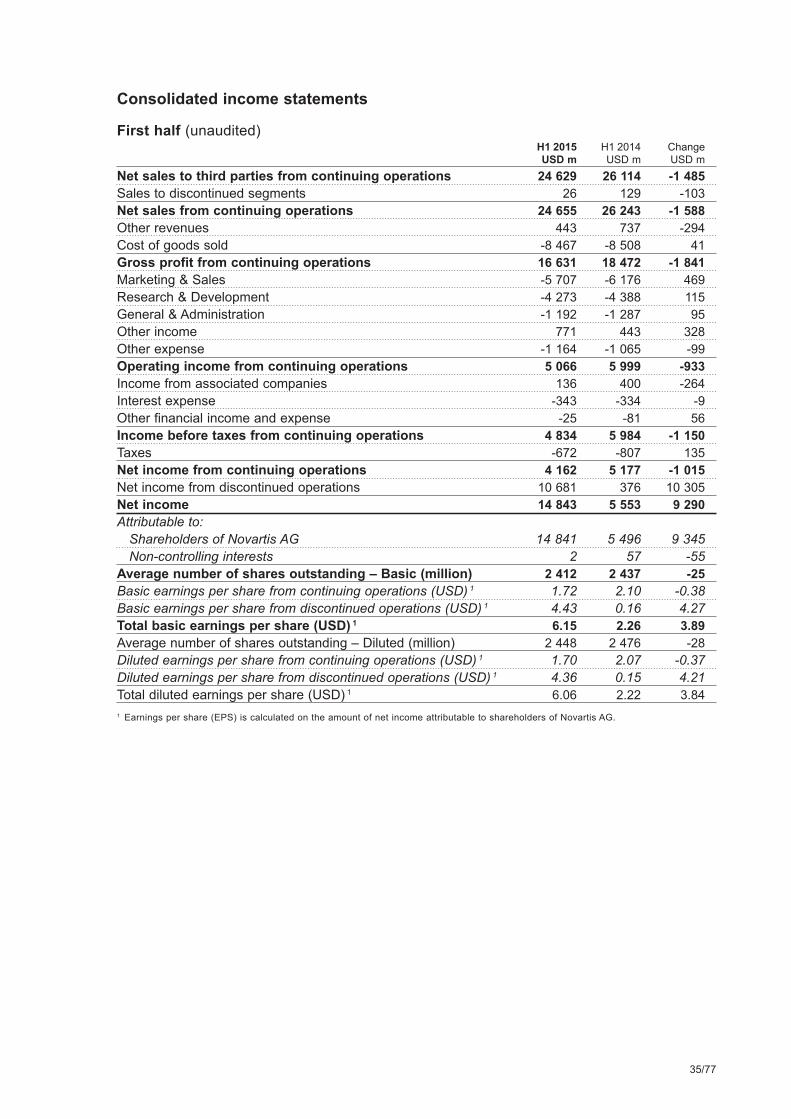
35/77
Consolidated income statements
First half (unaudited) H1 2015 H1 2014 Change
USD m USD m USD m
Net sales to third parties from continuing operations 24 629 26 114 -1 485
Sales to discontinued segments 26 129 -103
Net sales from continuing operations 24 655 26 243 -1 588
Other revenues 443 737 -294
Cost of goods sold -8 467 -8 508 41
Gross profit from continuing operations 16 631 18 472 -1 841
Marketing & Sales -5 707 -6 176 469
Research & Development -4 273 -4 388 115
General & Administration -1 192 -1 287 95
Other income 771 443 328
Other expense -1 164 -1 065 -99
Operating income from continuing operations 5 066 5 999 -933
Income from associated companies 136 400 -264
Interest expense -343 -334 -9
Other financial income and expense -25 -81 56
Income before taxes from continuing operations 4 834 5 984 -1 150
Taxes -672 -807 135
Net income from continuing operations 4 162 5 177 -1 015
Net income from discontinued operations 10 681 376 10 305
Net income 14 843 5 553 9 290
Attributable to:
Shareholders of Novartis AG 14 841 5 496 9 345
Non-controlling interests 2 57 -55
Average number of shares outstanding – Basic (million) 2 412 2 437 -25
Basic earnings per share from continuing operations (USD) 1 1.72 2.10 -0.38
Basic earnings per share from discontinued operations (USD) 1 4.43 0.16 4.27
Total basic earnings per share (USD) 1 6.15 2.26 3.89
Average number of shares outstanding – Diluted (million) 2 448 2 476 -28
Diluted earnings per share from continuing operations (USD) 1 1.70 2.07 -0.37
Diluted earnings per share from discontinued operations (USD) 1 4.36 0.15 4.21
Total diluted earnings per share (USD) 1 6.06 2.22 3.84
1 Earnings per share (EPS) is calculated on the amount of net income attributable to shareholders of Novartis AG.

36/77
Consolidated statements of comprehensive income
Second quarter (unaudited) Q2 2015 Q2 2014 Change
USD m USD m USD m
Net income from continuing operations 1 856 2 723 -867
Other comprehensive income to be eventually recycled
into the consolidated income statement:
Fair value adjustments on financial instruments, net of taxes 130 38 92
Novartis share of other items recorded in comprehensive
income recognized by associated companies, net of taxes -3 -4 1
Translation effects 1 559 1 559
Total of items to eventually recycle 1 686 34 1 652
Other comprehensive income never to be recycled
into the consolidated income statement:
Net actuarial gains/(losses) from defined benefit plans, net
of taxes 580 -263 843
Amounts related to discontinued operations:
Net loss from discontinued operations -18 -138 120
Other comprehensive loss related to
discontinued operations -29 -17 -12
Comprehensive income 4 075 2 339 1 736
Attributable to:
Shareholders of Novartis AG 4 075 2 309 1 766
Non-controlling interests 0 30 -30
First half (unaudited) H1 2015 H1 2014 Change
USD m USD m USD m
Net income from continuing operations 4 162 5 177 -1 015
Other comprehensive income to be eventually recycled
into the consolidated income statement:
Fair value adjustments on financial instruments, net of taxes 76 7 69
Novartis share of other items recorded in comprehensive
income recognized by associated companies, net of taxes -79 42 -121
Translation effects 668 -23 691
Total of items to eventually recycle 665 26 639
Other comprehensive income never to be recycled
into the consolidated income statement:
Net actuarial gains/(losses) from defined benefit plans, net
of taxes 311 -808 1 119
Amounts related to discontinued operations:
Net income from discontinued operations 10 681 376 10 305
Other comprehensive loss related to
discontinued operations -26 -34 8
Comprehensive income 15 793 4 737 11 056
Attributable to:
Shareholders of Novartis AG 15 793 4 679 11 114
Non-controlling interests 0 58 -58

37/77
Condensed consolidated balance sheets June 30, Dec 31,
2015 2014
(unaudited) (audited) Change
USD m USD m USD m
Assets
Non-current assets
Property, plant & equipment 15 870 15 983 -113
Goodwill 31 334 29 311 2 023
Intangible assets other than goodwill 35 894 23 832 12 062
Financial and other non-current assets 27 569 18 700 8 869
Total non-current assets 110 667 87 826 22 841
Current assets
Inventories 6 614 6 093 521
Trade receivables 8 750 8 275 475
Other current assets 3 222 2 530 692
Cash and cash equivalents, marketable securities,
commodities and derivatives 5 875 13 862 -7 987
Assets related to discontinued operations and held for sale 285 6 801 -6 516
Total current assets 24 746 37 561 -12 815
Total assets 135 413 125 387 10 026
Equity and liabilities
Equity attributable to Novartis AG shareholders 78 764 70 766 7 998
Non-controlling interests 68 78 -10
Total equity 78 832 70 844 7 988
Non-current liabilities
Financial debts 13 301 13 799 -498
Other non-current liabilities 13 891 13 771 120
Total non-current liabilities 27 192 27 570 -378
Current liabilities
Trade payables 5 126 5 419 -293
Financial debts and derivatives 9 973 6 612 3 361
Other current liabilities 14 068 12 524 1 544
Liabilities related to discontinued operations and held for sale 222 2 418 -2 196
Total current liabilities 29 389 26 973 2 416
Total liabilities 56 581 54 543 2 038
Total equity and liabilities 135 413 125 387 10 026

38/77
Condensed consolidated changes in equity
Second quarter (unaudited) Q2 2015 Q2 2014 Change
USD m USD m USD m
Consolidated equity at April 1 76 444 70 336 6 108
Comprehensive income 4 075 2 339 1 736
Purchase of treasury shares -700 -1 867 1 167
Treasury share repurchase commitment under a
share buy-back trading plan -1 246 -600 -646
Increase in equity from exercise of options and
employee transactions 74 3 71
Equity-based compensation 185 332 -147
Change in non-controlling interests 0 -26 26
Consolidated equity at June 30 78 832 70 517 8 315
First half (unaudited) H1 2015 H1 2014 Change
USD m USD m USD m
Consolidated equity at January 1 70 844 74 472 -3 628
Comprehensive income 15 793 4 737 11 056
Purchase of treasury shares -2 133 -4 270 2 137
Treasury share repurchase commitment under a
share buy-back trading plan -1 211 -600 -611
Increase in equity from exercise of options and
employee transactions 1 582 2 396 -814
Dividends related to shareholders of Novartis AG -6 643 -6 810 167
Equity-based compensation 610 649 -39
Change in non-controlling interests -10 -57 47
Consolidated equity at June 30 78 832 70 517 8 315

39/77
Condensed consolidated cash flow statements
Second quarter (unaudited) Q2 2015 Q2 2014 Change
USD m USD m USD m
Net income from continuing operations 1 856 2 723 -867
Reversal of non-cash items
Taxes 300 424 -124
Depreciation, amortization and impairments 1 509 1 175 334
Change in provisions and other non-current liabilities 249 464 -215
Income from associated companies -121 -185 64
Net financial income 246 222 24
Other 114 108 6
Net income adjusted for non-cash items 4 153 4 931 -778
Interest and other financial receipts 59 -18 77
Interest and other financial payments -260 -230 -30
Taxes paid 1 -524 -544 20
Cash flows before working capital changes
from continuing operations 3 428 4 139 -711
Payments out of provisions and other
net cash movements in non-current liabilities -214 -309 95
Change in net current assets
and other operating cash flow items -259 -252 -7
Cash flows from operating activities
from continuing operations 2 955 3 578 -623
Cash flows used in operating activities
from discontinued operations 1 -45 -237 192
Total cash flows from operating activities 2 910 3 341 -431
Purchase of property, plant & equipment -566 -644 78
Purchase of intangible, financial
and other non-current assets -476 -318 -158
Proceeds from sales of property, plant & equipment,
intangible, financial and other non-current assets 151 77 74
Acquisitions of businesses -124 114 -238
Change in marketable securities, commodities
and net investments in associated companies -115 -6 -109
Cash flows used in investing activities
from continuing operations -1 130 -777 -353
Cash flows used in investing activities
from discontinued operations 1 -654 -301 -353
Total cash flows used in investing activities -1 784 -1 078 -706
Change in current and non-current financial debts -1 978 -743 -1 235
Treasury share transactions, net -624 -1 870 1 246
Other financing cash flows 152 -25 177
Cash flows used in financing activities -2 450 -2 638 188
Net translation effect on cash and cash equivalents 69 2 67
Change in cash and cash equivalents -1 255 -373 -882
Cash and cash equivalents at April 1 6 473 7 170 -697
Cash and cash equivalents at June 30 5 218 6 797 -1 579
1 The total payments for taxes in Q2 2015 amounted to USD 970 million (Q2 2014: USD 789 million) of which USD nil (Q2 2014: USD 15 million) was included in the cash flows used in operating activities of discontinued operations and USD 446 million (Q2 2014: USD 230 million) in cash flows used in investing activities of discontinued operations.

40/77
Condensed consolidated cash flow statements
First half (unaudited) H1 2015 H1 2014 Change
USD m USD m USD m
Net income from continuing operations 4 162 5 177 -1 015
Reversal of non-cash items
Taxes 672 807 -135
Depreciation, amortization and impairments 2 791 2 293 498
Change in provisions and other non-current liabilities 481 811 -330
Income from associated companies -136 -400 264
Net financial income 368 415 -47
Other 162 278 -116
Net income adjusted for non-cash items 8 500 9 381 -881
Interest and other financial receipts 965 561 404
Interest and other financial payments -388 -398 10
Taxes paid 1 -1 102 -1 226 124
Cash flows before working capital changes
from continuing operations 7 975 8 318 -343
Payments out of provisions and other
net cash movements in non-current liabilities -636 -480 -156
Change in net current assets
and other operating cash flow items -2 488 -2 582 94
Cash flows from operating activities
from continuing operations 4 851 5 256 -405
Cash flows used in operating activities
from discontinued operations 1 -237 -575 338
Total cash flows from operating activities 4 614 4 681 -67
Purchase of property, plant & equipment -1 035 -1 126 91
Purchase of intangible, financial
and other non-current assets -722 -444 -278
Proceeds from sales of property, plant & equipment,
intangible, financial and other non-current assets 435 159 276
Acquisitions of businesses -16 144 21 -16 165
Change in marketable securities, commodities
and net investments in associated companies -110 1 879 -1 989
Cash flows used in/from investing activities
from continuing operations -17 576 489 -18 065
Cash flows from investing activities
from discontinued operations 1 9 235 1 257 7 978
Total cash flows used in/from investing activities -8 341 1 746 -10 087
Dividends related to shareholders of Novartis AG -6 643 -6 810 167
Change in current and non-current financial debts 3 020 2 447 573
Treasury share transactions, net -542 -1 860 1 318
Other financing cash flows -40 -102 62
Cash flows used in financing activities -4 205 -6 325 2 120
Net translation effect on cash and cash equivalents 127 8 119
Change in cash and cash equivalents -7 805 110 -7 915
Cash and cash equivalents at January 1 13 023 6 687 6 336
Cash and cash equivalents at June 30 5 218 6 797 -1 579
1 The total payments for taxes in H1 2015 amounted to USD 1 616 million (H1 2014: USD 1 489 million) of which USD 1 million (H1 2014: USD 33 million) was included in the cash flows used in operating activities of discontinued operations and USD 513 million (H1 2014: USD 230 million) in cash flows from investing activities of discontinued operations.

41/77
Notes to the Condensed Interim Consolidated Financial Statements for the three- and six-month periods ended June 30, 2015 (unaudited)
1. Basis of preparation
These Condensed Interim Consolidated Financial Statements for the three- and six-month periods ended June 30, 2015, were prepared in accordance with International Accounting Standard 34 Interim Financial Reporting and accounting policies set out in the 2014 Annual Report published on January 27, 2015.
2. Selected critical accounting policies
The Group’s principal accounting policies are set out in note 1 to the Consolidated Financial Statements in the 2014 Annual Report and conform with International Financial Reporting Standards (IFRS) as issued by the International Accounting Standards Board. The presentation of financial statements requires management to make subjective and complex judgments that affect the reported amounts. Because of the inherent uncertainties, actual outcomes and results may differ from management’s assumptions and estimates.
In particular, during the first half of 2015, the significant transactions discussed below, were completed. Several of these transactions contained contingent consideration due to Novartis. Accounting for such contingent consideration requires management to make assumptions on the probability and amount of potential payments. If actual amounts are different from the estimated amounts recorded for contingent consideration there could be a significant impact, either positive or negative, on the Group’s results of operations or cash flow.
The significant transactions discussed below also included the formation of a new entity during the first quarter of 2015 via contribution of businesses from both Novartis and GlaxoSmithKline plc (GSK). Novartis has a 36.5% interest in this newly created entity and will account for its stake using the equity method of accounting. Novartis has valued the contribution of 63.5% of its former OTC Division to the entity in exchange for 36.5% of the GSK Consumer Healthcare Joint Venture at fair value. The resulting gain for Novartis is based on these exchanged values. Novartis has elected to apply an option under IFRS for entities formed by contributions. Under this option, the retained 36.5% interest of Novartis in its former OTC division continues to be measured at its net book value at the time of the formation of the entity.
Furthermore, as discussed in the 2014 Annual Report, goodwill, Alcon brand name and acquired In-Process Research & Development projects are reviewed for impairment at least annually and these, as well as all other investments in intangible assets, are reviewed for impairment whenever an event or decision occurs that raises concern about their balance sheet carrying value. The amount of goodwill and other intangible assets on the Group’s consolidated balance sheet has risen significantly in recent years, primarily from acquisitions. Impairment testing under IFRS may lead to potentially significant impairment charges in the future that could have a materially adverse impact on the Group’s results of operations or cash flow.
3. Significant transactions
2015
Transaction with Eli Lilly and CompanyOn January 1, 2015, Novartis closed its transaction with Eli Lilly and Company, USA (Lilly) announced in April 2014 to divest its Animal Health business. This resulted in a preliminary pre-tax gain of USD 4.6 billion which is recorded in operating income from discontinued operations.
Transactions with GlaxoSmithKline plcOn March 2, 2015, Novartis closed its transactions with GlaxoSmithKline plc, Great Britain (GSK) announced in April 2014, with the following consequences:

42/77
Pharmaceuticals – Acquisition of GSK oncology productsNovartis acquired GSK’s oncology products and certain related assets for an aggregate cash consideration of USD 16.0 billion. Up to USD 1.5 billion of this cash consideration is contingent on certain development milestones. The fair value of this potentially refundable consideration is estimated at approximately USD 0.1 billion. In addition, under the terms of the agreement, Novartis is granted a right of first negotiation over the co-development or commercialization of GSK’s current and future oncology R&D pipeline, excluding oncology vaccines. The right of first negotiation is for a period of 12.5 years from the acquisition closing date. The preliminary purchase price allocation resulted in net identified assets of USD 13.6 billion and goodwill of USD 2.3 billion.
Vaccines – DivestmentNovartis has divested its Vaccines business (excluding its influenza business) to GSK for up to USD 7.1 billion plus royalties. The USD 7.1 billion consists of USD 5.25 billion paid at closing and up to USD 1.8 billion in future milestone payments. The fair value of the contingent future milestones and royalties is estimated at approximately USD 1.0 billion. Included in this amount, is a USD 450 million milestone payment received in late March. This resulted in a preliminary pre-tax gain of approximately USD 2.8 billion which is recorded in operating income from discontinued operations.
Novartis’s Vaccines influenza business is excluded from the GSK Vaccines business acquisition. However, GSK has entered into a future option arrangement with Novartis in relation to the Vaccines influenza business, pursuant to which Novartis may unilaterally require GSK to acquire the entire or certain parts of its Vaccines influenza business for consideration of up to USD 250 million (the Influenza Put Option) if the divestment to CSL Limited, Australia (CSL), discussed below, is not completed. The option period is 18 months from the closing date of the GSK transaction. Novartis paid GSK a fee of USD 5 million in consideration for the grant of the Influenza Put Option.
Consumer Health – Combination of Novartis OTC with GSK Consumer Healthcare in a jointventureNovartis and GSK have agreed to create a combined consumer healthcare business through a joint venture between Novartis OTC and GSK Consumer Healthcare. On March 2, 2015, a new entity was formed via contribution of businesses from both Novartis and GSK. Novartis has a 36.5% interest in the newly created entity. Novartis has valued the contribution of 63.5% of its OTC Division in exchange for 36.5% of the GSK Consumer Healthcare business at fair value. Based on the preliminary estimates of values exchanged, an investment in associated company of USD 7.5 billion was recorded. The resulting pre-tax gain, net of transaction related costs, of approximately USD 5.9 billion is recorded in operating income from discontinued operations.
Novartis has four of eleven seats on the joint venture entity’s Board of Directors. Furthermore, Novartis has customary minority rights and also exit rights at a pre-defined, market based pricing mechanism.
The investment is accounted for using the equity method of accounting using estimated results for the quarter and adjusted to actual results in the following period.
Additional GSK related costsIn addition, the GSK transaction resulted in USD 0.5 billion of additional transaction-related expenses.
Pending transaction with CSLOn October 26, 2014 Novartis entered into an agreement with CSL to sell its Vaccines influenza business to CSL for USD 275 million. This transaction is expected to be completed in the second half of 2015, subject to closing conditions, including regulatory approvals. Entering into the separate divestment agreement with CSL resulted in the Vaccine influenza business being a separate disposal group consisting of a group of cash generating units within the Vaccines Division, requiring the performance of a separate valuation of the influenza Vaccines business net assets. This triggered the recognition of an exceptional impairment charge in 2014 of USD 1.1 billion as the book value of the influenza Vaccines business net assets was above the USD 275 million consideration to be paid by CSL.
Classification as continuing operations and discontinued operationsFollowing the announcement of the significant transactions described above, Novartis reported the Group’s financial statements for the current and prior year as “continuing” operations and “discontinued” operations.
43/77
Continuing operations comprise the activities of the Pharmaceuticals, Alcon, Sandoz divisions and the Corporate activities. Continuing operations also include the results from Oncology assets acquired from GSK and the estimated results from the 36.5% interest in the GSK/Novartis consumer healthcare joint venture for the period from March 2, 2015 to June 30, 2015.
Discontinued operations include the OTC Division and the Vaccines Division (excluding its influenza business) for January and February 2015 and the prior period results for January through June 2014. In 2015, the Animal Health Division includes only the gain from the divestment of the Division on January 1, 2015 whereas the prior period includes the results of operations for January through June 2014. The influenza Vaccines business is included for January through June in both the current and prior periods. The prior period results of Vaccines also includes a pre-tax gain of USD 0.9 billion from the USD 1.7 billion divestment of the blood transfusion diagnostics unit to Grifols S.A., completed on January 9, 2014. Excluded from discontinued operations are certain intellectual property rights and related other revenues of the Vaccines Division which are retained by Novartis and are now reported under Corporate activities as continuing operations. Also included in discontinued operations, under Corporate, are certain transaction related expenses.
As required by IFRS, results of the discontinued operations exclude any further depreciation and amortization related to discontinued operations from the date of the portfolio transformation announcement of April 22, 2014.
Pending transaction with Spinifex Pharmaceuticals, Inc.On June 29, 2015 Novartis entered into an agreement to acquire Spinifex Pharmaceuticals, Inc., an US and Australian-based, privately held development stage company, focused on developing a peripheral approach to treat neuropathic pain, for an upfront payment of USD 200 million and contingent consideration of up to USD 525 million upon achievement of specified development and commercialization milestones. The transaction is expected to close in H2 2015.
2014
Vaccines – Divestment of blood transfusion diagnostics unitOn January 9, 2014, Novartis completed the divestment of its blood transfusion diagnostics unit to the Spanish company Grifols S.A., for USD 1.7 billion in cash. The pre-tax gain on this transaction was approximately USD 0.9 billion and was recorded in operating income from discontinued operations.
Pharmaceuticals – Acquisition of CoStim Pharmaceuticals, IncOn February 17, 2014, Novartis acquired all of the outstanding shares of CoStim Pharmaceuticals, Inc., a Cambridge, Massachusetts, US-based, privately held biotechnology company focused on harnessing the immune system to eliminate immune-blocking signals from cancer, for a total purchase consideration of USD 248 million (excluding cash acquired). This amount consists of an initial cash payment and the net present value of contingent consideration of USD 153 million due to previous CoStim’s shareholders, which they are eligible to receive upon the achievement of specified development and commercialization milestones. The purchase price allocation resulted in net identified assets of USD 152 million (excluding cash acquired) and goodwill of USD 96 million.
Pharmaceuticals – Divestment of Idenix Pharmaceuticals, Inc. (Idenix) shareholdingOn August 5, 2014, Merck & Co., USA completed a tender offer for Idenix. As a result, Novartis divested its 22% shareholding in Idenix and realized a gain of approximately USD 0.8 billion which was recorded in income from associated companies.
Corporate – Divestment of LTS Lohmann Therapie-Systeme AG (LTS) shareholdingOn November 5, 2014, Novartis divested its 43% shareholding in LTS and realized a gain of approximately USD 0.4 billion which was recorded in income from associated companies.
Alcon – Acquisition of WaveTec Vision Systems, Inc. (WaveTec)On October 16, 2014, Alcon acquired all of the outstanding shares of WaveTec, a privately held company, for USD 350 million in cash. The purchase price allocation resulted in net identified assets of USD 180 million and goodwill of USD 170 million.

44/77
4. Summary of equity attributable to Novartis AG shareholders
Issued share capital and reserves Number of outstanding shares attributable to Novartis AG (in millions) shareholders H1 2015 H1 2014 Change
2015 2014 Change USD m USD m USD m
Balance at beginning of year 2 398.6 2 426.1 -27.5 70 766 74 343 -3 577
Shares acquired to be held
in Group Treasury -5.0 -34.1 29.1 -501 -2 882 2 381
Shares acquired to be cancelled -12.8 -12.4 -0.4 -1 286 -1 059 -227
Other share purchases -3.4 -3.9 0.5 -346 -329 -17
Increase in equity from exercise of
options and employee transactions 26.9 41.1 -14.2 1 582 2 396 -814
Equity-based compensation 10.9 9.4 1.5 610 649 -39
Treasury share repurchase commitment
under a share buy-back trading plan -1 211 -600 -611
Dividends -6 643 -6 810 167
Net income of the period attributable to
shareholders of Novartis AG 14 841 5 496 9 345
Other comprehensive income attributable
to shareholders of Novartis AG 952 -817 1 769
Consolidated equity at June 30 2 415.2 2 426.2 -11.0 78 764 70 387 8 377

45/77
5. Consolidated income statements – Segmentation
Second quarter Corporate Total Pharmaceuticals Alcon Sandoz (including eliminations) Group
Q2 2015 Q2 2014 Q2 2015 Q2 2014 Q2 2015 Q2 2014 Q2 2015 Q2 2014 Q2 2015 Q2 2014
USD m USD m USD m USD m USD m USD m USD m USD m USD m USD m
Net sales to third parties from continuing operations 7 847 8 199 2 559 2 817 2 288 2 331 12 694 13 347
Sales to continuing and discontinued segments 37 66 12 13 32 80 -81 -95 64
Net sales from continuing operations 7 884 8 265 2 571 2 830 2 320 2 411 -81 -95 12 694 13 411
Other revenues 171 151 8 6 6 3 17 378 202 538
Cost of goods sold -1 877 -1 778 -1 415 -1 305 -1 305 -1 404 110 109 -4 487 -4 378
Gross profit from continuing operations 6 178 6 638 1 164 1 531 1 021 1 010 46 392 8 409 9 571
Marketing & Sales -1 991 -2 117 -625 -626 -400 -445 -3 016 -3 188
Research & Development -1 782 -1 742 -240 -234 -184 -202 -2 206 -2 178
General & Administration -252 -240 -145 -152 -87 -94 -117 -152 -601 -638
Other income 172 204 18 16 17 20 150 -33 357 207
Other expense -339 -337 -22 -64 -174 -45 -127 -144 -662 -590
Operating income from continuing operations 1 986 2 406 150 471 193 244 -48 63 2 281 3 184
as % of net sales 25.3% 29.3% 5.9% 16.7% 8.4% 10.5% 18.0% 23.9%
Income from associated companies 1 2 120 183 121 185
Interest expense -164 -166
Other financial income and expense -82 -56
Income before taxes from continuing operations 2 156 3 147
Taxes -300 -424
Net income from continuing operations 1 856 2 723
Net loss from discontinued operations -18 -138
Net income 1 838 2 585

46/77
Consolidated income statements – Segmentation
First half Corporate Total Pharmaceuticals Alcon Sandoz (including eliminations) Group
H1 2015 H1 2014 H1 2015 H1 2014 H1 2015 H1 2014 H1 2015 H1 2014 H1 2015 H1 2014
USD m USD m USD m USD m USD m USD m USD m USD m USD m USD m
Net sales to third parties from continuing operations 14 987 16 006 5 117 5 459 4 525 4 649 24 629 26 114
Sales to continuing and discontinued segments 82 133 22 26 70 148 -148 -178 26 129
Net sales from continuing operations 15 069 16 139 5 139 5 485 4 595 4 797 -148 -178 24 655 26 243
Other revenues 378 296 15 14 12 6 38 421 443 737
Cost of goods sold -3 414 -3 354 -2 693 -2 598 -2 592 -2 776 232 220 -8 467 -8 508
Gross profit from continuing operations 12 033 13 081 2 461 2 901 2 015 2 027 122 463 16 631 18 472
Marketing & Sales -3 725 -4 078 -1 197 -1 223 -785 -875 -5 707 -6 176
Research & Development -3 436 -3 513 -458 -466 -379 -409 -4 273 -4 388
General & Administration -488 -493 -290 -313 -171 -188 -243 -293 -1 192 -1 287
Other income 425 301 40 29 31 45 275 68 771 443
Other expense -524 -671 -53 -77 -239 -74 -348 -243 -1 164 -1 065
Operating income from continuing operations 4 285 4 627 503 851 472 526 -194 -5 5 066 5 999
as % of net sales 28.6% 28.9% 9.8% 15.6% 10.4% 11.3% 20.6% 23.0%
Income from associated companies 1 1 135 399 136 400
Interest expense -343 -334
Other financial income and expense -25 -81
Income before taxes from continuing operations 4 834 5 984
Taxes -672 -807
Net income from continuing operations 4 162 5 177
Net income from discontinued operations 10 681 376
Net income 14 843 5 553

47/77
Discontinued operations – income statements
Q2 2015 Q2 2014 H1 2015 H1 2014
USD m USD m USD m USD m
Net sales to third parties of discontinued operations 39 1 290 587 2 545
Sales to continuing segments 23 17 38
Net sales of discontinued operations 39 1 313 604 2 583
Other revenues 3 16 21 34
Cost of goods sold -61 -622 -342 -1 295
Gross profit of discontinued operations -19 707 283 1 322
Marketing & Sales -8 -463 -240 -932
Research & Development -40 -208 -163 -430
General & Administration -5 -105 -56 -221
Other income 5 11 13 323 911
Other expense -29 -31 -621 -65
Operating loss/income of discontinued operations -96 -89 12 526 585
as % of net sales nm -6.9% nm 23.0%
Income from associated companies 2 3
Loss/income before taxes of discontinued operations -96 -87 12 526 588
Taxes 78 -51 -1 845 -212
Net loss/income of discontinued operations -18 -138 10 681 376
Discontinued operations – condensed balance sheet
June 30, Dec 31, 2015 2014
(unaudited) (audited)
USD m USD m
Assets
Property, plant & equipment 8 1 411
Goodwill and other intangible assets 2 462
Financial and other non-current assets 1 352
Inventories 154 1 155
Trade receivables and other current assets 122 1 421
Total assets related to discontinued operations and held for sale 285 6 801
Liabilities
Other non-current liabilities 7 706
Trade payables and other current liabilities 215 1 712
Total liabilities related to discontinued operations and held for sale 222 2 418

48/77
6. Financial instrumentsThe following table illustrates the three hierarchical levels for valuing financial instruments at fair value and also those measured at amortized cost or at cost as of June 30, 2015 and December 31, 2014. For additional information on the hierarchies and other matters, please refer to the Consolidated Financial Statements in the 2014 Annual Report, published on January 27, 2015.
Valued at amortized Level 1 Level 2 Level 3 cost or cost Total
June 30, Dec 31, June 30, Dec 31, June 30, Dec 31, June 30, Dec 31, June 30, Dec 31,
2015 2014 2015 2014 2015 2014 2015 2014 2015 2014
(unaudited) (audited) (unaudited) (audited) (unaudited) (audited) (unaudited) (audited) (unaudited) (audited)
USD m USD m USD m USD m USD m USD m USD m USD m USD m USD m
Debt securities 290 301 23 26 313 327
Equity securities 15 15 15 15
Fund investments 30 29 6 6 36 35
Total available-for-sale marketable securities 335 345 23 26 6 6 364 377
Time deposits with original maturity more than 90 days 130 6 130 6
Derivative financial instruments 65 356 65 356
Accrued interest on debt securities 2 3 2 3
Total marketable securities, time deposits and derivative financial instruments 335 345 88 382 6 6 132 9 561 742
Other current financial assets 75 75
Available-for-sale financial investments 729 605 355 332 1 084 937
Fund investments 86 71 86 71
Contingent consideration receivables 532 532
Long-term loans and receivables, advances, security deposits 673 712 673 712
Financial investments and long-term loans 729 605 973 403 673 712 2 375 1 720
Associated companies 60 66 211 168 271 234
Total associated companies at fair value through profit or loss 60 66 211 168 271 234
Contingent consideration payables -592 -756 -592 -756
Other financial liabilities -317 -317
Derivative financial instruments -59 -52 -59 -52
Total financial liabilities at fair value -59 -52 -909 -756 -968 -808
There are no significant transfers from one level to the other levels. Other than the addition of contingent consideration receivables and financial liabilities recorded in connection with the significant transactions disclosed in Note 3, there have been no significant transactions associated with level 3 financial instruments.
The fair value of straight bonds amounted to USD 15.0 billion at June 30, 2015 (USD 17.0 billion at December 31, 2014) compared to the balance sheet value of USD 14.4 billion (USD 16.0 billion at December 31, 2014). For all other financial assets and liabilities, the carrying amount is a reasonable approximation of the fair value. The carrying amount of financial assets included in the line financial investments and long-term loans amounted to USD 2.4 billion at June 30, 2015 (USD 1.7 billion at December 31, 2014).
The Group’s exposure to financial risks has not changed significantly during the period and there have been no major changes to the risk management department or in any risk management policies.

49/77
7. Legal proceedings update
A number of Novartis companies are, and will likely continue to be, subject to various legal proceedings, including litigations, arbitrations and governmental investigations, that arise from time to time. Legal proceedings are inherently unpredictable. As a result, the Group may become subject to substantial liabilities that may not be covered by insurance and may in the future incur judgments or enter into settlements of claims that could have a material adverse effect on its results of operations or cash flow. Note 20 to the consolidated financial statements contained in our annual report for the year ended December 31, 2014 contains a summary as of the date of that report of significant legal proceedings to which Novartis or its subsidiaries were a party. The following is a summary as of July 20, 2015 of potentially significant developments in those proceedings, as well as any new potentially significant proceedings commenced since the date of the last annual report.
Investigations and related litigationsSouthern District of New York (SDNY) specialty pharmacies investigation and litigationIn April 2013, the US government filed a civil complaint in intervention to a qui tam action against Novartis Pharmaceuticals Corporation (NPC) in the United States District Court (USDC) for the SDNY. The complaint, as subsequently amended, asserts federal False Claims Act and state law claims related to alleged unlawful contractual discounts and rebates to specialty pharmacies in connection with Myfortic, and alleged unlawful contractual discounts, rebates and patient referrals to specialty pharmacies in connection with Exjade. The US government alleges substantial damages, including treble damages and civil penalties of up to USD 11,000 per claim, which according to the government could exceed USD 2 billion. In January 2014, eleven states filed three complaints in intervention asserting similar claims related to Exjade; and the qui tam relator served on NPC an amended complaint also asserting similar claims with respect to Myfortic and Exjade, as well as claims involving Tasigna, Gleevec and TOBI that the federal and various state governments declined to pursue. The court has ordered that the claims relating to Exjade and Myfortic will be tried separately from (and before) the claims related to Gleevec, TOBI and Tasigna. The court has set a trial date of November 2, 2015 for the Myfortic and Exjade case and has ordered that the Gleevec, Tasigna and TOBI case be trial-ready by February 15, 2016. NPC vigorously contests all government and relator claims, both as to alleged liability and amount of damages and penalties.
Lucentis/Avastin® matters in Italy and FranceIn February 2015, Novartis appealed at the council of state the decision of the Tribunale amministrativo regionale (TAR) del Lazio. As previously reported, that decision upheld the fines imposed on Novartis AG (NAG), Novartis Farma S.p.A., and two Roche entities for alleged collusion to artificially differentiate Avastin® and Lucentis in order to avoid the erosion of the sales of Lucentis by off-label Avastin® with the aim of preserving the market position of Lucentis in Italy. Novartis’ appeal of a decision by the Italian Medicines Agency to include Avastin® in a list of drugs to be reimbursed off-label for age-related macular degeneration (AMD) is pending. In France, Novartis is appealing a decree which provided a legal basis for the adoption in June 2015 of a temporary recommendation of use and reimbursement of off-label Avastin® for neovascular AMD by hospital ophthalmologists. In both countries, Novartis believes that allowing the widespread off-label use and reimbursement of Avastin®, despite the presence of available licensed alternatives, would result in a breach of applicable regulations.
Japan investigationsAs previously disclosed, in July 2014, the Tokyo District Public Prosecutor Office indicted a former Novartis Pharma K.K. (NPKK) employee, and also NPKK under the dual liability concept in Japanese law, asserting two counts for alleged manipulation of data in sub-analysis publications of the Kyoto Heart Study regarding valsartan. The charges against NPKK are subject to a maximum total fine of JPY 4 million. Novartis is cooperating fully with the authorities.
In the course of a previously disclosed review by an External Investigation Committee into NPKK’s involvement in a nilotinib investigator initiated trial (IIT), the Japanese Ministry of Health, Labor and Welfare (MHLW), in February 2015, issued a business suspension order for failure to report adverse events, which required NPKK to halt manufacturing and sales in Japan for the period from March 5 to 19, 2015. The MHLW plans to issue new guidelines governing the conduct of IITs in Japan.

50/77
Product liability mattersZometa/Aredia product liability litigationNPC has been a defendant in more than 850 cases brought in US courts in which plaintiffs claim to have experienced osteonecrosis of the jaw or atypical femur fracture after treatment with Zometa or Aredia, which are used to treat patients whose cancer has spread to the bones. There are approximately 36 pending cases, of which 2 remain on appeal. The rest of the cases have been resolved through voluntary dismissals, pre-trial motion practice, trial, or settlements the payment of which is not material to Novartis. The pending cases are being vigorously defended.
Other mattersAverage Wholesale Price (AWP) litigationIn the previously disclosed AWP litigations brought by various US state governmental entities against various pharmaceutical companies, including certain Sandoz entities and NPC, NPC reached a settlement in the first quarter of 2015 of the Wisconsin claims against it for an amount that is not material to Novartis. Actions brought by the states of Illinois, Mississippi, Utah and Wisconsin remain pending against Novartis companies. NPC is also a defendant in a putative class action brought by private payors in New Jersey. The cases are being vigorously defended.
Xolair qui tam actionBy order from the USDC for the District of Massachusetts (D. Mass.), dated March 17, 2015, all claims in connection with alleged improper marketing practices involving Xolair asserted by the relators, as previously reported, were dismissed with prejudice, and all claims asserted in the name of the federal and various state governments were dismissed without prejudice. On April 16, 2015, relators filed a notice of appeal.
Oriel litigationIn March 2015, the Supreme Court-New York County granted a motion to dismiss all but one claim in a previously disclosed complaint filed in October 2013 against Sandoz Inc., two affiliates and two former officers of Sandoz AG. The dismissal has become final. A breach of contract claim against Sandoz Inc. remains. Sandoz Inc. continues to vigorously defend the matter.
Antitrust class actions – GeneralSince March 2015, more than 50 putative class action complaints have been filed in several courts across the United States naming contact-lens manufacturers, including Alcon Laboratories, Inc. (ALI), and alleging violations of federal antitrust law as well as antitrust, consumer protection and unfair competition laws of various states in connection with the sale of contact lenses. The cases have been consolidated in the Middle District of Florida by the Judicial Panel on Multidistrict Litigation and are being vigorously defended.
In June 2015, the United Food and Commercial Workers Unions and Employers Midwest Health Benefits Fund and Laborers Health and Welfare Trust Fund for Northern California brought suit in the USDC for D. Mass. against NPC, Novartis Corporation (NC) and NAG on behalf of themselves and a proposed class of all purchasers, including end-payors, for Gleevec. The complaint asserts violations of federal antitrust law and seeks a permanent injunction barring Novartis from enforcing a previously reported 2014 agreement under which Sun Pharmaceuticals agreed not to launch a generic version of Gleevec, until February 1, 2016. The case is being vigorously defended.
Employment actionIn March 2015, ALI and NC were sued in an individual and collective opt-in class action complaint, filed in the Southern District of New York. The claims assert gender discrimination and retaliation at Alcon and together seek awards in excess of USD 110 million. The case is being vigorously defended.
Intellectual PropertyNovartis companies are involved in legal proceedings concerning intellectual property rights owned either by Novartis companies or third parties. The inherent unpredictability of such proceedings means that there can be no assurances as to their ultimate outcome. A negative result in any such proceeding could potentially adversely affect the ability of certain Novartis companies to sell their products or require the payment of substantial damages or royalties.

51/77
In addition to the matters described above, there have been other developments in the other legal matters described in Note 20 to the consolidated financial statements contained in our annual report for the year ended December 31, 2014. These do not significantly affect the assessment of management concerning the adequacy of the total provisions recorded for legal proceedings.

52/77
SUPPLEMENTARY INFORMATION (unaudited)
Non-IFRS disclosures
Core results
The Group’s core results – including core operating income, core net income and core earnings per share – exclude the amortization of intangible assets, impairment charges, expenses relating to the integration of acquisitions and restructuring charges that exceed a threshold of USD 25 million, as well as income and expense items that management deems exceptional and that are or are expected to accumulate within the year to be, over a USD 25 million threshold.
Novartis believes that investor understanding of the Group’s performance is enhanced by disclosing core measures of performance because, since they exclude items which can vary significantly from year to year, the core measures enable better comparison of business performance across years. For this same reason, Novartis uses these core measures in addition to IFRS and other measures as important factors in assessing the Group’s performance.
The following are examples of how these core measures are utilized:
• InadditiontomonthlyreportscontainingfinancialinformationpreparedunderInternationalFinancial Reporting Standards (IFRS), senior management receives a monthly analysis incorporating these core measures.
• AnnualbudgetsarepreparedforbothIFRSandcoremeasures.
Despite the use of these measures by management in setting goals and measuring the Group’s performance, these are non-IFRS measures that have no standardized meaning prescribed by IFRS. As a result, such measures have limits in usefulness to investors.
Because of their non-standardized definitions, the core measures (unlike IFRS measures) may not be comparable to the calculation of similar measures of other companies. These core measures are presented solely to permit investors to more fully understand how the Group’s management assesses underlying performance. These core measures are not, and should not be viewed as, a substitute for IFRS measures.
As an internal measure of Group performance, these core measures have limitations, and the Group’s performance management process is not solely restricted to these metrics. A limitation of the core measures is that they provide a view of the Group’s operations without including all events during a period, such as the effects of an acquisition or amortization of purchased intangible assets.
Constant currencies
Changes in the relative values of non-US currencies to the US dollar can affect the Group’s financial results and financial position. To provide additional information that may be useful to investors, including changes in sales volume, we present information about our net sales and various values relating to operating and net income that are adjusted for such foreign currency effects.
Constant currency calculations have the goal of eliminating two exchange rate effects so that an estimate can be made of underlying changes in the consolidated income statement excluding the impact of fluctuations in exchanges rates:
• theimpactoftranslatingtheincomestatementsofconsolidatedentitiesfromtheirnon-USDfunctional currencies to USD; and
• theimpactofexchangeratemovementsonthemajortransactionsofconsolidatedentitiesperformed in currencies other than their functional currency.
We calculate constant currency measures by translating the current year’s foreign currency values for sales and other income statement items into USD using the average exchange rates from the prior year and comparing them to the prior year values in USD.

53/77
We use these constant currency measures in evaluating the Group’s performance, since they may assist us in evaluating our ongoing performance from year to year. However, in performing our evaluation, we also consider equivalent measures of performance which are not affected by changes in the relative value of currencies.
Growth rate calculation
For ease of understanding, Novartis uses a sign convention for its growth rates such that a reduction in operating expenses or losses compared to the prior year is shown as a positive growth.
Net debt and free cash flow
Net debt and free cash flow are non-IFRS financial measures, which means they should not be interpreted as measures determined under IFRS. Net debt is presented as additional information because management believes it is a useful supplemental indicator of the Group’s ability to pay dividends, to meet financial commitments and to invest in new strategic opportunities, including strengthening its balance sheet. Free cash flow is presented as additional information because management believes it is a useful supplemental indicator of the Group’s ability to operate without reliance on additional borrowing or use of existing cash. Free cash flow is a measure of the net cash generated that is available for debt repayment, investment in strategic opportunities and for returning to shareholders. Novartis uses free cash flow in internal comparisons of results from the Group’s divisions. Free cash flow of the divisions uses the same definition as for the Group. No tax or financial receipts or payments are included in the division calculations. The definition of free cash flow used by Novartis does not include amounts related to changes in investments in associated companies nor related to acquisitions or divestments of subsidiaries. Free cash flow is not intended to be a substitute measure for cash flow from operating activities as determined under IFRS.

54/77
CORE RESULTS – Reconciliation from IFRS results to core results – Group – Second quarter Total Pharmaceuticals Alcon Sandoz Corporate Group
Q2 2015 Q2 2014 Q2 2015 Q2 2014 Q2 2015 Q2 2014 Q2 2015 Q2 2014 Q2 2015 Q2 2014
USD m USD m USD m USD m USD m USD m USD m USD m USD m USD m
IFRS Operating income from continuing operations 1 986 2 406 150 471 193 244 -48 63 2 281 3 184
Amortization of intangible assets 384 71 519 515 88 104 1 991 691
Impairments
Intangible assets 11 27 119 2 130 29
Property, plant & equipment related to the
Group-wide rationalization of manufacturing sites 1 83 83 1
Other property, plant & equipment 6 1 -1 -1 -25 -50 22 -70 22
Financial assets 3 12 6 11 9 23
Total impairment charges 20 41 118 1 58 -44 33 152 75
Acquisition or divestment related items
- Income -6 3 -82 -88 3
- Expense 75 79 154
Total acquisition or divestment
related items, net 69 3 -3 66 3
Other exceptional items
Exceptional divestment gains -29 -22 -29 -22
Restructuring items
- Income -5 -14 -4 -9 -3 -9 -26
- Expense 128 79 7 40 87 6 12 234 125
Legal-related items
- Expense 125 125
Additional exceptional income -87 -96 -3 -3 -32 -242 -125 -338
Additional exceptional expense 11 3 9 10 12 29 32 42
Total other exceptional items 18 75 9 41 84 3 -8 -213 103 -94
Total adjustments 491 187 646 560 230 107 -55 -179 1 312 675
Core operating income from continuing operations 2 477 2 593 796 1 031 423 351 -103 -116 3 593 3 859
as % of net sales 31.6% 31.6% 31.1% 36.6% 18.5% 15.1% 28.3% 28.9%
Income from associated companies 1 2 120 183 121 185
Core adjustments to income from associated
companies, net of tax 116 51 116 51
Interest expense -164 -166
Other financial income and expense -63 -56
Taxes (adjusted for above items) -529 -538
Core net income from continuing operations 3 074 3 335
Core net loss from discontinued operations 1 -59 -52
Core net income 3 015 3 283
Core net income attributable to shareholders of Novartis AG 3 013 3 253
Core EPS from continuing operations (USD) 2 1.27 1.36
Core EPS from discontinued operations (USD) 2 -0.02 -0.02
Core EPS (USD) 2 1.25 1.34
1 For details on discontinued operations reconciliation from IFRS to core net income, please refer to page 65.2 Earnings per share (EPS) is calculated on the amount of net income attributable to shareholders of Novartis AG.

55/77
CORE RESULTS – Reconciliation from IFRS results to core results – Group – First half Total Pharmaceuticals Alcon Sandoz Corporate Group
H1 2015 H1 2014 H1 2015 H1 2014 H1 2015 H1 2014 H1 2015 H1 2014 H1 2015 H1 2014
USD m USD m USD m USD m USD m USD m USD m USD m USD m USD m
IFRS Operating income from continuing operations 4 285 4 627 503 851 472 526 -194 -5 5 066 5 999
Amortization of intangible assets 552 140 1 037 1 026 178 206 2 1 767 1 374
Impairments
Intangible assets 13 30 119 2 132 32
Property, plant & equipment related to the
Group-wide rationalization of manufacturing sites 1 12 83 84 12
Other property, plant & equipment 7 1 -1 1 2 6 22 14 24
Financial assets 15 13 25 14 40 27
Total impairment charges 36 56 119 1 84 2 31 36 270 95
Acquisition or divestment related items
- Income -7 -108 -115
- Expense 117 96 213
Total acquisition or divestment
related items, net 110 -12 98
Other exceptional items
Exceptional divestment gains -164 -35 -164 -35
Restructuring items
- Income -6 -17 -4 -9 -3 -10 -29
- Expense 179 334 24 54 98 7 13 314 395
Legal-related items
- Income
- Expense 125 125
Additional exceptional income -119 -101 -5 -3 -32 -242 -159 -343
Additional exceptional expense 24 3 16 33 22 42 62 78
Total other exceptional items -86 309 31 78 95 4 3 -200 43 191
Total adjustments 612 505 1 187 1 105 357 212 22 -162 2 178 1 660
Core operating income from continuing operations 4 897 5 132 1 690 1 956 829 738 -172 -167 7 244 7 659
as % of net sales 32.7% 32.1% 33.0% 35.8% 18.3% 15.9% 29.4% 29.3%
Income from associated companies 1 1 135 399 136 400
Core adjustments to income from associated
companies, net of tax 322 128 322 128
Interest expense -343 -334
Other financial income and expense -6 -81
Taxes (adjusted for above items) -1 080 -1 104
Core net income from continuing operations 6 273 6 668
Core net loss from discontinued operations 1 -142 -173
Core net income 6 131 6 495
Core net income attributable to shareholders of Novartis AG 6 129 6 438
Core EPS from continuing operations (USD) 2 2.60 2.71
Core EPS from discontinued operations (USD) 2 -0.06 -0.07
Core EPS (USD) 2 2.54 2.64
1 For details on discontinued operations reconciliation from IFRS to core net income, please refer to page 66.2 Earnings per share (EPS) is calculated on the amount of net income attributable to shareholders of Novartis AG.

56/77
CORE RESULTS – Reconciliation from IFRS results to core results – Group – Second quarter
Acquisition or
divestment related
items, including
restructuring Other
Q2 2015 Amortization of and integration exceptional Q2 2015 Q2 2014
IFRS results intangible assets 1 Impairments 2 charges 3 items 4 Core results Core results
USD millions USD millions USD millions USD millions USD millions USD millions USD millions
Gross profit from continuing operations 8 409 979 119 31 9 538 9 982
Operating income
from continuing operations 2 281 991 152 66 103 3 593 3 859
Income before taxes
from continuing operations 2 156 1 054 152 66 175 3 603 3 873
Taxes from continuing operations 5 -300 -529 -538
Net income from continuing operations 1 856 3 074 3 335
Net loss from discontinued operations 6 -18 -59 -52
Net income 1 838 3 015 3 283
EPS from continuing operations (USD) 7 0.77 1.27 1.36
EPS from discontinued operations (USD) 7 -0.01 -0.02 -0.02
EPS (USD) 7 0.76 1.25 1.34
The following are adjustments to arrive at Core Gross Profit from continuing operations
Cost of goods sold -4 487 979 119 31 -3 358 -3 665
The following are adjustments to arrive at Core Operating Income from continuing operations
Marketing & Sales -3 016 5 -3 011 -3 185
Research & Development -2 206 12 11 20 -2 163 -2 124
General & Administration -601 16 -585 -631
Other income 357 -1 -88 -163 105 122
Other expense -662 23 154 194 -291 -305
The following are adjustments to arrive at Core Income before taxes from continuing operations
Income from associated companies 121 63 53 237 236
Other financial income and expense -82 19 -63 -56
1 Amortization of intangible assets: Cost of goods sold includes recurring amortization of acquired rights to in-market products and other production-related intangible assets; Research & Development includes the recurring amortization of acquired rights for technology platforms; Income from associated companies includes USD 63 million for the Novartis share of the estimated Roche core items.
2 Impairments: Cost of goods sold, Research & Development, Other income and Other expense consist principally of net impairment charges or reversals related to intangible assets, property, plant and equipment, and financial assets.
3 Acquisition or divestment related items, including restructuring and integration charges: Other income and Other expense include items related to the portfolio transformation.4 Other exceptional items: Cost of goods sold and Other expense include charges for the Group-wide rationalization of manufacturing sites; Marketing & Sales, Research & Development and Other expense include
other restructuring charges; General & Administration includes charges for transforming IT and finance processes; Other income includes a gain of USD 111 million from a Swiss pension plan amendment and additional gains from product divestments; Other expense includes other restructuring provision charges; Income from associated companies includes USD 53 million for the Novartis share of the estimated OTC joint venture core items; Other financial income and expense includes an adjustment related to Venezuela Hyperinflation.
5 Taxes on the adjustments between IFRS and core results take into account, for each individual item included in the adjustment, the tax rate that will finally be applicable to the item based on the jurisdiction where the adjustment will finally have a tax impact. Generally, this results in amortization and impairment of intangible assets and acquisition-related restructuring and integration items having a full tax impact. There is usually a tax impact on exceptional items although this is not the case for items arising from criminal settlements in certain jurisdictions. Adjustments related to income from associated companies are recorded net of any related tax effect. Due to these factors and the differing effective tax rates in the various jurisdictions, the tax on the total adjustments for continuing operations of USD 1.4 billion to arrive at the core results before tax amounts to USD 229 million. The average tax rate on the adjustments for continuing operations is 15.8% since the estimated full year tax charge has been applied to the pre-tax income of the period.
6 For details on discontinued operations reconciliation from IFRS to core net income, please refer to page 65.7 Earnings per share (EPS) is calculated on the amount of net income attributable to shareholders of Novartis AG.

57/77
CORE RESULTS – Reconciliation from IFRS results to core results – Group – First half
Acquisition or
divestment related
items, including
restructuring Other
H1 2015 Amortization of and integration exceptional H1 2015 H1 2014
IFRS results intangible assets 1 Impairments 2 charges 3 items 4 Core results Core results
USD millions USD millions USD millions USD millions USD millions USD millions USD millions
Gross profit from continuing operations 16 631 1 745 119 33 18 528 19 599
Operating income
from continuing operations 5 066 1 767 270 98 43 7 244 7 659
Income before taxes
from continuing operations 4 834 2 014 270 98 137 7 353 7 772
Taxes from continuing operations 5 -672 -1 080 -1 104
Net income from continuing operations 4 162 6 273 6 668
Net income/loss from discontinued operations 6 10 681 -142 -173
Net income 14 843 6 131 6 495
EPS from continuing operations (USD) 7 1.72 2.60 2.71
EPS from discontinued operations (USD) 7 4.43 -0.06 -0.07
EPS (USD) 7 6.15 2.54 2.64
The following are adjustments to arrive at Core Gross Profit from continuing operations
Other revenues 443 -28 415 435
Cost of goods sold -8 467 1 745 119 61 -6 542 -7 079
The following are adjustments to arrive at Core Operating Income from continuing operations
Marketing & Sales -5 707 5 -5 702 -6 167
Research & Development -4 273 22 13 31 -4 207 -4 304
General & Administration -1 192 30 -1 162 -1 263
Other income 771 -115 -305 351 335
Other expense -1 164 138 213 249 -564 -541
The following are adjustments to arrive at Core Income before taxes from continuing operations
Income from associated companies 136 247 75 458 528
Other financial income and expense -25 19 -6 -81
1 Amortization of intangible assets: Cost of goods sold includes recurring amortization of acquired rights to in-market products and other production-related intangible assets; Research & Development includes the recurring amortization of acquired rights for technology platforms; Income from associated companies includes USD 247 million for the Novartis share of the estimated Roche core items.
2 Impairments: Cost of goods sold, Research & Development and Other expense consist principally of net impairment charges or reversals related to intangible assets, property, plant and equipment, and financial assets.
3 Acquisition or divestment related items, including restructuring and integration charges: Other income and Other expense include items related to the portfolio transformation.4 Other exceptional items: Other revenues and Other income include additional gains from product divestments; Cost of goods sold and Other expense include charges for the Group-wide rationalization of
manufacturing sites; Marketing & Sales, Research & Development and Other expense include other restructuring charges; General & Administration includes charges for transforming IT and finance processes; Other income includes a gain of USD 111 million from a Swiss pension plan amendment; Income from associated companies includes USD 75 million for the Novartis share of the estimated OTC joint venture core items; Other financial income and expense includes an adjustment related to Venezuela Hyperinflation.
5 Taxes on the adjustments between IFRS and core results take into account, for each individual item included in the adjustment, the tax rate that will finally be applicable to the item based on the jurisdiction where the adjustment will finally have a tax impact. Generally, this results in amortization and impairment of intangible assets and acquisition-related restructuring and integration items having a full tax impact. There is usually a tax impact on exceptional items although this is not the case for items arising from criminal settlements in certain jurisdictions. Adjustments related to income from associated companies are recorded net of any related tax effect. Due to these factors and the differing effective tax rates in the various jurisdictions, the tax on the total adjustments for continuing operations of USD 2.5 billion to arrive at the core results before tax amounts to USD 408 million. The average tax rate on the adjustments for continuing operations is 16.2% since the estimated full year tax charge has been applied to the pre-tax income of the period.
6 For details on discontinued operations reconciliation from IFRS to core net income, please refer to page 66.7 Earnings per share (EPS) is calculated on the amount of net income attributable to shareholders of Novartis AG.

58/77
CORE RESULTS – Reconciliation from IFRS results to core results – Pharmaceuticals – Second quarter
Acquisition or
divestment related
items, including
restructuring Other
Q2 2015 Amortization of and integration exceptional Q2 2015 Q2 2014
IFRS results intangible assets 1 Impairments 2 charges 3 items 4 Core results Core results
USD millions USD millions USD millions USD millions USD millions USD millions USD millions
Gross profit 6 178 376 28 6 582 6 725
Operating income 1 986 384 20 69 18 2 477 2 593
The following are adjustments to arrive at Core Gross Profit
Cost of goods sold -1 877 376 28 -1 473 -1 691
The following are adjustments to arrive at Core Operating Income
Marketing & Sales -1 991 5 -1 986 -2 117
Research & Development -1 782 8 11 20 -1 743 -1 693
Other income 172 -6 -120 46 72
Other expense -339 9 75 85 -170 -154
1 Amortization of intangible assets: Cost of goods sold includes recurring amortization of acquired rights to in-market products and other production-related intangible assets; Research & Development includes the recurring amortization of acquired rights for technology platforms.
2 Impairments: Research & Development includes impairment charges for in process projects and termination of collaboration and license agreements; Other expense includes impairment charges related to property, plant and equipment and financial assets.
3 Acquisition or divestment related items, including restructuring and integration charges: Other income and Other expense include income and costs related to the acquisition of GSK oncology assets.4 Other exceptional items: Cost of goods sold and Other expense include net restructuring charges related to the Group-wide rationalization of manufacturing sites; Marketing & Sales, Research & Development and
Other expense include other restructuring charges; Research & Development also includes expenses related to product acquisitions; Other income includes a gain from a Swiss pension plan amendment and additional gains from product divestments.

59/77
CORE RESULTS – Reconciliation from IFRS results to core results – Pharmaceuticals – First half
Acquisition or
divestment related
items, including
restructuring Other
H1 2015 Amortization of and integration exceptional H1 2015 H1 2014
IFRS results intangible assets 1 Impairments 2 charges 3 items 4 Core results Core results
USD millions USD millions USD millions USD millions USD millions USD millions USD millions
Gross profit 12 033 538 28 12 599 13 260
Operating income 4 285 552 36 110 -86 4 897 5 132
The following are adjustments to arrive at Core Gross Profit
Other revenues 378 -28 350 296
Cost of goods sold -3 414 538 56 -2 820 -3 175
The following are adjustments to arrive at Core Operating Income
Marketing & Sales -3 725 5 -3 720 -4 078
Research & Development -3 436 14 13 31 -3 378 -3 435
Other income 425 -7 -260 158 150
Other expense -524 23 117 110 -274 -272
1 Amortization of intangible assets: Cost of goods sold includes recurring amortization of acquired rights to in-market products and other production-related intangible assets; Research & Development includes the recurring amortization of acquired rights for technology platforms.
2 Impairments: Research & Development includes impairment charges for in process projects and termination of collaboration and license agreements; Other expense includes impairment charges related to property, plant and equipment, and financial assets.
3 Acquisition or divestment related items, including restructuring and integration charges: Other income and Other expense include income and costs related to the acquisition of GSK oncology assets.4 Other exceptional items: Other revenues and Other income include additional gains from product divestments; Cost of goods sold and Other expense include net restructuring charges related to the Group-wide
rationalization of manufacturing sites; Marketing & Sales, Research & Development and Other expense include other restructuring charges; Research & Development also includes expenses related to product acquisitions; Other income includes a gain from a Swiss pension plan amendment.

60/77
CORE RESULTS – Reconciliation from IFRS results to core results – Alcon – Second quarter
Acquisition or
divestment related
items, including
restructuring Other
Q2 2015 Amortization of and integration exceptional Q2 2015 Q2 2014
IFRS results intangible assets 1 Impairments 2 charges items 3 Core results Core results
USD millions USD millions USD millions USD millions USD millions USD millions USD millions
Gross profit 1 164 515 119 1 1 799 2 053
Operating income 150 519 118 9 796 1 031
The following are adjustments to arrive at Core Gross Profit
Cost of goods sold -1 415 515 119 1 -780 -783
The following are adjustments to arrive at Core Operating Income
Research & Development -240 4 -236 -231
General & Administration -145 9 -136 -145
Other income 18 -1 -7 10 6
Other expense -22 6 -16 -29
1 Amortization of intangible assets: Cost of goods sold includes recurring amortization of acquired rights to in-market products and other production-related intangible assets; Research & Development includes the recurring amortization of acquired rights for technology platforms.
2 Impairments: Cost of goods sold includes impairment charges related to intangible assets; Other income includes a reversal of impairment charges related to property, plant and equipment.3 Other exceptional items: Cost of goods sold includes net restructuring charges related to the Group-wide rationalization of manufacturing sites; General & Administration includes charges for transforming IT and
finance processes; Other income includes a gain from a Swiss pension plan amendment and a reversal of restructuring charges; Other expense includes other restructuring charges.

61/77
CORE RESULTS – Reconciliation from IFRS results to core results – Alcon – First half
Acquisition or
divestment related
items, including
restructuring Other
H1 2015 Amortization of and integration exceptional H1 2015 H1 2014
IFRS results intangible assets 1 Impairments 2 charges items 3 Core results Core results
USD millions USD millions USD millions USD millions USD millions USD millions USD millions
Gross profit 2 461 1 029 119 1 3 610 3 944
Operating income 503 1 037 119 31 1 690 1 956
The following are adjustments to arrive at Core Gross Profit
Cost of goods sold -2 693 1 029 119 1 -1 544 -1 555
The following are adjustments to arrive at Core Operating Income
Research & Development -458 8 -450 -462
General & Administration -290 16 -274 -289
Other income 40 -9 31 16
Other expense -53 23 -30 -39
1 Amortization of intangible assets: Cost of goods sold includes recurring amortization of acquired rights to in-market products and other production-related intangible assets; Research & Development includes the recurring amortization of acquired rights for technology platforms.
2 Impairments: Cost of goods sold includes impairment charges related to intangible assets.3 Other exceptional items: Cost of goods sold includes net restructuring charges related to the Group-wide rationalization of manufacturing sites; General & Administration includes charges for transforming IT and
finance processes; Other income includes a gain from a Swiss pension plan amendment and a reversal of restructuring charges; Other expense includes other restructuring charges.

62/77
CORE RESULTS – Reconciliation from IFRS results to core results – Sandoz – Second quarter
Acquisition or
divestment related
items, including
restructuring Other
Q2 2015 Amortization of and integration exceptional Q2 2015 Q2 2014
IFRS results intangible assets 1 Impairments 2 charges items 3 Core results Core results
USD millions USD millions USD millions USD millions USD millions USD millions USD millions
Gross profit 1 021 88 2 1 111 1 114
Operating income 193 88 58 84 423 351
The following are adjustments to arrive at Core Gross Profit
Cost of goods sold -1 305 88 2 -1 215 -1 300
The following are adjustments to arrive at Core Operating Income
Other income 17 -3 14 17
Other expense -174 58 85 -31 -41
1 Amortization of intangible assets: Cost of goods sold includes recurring amortization of acquired rights to in-market products and other production-related intangible assets.2 Impairments: Other expense includes impairment charges related to property, plant and equipment.3 Other exceptional items: Cost of goods sold and Other expense include net restructuring charges related to the Group-wide rationalization of manufacturing sites; Other income includes a gain from a Swiss pension
plan amendment.

63/77
CORE RESULTS – Reconciliation from IFRS results to core results – Sandoz – First half
Acquisition or
divestment related
items, including
restructuring Other
H1 2015 Amortization of and integration exceptional H1 2015 H1 2014
IFRS results intangible assets 1 Impairments 2 charges items 3 Core results Core results
USD millions USD millions USD millions USD millions USD millions USD millions USD millions
Gross profit 2 015 178 4 2 197 2 234
Operating income 472 178 84 95 829 738
The following are adjustments to arrive at Core Gross Profit
Cost of goods sold -2 592 178 4 -2 410 -2 569
The following are adjustments to arrive at Core Operating Income
Other income 31 -3 28 41
Other expense -239 84 94 -61 -67
1 Amortization of intangible assets: Cost of goods sold includes recurring amortization of acquired rights to in-market products and other production-related intangible assets.2 Impairments: Other expense includes impairment charges related to property, plant and equipment.3 Other exceptional items: Cost of goods sold and Other expense include net restructuring charges related to the Group-wide rationalization of manufacturing sites; Other income includes a gain from a Swiss pension
plan amendment.

64/77
CORE RESULTS – Reconciliation from IFRS results to core results – Corporate – Second quarter
Acquisition or
divestment related
items, including
restructuring Other
Q2 2015 Amortization of and integration exceptional Q2 2015 Q2 2014
IFRS results intangible assets Impairments 1 charges 2 items 3 Core results Core results
USD millions USD millions USD millions USD millions USD millions USD millions USD millions
Gross profit 46 46 90
Operating loss -48 -44 -3 -8 -103 -116
The following are adjustments to arrive at Core Operating Loss
General & Administration -117 7 -110 -152
Other income 150 -82 -33 35 27
Other expense -127 -44 79 18 -74 -81
1 Impairments: Other expense includes impairment charges related to property, plant and equipment and financial assets.2 Acquisition or divestment related items, including restructuring and integration charges: Other income and Other expense include items related to the portfolio transformation.3 Other exceptional items: General & Administration includes expenses related to setup costs for Novartis Business Services; Other income includes a gain from a Swiss pension plan amendment and items related to
portfolio transformation. Other expense includes charges for transforming IT and finance processes.
CORE RESULTS – Reconciliation from IFRS results to core results – Corporate – First half
Acquisition or
divestment related
items, including
restructuring Other
H1 2015 Amortization of and integration exceptional H1 2015 H1 2014
IFRS results intangible assets Impairments 1 charges 2 items 3 Core results Core results
USD millions USD millions USD millions USD millions USD millions USD millions USD millions
Gross profit 122 122 161
Operating loss -194 31 -12 3 -172 -167
The following are adjustments to arrive at Core Operating Loss
General & Administration -243 14 -229 -293
Other income 275 -108 -33 134 128
Other expense -348 31 96 22 -199 -163
1 Impairments: Other expense includes impairment charges related to property, plant and equipment and financial assets.2 Acquisition or divestment related items, including restructuring and integration charges: Other income and Other expense include items related to the portfolio transformation.3 Other exceptional items: General & Administration includes expenses related to setup costs for Novartis Business Services; Other income includes a gain from a Swiss pension plan amendment and items related to
portfolio transformation. Other expense includes charges for transforming IT and finance processes.

65/77
CORE RESULTS – Reconciliation from IFRS results to core results – Discontinued operations – Second quarter
Acquisition or
divestment related
items, including
restructuring Other
Q2 2015 Amortization of and integration exceptional Q2 2015 Q2 2014
IFRS results intangible assets Impairments 1 charges 2 items 3 Core results Core results
USD millions USD millions USD millions USD millions USD millions USD millions USD millions
Gross profit -19 2 -17 726
Operating loss -96 9 14 1 -72 -62
Loss before taxes -96 9 14 1 -72 -60
Taxes 4 78 13 8
Net loss -18 -59 -52
EPS (USD) 5 -0.01 -0.02 -0.02
The following are adjustments to arrive at Core Gross Profit
Cost of goods sold -61 2 -59 -603
The following are adjustments to arrive at Core Operating Loss
Other income 5 -3 2 8
Other expense -29 9 17 -1 -4 -22
1 Impairments: Other expense includes impairment charge as a result of the proposed sale of the influenza Vaccines business.2 Acquisition or divestment related items, including restructuring and integration charges: Other income and Other expense include items related to the portfolio transformation.3 Other exceptional items: Cost of goods sold and Other expense include restructuring charges, including those related to the Group-wide rationalization of manufacturing sites.4 Taxes on the adjustments between IFRS and core results take into account, for each individual item included in the adjustment, the tax rate that will finally be applicable to the item based on the jurisdiction where the
adjustment will finally have a tax impact. There is usually a tax impact on exceptional items although this is not the case for items arising from criminal settlements in certain jurisdictions.5 Earnings per share (EPS) is calculated on the amount of net income attributable to shareholders of Novartis AG.

66/77
CORE RESULTS – Reconciliation from IFRS results to core results – Discontinued operations – First half
Acquisition or
divestment related
items, including
restructuring Other
H1 2015 Amortization of and integration exceptional H1 2015 H1 2014
IFRS results intangible assets Impairments 1 charges 2 items 3 Core results Core results
USD millions USD millions USD millions USD millions USD millions USD millions USD millions
Gross profit 283 6 289 1 394
Operating income/loss 12 526 20 -12 727 7 -174 -205
Income/loss before taxes 12 526 20 -12 727 7 -174 -202
Taxes 4 -1 845 32 29
Net income/loss 10 681 -142 -173
EPS (USD) 5 4.43 -0.06 -0.07
The following are adjustments to arrive at Core Gross Profit
Cost of goods sold -342 6 -336 -1 223
The following are adjustments to arrive at Core Operating Loss
Other income 13 323 -13 313 10 25
Other expense -621 20 586 1 -14 -49
1 Impairments: Other expense includes impairment charge as a result of the proposed sale of the influenza Vaccines business.2 Acquisition or divestment related items, including restructuring and integration charges: Other income includes gains from the divestment of Animal Health (USD 4.6 billion) and from the transactions with GSK (USD
2.8 billion for the non-influenza Vaccines business and USD 5.9 billion resulting from the contribution of the former Novartis OTC division into the GSK consumer healthcare joint venture in exchange for 36.5% interest in this newly created entity); Other expense includes expenses related to the portfolio transformation activities.
3 Other exceptional items: Cost of goods sold and Other expense include restructuring charges, including those related to the Group-wide rationalization of manufacturing sites.4 Taxes on the adjustments between IFRS and core results take into account, for each individual item included in the adjustment, the tax rate that will finally be applicable to the item based on the jurisdiction where the
adjustment will finally have a tax impact. There is usually a tax impact on exceptional items although this is not the case for items arising from criminal settlements in certain jurisdictions. Due to these factors and the differing effective tax rates in the various jurisdictions, the tax on the total adjustments of USD 12.7 billion to arrive at the core results before tax amounts to USD 1.9 billion. The average tax rate on the adjustments is 14.8%.
5 Earnings per share (EPS) is calculated on the amount of net income attributable to shareholders of Novartis AG.

67/77
Condensed consolidated changes in net debt
Second quarter Q2 2015 Q2 2014
USD m USD m
Change in cash and cash equivalents -1 255 -373
Change in marketable securities, commodities,
financial debt and financial derivatives 1 606 768
Reduction in net debt 351 395
Net debt at April 1 -17 750 -13 490
Net debt at June 30 -17 399 -13 095
First half H1 2015 H1 2014
USD m USD m
Change in cash and cash equivalents -7 805 110
Change in marketable securities, commodities,
financial debt and financial derivatives -3 045 -4 409
Increase in net debt -10 850 -4 299
Net debt at January 1 -6 549 -8 796
Net debt at June 30 -17 399 -13 095
Components of net debt June 30, June 30, 2015 2014
USD m USD m
Current financial debts and derivative
financial instruments -9 973 -7 556
Non-current financial debts -13 301 -12 874
Less liquidity:
Cash and cash equivalents 5 218 6 797
Marketable securities, commodities
and derivative financial instruments 657 538
Net debt at June 30 -17 399 -13 095
Share information June 30, June 30, 2015 2014
Number of shares outstanding 2 415 172 828 2 426 206 402
Registered share price (CHF) 92.15 80.30
ADR price (USD) 98.34 90.53
Market capitalization (USD billion) 238.6 218.6
Market capitalization (CHF billion) 222.6 194.8

68/77
Free cash flow
Second quarter Q2 2015 Q2 2014 Change
USD m USD m USD m
Operating income from continuing operations 2 281 3 184 -903
Reversal of non-cash items
Depreciation, amortization and impairments 1 509 1 175 334
Change in provisions and other non-current liabilities 249 464 -215
Other 114 108 6
Operating income adjusted for non-cash items 4 153 4 931 -778
Interest and other financial receipts 59 -18 77
Interest and other financial payments -260 -230 -30
Taxes paid -524 -544 20
Payments out of provisions and other
net cash movements in non-current liabilities -214 -309 95
Change in inventory and trade
receivables less trade payables -62 -144 82
Change in other net current assets and
other operating cash flow items -197 -108 -89
Cash flows from operating activities from continuing operations 2 955 3 578 -623
Purchase of property, plant & equipment -566 -644 78
Purchase of intangible, financial
and other non-current assets -476 -318 -158
Proceeds from sales of property, plant & equipment,
intangible, financial and other non-current assets 151 77 74
Free cash flow from continuing operations 2 064 2 693 -629
Free cash flow from discontinued operations -51 -280 229
Total free cash flow 2 013 2 413 -400
First half H1 2015 H1 2014 Change
USD m USD m USD m
Operating income from continuing operations 5 066 5 999 -933
Reversal of non-cash items
Depreciation, amortization and impairments 2 791 2 293 498
Change in provisions and other non-current liabilities 481 811 -330
Other 162 278 -116
Operating income adjusted for non-cash items 8 500 9 381 -881
Interest and other financial receipts 965 561 404
Interest and other financial payments -388 -398 10
Taxes paid -1 102 -1 226 124
Payments out of provisions and other
net cash movements in non-current liabilities -636 -480 -156
Change in inventory and trade
receivables less trade payables -1 552 -1 821 269
Change in other net current assets and
other operating cash flow items -936 -761 -175
Cash flows from operating activities from continuing operations 4 851 5 256 -405
Purchase of property, plant & equipment -1 035 -1 126 91
Purchase of intangible, financial
and other non-current assets -722 -444 -278
Proceeds from sales of property, plant & equipment,
intangible, financial and other non-current assets 435 159 276
Free cash flow from continuing operations 3 529 3 845 -316
Free cash flow from discontinued operations -290 -667 377
Total free cash flow 3 239 3 178 61

69/77
Net sales of the top 20 pharmaceutical products in 2015 – Second quarter
US Rest of world Total
% change % change % change in constant in constant % change in constant
Brands Business Franchise Indication USD m currencies USD m currencies USD m in USD currencies
Chronic myeloid
Gleevec/Glivec Oncology leukemia and GIST 657 21 527 -6 1 184 -1 6
Relapsing multiple
Gilenya Neuroscience sclerosis 382 35 318 18 700 16 26
Age-related
Lucentis Retina macular degeneration 537 2 537 -13 2
Afinitor/Votubia Oncology Breast cancer / TSC 250 29 173 9 423 10 19
Carcinoid tumors
Sandostatin Oncology and Acromegaly 209 13 204 5 413 -1 9
Chronic myeloid
Tasigna Oncology leukemia 169 29 243 17 412 10 21
Diovan/Co–Diovan Established Medicines Hypertension 70 -81 263 -23 333 -55 -52
Galvus Cardio-Metabolic Diabetes 273 -1 273 -17 -1
Exforge Established Medicines Hypertension 23 -71 249 -1 272 -26 -16
Exjade Oncology Chronic iron overload 107 45 155 5 262 7 17
Exelon/Exelon Patch Neuroscience Alzheimer’s disease 111 3 97 -15 208 -15 -8
Xolair 1 Respiratory Asthma 194 18 194 -2 18
Neoral/Sandimmun Immunology & Dermatology Transplantation 11 -8 134 -7 145 -19 -7
Voltaren
(excl. other divisions) Established Medicines Inflammation/pain 136 -4 136 -16 -4
Votrient Oncology Renal cell carcinoma 86 nm 79 nm 165 nm nm
Attention deficit/
Ritalin/Focalin Established Medicines hyperactivity disorder 72 -18 36 -1 108 -18 -13
Myfortic Immunology & Dermatology Transplantation 22 -39 78 2 100 -19 -9
Jakavi Oncology Myelofibrosis 98 68 98 42 68
Tafinlar/Mekinist Oncology Melanoma 86 nm 45 nm 131 nm nm
Femara Oncology Breast cancer 7 75 73 -5 80 -12 -1
Top 20 products total 2 262 8 3 912 5 6 174 -5 6
Rest of portfolio 472 9 1 201 8 1 673 -3 8
Total Division sales 2 734 8 5 113 5 7 847 -4 6
1 Net sales reflect Xolair sales for all indications (i.e. Xolair SAA and Xolair CSU, which are managed by the Immunology & Dermatology).

70/77
Net sales of the top 20 pharmaceutical products in 2015 – First half
US Rest of world Total
% change % change % change in constant in constant % change in constant
Brands Business Franchise Indication USD m currencies USD m currencies USD m in USD currencies
Chronic myeloid
Gleevec/Glivec Oncology leukemia and GIST 1 191 24 1 063 -7 2 254 -2 6
Relapsing multiple
Gilenya Neuroscience sclerosis 711 31 627 21 1 338 16 26
Age-related
Lucentis Retina macular degeneration 1 076 1 1 076 -13 1
Afinitor/Votubia Oncology Breast cancer / TSC 458 24 353 13 811 9 19
Carcinoid tumors
Sandostatin Oncology and Acromegaly 402 16 396 3 798 0 8
Chronic myeloid
Tasigna Oncology leukemia 312 26 472 18 784 10 21
Diovan/Co–Diovan Established Medicines Hypertension 154 -80 551 -21 705 -54 -51
Galvus Cardio-Metabolic Diabetes 565 4 565 -11 4
Exforge Established Medicines Hypertension 42 -76 511 5 553 -25 -14
Exjade Oncology Chronic iron overload 178 25 278 4 456 1 11
Exelon/Exelon Patch Neuroscience Alzheimer’s disease 239 2 202 -13 441 -13 -6
Xolair 1 Respiratory Asthma 374 19 374 1 19
Neoral/Sandimmun Immunology & Dermatology Transplantation 23 -12 268 -4 291 -16 -4
Voltaren
(excl. other divisions) Established Medicines Inflammation/pain 270 -2 270 -13 -2
Votrient Oncology Renal cell carcinoma 114 nm 108 nm 222 nm nm
Attention deficit/
Ritalin/Focalin Established Medicines hyperactivity disorder 139 -14 71 4 210 -13 -8
Myfortic Immunology & Dermatology Transplantation 50 -37 149 -5 199 -22 -15
Jakavi Oncology Myelofibrosis 188 76 188 49 76
Tafinlar/Mekinist Oncology Melanoma 111 nm 60 nm 171 nm nm
Femara Oncology Breast cancer 14 56 148 -5 162 -12 -2
Top 20 products total 4 138 2 7 730 5 11 868 -6 4
Rest of portfolio 825 -5 2 294 6 3 119 -7 3
Total Division sales 4 963 0 10 024 5 14 987 -6 4
1 Net sales reflect Xolair sales for all indications (i.e. Xolair SAA and Xolair CSU, which are managed by the Immunology & Dermatology).

71/77
Pharmaceuticals net sales by business franchise – Second quarter Q2 2015 Q2 2014 % change % change
USD m USD m USD cc
Oncology
Gleevec/Glivec 1 184 1 199 -1 6
Tasigna 412 373 10 21
Subtotal Bcr-Abl franchise 1 596 1 572 2 10
Afinitor/Votubia 423 384 10 19
Sandostatin 413 417 -1 9
Exjade 262 244 7 17
Votrient 165 0 nm nm
Jakavi 98 69 42 68
Tafinlar/Mekinist 131 0 nm nm
Femara 80 91 -12 -1
Revolade/Promacta 116 0 nm nm
Zykadia 18 7 157 166
Other 234 167 40 50
Total Oncology 3 536 2 951 20 30
Neuroscience
Gilenya 700 606 16 26
Exelon/Exelon Patch 208 246 -15 -8
Comtan/Stalevo 72 92 -22 -7
Other 36 59 -39 -32
Total Neuroscience 1 016 1 003 1 11
Retina
Lucentis 537 619 -13 2
Other 15 17 -12 -9
Total Retina 552 636 -13 2
Immunology & Dermatology
Neoral/Sandimmun(e) 145 179 -19 -7
Myfortic 100 123 -19 -9
Zortress/Certican 80 81 -1 15
Ilaris 61 47 30 43
Other 71 43 65 82
Subtotal Immunology & Dermatology
excluding Everolimus stent drug 457 473 -3 9
Everolimus stent drug 26 43 -40 -39
Total Immunology & Dermatology 483 516 -6 5
Respiratory
Ultibro Breezhaler 66 22 200 255
Onbrez Breezhaler/Arcapta Neohaler 47 56 -16 -2
Seebri Breezhaler 38 37 3 24
Subtotal COPD1 portfolio 151 115 31 57
Xolair 2 194 197 -2 18
Other 70 72 -3 4
Total Respiratory 415 384 8 27
Cardio-Metabolic
Galvus 273 328 -17 -1
Other 0 8 nm nm
Total Cardio-Metabolic 273 336 -19 -4
Established Medicines
Diovan 333 743 -55 -52
Exforge 272 370 -26 -16
Voltaren (excluding other divisions) 136 161 -16 -4
Ritalin/Focalin 108 132 -18 -13
Other 723 967 -25 -17
Total Established Medicines 1 572 2 373 -34 -26
Total Division net sales 7 847 8 199 -4 6
Of which Growth products 3 3 463 2 819 23 38
Of which rest of portfolio 4 384 5 380 -19 -10
1 Chronic Obstructive Pulmonary Disease2 Net sales reflect Xolair sales for all indications (i.e. Xolair SAA and Xolair CSU, which are managed by the Immunology &
Dermatology).3 Growth products are an indicator of the rejuvenation of the portfolio, and comprise products launched in a key market (EU, US, Japan)
in 2010 or later, or products with exclusivity until at least 2019 in key markets. They include the acquisition effect of the GSK oncology assets.
nm = not meaningful
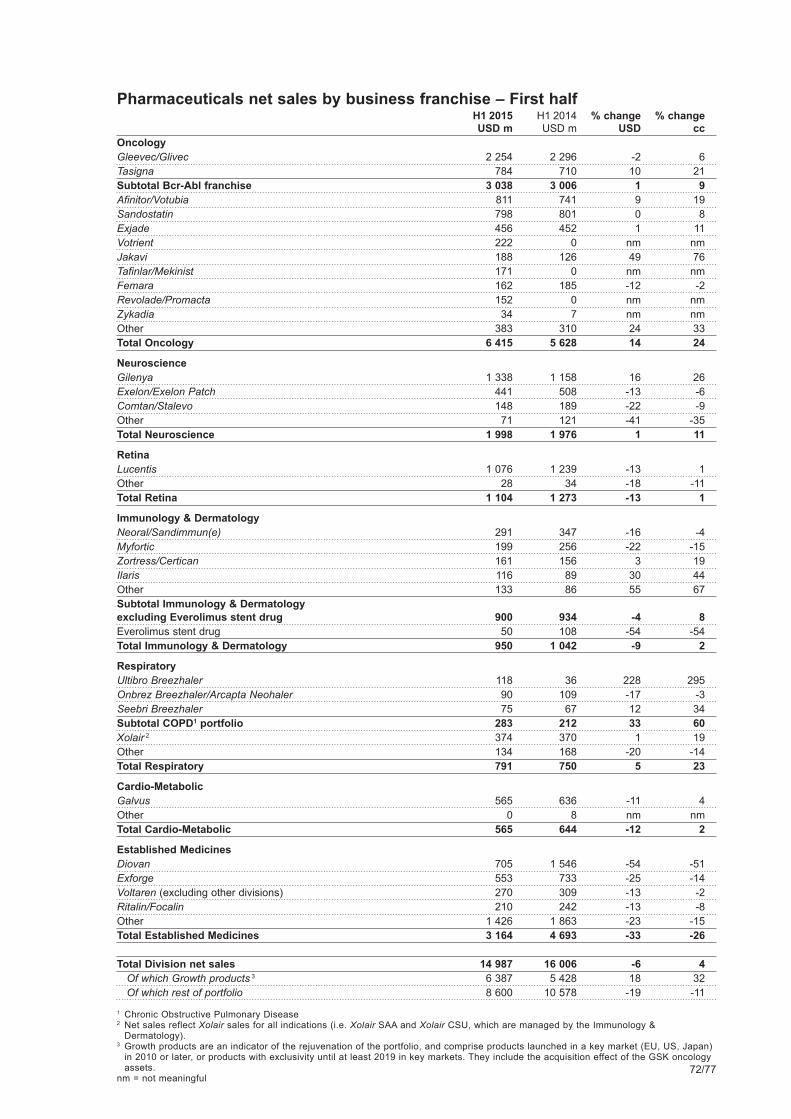
72/77
Pharmaceuticals net sales by business franchise – First half H1 2015 H1 2014 % change % change
USD m USD m USD cc
Oncology
Gleevec/Glivec 2 254 2 296 -2 6
Tasigna 784 710 10 21
Subtotal Bcr-Abl franchise 3 038 3 006 1 9
Afinitor/Votubia 811 741 9 19
Sandostatin 798 801 0 8
Exjade 456 452 1 11
Votrient 222 0 nm nm
Jakavi 188 126 49 76
Tafinlar/Mekinist 171 0 nm nm
Femara 162 185 -12 -2
Revolade/Promacta 152 0 nm nm
Zykadia 34 7 nm nm
Other 383 310 24 33
Total Oncology 6 415 5 628 14 24
Neuroscience
Gilenya 1 338 1 158 16 26
Exelon/Exelon Patch 441 508 -13 -6
Comtan/Stalevo 148 189 -22 -9
Other 71 121 -41 -35
Total Neuroscience 1 998 1 976 1 11
Retina
Lucentis 1 076 1 239 -13 1
Other 28 34 -18 -11
Total Retina 1 104 1 273 -13 1
Immunology & Dermatology
Neoral/Sandimmun(e) 291 347 -16 -4
Myfortic 199 256 -22 -15
Zortress/Certican 161 156 3 19
Ilaris 116 89 30 44
Other 133 86 55 67
Subtotal Immunology & Dermatology
excluding Everolimus stent drug 900 934 -4 8
Everolimus stent drug 50 108 -54 -54
Total Immunology & Dermatology 950 1 042 -9 2
Respiratory
Ultibro Breezhaler 118 36 228 295
Onbrez Breezhaler/Arcapta Neohaler 90 109 -17 -3
Seebri Breezhaler 75 67 12 34
Subtotal COPD1 portfolio 283 212 33 60
Xolair 2 374 370 1 19
Other 134 168 -20 -14
Total Respiratory 791 750 5 23
Cardio-Metabolic
Galvus 565 636 -11 4
Other 0 8 nm nm
Total Cardio-Metabolic 565 644 -12 2
Established Medicines
Diovan 705 1 546 -54 -51
Exforge 553 733 -25 -14
Voltaren (excluding other divisions) 270 309 -13 -2
Ritalin/Focalin 210 242 -13 -8
Other 1 426 1 863 -23 -15
Total Established Medicines 3 164 4 693 -33 -26
Total Division net sales 14 987 16 006 -6 4
Of which Growth products 3 6 387 5 428 18 32
Of which rest of portfolio 8 600 10 578 -19 -11
1 Chronic Obstructive Pulmonary Disease2 Net sales reflect Xolair sales for all indications (i.e. Xolair SAA and Xolair CSU, which are managed by the Immunology &
Dermatology).3 Growth products are an indicator of the rejuvenation of the portfolio, and comprise products launched in a key market (EU, US, Japan)
in 2010 or later, or products with exclusivity until at least 2019 in key markets. They include the acquisition effect of the GSK oncology assets.
nm = not meaningful

73/77
Net sales by region1 – Second quarter Q2 2015 Q2 2014 % change Q2 2015 Q2 2014
USD m USD m USD cc % of total % of total
Pharmaceuticals
Europe 2 506 2 934 -15 5 32 36
US 2 734 2 535 8 8 35 31
Asia/Africa/Australasia 1 841 1 976 -7 2 23 24
Canada and Latin America 766 754 2 17 10 9
Total 7 847 8 199 -4 6 100 100
Of which in Established Markets 5 811 6 145 -5 5 74 75
Of which in Emerging Growth Markets 2 036 2 054 -1 10 26 25
Alcon
Europe 618 749 -17 2 24 27
US 1 134 1 159 -2 -2 44 41
Asia/Africa/Australasia 537 617 -13 -4 21 22
Canada and Latin America 270 292 -8 7 11 10
Total 2 559 2 817 -9 0 100 100
Of which in Established Markets 1 922 2 092 -8 -1 75 74
Of which in Emerging Growth Markets 637 725 -12 0 25 26
Sandoz
Europe 965 1 173 -18 2 42 50
US 879 717 23 23 38 31
Asia/Africa/Australasia 300 292 3 12 13 13
Canada and Latin America 144 149 -3 16 7 6
Total 2 288 2 331 -2 11 100 100
Of which in Established Markets 1 724 1 704 1 12 75 73
Of which in Emerging Growth Markets 564 627 -10 8 25 27
Continuing operations
Europe 4 089 4 856 -16 4 32 36
US 4 747 4 411 8 8 37 33
Asia/Africa/Australasia 2 678 2 885 -7 2 21 22
Canada and Latin America 1 180 1 195 -1 15 10 9
Total continuing operations 12 694 13 347 -5 6 100 100
Of which in Established Markets 9 457 9 941 -5 5 74 74
Of which in Emerging Growth Markets 3 237 3 406 -5 8 26 26
Discontinued operations 2
Europe 17 597 nm nm 44 46
US 3 291 nm nm 8 23
Asia/Africa/Australasia 2 270 nm nm 4 21
Canada and Latin America 17 132 nm nm 44 10
Total discontinued operations 39 1 290 nm nm 100 100
Of which in Established Markets 18 852 nm nm 46 66
Of which in Emerging Growth Markets 21 438 nm nm 54 34
1 Net sales from operations by location of third party customer. Emerging Growth Markets comprise all markets other than the Established Markets of the US, Canada, Western Europe, Japan, Australia and New Zealand.
2 Discontinued operations are defined on page 42. nm = not meaningful

74/77
Net sales by region1 – First half H1 2015 H1 2014 % change H1 2015 H1 2014
USD m USD m USD cc % of total % of total
Pharmaceuticals
Europe 4 953 5 779 -14 4 33 36
US 4 963 4 943 0 0 33 31
Asia/Africa/Australasia 3 605 3 865 -7 1 24 24
Canada and Latin America 1 466 1 419 3 18 10 9
Total 14 987 16 006 -6 4 100 100
Of which in Established Markets 11 045 12 097 -9 1 74 76
Of which in Emerging Growth Markets 3 942 3 909 1 11 26 24
Alcon
Europe 1 232 1 492 -17 2 24 27
US 2 214 2 180 2 2 43 40
Asia/Africa/Australasia 1 149 1 234 -7 2 22 23
Canada and Latin America 522 553 -6 8 11 10
Total 5 117 5 459 -6 2 100 100
Of which in Established Markets 3 840 4 110 -7 1 75 75
Of which in Emerging Growth Markets 1 277 1 349 -5 7 25 25
Sandoz
Europe 1 963 2 345 -16 4 43 50
US 1 704 1 434 19 20 38 31
Asia/Africa/Australasia 578 575 1 9 13 12
Canada and Latin America 280 295 -5 11 6 7
Total 4 525 4 649 -3 10 100 100
Of which in Established Markets 3 399 3 370 1 11 75 72
Of which in Emerging Growth Markets 1 126 1 279 -12 7 25 28
Continuing operations
Europe 8 148 9 616 -15 4 33 37
US 8 881 8 557 4 4 36 33
Asia/Africa/Australasia 5 332 5 674 -6 2 22 22
Canada and Latin America 2 268 2 267 0 14 9 8
Total continuing operations 24 629 26 114 -6 4 100 100
Of which in Established Markets 18 284 19 577 -7 3 74 75
Of which in Emerging Growth Markets 6 345 6 537 -3 10 26 25
Discontinued operations 2
Europe 308 1 208 nm nm 52 47
US 124 542 nm nm 21 21
Asia/Africa/Australasia 86 509 nm nm 15 20
Canada and Latin America 69 286 nm nm 12 12
Total discontinued operations 587 2 545 nm nm 100 100
Of which in Established Markets 408 1 663 nm nm 70 65
Of which in Emerging Growth Markets 179 882 nm nm 30 35
1 Net sales from operations by location of third party customer. Emerging Growth Markets comprise all markets other than the Established Markets of the US, Canada, Western Europe, Japan, Australia and New Zealand.
2 Discontinued operations are defined on page 42. nm = not meaningful

75/77
Principal currency translation rates
Second quarter Period-end Period-end Average Average rates rates rates rates June 30, June 30, Q2 2015 Q2 2014 2015 2014
USD USD USD USD
1 CHF 1.062 1.125 1.072 1.122
1 EUR 1.105 1.371 1.116 1.364
1 GBP 1.532 1.683 1.570 1.702
100 JPY 0.824 0.979 0.817 0.986
100 RUB 1.903 2.859 1.795 2.949
First half Period-end Period-end Average Average rates rates rates rates June 30, June 30, H1 2015 H1 2014 2015 2014
USD USD USD USD
1 CHF 1.056 1.122 1.072 1.122
1 EUR 1.116 1.371 1.116 1.364
1 GBP 1.524 1.669 1.570 1.702
100 JPY 0.832 0.976 0.817 0.986
100 RUB 1.745 2.856 1.795 2.949
Income from associated companies
Q2 2015 Q2 2014 H1 2015 H1 2014
USD m USD m USD m USD m
Share of estimated Roche reported results 186 217 368 458
Prior-year adjustment -157 -56
Amortization of additional intangible assets recognized
by Novartis on initial accounting for the equity interest -38 -41 -76 -81
Net income effect from Roche Holding AG 148 176 135 321
Share of estimated GlaxoSmithKline Consumer
Healthcare Holdings reported results -28
Income from other associated companies related to
continuing operations 1 9 1 79
Income from associated companies related to
continuing operations 121 185 136 400
Income from other associated companies related to
discontinued operations 2 3
Total income from associated companies 121 187 136 403

76/77
Disclaimer This press release contains forward-looking statements that can be identified by words such as “innovation,” “progress,” “launches,” “momentum,” “launched,” “outlook,” “confirmed,” “expected,” “launch,” “confident,” “will,” “priorities,” “confirm,” “would,” “turnaround plan,” “under development,” “focus,” “growth drivers,” “trends towards,” “pipeline,” “positive opinions,” “recommended,” “positive opinion,” “ongoing,” “potential,” “committed,” “continues,” “on track,” “priority,” “in the future,” “planned,” “proposed,” “underway,” “contingent,” “Breakthrough Therapy,” “under review,” “being developed,” “strategy,” “expects,” “evolving,” “could,” “initiated,” “positive recommendation,” or similar terms, or by express or implied discussions regarding potential new products, potential new indications for existing products, or regarding potential future revenues from any such products; regarding potential shareholder returns or credit ratings; regarding the potential completion of the announced transaction with CSL; regarding the potential financial or other impact on Novartis of the transactions with GSK, Lilly or CSL, or regarding any potential strategic benefits, synergies or opportunities as a result of these transactions; or regarding potential future sales or earnings of the Novartis Group or its divisions and associated companies; or by discussions of strategy, plans, expectations or intentions. You should not place undue reliance on these statements. Such forward-looking statements are based on the current beliefs and expectations of management regarding future events, and are subject to significant known and unknown risks and uncertainties. Should one or more of these risks or uncertainties materialize, or should underlying assumptions prove incorrect, actual results may vary materially from those set forth in the forward-looking statements. There can be no guarantee that any new products will be approved for sale in any market, or that any new indications will be approved for any existing products in any market, or that any approvals which are obtained will be obtained at any particular time, or that any such products will achieve any particular revenue levels. Nor can there be any guarantee that the announced transaction with CSL will be completed in the expected form or within the expected time frame or at all. Neither can there be any guarantee that Novartis will be able to realize any of the potential strategic benefits, synergies or opportunities as a result of the transactions with GSK, Lilly or CSL. Neither can there be any guarantee that the Novartis Group, or any of its divisions or associated companies, will be commercially successful in the future, will achieve any particular financial results, or achieve any particular credit rating or level of shareholder returns. Nor can there be any guarantee that the turnaround plan under development at Alcon will be successfully developed or implemented, or will achieve its goals. In particular, management’s expectations could be affected by, among other things, unexpected regulatory actions or delays or government regulation generally, including an unexpected failure to obtain necessary government approvals for the announced transaction with CSL, or unexpected delays in obtaining such approvals; the potential that the strategic benefits, synergies or opportunities expected from the transactions with GSK, Lilly or CSL may not be realized or may take longer to realize than expected; the inherent uncertainties involved in predicting shareholder returns or credit ratings; the uncertainties inherent in research and development, including unexpected clinical trial results and additional analysis of existing clinical data; the Company’s ability to obtain or maintain proprietary intellectual property protection, including the ultimate extent of the impact on the Company of the loss of patent protection and exclusivity on key products which will continue this year; unexpected manufacturing or quality issues; unexpected safety issues; global trends toward health care cost containment, including ongoing pricing pressures and ongoing reimbursement challenges with payors; uncertainties regarding actual or potential legal proceedings, including, among others, actual or potential product liability litigation, litigation and investigations regarding sales and marketing practices, government investigations and intellectual property disputes; general economic and industry conditions, including uncertainties regarding the effects of the persistently weak economic and financial environment in many countries; uncertainties regarding future global exchange rates; uncertainties regarding future demand for our products; uncertainties involved in the development of new healthcare products; uncertainties regarding potential significant breaches of data security or disruptions of the Company’s information technology systems; and other risks and factors referred to in Novartis AG’s current Form 20-F on file with the US Securities and Exchange Commission. Novartis is providing the information in this press release as of this date and does not undertake any obligation to update any forward-looking statements as a result of new information, future events or otherwise. All product names appearing in italics are trademarks owned by or licensed to Novartis Group Companies. Faslodex® is a registered trademark of the AstraZeneca group of companies. Copaxone® is a registered trademark of Teva Pharmaceutical Industries Ltd. Jakafi® is a registered trademark of Incyte Corporation. Fovista® is a registered trademark of Ophthotech Corporation.

77/77
About Novartis Novartis provides innovative healthcare solutions that address the evolving needs of patients and societies. Headquartered in Basel, Switzerland, Novartis offers a diversified portfolio to best meet these needs: innovative medicines, eye care and cost-saving generic pharmaceuticals. Novartis is the only global company with leading positions in these areas. In 2014, the Group achieved net sales of USD 58.0 billion, while R&D throughout the Group amounted to approximately USD 9.9 billion (USD 9.6 billion excluding impairment and amortization charges). Novartis Group companies employ approximately 120,000 full-time-equivalent associates and sell products in more than 150 countries around the world. For more information, please visit http://www.novartis.com. Important dates October 27, 2015 Third quarter results 2015 January 27, 2016 Fourth quarter and full year results 2015 February 23, 2016 Annual General Meeting