notice to asx/lse - rio tinto
TRANSCRIPT

Rio Tinto releases fourth quarter production results19 January 2021
Rio Tinto Chief Executive Jakob Stausholm, said: “We have delivered a strong safety and operational performance in the face of the significant global challenges of COVID-19. Our 2020 performance reflects the resilience of the business, and the commitment and flexibility of our employees, customers, communities and host governments.
"We are working to restore trust with the Puutu Kunti Kurrama and Pinikura (PKKP) people. Some important progress has been made as set out in the joint statement issued in December following a meeting between the PKKP and Rio Tinto boards. We are also developing additional measures to strengthen our partnerships with Traditional Owners, including a commitment to modernise and improve agreements, particularly in the Pilbara. More broadly, we are determined to improve Rio Tinto’s approach to stakeholder engagement globally by embedding a more inclusive approach that strengthens our overall thinking, decision-making and performance. However, I do not underestimate the time and effort it will take, genuinely working together with our partners, in order for Rio Tinto to drive the changes necessary to help restore trust and rebuild our reputation.
“Safe and well-run operations, together with world-class assets and a strong balance sheet, leave Rio Tinto well placed to generate superior returns for shareholders, invest in sustaining and growing our portfolio, while continuing to pay taxes and royalties in our host communities and make a broader contribution to society, including employment and procurement."
Production*Q4
2020vs Q42019
vs Q32020
Full Year2020
vs Full Year2019
Pilbara iron ore shipments (100% basis) Mt 88.9 +2 % +8 % 330.6 +1 %
Pilbara iron ore production (100% basis) Mt 86.0 +3 % 0 % 333.4 +2 %
Bauxite Mt 13.3 -12 % -8 % 56.1 +2 %
Aluminium kt 815 +4 % +2 % 3,180 0 %
Mined Copper kt 132.5 -4 % +2 % 527.9 -9 %
Titanium dioxide slag kt 272 -5 % -7 % 1,120 -7 %
IOC iron ore pellets and concentrate Mt 2.7 +7 % +17 % 10.4 -1 %
*Rio Tinto share unless otherwise stated
Q4 Operational update
• Our 2020 safety performance was strong, fatality-free for a second year in a row. Health and safety remains our top priority as we maintain use of the critical controls that protect our employees and the local communities with the resurgence of COVID-19 in several regions where we operate. Our all injury frequency rate (AIFR) improved by more than 10% for 2020 versus 2019 (0.42), demonstrating our ability to adapt to changing conditions.
• Pilbara iron ore achieved a strong performance across the network in 2020, despite impacts from Cyclone Damien in the first quarter and COVID-19 disruptions which also resulted in the deferral of maintenance to the second half. Shipments of 330.6 million tonnes (100% basis) were 1% higher than 2019 and production of 333.4 million tonnes (100% basis), 2% higher than 2019. This was underpinned by record total material moved, 7% higher than the previous record in 2019.
• Bauxite production of 56.1 million tonnes was 2% higher than 2019 supported by the ramp-up of the expansion at the CBG mine in Guinea, and steady performance at the Pacific mines.
• Aluminium production of 3.2 million tonnes was in line with 2019, with lower volumes from the curtailment of Line 4 at the Tiwai Point aluminium smelter in New Zealand and from the Kitimat smelter pot relining campaign, offset by the ramp-up of the Becancour smelter in Quebec.
• On 14 January 2021, we announced a new electricity agreement had been reached with Meridian Energy that allows New Zealand’s Aluminium Smelter (NZAS) to continue operating the Tiwai Point aluminium smelter until December, 2024.
Notice to ASX/LSE
1
• Mined copper was above the guidance range, but 9% lower than 2019 due to lower grades at Kennecott as a result of planned pit sequencing and Oyu Tolgoi production phasing. The commercial and operational teams at Kennecott Utah achieved approximately 60,000 dry metric tonnes of copper concentrate sales in the fourth quarter to partly mitigate the impact of the delayed re-start of the smelter, which became fully operational during October.
• On 16 December, we confirmed the definitive estimate of cost and schedule for Panel 0 of the Oyu Tolgoi underground project in Mongolia, with sustainable production expected to commence in October 2022 and development capital of $6.75 billion1, in line with previously announced ranges. Rio Tinto considers that additional milestones need to be met in order to ensure that the project can commence caving operations in 2021, including: outstanding government approvals; funding; and, a power solution. Further information can be found in the Investments, growth and development projects section below.
• Titanium dioxide slag production of 1.1 million tonnes was 7% lower than 2019 due to COVID-19 restrictions in Quebec and South Africa, lower market demand and operational disruptions at Richards Bay Minerals (RBM). With the COVID-19 resurgence in Quebec and South Africa, we continue to operate our assets with extensive measures in place to ensure the safety of our employees and communities.
• Production of pellets and concentrate at Iron Ore Company of Canada (IOC) was 1% lower than 2019 due to unplanned maintenance at the processing facilities in the third and fourth quarters. On 3 December, we signed a Reconciliation and Collaboration Agreement with the Innu communities of Uashat mak Mani-utenam and Matimekush-Lac John, re-confirming the long-term partnership between the company and the two communities over the coming decades.
• On 10 December, we disclosed a maiden Ore Reserve and updated Mineral Resource at the 100% owned Jadar lithium-borates project in western Serbia. The Ore Reserve is 16.6 million tonnes at 1.81% Li2O and 13.4% B2O3.2 Jadar would be capable of producing approximately 55 thousand tonnes of battery grade lithium carbonate, as well as 160 thousand tonnes of boric acid (B2O3 units) and 255 thousand tonnes of sodium sulfate as by-products per annum. 3
• On 17 December, we announced the appointment of Jakob Stausholm as Chief Executive, effective 1 January 2021. Peter Cunningham has been appointed interim Chief Financial Officer, effective 1 January 2021.
• On 15 January 2021, we announced that we have entered the next phase of public comment in the ongoing permitting process at the Resolution Copper Project in Arizona, led by the US Forest Service, with the release of its independently prepared Final Environmental Impact Statement (EIS). The delay in publication of the Final EIS, which was originally scheduled for July 2020 by the Obama Administration, is a result of extensive public consultation, significant interagency coordination and COVID-19 related changes to the pace of work.
1 This estimate is at a better than feasibility study level of accuracy.2 This Ore Reserve estimate was set out in a release to the Australian Securities Exchange (ASX) dated 10 December 2020 “Rio Tinto declares maiden Ore Reserve at Jadar” (ASX release). The Competent Person responsible for the information in the ASX release that relates to Ore Reserves is Mr Allan Earl who is a Fellow of the Australasian Institute of Mining and Metallurgy (FAusIMM). Mr Earl’s assessment is supported from a metallurgical perspective by Mr Gary Davis who is a Member of the Australasian Institute of Mining and Metallurgy (MAusIMM). Rio Tinto confirms that it is not aware of any new information or data that materially affects the information included in the ASX release, that all material assumptions and technical parameters underpinning the estimates in the ASX release continue to apply and have not materially changed, and that the form and context in which the Competent Persons’ findings are presented have not been materially modified.3 These production targets were previously reported in the ASX release on 10 December 2020. All material assumptions underpinning the production targets continue to apply and have not materially changed.
2

Cultural heritage We have commenced implementation of the recommendations from the Board review of cultural heritage management and are developing additional measures to enhance our partnerships, as we continue to focus on the longer-term process of regaining the trust of Traditional Owners. To support this, we are focused on making sure that we build a more inclusive and diverse work culture, which will require sustained effort over many years.
On 9 December, we acknowledged the release of the Joint Standing Committee on Northern Australia’s interim report following the Parliamentary Inquiry into the destruction of rockshelters at Juukan Gorge. On 16 December, we set out our position on the Committee’s Recommendation 1 contained in the interim report. All documents can be found on our dedicated page on the website here.
On 23 December, we issued a joint statement with the Puutu Kunti Kurrama and Pinikura (PKKP) people confirming our shared commitment to work together to rebuild our relationship following the Juukan Gorge events in May 2020. We have made strong progress in recent months:
• With the PKKP, we have worked on a rehabilitation programme for the Juukan 1 and Juukan 2 rock shelters and we are assessing ways to protect the area for the future. This includes a permanent mining moratorium around the Juukan Gorge area. We have moved the artefacts previously uncovered from the rockshelters to a purpose-built facility, with the support of the PKKP.
• The PKKP and Rio Tinto boards met to reaffirm our apology and commitment to rebuilding our relationship. This followed a visit to the Juukan Gorge by our Chairman and the Chair of our Sustainability Committee with PKKP elders.
A summary of other key actions taken in the quarter are outlined below:• Reassessed all activities which have the potential to impact heritage sites. We will continue to review
mine plans to ensure the protection of sites of exceptional cultural value and have increased monitoring of operating activities that have the potential to impact heritage sites. We have also integrated heritage management into our mining operations - our Product Groups have primary responsibility for our Communities and Social Performance (CSP) partnerships and engagement.
• We have confirmed that Traditional Owners are not restricted from raising concerns about cultural heritage matters with anyone, or from applying for statutory protection of any cultural heritage sites. This forms part of our commitment to modernise our agreements with Traditional Owner groups in the Pilbara. This will take time to ensure the process involves meaningful participation of Traditional Owners. We will also engage with Traditional Owners on how best to incorporate a process of independent review to support the modernisation process. In the meantime, we continue to work with Traditional Owners under existing agreements and have increased engagement regarding current and proposed plans for mining activities.
• Appointed Indigenous community leader, Wayne Bergmann, to consult with Traditional Owners on the formation of an Indigenous Advisory Group in Australia. The Advisory Group will advise the Board and senior management team and provide an alternative pathway for Traditional Owners to escalate any concerns they may have about our performance at a local level.
• Strengthened the operational leadership of relationships with Traditional Owners and we are strengthening our business-wide cultural competency programme to build awareness and understanding.
• Further to our commitment to invest $50 million to increase employment opportunities for Indigenous Australians in our business and enhance Indigenous leadership in our Australian operations, we have progressed plans to advance Indigenous leadership in our business with the launch of a leadership programme involving more than 200 Indigenous employees. We have also implemented a two-way mentoring relationship between Indigenous employees and senior leaders as part of a broader cultural competency programme.
3

Our marketsEconomic activity, particularly in Europe, continues to be disrupted in the short term due to measures to combat COVID-19. Monetary policy is expected to remain accommodative and fiscal policy is also expected to be utilised extensively, both of which should be supportive of commodity demand.
• In China, the industrial sector has recovered and is now at pre-COVID levels due to the rapid deployment of stimulus. Exports continue to rise with the global economic recovery, and a policy shift to promote domestic investment and consumption is supportive of the commodity demand outlook.
• Iron ore prices rose significantly in the second half of 2020 on the back of tightened market fundamentals. China’s buying remains robust despite ongoing localised impacts from COVID-19 in some regions. Demand in Japan, Korea, Taiwan and Europe is recovering, amplified by restocking.
• The aluminium price has rebounded on solid downstream demand, particularly in the automotive and packaging sectors. We remain cautious on the outlook due to an expected increase in Chinese supply and high global inventories.
• Copper prices remain strong. Chinese consumption is robust, mine and scrap supply have been disrupted, and investment demand is strong. We expect global fiscal stimulus, particularly in the electrification and renewables sectors, to be copper-intensive and supportive of the outlook.
Average realised prices achieved for our major commodities
Units 2020 2019
Pilbara iron ore FOB, $/wmt 91.0 79.0
Pilbara iron ore FOB, $/dmt 98.9 85.9
Aluminium* Metal, $/t 1,946 2,132
Copper** US cents per lb 283.0 274.0
IOC pellets $/wmt 127.6 137.1
*LME plus all-in premiums (product and market)**Realised price for all units sold, adjusted for provisionally priced contracts
Product stewardship, our value chain and sustainability• As part of our approach to work in partnerships with customers and other stakeholders to progress the
decarbonisation of our value chain, in line with our Climate Strategy, we advanced three partnerships in the fourth quarter:
◦ On 23 November, we announced a renewed partnership agreement with China’s Tsinghua University and a further commitment of 30 million yuan ($4.5 million) over the next five years to support research projects at the Tsinghua-Rio Tinto Joint Research Centre for Resources, Energy and Sustainable Development.
◦ On 16 December, we announced the advancement of a climate partnership with the world’s largest steel producer China Baowu Steel Group, and Tsinghua University, including a commitment to invest $10 million over the next two years in low-carbon steelmaking projects and research.
◦ On 16 December, we announced the signing of a Memorandum of Understanding (MOU) with Japan’s largest steel producer, Nippon Steel Corporation to jointly explore, develop and demonstrate technologies to transition to a low-carbon emission steel value chain.
• On 16 December, we announced the completion of construction on the ELYSIS Industrial Research and Development Centre in Saguenay-Lac-Saint-Jean, Québec. Commissioning of the Industrial Research and Development Centre is now underway.
• On 17 December, we announced an investment of $8.4 million to expand the recycling capacity of our aluminium operations in Saguenay-Lac-Saint-Jean, Quebec, to offer rolled product customers in North America a new, sustainable solution combining low-carbon and recycled aluminium. With an initial capacity of 22,000 metric tons of remelted aluminium per year, the new aluminium recycling system is expected to be operational at the end of 2021.
• Following successful pilot plant trials to extract high purity scandium oxide from the waste streams of titanium dioxide production, on 14 January 2021 we announced an initial investment of $6 million for construction of a first module in a new commercial scale demonstration plant at our Rio Tinto Fer et Titane (RTFT) metallurgical complex in Sorel-Tracy, Quebec. Commercial supply of scandium oxide is expected in the second quarter of 2021, making RTFT the first producer of high-quality scandium oxide in North America.
4

COVID-19
We continue to manage the risk of COVID-19 as countries tighten restrictions and work to fight against aresurgence of the virus. Our absolute priority is to maintain significant levels of support and care for our employees, contractors, and host communities, particularly with the re-emerging risk for our operations and projects in Canada, the United States, South Africa and Mongolia. We are focused on well-being initiatives globally, and embrace flexible working arrangements.
• At the Oyu Tolgoi operation in Mongolia, we continue to apply the strictest measures, including testing for all employees before access to site. We maintain focus on health, safety and well-being of our employees and contractors amid the restrictions on domestic and international travel, and will continue to rotate employees when safe to do so.
• We are in regular contact with health authorities in Canada - both in Northern British Columbia and Quebec - with the rapid increase in cases. We are applying extensive measures to ensure the safety of our employees and communities including travel management protocols for employees and contractors along with reduced access to site.
• At our Diavik operation in the Northwest Territories of Canada, since testing commenced in May, we have taken nearly 20,000 swabs at the mine site which have been analysed through our on-site laboratory, including some for nearby mines that we service.
• At our Boron site in California, support has been provided to employees with ongoing rapid testing, and the implementation of reduced site hours to lessen the transmission risk and to protect our employees.
• With the outbreaks in the eastern states of Australia, State border closures are being closely monitored with site access controls and travel management protocols being utilised.
• We are actively managing the risks to seafarers from restrictions on crew changeovers due to COVID-19 measures in place in various countries. We continue to work with the industry, our shipowner partners and regulators to facilitate crew changes and protect crew welfare.
Communities• We have committed $25 million in COVID-19 related community projects globally, with around A$20
million in Australia including A$1.25 million over five years to the Royal Flying Doctor Service to improve emergency and remotely delivered health care services across the region.
• In partnership with the United Nations, we have committed $600,000 to COVID-19 relief initiatives in Mongolia including donation of laboratory equipment. We are actively engaging with local coordinators and participating in working groups to support the rollout of a vaccine.
• At Richards Bay Minerals in KwaZulu-Natal, South Africa, we are committed to supporting our local communities and have donated more than R5.5 million to provide critical support to those impacted by COVID-19, including food and water supplies, as well as Personal Protective Equipment (PPE) for frontline health workers and clinics.
• We are investing $10 million in a variety of grassroots projects across Canada and the United States to support local community efforts to fight COVID-19 and its social and economic impacts, along with supporting projects that maintain and create regional economic development.
◦ In Arizona, the Resolution Copper Project partnered with the United Food Bank to deliver 75,000 meals to the White Mountain Apache Tribe. It also donated 50,000 cans of water to support tribes, in partnership with Ball Corp and Can’d Aid.
◦ In the Northwest Territories, our Diavik diamond mine is partnering with the Yellowknife Women’s Society to support its COVID-19 isolation shelter with a C$150,000 contribution. We are also contributing C$60,000 to five Indigenous communities for food and other needs.
Full details of initiatives taken to date can be found on our website.
5

Production guidance
Rio Tinto share, unless otherwise stated 2020 Actuals 2021Pilbara iron ore (shipments, 100% basis) (Mt) 331 325 to 340Bauxite (Mt) 56 56 to 59Alumina (Mt) 8.0 7.8 to 8.2Aluminium (Mt) 3.2 3.1 to 3.3Mined copper (kt) 528 500 to 550Refined copper (kt) 155 210 to 250Diamonds (M carats)1 3.7 3.0 to 3.8Titanium dioxide slag (Mt) 1.1 ~1.1 to 1.3IOC iron ore pellets and concentrate (Mt) 10.4 10.5 to 12.0Boric oxide equivalent (Mt) 0.5 ~0.5
1Diamonds 2021 guidance and 2020 actual are for Diavik only for compatibility, following Argyle closure in 2020. Unadjusted Diamonds production for 2020 was 14.7 million carats, including both Diavik and Argyle operations.
• We will continue to monitor and adjust production levels and product mix to meet customer requirements in line with our value over volume strategy, government imposed restrictions related to COVID-19 and any other potential COVID-19 related disruptions.
• Iron ore shipments and bauxite production guidance remain subject to weather and market conditions. Iron ore guidance takes into account the risks associated with tying in approximately 90 million tonnes of replacement mine capacity at existing hubs in Robe Valley, West Angelas and Western Turner Syncline Phase 2 as well as the start-up of Gudai-Darri.
• The future impact on our Pilbara iron ore operations, mine developments and heritage approach from the reform of the Aboriginal Heritage Act 1972 (WA) remains unknown. We will maintain a high level of engagement with Traditional Owners regarding current and proposed plans for mining activities and continue to work through scenarios in an iterative manner as cultural assessments and mine designs progress, with a broad range of options available given the flexibility in our Pilbara network.
Investments, growth and development projects • Project teams have proactively managed COVID-19 related challenges, and overall project delivery is
satisfactory. Uncertainty continues to exist around local situations, border access, movement of people and goods.
• Exploration and evaluation operating expense in 2020 was $625 million, $1 million higher than 2019, with some redistribution of activities from regions with greater COVID-19 restrictions such as Europe, Central Asia and America, and ramp-up of activities in Australia following the easing of restrictions. The teams were able to keep programmes running throughout 2020 whilst maintaining strong safety standards, protecting our people and communities.
Pilbara replacement projects• Gudai-Darri (formerly Koodaideri) progress continues with production ramp-up on track for early 2022.
The airstrip is now complete and operational, and track work continues on the northern section of the railway.
• First ore from the Robe River Joint Venture sustaining production projects (West Angelas C, D and Mesa B, C and H at Robe Valley) is still expected in 2021. All required approvals have now been received.
• Construction continues to progress at Western Turner Syncline Phase 2, with the project maintaining forecast first ore in 2021.
Oyu Tolgoi underground project Technical progress
• Work on the project has continued to progress despite restrictions from COVID-19 controls and ongoing international travel restrictions. In November 2020, the Mongolian State Emergency Commission declared an “all out readiness state” after Mongolia recorded its first community transmission of COVID-19. All movements in and out of Ulaanbaatar and all domestic flights were halted. Critical commissioning vendors and sinking crew are in-country, however timing was impacted by the nationwide lockdown and quarantine duration.
• The project has deployed a number of mitigations that include extended on-site rosters, securing commitments from critical vendors to remain on site for extended periods and layered screening of personnel.
• Overall underground lateral development has now reached 53,000 equivalent metres (eqm), with development for first drawbell substantially complete.
6

• The project has now exceeded one million tonnes of material moved through shaft 2 since commissioning and scheduled annual maintenance of the shaft was successfully completed in October 2020 using remote technology.
• Shaft 4 is now out of care and maintenance and the focus is on completing all construction and commissioning activities for load testing and verification, and for sinking to commence in early 2021. Shaft 3 remains on care and maintenance, with some minor construction.
• On 16 December, we confirmed the definitive estimate of cost and schedule for Panel 0 with sustainable production expected to commence in October 2022 and development capital of $6.75 billion1, in line with previously announced ranges. These estimates include the known impacts of COVID-19.2
• At peak production, Oyu Tolgoi is expected to operate in the first quartile of the copper cash cost curve3 and by 2030 is expected to be the fourth largest copper mine in the world. It is expected to produce 480,000 tonnes4 of copper per year on average, from 2028 to 2036, from the open pit and underground. The underground Ore Reserve has an average copper grade of 1.52%, which is more than three times higher than the open pit Ore Reserve, and contains 0.31 grammes of gold per tonne.5
Other updates• On 4 January 2021, the Government of Mongolia advised Rio Tinto that they were dissatisfied with the
results of the definitive estimate and the funding implications for the sharing of economic benefits between the shareholders of Oyu Tolgoi. The Government has also stressed the importance of achieving a comprehensive solution which addresses the social issues of importance to Mongolia, such as water usage and the corporate tax payments which have been referred to International Arbitration. We have been engaging with the Government and Turquoise Hill Resources (TRQ) to address these recent challenges within the scope of Parliament Resolution 92, and remain open to improving the Underground Development and Financing Plan (UDP) to deliver even greater benefits from Oyu Tolgoi to all stakeholders.
• Rio Tinto considers that additional milestones need to be met in order to ensure that the project can commence caving operations in 2021, including: outstanding government approvals - including registering the updated Resources and Reserves submitted in February 2020 and accepting the updated feasibility study (OTFS20) completed in July 2020 in accordance with the 2009 Investment Agreement and Mongolian regulation; funding as agreed with TRQ in the MOU in September 2020; and, achieving the power milestones agreed with the Government of Mongolia in June 2020. We continue to work closely with our partners, the Government of Mongolia and TRQ in the coming months to finalise these milestones, as outlined in our 16 December release.
• On 22 December, Oyu Tolgoi received a Tax Assessment claim for approximately US$228 million from the Mongolian Tax Authority (MTA), relating to an audit of taxes paid between 2016 and 2018, in addition to the $752 million paid in the same period. Oyu Tolgoi has filed an application to include these matters to the pending international arbitration related to the years 2013 to 2015, which are of a similar nature.
Other key projects and exploration and evaluation • Phase one of the south wall pushback project at Kennecott remains on track, with access to higher
grades expected from 2021.• The Zulti South project in South Africa remains on full suspension. • At the Kemano hydropower tunnel project in British Columbia, Canada, tunnel boring works re-started in
September 2020. However, due to the escalation of COVID-19 in the province, tunnel boring operations have been temporarily suspended and the workforce has been limited to 160 people following a local order on 29 December. Care and maintenance activities are continuing on site until remobilisation plans can be safely implemented prior to resuming boring operations.
• At the Resolution project in Arizona, the shaft 9 remediation and sinking project was completed in November, four months ahead of schedule and within budget. We now enter the next phase of public comment in the ongoing permitting process led by the US Forest Service (USFS), with the release of its independently prepared Final Environmental Impact Statement (EIS) as announced on 15 January. The delay in publication of the Final EIS, which was originally scheduled for July 2020 by the Obama Administration, is a result of extensive public consultation, significant interagency coordination and COVID-19 related changes to the pace of work. We are committed to ongoing stakeholder engagement in our effort to seek consent to progress the project consistent with the International Council on Mining and Metals (ICMM) Statement on Indigenous Peoples and Mining.
• At the Winu project in Western Australia, drilling and fieldwork activities continue with 90 kilometres of drilling completed during 2020. We are actively engaging with the Traditional Owners through on-country heritage surveys, monitoring and agreement making, which is expected to continue into 2021, with first ore now expected in 2024, subject to regulatory approvals, Traditional Owner and other consents and COVID-19 restrictions. We further expanded our ground holdings in the Paterson region with a farm-in joint venture signed with Sipa Resources Limited adjoining Winu and the Citadel joint venture tenements.
7

• At the Simandou iron ore project in Guinea, we expect to complete the first phase of the technical optimisation work on the infrastructure components in the first half of 2021. Activity at the mine area is starting including roadworks. We are progressing the implementation of the project’s 2012 Social and Environmental Impact Assessment (SEIA).
• The feasibility study at the Jadar lithium-borate project in Serbia continues and is expected to complete by the end of 2021. If the investment is approved, construction would take approximately four years. The declaration of resources and reserves in December was an important milestone as the project progresses towards the award of an exploitation license, the precursor to a construction licence.
1 This estimate is at a better than feasibility study level of accuracy.2 The definitive estimate assumes restrictions in 2021 that are no more stringent than those experienced in September 2020. Mongolia implemented further restrictions at the end of 2020 in response to a re-emergence of COVID-19. Should COVID-19 constraints be maintained at December 2020 levels, escalate further in 2021 leading to tougher restrictions, or continue beyond 2021, additional costs and schedule impacts will arise.3 WoodMackenzie copper equivalent cash cost curve (Q3 2020).4 This production target (stated as recovered metal) for the Oyu Tolgoi underground and open pit mines was previously reported in a release to the market on 16 December 2020 (Market release). All material assumptions underpinning the production target continue to apply and have not materially changed.5 This Ore Reserve estimate was set out in the Market release dated 16 December 2020. The Competent Persons responsible for the information in the Market release that relates to Ore Reserves were Mr Ferrin Prince and Mr Mark Bixley who are a Member and Fellow respectively of The Australasian Institute of Mining and Metallurgy. Rio Tinto confirms that it is not aware of any new information or data that materially affects the information included in the Market release, that all material assumptions and technical parameters underpinning the estimates in the Market release continue to apply and have not materially changed, and that the form and context in which the Competent Persons’ findings are presented have not been materially modified.
All figures in this report are unaudited. All currency figures in this report are US dollars, and comments refer to Rio Tinto’s share of production, unless otherwise stated. To allow production numbers to be compared on a like-for-like basis, production from asset divestments completed in 2019 is excluded from Rio Tinto share of production data.
8
IRON ORERio Tinto share of production (Million tonnes)
Q42020
vs Q42019
vs Q32020
Full Year2020
vs Full Year2019
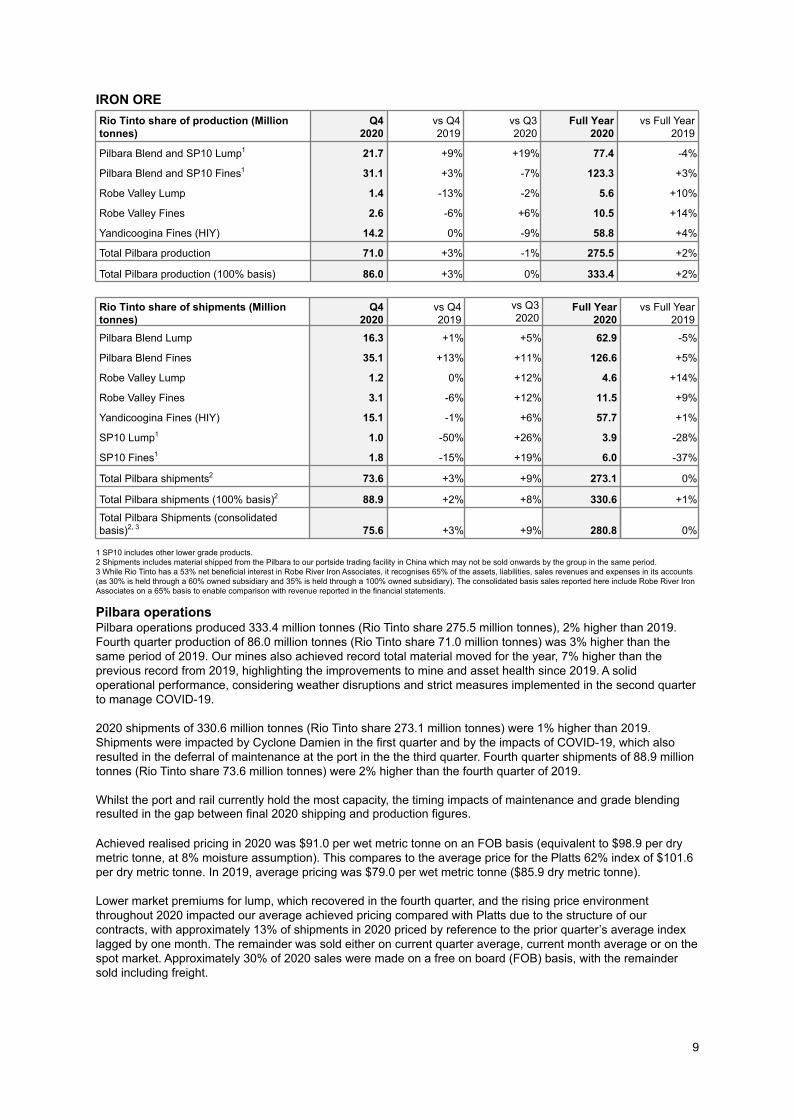
Pilbara Blend and SP10 Lump1 21.7 +9 % +19 % 77.4 -4 %
Pilbara Blend and SP10 Fines1 31.1 +3 % -7 % 123.3 +3 %
Robe Valley Lump 1.4 -13 % -2 % 5.6 +10 %
Robe Valley Fines 2.6 -6 % +6 % 10.5 +14 %
Yandicoogina Fines (HIY) 14.2 0 % -9 % 58.8 +4 %
Total Pilbara production 71.0 +3 % -1 % 275.5 +2 %
Total Pilbara production (100% basis) 86.0 +3 % 0 % 333.4 +2 %
Rio Tinto share of shipments (Million tonnes)
Q42020
vs Q42019
vs Q32020
Full Year2020
vs Full Year2019
Pilbara Blend Lump 16.3 +1 % +5 % 62.9 -5 %
Pilbara Blend Fines 35.1 +13 % +11 % 126.6 +5 %
Robe Valley Lump 1.2 0 % +12 % 4.6 +14 %
Robe Valley Fines 3.1 -6 % +12 % 11.5 +9 %
Yandicoogina Fines (HIY) 15.1 -1 % +6 % 57.7 +1 %
SP10 Lump1 1.0 -50 % +26 % 3.9 -28 %
SP10 Fines1 1.8 -15 % +19 % 6.0 -37 %
Total Pilbara shipments2 73.6 +3 % +9 % 273.1 0 %
Total Pilbara shipments (100% basis)2 88.9 +2 % +8 % 330.6 +1 %
Total Pilbara Shipments (consolidated basis)2, 3 75.6 +3 % +9 % 280.8 0 %
1 SP10 includes other lower grade products. 2 Shipments includes material shipped from the Pilbara to our portside trading facility in China which may not be sold onwards by the group in the same period. 3 While Rio Tinto has a 53% net beneficial interest in Robe River Iron Associates, it recognises 65% of the assets, liabilities, sales revenues and expenses in its accounts (as 30% is held through a 60% owned subsidiary and 35% is held through a 100% owned subsidiary). The consolidated basis sales reported here include Robe River Iron Associates on a 65% basis to enable comparison with revenue reported in the financial statements.
Pilbara operationsPilbara operations produced 333.4 million tonnes (Rio Tinto share 275.5 million tonnes), 2% higher than 2019. Fourth quarter production of 86.0 million tonnes (Rio Tinto share 71.0 million tonnes) was 3% higher than the same period of 2019. Our mines also achieved record total material moved for the year, 7% higher than the previous record from 2019, highlighting the improvements to mine and asset health since 2019. A solid operational performance, considering weather disruptions and strict measures implemented in the second quarter to manage COVID-19.
2020 shipments of 330.6 million tonnes (Rio Tinto share 273.1 million tonnes) were 1% higher than 2019. Shipments were impacted by Cyclone Damien in the first quarter and by the impacts of COVID-19, which also resulted in the deferral of maintenance at the port in the the third quarter. Fourth quarter shipments of 88.9 million tonnes (Rio Tinto share 73.6 million tonnes) were 2% higher than the fourth quarter of 2019.
Whilst the port and rail currently hold the most capacity, the timing impacts of maintenance and grade blending resulted in the gap between final 2020 shipping and production figures.
Achieved realised pricing in 2020 was $91.0 per wet metric tonne on an FOB basis (equivalent to $98.9 per dry metric tonne, at 8% moisture assumption). This compares to the average price for the Platts 62% index of $101.6 per dry metric tonne. In 2019, average pricing was $79.0 per wet metric tonne ($85.9 dry metric tonne).
Lower market premiums for lump, which recovered in the fourth quarter, and the rising price environment throughout 2020 impacted our average achieved pricing compared with Platts due to the structure of our contracts, with approximately 13% of shipments in 2020 priced by reference to the prior quarter’s average index lagged by one month. The remainder was sold either on current quarter average, current month average or on the spot market. Approximately 30% of 2020 sales were made on a free on board (FOB) basis, with the remainder sold including freight.
9

China Portside Trading We continue to ramp up our port sales in China, with 5.5 million tonnes of sales in 2020 including 1.8 million tonnes in the fourth quarter. Our portside operation handles product from our operations in the Pilbara and in Canada as well as third party product, and provides blending and screening capabilities.
10

ALUMINIUMRio Tinto share of production (‘000 tonnes)
Q42020
vs Q42019
vs Q32020
Full Year2020
vs Full Year2019
Bauxite 13,299 -12 % -8 % 56,131 +2 %
Bauxite third party shipments 9,104 -17 % -10 % 39,357 -1 %
Alumina 2,085 +3 % +7 % 8,039 +4 %
Aluminium 815 +4 % +2 % 3,180 0 %
BauxiteBauxite production of 56.1 million tonnes was 2% higher than 2019 supported by the ramp-up of the expansion at the CBG mine in Guinea, and steady performance at the Pacific mines, including additional volumes from the start-up of the Amrun mine in 2019.
Fourth quarter bauxite production was 12% lower than the very strong quarter in 2019, reflecting phasing across the year to align with customer needs and a train failure at the Andoom mine at Weipa. This was partly offset by increased production from the expansion at the non-managed CBG mine in Guinea.
We shipped 39.4 million tonnes of bauxite to third parties in 2020, 1% lower than 2019. Shipments were prioritised throughout the year to align with customer needs, with a higher proportion of internal shipments to the Pacific refineries in the fourth quarter.
AluminaAlumina production of 8.0 million tonnes was 4% higher than 2019 and the fourth quarter was 3% higher than the same period of 2019, as a result of strong production at both our Pacific refineries.
AluminiumAluminium production of 3.2 million tonnes was in line with 2019, with lower volumes from the curtailment of Line 4 at the Tiwai Point smelter in New Zealand and from the Kitimat smelter pot relining campaign, offset by the ramp-up of the Becancour smelter in Quebec, following its restart after a lockout at the end of 2019.
Production of 0.8 million tonnes in the fourth quarter was 4% higher than the fourth quarter of 2019 underpinned by the Becancour smelter operating at full capacity and the Kitimat smelter progressing well on its pot relining campaign.
Average realised aluminium prices including both product and market premiums for value-added products (VAP) were down by 9% to $1,946 per tonne in 2020 (2019: $2,132 per tonne). The LME price decreased by 5% to $1,702 per tonne (2019: $1,791), whilst the mid-west premium duty paid dropped by 2% to $313 per tonne in 2020 due to the impact of COVID-19 (2019: $320 per tonne). Our VAP sales dropped to 43% of primary metal sold in 2020 in line with the market (2019: 51%). Product premiums for VAP sales declined by 9% averaging, $213 per tonne of VAP sold (2019: $234 per tonne). Market demand for VAP rebounded in the fourth quarter of 2020, returning to normal levels. A 10% tariff on Canadian P1020 aluminium imports into the United States was paid between 6 August and 1 September 2020 under Section 232.
In January 2021, Rio Tinto reached an agreement on a new electricity supply agreement with Meridian Energy that allows New Zealand Aluminium Smelter (NZAS) to continue operating the Tiwai Point smelter until December, 2024. The extension of operations provides certainty to employees, the local community and customers while providing more time for all stakeholders to plan for the future.
Work is ongoing on the strategic review of the ISAL smelter in Iceland, announced in February 2020. In July 2020, we submitted a complaint to the Icelandic Competition Authority (ICA), alleging abuse of market dominance by energy supplier Landsvirkjun. Discussions with Landsvirkjun, to improve the competitiveness of the asset, are ongoing.
11

COPPER AND DIAMONDSRio Tinto share of production (‘000 tonnes)
Q42020
vs Q42019
vs Q32020
Full Year2020
vs Full Year2019
Mined copper
Kennecott 33.8 -4 % -2 % 140.0 -25 %
Escondida 84.8 -8 % +2 % 337.8 -1 %
Oyu Tolgoi 14.0 +27 % +15 % 50.2 +2 %
Refined copper
Kennecott 40.9 -21 % +292 % 84.8 -54 %
Escondida 15.2 -26 % +6 % 70.2 -7 %
Rio Tinto share of production (‘000 carats)
Q42020
vs Q42019
vs Q32020
Full Year2020
vs Full Year2019
Argyle 1,893 -44 % -41 % 10,945 -16 %
Diavik 910 +8 % -9 % 3,731 -7 %
KennecottMined copper production was 25% lower than 2019, due to a 28% reduction in grade. This was as a result of lower grades at the end of the east wall mining and sequencing to optimise molybdenum ore production during the extended smelter shutdown in the second and third quarters. Development in the pit progressed despite the effects from the earthquake in March and COVID-19 disruptions. As a result, grades are expected to gradually increase from 2021, with the transition from east to south wall mining.
Refined copper production was 54% lower than 2019 due to the flash converting furnace rebuild required following the earthquake and delays in restarting the smelter following planned major maintenance in mid-2020. The smelter was safely restarted and became fully operational during October. Approximately 60,000 dry metric tonnes of copper concentrate sales were realised in the fourth quarter to manage inventory as a result of the delayed smelter re-start, taking advantage of the strengthened market.
Molybdenum concentrate production was 82% higher than 2019, due to significantly higher head grades in the lower pit of the east wall mine sequence, and productivity improvements. EscondidaMined copper production was 1% lower than 2019, mainly due to 15% lower material stacked into the leaching pads as a result of preventive measures in response to COVID-19, which was offset by 5% higher concentrator throughput in 2020. Refined copper was also impacted by lower material stacked into the leach pads.
Oyu TolgoiMined copper production from the open pit was 2% higher than 2019, reflective of the anticipated move to higher grade areas of the open pit, primarily due to accelerated mine development and production phasing. In the fourth quarter, pit phasing delivered higher gold production (+139%) compared to the prior quarter. Access to higher copper and gold grades is expected to continue throughout 2021. We maintained shipments across the Chinese border despite COVID-19 measures in Mongolia. We continue to work closely with authorities to manage the risk of supply chain disruptions due to COVID-19.
12

Provisional pricingAt 31 December 2020, the Group had approximately 260 million pounds of copper sales that wereprovisionally priced at 336 cents per pound. The final price of these sales will be determined during the firsthalf of 2021. This compares with 220 million pounds of open shipments at 31 December 2019,provisionally priced at 271 cents per pound. Provisional pricing adjustments positively impacted revenues in 2020 by $182 million (2019 positive impact of $6 million).
DiamondsOn 3 November, we announced the final day of mining at Argyle after 37 years of operations. The closure process is expected to take five years to decommission and dismantle the mine and undertake rehabilitation, followed by a further period of monitoring. The penultimate Argyle Pink Diamonds tender continued its trajectory of double digit price growth and a record number of participants with successful bidders from eight countries.
At Diavik, carats recovered in 2020 were 7% lower than 2019, with a 10% grade reduction partially offset by an increase in ore tonnes processed.
13

ENERGY AND MINERALSRio Tinto share of production (million tonnes)
Q42020
vs Q42019
vs Q32020
Full Year2020
vs Full Year2019
Iron ore pellets and concentrate
IOC 2.7 +7 % +17 % 10.4 -1 %
Rio Tinto share of production (’000 tonnes)
Q42020
vs Q42019
vs Q32020
Full Year2020
vs Full Year2019
Minerals
Borates - B2O3 content 100 -22 % -19 % 480 -8 %
Titanium dioxide slag 272 -5 % -7 % 1,120 -7 %
Rio Tinto share of production (’000 lbs)Q4
2020vs Q42019
vs Q32020
Full Year2020
vs Full Year2019
Uranium
Energy Resources of Australia 742 +16 % +1 % 2,870 +9 %
Iron Ore Company of Canada (IOC)Iron ore pellets and concentrate production was 1% lower than 2019 due to an unplanned maintenance at the processing facilities in the third and fourth quarter. Fourth quarter production was 7% higher than corresponding period in 2019.
On 3 December, we signed a Reconciliation and Collaboration Agreement with the Innu communities of Uashat mak Mani-utenam and Matimekush-Lac John. This long term partnership will provide the foundation for a new mutually beneficial relationship based on dialogue, openness and trust between the company and the two communities over the coming decades.
We have continued the optimisation of IOC product mix to match market demand, returning to higher pellet production with all six lines in operation, following signs of recovery in demand from Europe.
BoratesBorates production was 8% lower than 2019 due to a period of lower demand related to COVID-19 uncertainty resulting in an adjustment to refinery operating rates. The extension of a planned shutdown impacted fourth quarter production.
Iron and TitaniumTitanium dioxide production was 7% lower than 2019, as we focused on our value over volume strategy to match market. We experienced operational challenges at Richards Bay Minerals (RBM) due to a submerged dredge in the fourth quarter, and as a result, production was 5% lower than the corresponding quarter in 2019. Mitigations are in place to ensure customer supply throughout 2021.
UraniumOur share of production was 9% higher than 2019, primarily due to our change in shareholding following completion of ERA’s entitlement offer in February 2020 (our shareholding of ERA increased from 68.39 to 86.33 per cent). ERA’s Ranger operation continued to process existing stockpiles uninterrupted during the fourth quarter, with production ceasing as of 8 January 2021, as required.
14

EXPLORATION AND EVALUATIONPre-tax and pre-divestment expenditure on exploration and evaluation charged to the profit and loss account for 2020 was $625 million, compared with $624 million in 2019. Approximately 42% of this expenditure was incurred by central exploration, 40% by Copper & Diamonds, 9% by Energy & Minerals and 9% by Iron Ore.
There were no significant divestments of central exploration properties in 2020.
Exploration highlightsRio Tinto has a strong portfolio of projects with activity in 16 countries across eight commodities in early exploration and studies stages. All projects have followed government COVID-19 requirements and guidelines while focusing on protecting health and well-being of local and Indigenous communities. The bulk of the exploration expenditure in the fourth quarter focused on copper in Australia, Kazakhstan, United States and Zambia, and diamonds projects in Canada. Mine-lease exploration continued at Rio Tinto managed businesses including Pilbara Iron in Australia, and Diavik in Canada.
Our exploration team have won the 2020 Association of Mining and Exploration Companies Prospector of the Year Award in Australia, for our copper-gold discovery at Winu in Western Australia, recognising the most outstanding mineral deposit discovery and the team who made the discovery.
At Falcon, bulk sample processing and final diamond recovery have been completed for ten trenches drilled in 2019, and reported in December 2020. Inspection, valuation and interpretation is ongoing.
A summary of activity for the quarter is as follows:
Commodities Studies Stage Advanced projectsGreenfield/ Brownfield programmes
Bauxite Amargosa, Brazil*; Sanxai, Laos* Cape York, Australia
Base Metals
Copper/molybdenum: Resolution, US;Copper/Gold: Winu, Australia
Copper: La Granja, Peru, Pribrezhniy, KazakhstanNickel: Tamarack, US (3rd party operated)
Copper Greenfield: Australia, Chile, China, Kazakhstan, Nicaragua*, Peru, Serbia, US, Zambia, Brazil, Canada, Colombia*, Finland, Kosovo (3rd party operated)Nickel Greenfield: Canada, Finland
Diamonds Falcon, CanadaDiamonds Greenfield: CanadaDiamonds Brownfield: Diavik
Minerals
Lithium borates: Jadar, SerbiaPotash: KL262, CanadaHeavy mineral sands: Mutamba, Mozambique (3rd party operated)
Iron Ore Pilbara, Australia Pilbara, Australia Brownfield: Pilbara
*Limited activity during the quarter
15

FORWARD-LOOKING STATEMENT
This announcement includes "forward-looking statements" within the meaning of the Private Securities Litigation Reform Act of 1995. All statements other than statements of historical facts included in this announcement, including, without limitation, those regarding Rio Tinto's financial position, business strategy, plans and objectives of management for future operations (including development plans and objectives relating to Rio Tinto's products, production forecasts and reserve and resource positions and any statements related to the ongoing impact of the COVID-19 pandemic), are forward-looking statements. The words "intend", "aim", "project", "anticipate", "estimate", "plan", "believes", "expects", "may", "would", "should", "could", "will", "target", "set to", "seek", "risk" or similar expressions, commonly identify such forward-looking statements.
Such forward-looking statements involve known and unknown risks, uncertainties and other factors which may cause the actual results, performance or achievements of Rio Tinto, or industry results, to be materially different from any future results, performance or achievements expressed or implied by such forward-looking statements. Such forward-looking statements are based on numerous assumptions regarding Rio Tinto's present and future business strategies and the environment in which Rio Tinto will operate in the future. Among the important factors that could cause Rio Tinto's actual results, performance or achievements to differ materially from those in the forward-looking statements are levels of actual production during any period, levels of demand and market prices, the ability to produce and transport products profitably, the impact of foreign currency exchange rates on market prices and operating costs, operational problems, political uncertainty and economic conditions in relevant areas of the world, the actions of competitors, activities by governmental authorities such as changes in taxation or regulation, the risks and uncertainties associated with the ongoing impacts of COVID-19 or other pandemic and such other risk factors identified in Rio Tinto's most recent Annual report and accounts in Australia and the United Kingdom and the most recent Annual report on Form 20-F filed with the United States Securities and Exchange Commission (the "SEC") or Form 6-Ks furnished to, or filed with, the SEC. The above list is not exhaustive. Forward-looking statements should, therefore, be construed in light of such risk factors and undue reliance should not be placed on forward-looking statements, particularly in light of the current economic climate and the significant volatility, uncertainty and disruption caused by the outbreak of COVID-19. These forward-looking statements speak only as of the date of this announcement. Rio Tinto expressly disclaims any obligation or undertaking (except as required by applicable law, the UK Listing Rules, the Disclosure Guidance and Transparency Rules of the Financial Conduct Authority and the Listing Rules of the Australian Securities Exchange) to release publicly any updates or revisions to any forward-looking statement contained herein to reflect any change in Rio Tinto's expectations with regard thereto or any change in events, conditions or circumstances on which any such statement is based.
Nothing in this announcement should be interpreted to mean that future earnings per share of Rio Tinto plc or Rio Tinto Limited will necessarily match or exceed its historical published earnings per share.
16

[email protected] riotinto.com
Follow @RioTinto on Twitter
Media Relations, United KingdomIlltud HarriM +44 7920 503 600
David OuthwaiteT +44 20 7781 1623M +44 7787 597 493
Media Relations, AmericasMatthew KlarT +1 514 608 4429
Media Relations, AsiaGrant DonaldT +65 6679 9290M +65 9722 6028
Media Relations, AustraliaJonathan RoseT +61 3 9283 3088M +61 447 028 913
Matt ChambersT +61 3 9283 3087M +61 433 525 739
Jesse RiseboroughT +61 8 6211 6013M +61 436 653 412
Investor Relations, United KingdomMenno Sanderse T +44 20 7781 1517 M +44 7825 195 178
David OvingtonT +44 20 7781 2051M +44 7920 010 978
Clare PeeverM: +44 7788 967 877
Investor Relations, AustraliaNatalie WorleyT +61 3 9283 3063M +61 409 210 462
Amar Jambaa T +61 3 9283 3627 M +61 472 865 948
Group Company SecretarySteve Allen
Rio Tinto plc6 St James’s SquareLondon SW1Y 4ADUnited KingdomT +44 20 7781 2000Registered in EnglandNo. 719885
Joint Company SecretaryTim Paine
Rio Tinto LimitedLevel 7, 360 Collins StreetMelbourne 3000AustraliaT +61 3 9283 3333Registered in AustraliaABN 96 004 458 404
This announcement is authorised for release to the market by Rio Tinto’s Group Company Secretary.
LEI: 213800YOEO5OQ72G2R82Classification: 3.1 Additional regulated information required to be disclosed under the laws of a Member State
17

Rio Tinto production summary
Rio Tinto share of production
Quarter Full Year % change
2019Q4
2020Q3
2020Q4 2019 2020
Q4 20vs
Q4 19
Q4 20vs
Q3 20
2020vs
2019Principal commodities
Alumina ('000 t) 2,032 1,954 2,085 7,744 8,039 +3 % +7 % +4 %
Aluminium ('000 t) 783 797 815 3,171 3,180 +4 % +2 % 0 %
Bauxite ('000 t) 15,137 14,459 13,299 55,105 56,131 -12 % -8 % +2 %
Borates ('000 t) 128 123 100 520 480 -22 % -19 % -8 %
Copper - mined ('000 t) 138.7 129.6 132.5 577.4 527.9 -4 % +2 % -9 %
Copper - refined ('000 t) 71.9 24.8 56.1 259.6 155.0 -22 % +126 % -40 %
Diamonds ('000 cts) 4,203 4,204 2,803 17,030 14,676 -33 % -33 % -14 %
Iron Ore ('000 t) 71,352 73,707 73,749 281,192 285,932 +3 % 0 % +2 %
Titanium dioxide slag ('000 t) 286 293 272 1,206 1,120 -5 % -7 % -7 %
Uranium ('000 lbs) 642 735 742 2,640 2,870 +16 % +1 % +9 %
Other Metals & Minerals
Gold - mined ('000 oz) 75.0 68.7 89.1 389.7 283.0 +19 % +30 % -27 %
Gold - refined ('000 oz) 63.3 3.7 38.9 218.7 117.5 -39 % +965 % -46 %
Molybdenum ('000 t) 4.7 5.1 6.4 11.2 20.4 +37 % +25 % +82 %
Salt ('000 t) 1,450 1,279 1,113 5,422 4,861 -23 % -13 % -10 %
Silver - mined ('000 oz) 1,209 1,133 1,120 5,412 4,357 -7 % -1 % -19 %
Silver - refined ('000 oz) 839 70 449 2,853 1,363 -46 % +542 % -52 %
Throughout this report, figures in italics indicate adjustments made since the figure was previously quoted on the equivalent page or reported for the first time. Production figures are sometimes more precise than the rounded numbers shown, hence small differences may result between the total of the quarter figures and the year to date figures.
18

Rio Tinto share of production
Rio Tinto interest
Q42019
Q12020
Q22020
Q32020
Q42020
Full Year2019
Full Year2020
ALUMINAProduction ('000 tonnes)
Jonquière (Vaudreuil) 100 % 345 373 340 347 364 1,413 1,424Jonquière (Vaudreuil) specialty Alumina plant 100 % 24 24 25 22 24 109 94
Queensland Alumina 80 % 716 713 711 763 774 2,763 2,961
São Luis (Alumar) 10 % 97 94 95 98 99 368 385
Yarwun 100 % 850 806 820 725 823 3,091 3,175
Rio Tinto total alumina production 2,032 2,010 1,990 1,954 2,085 7,744 8,039
ALUMINIUMProduction ('000 tonnes)
Australia - Bell Bay 100 % 48 47 49 48 48 189 192
Australia - Boyne Island 59 % 74 75 75 76 77 296 303
Australia - Tomago 52 % 76 75 76 77 77 303 305
Canada - six wholly owned 100 % 383 375 370 375 387 1,582 1,506
Canada - Alouette (Sept-Îles) 40 % 62 61 62 63 63 241 249
Canada - Bécancour 25 % 7 18 26 26 29 19 98
Iceland - ISAL (Reykjavik) 100 % 43 45 44 46 48 184 183
New Zealand - Tiwai Point 79 % 69 67 65 66 67 279 265
Oman - Sohar 20 % 20 20 20 20 20 78 79
Rio Tinto total aluminium production 783 783 785 797 815 3,171 3,180
BAUXITEProduction ('000 tonnes) (a)
Gove 100 % 3,273 2,876 3,186 3,147 3,090 12,201 12,299
Porto Trombetas 12 % 371 338 270 396 392 1,327 1,395
Sangaredi (b) 1,227 1,879 1,742 1,920 1,887 6,165 7,428
Weipa 100 % 10,267 8,720 9,362 8,997 7,929 35,411 35,009
Rio Tinto total bauxite production 15,137 13,813 14,560 14,459 13,299 55,105 56,131
(a) Mine production figures for metals refer to the total quantity of metal produced in concentrates, leach liquor or doré bullion irrespective of whether these products are then refined onsite, except for the data for bauxite and iron ore which represent production of marketable quantities of ore plus concentrates and pellets.(b) Rio Tinto has a 22.95% shareholding in the Sangaredi mine but benefits from 45.0% of production.
19

Rio Tinto share of production
Rio Tinto interest
Q42019
Q12020
Q22020
Q32020
Q42020
Full Year2019
Full Year2020
BORATESProduction ('000 tonnes B2O3 content)
Rio Tinto Borates - borates 100 % 128 126 132 123 100 520 480
COPPERMine production ('000 tonnes) (a)
Bingham Canyon 100 % 35.4 35.0 36.5 34.7 33.8 186.8 140.0
Escondida 30 % 92.3 86.2 84.0 82.8 84.8 341.6 337.8
Oyu Tolgoi (b) 34 % 11.0 11.8 12.2 12.2 14.0 49.1 50.2
Rio Tinto total mine production 138.7 133.0 132.8 129.6 132.5 577.4 527.9
Refined production ('000 tonnes)
Escondida 30 % 20.5 20.9 19.7 14.4 15.2 75.0 70.2
Rio Tinto Kennecott 100 % 51.4 26.4 7.2 10.4 40.9 184.6 84.8
Rio Tinto total refined production 71.9 47.2 26.9 24.8 56.1 259.6 155.0
(a) Mine production figures for metals refer to the total quantity of metal produced in concentrates, leach liquor or doré bullion irrespective of whether these products are then refined onsite, except for the data for bauxite and iron ore which represent production of marketable quantities of ore plus concentrates and pellets.(b) Rio Tinto owns a 33.52% indirect interest in Oyu Tolgoi through its 50.79% interest in Turquoise Hill Resources Ltd.
DIAMONDS
Production ('000 carats)
Argyle 100 % 3,363 2,578 3,271 3,203 1,893 12,999 10,945
Diavik 60 % 840 857 963 1,001 910 4,031 3,731Rio Tinto total diamond production 4,203 3,434 4,235 4,204 2,803 17,030 14,676
GOLD
Mine production ('000 ounces) (a)
Bingham Canyon 100 % 52.0 41.9 40.2 43.7 45.3 234.7 171.2
Escondida 30 % 14.8 10.8 13.0 12.7 14.3 74.0 50.9
Oyu Tolgoi (b) 34 % 8.2 8.8 10.4 12.3 29.4 81.1 61.0Rio Tinto total mine production 75.0 61.5 63.6 68.7 89.1 389.7 283.0
Refined production ('000 ounces)Rio Tinto Kennecott 100 % 63.3 44.8 30.1 3.7 38.9 218.7 117.5
(a) Mine production figures for metals refer to the total quantity of metal produced in concentrates, leach liquor or doré bullion irrespective of whether these products are then refined onsite, except for the data for bauxite and iron ore which represent production of marketable quantities of ore plus concentrates and pellets.(b) Rio Tinto owns a 33.52% indirect interest in Oyu Tolgoi through its 50.79% interest in Turquoise Hill Resources Ltd.
20
Rio Tinto share of productionRio Tinto
interestQ4
2019Q1
2020Q2
2020Q3
2020Q4
2020Full Year
2019Full Year
2020
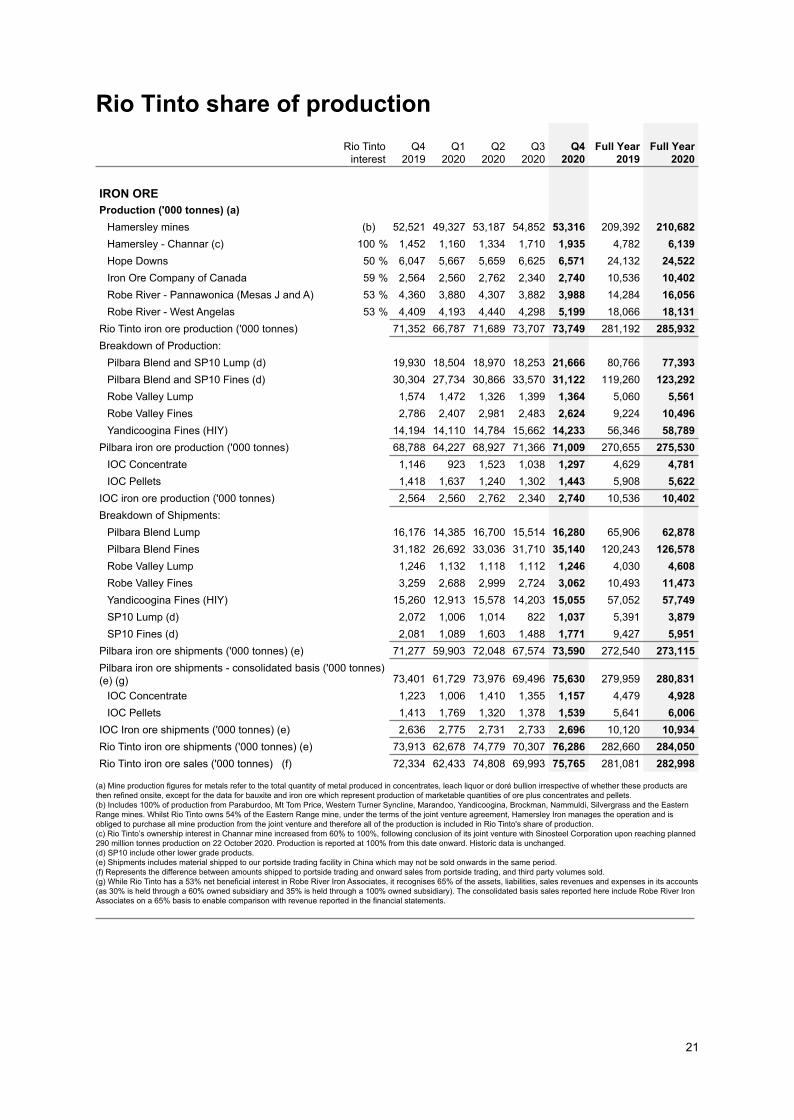
IRON OREProduction ('000 tonnes) (a)
Hamersley mines (b) 52,521 49,327 53,187 54,852 53,316 209,392 210,682Hamersley - Channar (c) 100 % 1,452 1,160 1,334 1,710 1,935 4,782 6,139Hope Downs 50 % 6,047 5,667 5,659 6,625 6,571 24,132 24,522Iron Ore Company of Canada 59 % 2,564 2,560 2,762 2,340 2,740 10,536 10,402Robe River - Pannawonica (Mesas J and A) 53 % 4,360 3,880 4,307 3,882 3,988 14,284 16,056Robe River - West Angelas 53 % 4,409 4,193 4,440 4,298 5,199 18,066 18,131
Rio Tinto iron ore production ('000 tonnes) 71,352 66,787 71,689 73,707 73,749 281,192 285,932Breakdown of Production:
Pilbara Blend and SP10 Lump (d) 19,930 18,504 18,970 18,253 21,666 80,766 77,393Pilbara Blend and SP10 Fines (d) 30,304 27,734 30,866 33,570 31,122 119,260 123,292Robe Valley Lump 1,574 1,472 1,326 1,399 1,364 5,060 5,561Robe Valley Fines 2,786 2,407 2,981 2,483 2,624 9,224 10,496Yandicoogina Fines (HIY) 14,194 14,110 14,784 15,662 14,233 56,346 58,789
Pilbara iron ore production ('000 tonnes) 68,788 64,227 68,927 71,366 71,009 270,655 275,530IOC Concentrate 1,146 923 1,523 1,038 1,297 4,629 4,781IOC Pellets 1,418 1,637 1,240 1,302 1,443 5,908 5,622
IOC iron ore production ('000 tonnes) 2,564 2,560 2,762 2,340 2,740 10,536 10,402Breakdown of Shipments:
Pilbara Blend Lump 16,176 14,385 16,700 15,514 16,280 65,906 62,878Pilbara Blend Fines 31,182 26,692 33,036 31,710 35,140 120,243 126,578Robe Valley Lump 1,246 1,132 1,118 1,112 1,246 4,030 4,608Robe Valley Fines 3,259 2,688 2,999 2,724 3,062 10,493 11,473Yandicoogina Fines (HIY) 15,260 12,913 15,578 14,203 15,055 57,052 57,749SP10 Lump (d) 2,072 1,006 1,014 822 1,037 5,391 3,879SP10 Fines (d) 2,081 1,089 1,603 1,488 1,771 9,427 5,951
Pilbara iron ore shipments ('000 tonnes) (e) 71,277 59,903 72,048 67,574 73,590 272,540 273,115Pilbara iron ore shipments - consolidated basis ('000 tonnes) (e) (g) 73,401 61,729 73,976 69,496 75,630 279,959 280,831
IOC Concentrate 1,223 1,006 1,410 1,355 1,157 4,479 4,928IOC Pellets 1,413 1,769 1,320 1,378 1,539 5,641 6,006
IOC Iron ore shipments ('000 tonnes) (e) 2,636 2,775 2,731 2,733 2,696 10,120 10,934Rio Tinto iron ore shipments ('000 tonnes) (e) 73,913 62,678 74,779 70,307 76,286 282,660 284,050Rio Tinto iron ore sales ('000 tonnes) (f) 72,334 62,433 74,808 69,993 75,765 281,081 282,998
(a) Mine production figures for metals refer to the total quantity of metal produced in concentrates, leach liquor or doré bullion irrespective of whether these products are then refined onsite, except for the data for bauxite and iron ore which represent production of marketable quantities of ore plus concentrates and pellets.(b) Includes 100% of production from Paraburdoo, Mt Tom Price, Western Turner Syncline, Marandoo, Yandicoogina, Brockman, Nammuldi, Silvergrass and the Eastern Range mines. Whilst Rio Tinto owns 54% of the Eastern Range mine, under the terms of the joint venture agreement, Hamersley Iron manages the operation and is obliged to purchase all mine production from the joint venture and therefore all of the production is included in Rio Tinto's share of production.(c) Rio Tinto’s ownership interest in Channar mine increased from 60% to 100%, following conclusion of its joint venture with Sinosteel Corporation upon reaching planned 290 million tonnes production on 22 October 2020. Production is reported at 100% from this date onward. Historic data is unchanged. (d) SP10 include other lower grade products.(e) Shipments includes material shipped to our portside trading facility in China which may not be sold onwards in the same period. (f) Represents the difference between amounts shipped to portside trading and onward sales from portside trading, and third party volumes sold.(g) While Rio Tinto has a 53% net beneficial interest in Robe River Iron Associates, it recognises 65% of the assets, liabilities, sales revenues and expenses in its accounts (as 30% is held through a 60% owned subsidiary and 35% is held through a 100% owned subsidiary). The consolidated basis sales reported here include Robe River Iron Associates on a 65% basis to enable comparison with revenue reported in the financial statements.
21

Rio Tinto share of production
Rio Tinto interest
Q42019
Q12020
Q22020
Q32020
Q42020
Full Year2019
Full Year2020
MOLYBDENUM
Mine production ('000 tonnes) (a)
Bingham Canyon 100 % 4.7 5.1 3.9 5.1 6.4 11.2 20.4
(a) Mine production figures for metals refer to the total quantity of metal produced in concentrates, leach liquor or doré bullion irrespective of whether these products are then refined onsite, except for the data for bauxite and iron ore which represent production of marketable quantities of ore plus concentrates and pellets.
SALT
Production ('000 tonnes)
Dampier Salt 68 % 1,450 1,044 1,425 1,279 1,113 5,422 4,861
SILVER
Mine production ('000 ounces) (a)
Bingham Canyon 100 % 605 538 526 586 555 2,815 2,205
Escondida 30 % 539 417 480 474 488 2,306 1,859
Oyu Tolgoi (b) 34 % 64 72 71 73 77 290 293
Rio Tinto total mine production 1,209 1,027 1,077 1,133 1,120 5,412 4,357
Refined production ('000 ounces)
Rio Tinto Kennecott 100 % 839 462 382 70 449 2,853 1,363
(a) Mine production figures for metals refer to the total quantity of metal produced in concentrates, leach liquor or doré bullion irrespective of whether these products are then refined onsite, except for the data for bauxite and iron ore which represent production of marketable quantities of ore plus concentrates and pellets.(b) Rio Tinto owns a 33.52% indirect interest in Oyu Tolgoi through its 50.79% interest in Turquoise Hill Resources Ltd.
TITANIUM DIOXIDE SLAG
Production ('000 tonnes)Rio Tinto Iron & Titanium (a) 100 % 286 293 262 293 272 1,206 1,120
(a) Quantities comprise 100% of Rio Tinto Fer et Titane and Rio Tinto's 74% interest in Richards Bay Minerals (RBM).
URANIUM
Production ('000 lbs U3O8) (a)
Energy Resources of Australia 86 % 642 676 718 735 742 2,640 2,870
(a) ERA production data are drummed U3O8.On 25 February 2020, Rio Tinto’s ownership interest in ERA increased from 68.39% to 86.33%, following completion of its offer to ensure ERA has the funds it needs to meet its current rehabilitation obligations. Production is reported including this change from 1 March 2020.
Rio Tinto's interest in the Rössing operations were sold in 2019. No data for these operations are included in the Share of production table.
Production figures are sometimes more precise than the rounded numbers shown, hence small differences may result between the total of the quarter figures and the year to date figures.
The Rio Tinto percentage shown above is at 31 December 2020.
22

Rio Tinto operational dataRio Tinto
interestQ4
2019Q1
2020Q2
2020Q3
2020Q4
2020Full Year
2019Full Year
2020
ALUMINASmelter Grade Alumina - Aluminium Group
Alumina production ('000 tonnes)
Australia
Queensland Alumina Refinery - Queensland 80.0 % 895 891 889 953 968 3,454 3,701
Yarwun refinery - Queensland 100.0 % 850 806 820 725 823 3,091 3,175
Brazil
São Luis (Alumar) refinery 10.0 % 966 936 945 976 990 3,679 3,848
Canada
Jonquière (Vaudreuil) refinery - Quebec (a) 100.0 % 345 373 340 347 364 1,413 1,424
(a) Jonquière’s (Vaudreuil’s) production shows smelter grade alumina only and excludes hydrate produced and used for specialty alumina.
Speciality Alumina - Aluminium GroupSpeciality alumina production ('000
CanadaJonquière (Vaudreuil) plant – Quebec 100.0 % 24 24 25 22 24 109 94
Rio Tinto percentage interest shown above is at 31 December 2020. The data represent full production and sales on a 100% basis unless otherwise stated.
23

Rio Tinto operational data
Rio Tinto interest
Q42019
Q12020
Q22020
Q32020
Q42020
Full Year2019
Full Year2020
ALUMINIUM
Primary AluminiumPrimary aluminium production ('000
Australia
Bell Bay smelter - Tasmania 100.0 % 48 47 49 48 48 189 192
Boyne Island smelter - Queensland 59.4 % 125 126 126 128 129 499 510
Tomago smelter - New South Wales 51.6 % 148 145 148 150 149 588 592
Canada
Alma smelter - Quebec 100.0 % 119 118 118 118 119 472 473
Alouette (Sept-Îles) smelter - Quebec 40.0 % 155 153 155 156 158 602 623
Arvida smelter - Quebec 100.0 % 44 44 42 41 41 175 169
Arvida AP60 smelter - Quebec 100.0 % 15 15 15 15 15 60 60
Bécancour smelter - Quebec 25.1 % 28 72 102 104 115 77 393
Grande-Baie smelter - Quebec 100.0 % 59 58 55 55 57 233 225
Kitimat smelter - British Columbia 100.0 % 81 76 78 84 91 385 329
Laterrière smelter - Quebec 100.0 % 65 64 62 62 63 257 250
Iceland
ISAL (Reykjavik) smelter 100.0 % 43 45 44 46 48 184 183
New Zealand
Tiwai Point smelter 79.4 % 87 84 82 84 84 351 333
Oman
Sohar smelter 20.0 % 98 99 99 100 100 391 397
Rio Tinto percentage interest shown above is at 31 December 2020. The data represent full production and sales on a 100% basis unless otherwise stated.
24

Rio Tinto operational data
Rio Tinto interest
Q42019
Q12020
Q22020
Q32020
Q42020
Full Year2019
Full Year2020
BAUXITEBauxite production ('000 tonnes)Australia
Gove mine - Northern Territory 100.0 % 3,273 2,876 3,186 3,147 3,090 12,201 12,299Weipa mine - Queensland 100.0 % 10,267 8,720 9,362 8,997 7,929 35,411 35,009
BrazilPorto Trombetas (MRN) mine 12.0 % 3,090 2,814 2,251 3,296 3,268 11,060 11,629
GuineaSangaredi mine (a) 23.0 % 2,727 4,175 3,871 4,267 4,193 13,701 16,506
Rio Tinto share of bauxite shipments
Share of total bauxite shipments ('000 tonnes) 14,849 13,567 14,668 14,117 12,993 54,607 55,345
Share of third party bauxite shipments ('000 tonnes) 10,968 9,469 10,721 10,064 9,104 39,648 39,357
(a) Rio Tinto has a 22.95% shareholding in the Sangaredi mine but benefits from 45.0% of production.
Rio Tinto interest
Q42019
Q12020
Q22020
Q32020
Q42020
Full Year2019
Full Year2020
BORATESRio Tinto Borates - borates 100.0 %
US
Borates ('000 tonnes) (a) 128 126 132 123 100 520 480
(a) Production is expressed as B2O3 content.
Rio Tinto interest
Q42019
Q12020
Q22020
Q32020
Q42020
Full Year2019
Full Year2020
COPPER & GOLDEscondida 30.0 %
Chile
Sulphide ore to concentrator ('000 tonnes) 33,659 33,440 34,755 34,733 36,303 132,161 139,230
Average copper grade (%) 0.87 0.82 0.81 0.85 0.83 0.85 0.83
Mill production (metals in concentrates):
Contained copper ('000 tonnes) 246.1 230.0 236.8 243.9 246.1 938.9 956.8
Contained gold ('000 ounces) 49.2 36.0 43.4 42.3 47.8 246.7 169.5
Contained silver ('000 ounces) 1,798 1,390 1,599 1,580 1,627 7,687 6,196 Recoverable copper in ore stacked for leaching ('000 tonnes) (a) 61.7 57.2 43.3 32.1 36.5 199.7 169.1
Refined production from leach plants:
Copper cathode production ('000 tonnes) 68.4 69.6 65.5 47.9 50.8 250.2 233.9
(a) The calculation of copper in material mined for leaching is based on ore stacked at the leach pad.
Rio Tinto percentage interest shown above is at 31 December 2020. The data represent full production and sales on a 100% basis unless otherwise stated.
25

Rio Tinto operational dataRio Tinto
interestQ4
2019Q1
2020Q2
2020Q3
2020Q4
2020Full Year
2019Full Year
2020
COPPER & GOLD (continued)Rio Tinto Kennecott
Bingham Canyon mine 100.0 %
Utah, US
Ore treated ('000 tonnes) 11,141 10,315 10,083 12,860 11,418 42,033 44,676
Average ore grade:
Copper (%) 0.36 0.37 0.41 0.32 0.34 0.50 0.36
Gold (g/t) 0.23 0.22 0.23 0.21 0.22 0.28 0.22
Silver (g/t) 2.09 2.16 2.14 2.00 2.07 2.60 2.08
Molybdenum (%) 0.061 0.058 0.056 0.053 0.068 0.043 0.059
Copper concentrates produced ('000 tonnes) 156 148 135 140 138 731 561
Average concentrate grade (% Cu) 22.6 23.7 26.6 24.7 24.2 25.5 24.8
Production of metals in copper concentrates:
Copper ('000 tonnes) (a) 35.4 35.0 36.5 34.7 33.8 186.8 140.0
Gold ('000 ounces) 52.0 41.9 40.2 43.7 45.3 234.7 171.2
Silver ('000 ounces) 605 538 526 586 555 2,815 2,205 Molybdenum concentrates produced ('000 tonnes): 9.4 10.4 7.8 10.3 12.2 22.4 40.7
Molybdenum in concentrates ('000 tonnes) 4.7 5.1 3.9 5.1 6.4 11.2 20.4
Kennecott smelter & refinery 100.0 %
Copper concentrates smelted ('000 tonnes) 216 161 51 1 234 787 448
Copper anodes produced ('000 tonnes) (b) 53.7 24.0 (2.1) 20.2 44.8 186.6 86.9
Production of refined metal:
Copper ('000 tonnes) 51.4 26.4 7.2 10.4 40.9 184.6 84.8
Gold ('000 ounces) (c) 63.3 44.8 30.1 3.7 38.9 218.7 117.5
Silver ('000 ounces) (c) 839 462 382 70 449 2,853 1,363
(a) Includes a small amount of copper in precipitates.(b) New metal excluding recycled material.(c) Includes gold and silver in intermediate products.
Rio Tinto percentage interest shown above is at 31 December 2020. The data represent full production and sales on a 100% basis unless otherwise stated.
26

Rio Tinto operational data
Rio Tinto interest
Q42019
Q12020
Q22020
Q32020
Q42020
Full Year2019
Full Year2020
COPPER & GOLD (continued)Turquoise Hill Resources
Oyu Tolgoi mine (a) 33.5 %
Mongolia
Ore Treated ('000 tonnes) 11,088 10,889 9,645 10,072 9,594 40,777 40,200
Average mill head grades:
Copper (%) 0.42 0.42 0.47 0.45 0.50 0.45 0.46
Gold (g/t) 0.15 0.15 0.19 0.21 0.41 0.29 0.24
Silver (g/t) 1.06 1.14 1.22 1.22 1.16 1.13 1.18Copper concentrates produced ('000 tonnes) 152.6 164.5 169.9 168.5 190.2 674.6 693.1
Average concentrate grade (% Cu) 21.6 21.4 21.5 21.5 21.9 21.7 21.6
Production of metals in concentrates:
Copper in concentrates ('000 tonnes) 32.9 35.2 36.5 36.3 41.6 146.3 149.6
Gold in concentrates ('000 ounces) 24.3 26.2 31.1 36.7 87.8 241.8 181.9
Silver in concentrates ('000 ounces) 190 214 212 219 231 867 876
Sales of metals in concentrates:
Copper in concentrates ('000 tonnes) 32.3 25.8 39.7 34.4 37.9 149.9 137.8
Gold in concentrates ('000 ounces) 24.7 19.7 30.8 33.6 65.8 273.6 150.0
Silver in concentrates ('000 ounces) 244 146 220 201 194 896 760
(a) Rio Tinto owns a 33.52% indirect interest in Oyu Tolgoi through its 50.79% interest in Turquoise Hill Resources.
Rio Tinto interest
Q42019
Q12020
Q22020
Q32020
Q42020
Full Year2019
Full Year2020
DIAMONDS
Argyle Diamonds 100.0 %
Western Australia
AK1 ore processed ('000 tonnes) 1,977 1,322 1,571 1,802 1,078 6,367 5,773
AK1 diamonds produced ('000 carats) 3,363 2,578 3,271 3,203 1,893 12,999 10,945
Diavik Diamonds 60.0 %
Northwest Territories, Canada
Ore processed ('000 tonnes) 516 571 626 679 643 2,435 2,518
Diamonds recovered ('000 carats) 1,400 1,428 1,606 1,668 1,517 6,719 6,218
Rio Tinto percentage interest shown above is at 31 December 2020. The data represent full production and sales on a 100% basis unless otherwise stated.
27
Rio Tinto operational dataRio Tinto
interestQ4
2019Q1
2020Q2
2020Q3
2020Q4
2020Full Year
2019Full Year
2020
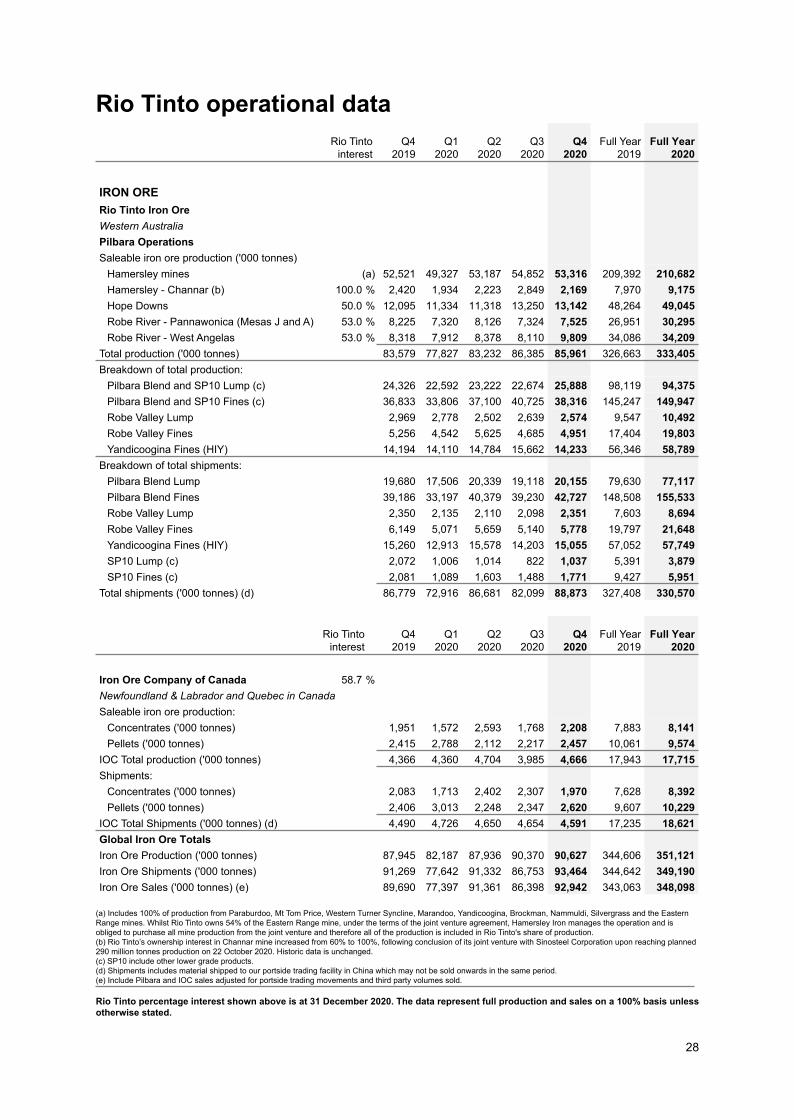
IRON ORERio Tinto Iron OreWestern AustraliaPilbara OperationsSaleable iron ore production ('000 tonnes)
Hamersley mines (a) 52,521 49,327 53,187 54,852 53,316 209,392 210,682Hamersley - Channar (b) 100.0 % 2,420 1,934 2,223 2,849 2,169 7,970 9,175Hope Downs 50.0 % 12,095 11,334 11,318 13,250 13,142 48,264 49,045Robe River - Pannawonica (Mesas J and A) 53.0 % 8,225 7,320 8,126 7,324 7,525 26,951 30,295Robe River - West Angelas 53.0 % 8,318 7,912 8,378 8,110 9,809 34,086 34,209
Total production ('000 tonnes) 83,579 77,827 83,232 86,385 85,961 326,663 333,405Breakdown of total production:
Pilbara Blend and SP10 Lump (c) 24,326 22,592 23,222 22,674 25,888 98,119 94,375Pilbara Blend and SP10 Fines (c) 36,833 33,806 37,100 40,725 38,316 145,247 149,947Robe Valley Lump 2,969 2,778 2,502 2,639 2,574 9,547 10,492Robe Valley Fines 5,256 4,542 5,625 4,685 4,951 17,404 19,803Yandicoogina Fines (HIY) 14,194 14,110 14,784 15,662 14,233 56,346 58,789
Breakdown of total shipments:Pilbara Blend Lump 19,680 17,506 20,339 19,118 20,155 79,630 77,117Pilbara Blend Fines 39,186 33,197 40,379 39,230 42,727 148,508 155,533Robe Valley Lump 2,350 2,135 2,110 2,098 2,351 7,603 8,694Robe Valley Fines 6,149 5,071 5,659 5,140 5,778 19,797 21,648Yandicoogina Fines (HIY) 15,260 12,913 15,578 14,203 15,055 57,052 57,749SP10 Lump (c) 2,072 1,006 1,014 822 1,037 5,391 3,879SP10 Fines (c) 2,081 1,089 1,603 1,488 1,771 9,427 5,951
Total shipments ('000 tonnes) (d) 86,779 72,916 86,681 82,099 88,873 327,408 330,570
Rio Tinto interest
Q42019
Q12020
Q22020
Q32020
Q42020
Full Year2019
Full Year2020
Iron Ore Company of Canada 58.7 %Newfoundland & Labrador and Quebec in CanadaSaleable iron ore production:
Concentrates ('000 tonnes) 1,951 1,572 2,593 1,768 2,208 7,883 8,141Pellets ('000 tonnes) 2,415 2,788 2,112 2,217 2,457 10,061 9,574
IOC Total production ('000 tonnes) 4,366 4,360 4,704 3,985 4,666 17,943 17,715Shipments:
Concentrates ('000 tonnes) 2,083 1,713 2,402 2,307 1,970 7,628 8,392Pellets ('000 tonnes) 2,406 3,013 2,248 2,347 2,620 9,607 10,229
IOC Total Shipments ('000 tonnes) (d) 4,490 4,726 4,650 4,654 4,591 17,235 18,621Global Iron Ore TotalsIron Ore Production ('000 tonnes) 87,945 82,187 87,936 90,370 90,627 344,606 351,121Iron Ore Shipments ('000 tonnes) 91,269 77,642 91,332 86,753 93,464 344,642 349,190Iron Ore Sales ('000 tonnes) (e) 89,690 77,397 91,361 86,398 92,942 343,063 348,098
(a) Includes 100% of production from Paraburdoo, Mt Tom Price, Western Turner Syncline, Marandoo, Yandicoogina, Brockman, Nammuldi, Silvergrass and the Eastern Range mines. Whilst Rio Tinto owns 54% of the Eastern Range mine, under the terms of the joint venture agreement, Hamersley Iron manages the operation and is obliged to purchase all mine production from the joint venture and therefore all of the production is included in Rio Tinto's share of production.(b) Rio Tinto’s ownership interest in Channar mine increased from 60% to 100%, following conclusion of its joint venture with Sinosteel Corporation upon reaching planned 290 million tonnes production on 22 October 2020. Historic data is unchanged. (c) SP10 include other lower grade products. (d) Shipments includes material shipped to our portside trading facility in China which may not be sold onwards in the same period.(e) Include Pilbara and IOC sales adjusted for portside trading movements and third party volumes sold.
Rio Tinto percentage interest shown above is at 31 December 2020. The data represent full production and sales on a 100% basis unless otherwise stated.
28
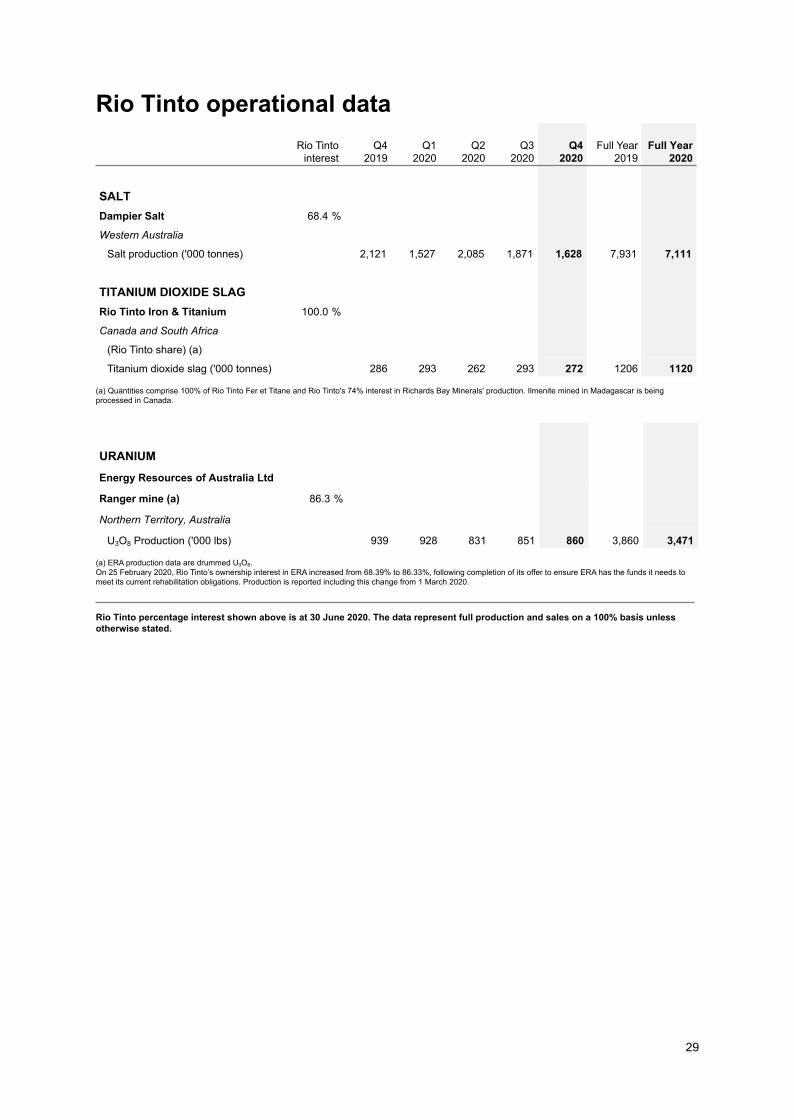
Rio Tinto operational dataRio Tinto
interestQ4
2019Q1
2020Q2
2020Q3
2020Q4
2020Full Year
2019Full Year
2020
SALTDampier Salt 68.4 %
Western Australia
Salt production ('000 tonnes) 2,121 1,527 2,085 1,871 1,628 7,931 7,111
TITANIUM DIOXIDE SLAGRio Tinto Iron & Titanium 100.0 %
Canada and South Africa
(Rio Tinto share) (a)
Titanium dioxide slag ('000 tonnes) 286 293 262 293 272 1206 1120
(a) Quantities comprise 100% of Rio Tinto Fer et Titane and Rio Tinto's 74% interest in Richards Bay Minerals' production. Ilmenite mined in Madagascar is being processed in Canada.
URANIUM
Energy Resources of Australia Ltd
Ranger mine (a) 86.3 %
Northern Territory, Australia
U3O8 Production ('000 lbs) 939 928 831 851 860 3,860 3,471
(a) ERA production data are drummed U3O8.On 25 February 2020, Rio Tinto’s ownership interest in ERA increased from 68.39% to 86.33%, following completion of its offer to ensure ERA has the funds it needs to meet its current rehabilitation obligations. Production is reported including this change from 1 March 2020.
Rio Tinto percentage interest shown above is at 30 June 2020. The data represent full production and sales on a 100% basis unless otherwise stated.
29