notes to the financial contents statements - intertek · 92 intertek group plc annual report and...
TRANSCRIPT

INTERTEK GROUP PLC ANNUAL REPORT AND ACCOUNTS 201692
FINANCIAL STATEMENTS CONTENTS
CONTENTS
93 Consolidated income statement94 Consolidated statement of comprehensive income95 Consolidated statement of financial position96 Consolidated statement of changes in equity 97 Consolidated statement of cash flows98 Notes to the financial statements140 Intertek Group plc – Company balance sheet141 Intertek Group plc – Company statement of
changes in equity142 Notes to the Company financial statements
NOTES TO THE FINANCIAL STATEMENTS Note98 1 Significant accounting policies100 2 Operating segments and presentation of results103 3 Separately Disclosed Items104 4 Expenses and auditor’s remuneration104 5 Employees105 6 Taxation108 7 Earnings per ordinary share109 8 Property, plant and equipment111 9 Goodwill and other intangible assets115 10 Acquisitions117 11 Trade and other receivables118 12 Trade and other payables118 13 Provisions119 14 Borrowings and financial instruments126 15 Capital and reserves127 16 Employee benefits131 17 Share schemes132 18 Subsequent events132 19 Capital management133 20 Non-controlling interest133 21 Related parties133 22 Contingent liabilities134 23 Principal Group Companies

INTERTEK GROUP PLC ANNUAL REPORT AND ACCOUNTS 2016 93
FINANCIAL STATEMENTSCONSOLIDATED PRIMARY STATEMENTS
For the year ended 31 December 2016 Notes
Adjusted results
£m
Separately Disclosed
Items* £m
Total2016
£m
Adjusted results
£m
Separately Disclosed
Items* £m
Total2015
£m
Revenue 2 2,567.0 – 2,567.0 2,166.3 – 2,166.3Operating costs (2,157.3) (40.2) (2,197.5) (1,822.9) (626.9) (2,449.8)Group operating profit/(loss) 2 409.7 (40.2) 369.5 343.4 (626.9) (283.5)
Finance income 14 0.9 – 0.9 1.0 – 1.0Finance expense 14 (23.3) – (23.3) (25.2) – (25.2)Net financing costs (22.4) – (22.4) (24.2) – (24.2)
Profit/(loss) before income tax 387.3 (40.2) 347.1 319.2 (626.9) (307.7)Income tax expense 6 (98.0) 22.5 (75.5) (77.5) 38.2 (39.3)Profit/(loss) for the year 2 289.3 (17.7) 271.6 241.7 (588.7) (347.0)
Attributable to: Equity holders of the Company 272.7 (17.7) 255.0 228.2 (588.7) (360.5) Non-controlling interest 20 16.6 – 16.6 13.5 – 13.5Profit/(loss) for the year 289.3 (17.7) 271.6 241.7 (588.7) (347.0)
Earnings per share**Basic 7 158.5p (224.2)pDiluted 7 156.8p (224.2)p* See note 3.** Earnings per share on the adjusted results is disclosed in note 7.
CONSOLIDATED INCOME STATEMENT

INTERTEK GROUP PLC ANNUAL REPORT AND ACCOUNTS 201694
FINANCIAL STATEMENTS CONSOLIDATED PRIMARY STATEMENTS
For the year ended 31 December 2016 Notes2016
£m2015
£m
Profit/(loss) for the year 2 271.6 (347.0)Other comprehensive incomeRemeasurements on defined benefit pension schemes 16 (5.2) (2.2)Income tax recognised in other comprehensive income 6 – –Items that will never be reclassified to profit or loss (5.2) (2.2)Foreign exchange translation differences of foreign operations 14 279.5 2.0Net exchange loss on hedges of net investments in foreign operations 14 (194.1) (33.1)Gain/(loss) on fair value of cash flow hedges 14.3 –Tax on items that are or may be reclassified subsequently to profit or loss 6 2.8 3.0Items that are or may be reclassified subsequently to profit or loss 102.5 (28.1)Total other comprehensive expense for the year 97.3 (30.3)Total comprehensive income/(expense) for the year 368.9 (377.3)
Total comprehensive income/(expense) for the year attributable to: Equity holders of the Company 347.2 (391.8)
Non-controlling interest 20 21.7 14.5Total comprehensive income/(expense) for the year 368.9 (377.3)
CONSOLIDATED STATEMENT OF COMPREHENSIVE INCOME

INTERTEK GROUP PLC ANNUAL REPORT AND ACCOUNTS 2016 95
FINANCIAL STATEMENTSCONSOLIDATED PRIMARY STATEMENTS
CONSOLIDATED STATEMENT OF FINANCIAL POSITION
As at 31 December 2016 Notes2016
£m
Restated2015
£m
AssetsProperty, plant and equipment 8 443.3 365.3Goodwill 9 586.1 471.1Other intangible assets 9 198.8 160.4Investments in associates 0.3 0.3Deferred tax assets 6 48.3 42.7Total non-current assets 1,276.8 1,039.8Inventories 19.1 16.1Trade and other receivables 11 651.8 583.5Cash and cash equivalents 14 175.6 141.1Current tax receivable 23.0 15.6Total current assets 869.5 756.3
Total assets 2,146.3 1,796.1
LiabilitiesInterest bearing loans and borrowings 14 (103.4) (121.8)Current taxes payable (55.8) (52.6)Trade and other payables 12 (406.8) (356.6)Provisions 13 (34.0) (30.7)Total current liabilities (600.0) (561.7)Interest bearing loans and borrowings 14 (815.9) (794.7)Deferred tax liabilities 6 (48.7) (51.7)Net pension liabilities 16 (31.8) (26.9)Other payables 12 (33.7) (17.3)Provisions 13 (13.8) (4.4)Total non-current liabilities (943.9) (895.0)
Total liabilities (1,543.9) (1,456.7)
Net assets 602.4 339.4
EquityShare capital 15 1.6 1.6Share premium 257.8 257.8Other reserves 35.3 (58.0)Retained earnings 273.0 110.2Total equity attributable to equity holders of the Company 567.7 311.6Non-controlling interest 20 34.7 27.8
Total equity 602.4 339.4
The financial statements on pages 93 to 139 were approved by the Board on 6 March 2017 and were signed on its behalf by:
André Lacroix Edward LeighChief Executive Officer Chief Financial Officer

INTERTEK GROUP PLC ANNUAL REPORT AND ACCOUNTS 201696
FINANCIAL STATEMENTS CONSOLIDATED PRIMARY STATEMENTS
For the year ended 31 December 2016
Attributable to equity holders of the Company
Notes
Share capital
£m
Share premium
£m
Other reserves
Retained earnings
£m
Total before
non-controlling
interest £m
Translation reserve
£mOther
£m
Non-controlling
interest£m
Total equity
£m
At 1 January 2015 1.6 257.8 (32.3) 6.4 547.1 780.6 26.1 806.7Total comprehensive income for the year(Loss)/profit – – – – (360.5) (360.5) 13.5 (347.0)Other comprehensive income – – (32.1) – 0.8 (31.3) 1.0 (30.3)Total comprehensive income for the year – – (32.1) – (359.7) (391.8) 14.5 (377.3)Transactions with owners of the
company recognised directly in equityContributions by and distributions to the
owners of the companyDividends paid 15 – – – – (80.7) (80.7) (13.3) (94.0)Adjustment arising from changes in
non-controlling interest 20 – – – – (0.7) (0.7) 0.5 (0.2)Purchase of own shares 15 – – – – (5.2) (5.2) – (5.2)Tax paid on Share Awards vested* 17 – – – – (3.0) (3.0) – (3.0)Equity-settled transactions 17 – – – – 12.9 12.9 – 12.9Income tax on equity-settled transactions 6 – – – – (0.5) (0.5) – (0.5)Total contributions by and distributions
to the owners of the company – – – – (77.2) (77.2) (12.8) (90.0)At 31 December 2015 1.6 257.8 (64.4) 6.4 110.2 311.6 27.8 339.4
At 1 January 2016 1.6 257.8 (64.4) 6.4 110.2 311.6 27.8 339.4Total comprehensive income for the yearProfit – – – – 255.0 255.0 16.6 271.6Other comprehensive income – – 79.0 14.3 (1.1) 92.2 5.1 97.3Total comprehensive income for the year – – 79.0 14.3 253.9 347.2 21.7 368.9Transactions with owners of the
company recognised directly in equityContributions by and distributions to the
owners of the companyDividends paid 15 – – – – (88.0) (88.0) (16.3) (104.3)Adjustment arising from changes in
non-controlling interest 20 – – – – – – 1.5 1.5Put option liability over non-controlling interest 10 – – – – (8.6) (8.6) – (8.6)Issue of share capital 15 – – – – – – – –Purchase of own shares 15 – – – – (6.4) (6.4) – (6.4)Tax paid on Share Awards vested* 17 – – – – (5.2) (5.2) – (5.2)Equity-settled transactions 17 – – – – 16.6 16.6 – 16.6Income tax on equity-settled transactions 6 – – – – 0.5 0.5 – 0.5Total contributions by and distributions
to the owners of the company – – – – (91.1) (91.1) (14.8) (105.9)At 31 December 2016 1.6 257.8 14.6 20.7 273.0 567.7 34.7 602.4* The tax paid on share awards vested is related to settlement of the tax obligation on behalf of employees by the Group via the sale of a portion of the
equity-settled shares.
CONSOLIDATED STATEMENT OF CHANGES IN EQUITY

INTERTEK GROUP PLC ANNUAL REPORT AND ACCOUNTS 2016 97
FINANCIAL STATEMENTSCONSOLIDATED PRIMARY STATEMENTS
CONSOLIDATED STATEMENT OF CASH FLOWS
For the year ended 31 December 2016 Notes2016
£m2015
£m
Cash flows from operating activitiesProfit/(loss) for the year 2 271.6 (347.0)Adjustments for:Depreciation charge 8 76.4 75.1Amortisation of software 9 13.1 10.1Amortisation of acquisition intangibles 9 14.0 21.4Impairment of goodwill and other assets 8,9 – 589.4Equity-settled transactions 17 16.6 12.9Net financing costs 14 22.4 24.2Income tax expense 6 75.5 39.3(Profit)/loss on disposal of Subsidiary (0.4) –Loss/(profit) on disposal of Associate 2.4 –(Profit)/loss on disposal of property, plant, equipment and software (0.1) 0.2Operating cash flows before changes in working capital and operating provisions 491.5 425.6Change in inventories – (1.0)Change in trade and other receivables 28.8 (10.8)Change in trade and other payables 21.9 24.9Change in provisions 4.0 6.4Special contributions into pension schemes 16 (2.8) (2.8)Cash generated from operations 543.4 442.3Interest and other finance expense paid (29.7) (26.4)Income taxes paid (94.1) (70.8)Net cash flows generated from operating activities 419.6 345.1
Cash flows from investing activitiesProceeds from sale of property, plant, equipment and software 3.0 1.3Interest received 1.0 1.0Acquisition of subsidiaries, net of cash acquired 10 (34.8) (231.3)Consideration paid in respect of prior year acquisitions 13 (2.0) –Purchase of non-controlling interest 20 – (0.3)Sale/(Purchase) of Subsidiary 2.0 –(Purchase)/Sale of associate (3.4) 1.1Acquisition of property, plant, equipment and software 8,9 (105.5) (112.2)Net cash flows used in investing activities (139.7) (340.4)
Cash flows from financing activitiesPurchase of own shares 15 (6.4) (5.2)Tax paid on share awards vested (5.2) (3.0)Drawdown of borrowings 0.2 169.0Repayment of borrowings (170.5) (63.5)Dividends paid to non-controlling interest 20 (16.3) (13.3)Equity dividends paid 15 (88.0) (80.7)Net cash flow used in financing activities (286.2) 3.3
Net (decrease)/increase in cash and cash equivalents 14 (6.3) 8.0Cash and cash equivalents at 1 January 14 116.0 119.5Exchange adjustments 14 49.1 (11.5)Cash and cash equivalents at 31 December 14 158.8 116.0
The notes on pages 98 to 139 are an integral part of these consolidated financial statements.
Cash outflow relating to Separately Disclosed Items was £21.9m for year ended 31 December 2016 (2015: £23.4m).

INTERTEK GROUP PLC ANNUAL REPORT AND ACCOUNTS 201698
FINANCIAL STATEMENTS NOTES TO THE FINANCIAL STATEMENTS
1 Significant accounting policiesBASIS OF PREPARATIONAccounting policies applicable to more than one section of the financial statements are shown below. Where accounting policies relate to a specific note in the financial statements, they are set out within that note, to provide readers of the financial statements with a more useful layout to the financial information presented.
Statement of complianceIntertek Group plc is a company incorporated and domiciled in the UK.
The Group financial statements as at and for the year ended 31 December 2016 consolidate those of the Company and its subsidiaries (together referred to as the Group) and include the Group’s interest in associates. The Group financial statements have been prepared and approved by the Directors in accordance with International Financial Reporting Standards as adopted by the EU (‘IFRSs’). The Parent Company financial statements present information about the Company as a separate entity and not about its Group. The Company has elected to prepare its Parent Company financial statements in accordance with UK GAAP; these are presented on pages 140 to 144.
IFRSs announced but not yet effectiveThe following IFRSs have been announced, but are not yet effective, in the preparation of these financial statements. Their adoption is not expected to have a material effect on the financial statements, unless otherwise indicated. Certain of these standards and interpretations will, when adopted, require addition to, or amendment of, disclosures in the accounts.
IFRS 15 Revenue from contracts with customers (effective 1 January 2018) – management has completed its initial analysis of this standard and to date its adoption is not expected to have material impact on the timing of revenue recognition based on the Group’s current revenue streams. However, the impact of adopting this standard cannot be reliably estimated until this work is complete and is expected to primarily affect the revenue recognised on long-term projects where time incurred is billed at agreed rates on a periodic basis, or staged payment invoicing occurs, requiring an assessment of percentage completion.
IFRS 16 Leases (not yet endorsed by the EU, effective 1 January 2019) – IFRS 16 requires lessees to recognise a lease liability reflecting future lease payments and a right-of-use asset for lease contracts, subject to limited exceptions for short-term leases and leases of low value assets. The quantitative impact of IFRS 16 on the Group’s net assets and results is in the process of being assessed, and management has collated its initial data set to determine the impact on the Group. IFRS 16 is expected to have a material impact on the balance sheet as both assets and liabilities will increase, and is also expected to have a material impact on key components within the income statement, as operating lease rental charges will be replaced by depreciation and finance costs. Please refer to Note 8 to the financial statements which gives an indication of the Group's total operating lease commitments. IFRS 16 will not have any impact on the underlying commercial performance of the Group nor the cash flows generated in the year.
IFRS 9 Financial Instruments (effective 1 January 2018) – whilst management has performed an initial review, the potential impact of this new standard will be quantified closer to the date of adoption.
Measurement conventionThe financial statements are prepared on the historical cost basis except as discussed in the relevant accounting policies.
Functional and presentation currencyThese consolidated financial statements are presented in sterling, which is the Company’s functional currency. All information presented in sterling has been rounded to the nearest £0.1m.
Changes in accounting policiesThe accounting policies set out in these financial statements have been applied consistently to all years presented. A number of new standards, amendments to standards and interpretations are effective for annual periods beginning on or after 1 January 2016, but do not have a significant effect on the consolidated financial statements of the Group.
Revision of disclosureFollowing an agenda decision by the IFRS Interpretations Committee in March 2016 regarding offsetting and cash pool arrangements, the Group has revised the disclosure of its cash pooling arrangements in the comparative balance sheet at 31 December 2015.
This revision has had the effect of increasing both cash and cash equivalents and interest bearing loans and borrowings by £25.1m at 31 December 2015. There is no change to the results or cash flows for the period to 31 December 2015. The impact at 1 January 2015 amounted to £42.9m.
Going concernThe Board has reviewed forecasts, including forecasts adjusted for significantly worse economic conditions. The Board has also reviewed the Group’s funding requirements and the available debt facilities. As a result of these reviews the Board remains satisfied with the Group’s funding and liquidity position and believe that the Group is well placed to manage its business risks successfully. In addition, on the basis of its forecasts, both base case and stressed, and available facilities, which are described in note 14, the Board has concluded that the going concern basis of preparation continues to be appropriate.
NOTES TO THE FINANCIAL STATEMENTS

INTERTEK GROUP PLC ANNUAL REPORT AND ACCOUNTS 2016 99
FINANCIAL STATEMENTSNOTES TO THE FINANCIAL STATEMENTS
1 Significant accounting policies (continued) BASIS OF CONSOLIDATIONSubsidiariesSubsidiaries are those entities controlled by the Group. Control exists when the Group has power to direct the relevant activities, exposure to variable returns from the investee and the ability to use its power over the investee to affect the amount of investor returns. The financial statements of subsidiaries are included in the consolidated financial statements from the date that control commences until the date that control ceases.
For purchases of non-controlling interest in subsidiaries, the difference between the cost of the additional interest in the subsidiary and the non-controlling interest’s share of the assets and liabilities reflected in the consolidated statement of financial position at the date of acquisition, is reflected directly in shareholders’ equity.
Transactions eliminated on consolidationIntra-group balances and transactions, and any unrealised gains and losses or income and expenses arising from intra-group transactions, are eliminated in preparing the consolidated financial statements. Unrealised losses are eliminated in the same way as unrealised gains, but only to the extent that there is no evidence of impairment.
FOREIGN CURRENCYForeign currency transactionsTransactions in foreign currencies are translated to the respective functional currencies of Group entities at the foreign exchange rate ruling at the date of the transaction. Monetary assets and liabilities (for example cash, trade receivables, trade payables) denominated in foreign currencies at the reporting date are translated at the foreign exchange rate ruling at that date. Foreign exchange differences arising on translation are generally recognised in the income statement. Non-monetary assets and liabilities that are measured in terms of historical cost in a foreign currency are translated using the exchange rate at the date of the transaction. For the policy on hedging of foreign currency transactions see note 14.
Foreign operationsThe assets and liabilities of foreign operations, including goodwill and fair value adjustments arising on acquisition, are translated to sterling at foreign exchange rates ruling at the reporting date.
The income and expenses of foreign operations are translated into sterling at cumulative average rates of exchange during the year. Exchange differences arising from the translation of foreign operations are taken directly to equity in the translation reserve. They are released to the income statement upon disposal. For the policy on net investment hedging see note 14.
The most significant currencies for the Group were translated at the following exchange rates:
Value of £1
Assets and liabilitiesActual rates
Income and expensesCumulative average rates
31 Dec 2016 31 Dec 2015 2016 2015
US dollar 1.22 1.48 1.35 1.53Euro 1.17 1.36 1.23 1.38Chinese renminbi 8.51 9.61 8.98 9.62Hong Kong dollar 9.49 11.48 10.52 11.87Australian dollar 1.70 2.03 1.83 2.04
USE OF JUDGEMENTS AND ESTIMATESThe preparation of financial statements in conformity with IFRSs requires management to make judgements and estimates that affect the application of accounting policies and the reported amounts of assets, liabilities, income and expenses. Actual results may differ from these estimates. Estimates and underlying assumptions are reviewed on an ongoing basis. Revisions to accounting estimates are recognised in the year in which the estimates are revised and in any future years affected.
JUDGEMENTSIn applying the Group’s accounting policies, management has applied judgement in the following areas that have a significant impact on the amounts recognised in the financial statements.
Income and deferred taxThe tax on profits is determined according to complex tax laws and regulations. Where the effect of these laws and regulations is unclear, judgements are used in determining the liability for the tax to be paid. Deferred tax assets and liabilities require management judgement in determining the amounts to be recognised, with consideration given to the timing and level of future taxable income. The main areas of judgement in the Group tax calculation are the tax provisions for the full year and the recognition of the UK deferred tax asset; see note 6.
Basis of consolidationJudgement is applied when determining if the Group controls a subsidiary. In assessing control, the Group considers whether it has power over the investee to affect the amount of investor returns; see above ‘Basis of consolidation’ policy.

INTERTEK GROUP PLC ANNUAL REPORT AND ACCOUNTS 2016100
FINANCIAL STATEMENTS NOTES TO THE FINANCIAL STATEMENTS
NOTES TO THE FINANCIAL STATEMENTS continuedNOTES TO THE FINANCIAL STATEMENTS continued1 Significant accounting policies (continued)Intangible assetsWhen the Group makes an acquisition, management determines whether any intangible assets should be recognised separately from goodwill, and the amounts at which to recognise those assets; see note 9.
RestructuringIn making a provision and classifying costs as restructuring, management has used its judgement to assess the specific circumstances of each local and regional restructuring proposal, including an estimate of future costs and timing of completion.
Put option over non-controlling interestThe calculation of the fair value of put options over the non-controlling interest in the Group’s businesses in the relevant countries required the use of judgement in the application of key assumptions around the future performance of those businesses; the risk adjusted discount rate taking into account the risk free rate and the gross domestic product growth in those countries.
ESTIMATESDiscussed below are key assumptions concerning the future, and other key sources of estimation at the reporting date, that could have a risk of causing a material adjustment to the carrying amount of assets and liabilities within the next financial year.
ClaimsIn making provision for claims, management bases its estimate on the circumstances relating to each specific event, internal and external legal advice, knowledge of the industries and markets, prevailing commercial terms and legal precedents; see note 13.
Impairment of goodwillThe Group determines on an annual basis whether goodwill is impaired. This requires an estimation of the future cash flows of the cash generating units to which the goodwill is allocated; see note 9.
Contingent considerationWhen the Group acquires businesses, the total consideration may consist of an amount paid on completion plus further amounts payable on agreed post completion dates. These further amounts are contingent on the acquired business meeting agreed performance targets. At the date of acquisition, the Group reviews the profit and cash forecasts for the acquired business and estimates the amount of contingent consideration that is likely to be due; see note 13.
Employee post-retirement benefit obligationsFor material defined benefit plans, the actuarial valuation includes assumptions such as discount rates, return on assets, salary progression and mortality rates; see note 16.
Recoverability of trade receivablesTrade receivables are reflected net of an estimated provision for impairment losses. This provision considers the past payment history and the length of time that the debt has remained unpaid; see note 11.
Accounting policies relating to a specific note in the financial statements are set out within that note as follows:
NoteRevenue 2Separately Disclosed Items 3Taxation 6Property, plant and equipment 8Goodwill and other intangible assets 9Trade and other receivables 11Trade and other payables 12Provisions 13Borrowings and financial instruments 14Capital and reserves 15Employee benefits 16Share schemes 17Non-controlling interest 20
2 Operating segments and presentation of resultsACCOUNTING POLICYRevenueRevenue represents the total amount receivable for services rendered, excluding sales related taxes and intra-group transactions.
Revenue from services rendered on short-term projects is generally recognised in the income statement when the relevant service is completed, usually when the report of findings is issued.

INTERTEK GROUP PLC ANNUAL REPORT AND ACCOUNTS 2016 101
FINANCIAL STATEMENTSNOTES TO THE FINANCIAL STATEMENTS
2 Operating segments and presentation of results (continued) Revenue (continued) On long-term projects the Group records transactions as sales on the basis of value of work done, with the corresponding amount being included in trade receivables if the customer has been invoiced or in accrued income if billing has yet to be completed. Long-term projects consist of two main types: (a) time incurred is billed at agreed rates on a periodic basis, such as monthly; or (b) staged payment invoicing occurs, requiring an assessment of percentage completion, based on services provided and revenue accrued accordingly.
Expenses are recharged to clients where permitted by the contract. Payments received in advance from customers are recognised in deferred income where services have not yet been rendered.
OPERATING SEGMENTSThe Group is organised into business lines, which are the Group’s operating segments and are reported to the CEO, the chief operating decision maker.
Since 1 January 2016, following the change in Group strategy, the approach to reporting and performance management that the CEO uses to make decisions about operating matters has changed from the previous five divisions to the three divisions set out below. The segment information for earlier periods has been restated to conform to these changes. The changes have been made as the business lines within the new divisions demonstrate similar mid- to long-term structural growth drivers.
As part of this change the former Consumer Goods, Commercial & Electrical and Chemicals & Pharmaceuticals divisions have been mostly aggregated into the Products division; the former Commodities division has primarily moved to the Trade division and the former Industry & Assurance division has primarily moved to Resources. Certain business lines within those former segments have also been reallocated to better align to the structural growth drivers of each division. This has had a consequential effect on the allocation of goodwill to CGUs (see note 9).
The costs of the corporate head office and other costs which are not controlled by the three divisions are allocated appropriately.
Inter-segment pricing is determined on an arm’s length basis. There is no significant seasonality in the Group’s operations.
Segment results include items directly attributable to a segment as well as those that can be allocated on a reasonable basis.
The performance of the segments is assessed based on adjusted operating profit which is stated before Separately Disclosed Items. A reconciliation to operating profit by division and Group profit for the year is included overleaf.
The principal activities of the divisions, and the customers they serve, are as follows:
Products – Our Products-related division consists of business lines that are focused on ensuring the quality and safety of physical components and products, as well minimising risk through assessing the operating process and quality management systems of our customers.
As a trusted partner to the world’s leading retailers, manufacturers and distributors, our Products business lines support a wide range of industries including textiles, footwear, toys, hardlines, home appliances, consumer electronics, information and communication technology, automotive, aerospace, lighting, building products, industrial and renewable energy products, food and hospitality, healthcare and beauty, and pharmaceuticals.
Across these industries we provide a wide range of ATIC services including laboratory safety, quality and performance testing, second-party supplier auditing, sustainability analysis, products assurance, vendor compliance, process performance analysis, facility plant & equipment verification and 3rd party certification.
Trade – Our Trade division consists of three Global business lines with differing services and customers, but similar mid- to long-term structural growth drivers:
Our Cargo & Analytical Assessment ('Cargo/AA') business provides cargo inspection, analytical assessment, calibration and related research and technical services to the world’s petroleum and biofuels industries.
Our Government & Trade Services ('GTS') business provides inspection services to governments and regulatory bodies to support trade activities that help the flow of goods across borders, predominantly in the Middle East, Africa and South America.
Our Agriculture business provides analytical and testing services to global agricultural trading companies and growers.
Resources – Our Resources division consists of two business lines with differing services and customers:
Our Industry Services business uses in-depth knowledge of the oil, gas, nuclear and power industries to provide a diverse range of Total Quality Assurance solutions to optimise the use of customers' assets and minimise the risk in their supply chains. Some of our key services include technical inspection, asset integrity management, analytical testing, and ongoing training services.
Our Minerals business provides a broad range of ATIC service solutions to the mining and minerals exploration industries, covering the resource supply chain.

INTERTEK GROUP PLC ANNUAL REPORT AND ACCOUNTS 2016102
FINANCIAL STATEMENTS NOTES TO THE FINANCIAL STATEMENTS
NOTES TO THE FINANCIAL STATEMENTS continued2 Operating segments and presentation of results (continued)The results of these divisions for the year ended 31 December 2016 are shown below:
Year ended 31 December 2016
Revenuefrom
external customers
£m
Depreciation and
softwareamortisation*
£m
Adjusted operating
profit£m
Separately Disclosed
Items £m
Operating profit
£m
Products 1,465.5 (56.6) 297.7 (16.7) 281.0Trade 584.5 (18.6) 81.8 (6.4) 75.4Resources 517.0 (13.8) 30.2 (17.1) 13.1Total 2,567.0 (89.0) 409.7 (40.2) 369.5Group operating profit 409.7 (40.2) 369.5Net financing costs (22.4) – (22.4)Profit before income tax 387.3 (40.2) 347.1Income tax expense (98.0) 22.5 (75.5)Profit for the year 289.3 (17.7) 271.6* Depreciation and software amortisation of £89.5m includes unallocated charges of £0.5m.
Year ended 31 December 2015
Revenuefrom
external customers
£m
Depreciation and
softwareamortisation*
£m
Adjusted operating
profit£m
Separately Disclosed
Items £m
Operating profit/(loss)
£m
Products 1,110.6 (45.4) 233.8 (20.4) 213.4Trade 536.6 (17.4) 75.7 (5.1) 70.6Resources 519.1 (13.2) 33.9 (601.4) (567.5)Total 2,166.3 (76.0) 343.4 (626.9) (283.5)Group operating profit 343.4 (626.9) (283.5)Net financing costs (24.2) – (24.2)Profit before income tax 319.2 (626.9) (307.7)Income tax expense (77.5) 38.2 (39.3)Profit for the year 241.7 (588.7) (347.0)* Depreciation and software amortisation in 2015 of £85.2m includes unallocated charges of £9.2m.
GEOGRAPHIC SEGMENTSAlthough the Group is managed through a divisional structure, which operates on a global basis, under the requirements of IFRS 8 the Group must disclose any specific countries that are important to the Group’s performance. The Group considers the following to be the material countries in which it operates; the United States, China (including Hong Kong) and the United Kingdom.
In presenting information on the basis of geographic segments, segment revenue is based on the location of the entity generating that revenue. Segment assets are based on the geographical location of the assets.
Revenue from external customers Non-current assets
2016£m
2015£m
2016£m
2015£m
United States 836.1 609.1 648.5 552.8China (including Hong Kong) 485.0 422.6 61.5 51.0United Kingdom 173.7 171.7 105.1 131.9Other countries and unallocated 1,072.2 962.9 413.5 304.1Total 2,567.0 2,166.3 1,228.6 1,039.8
MAJOR CUSTOMERSNo revenue from any individual customer exceeded 10% of total Group revenue in 2015 or 2016.

INTERTEK GROUP PLC ANNUAL REPORT AND ACCOUNTS 2016 103
FINANCIAL STATEMENTSNOTES TO THE FINANCIAL STATEMENTS
3 Separately Disclosed ItemsACCOUNTING POLICYAdjusted resultsIn order to present the performance of the Group in a clear, consistent and comparable format, certain items are disclosed separately on the face of the income statement.
Separately Disclosed Items are items which by their nature or size, in the opinion of the Directors, should be excluded from the adjusted result to provide readers with a clear and consistent view of the business performance of the Group and its operating divisions.
When applicable, these items include amortisation of acquisition intangibles; impairment of goodwill and other assets; the profit or loss on disposals of businesses or other significant fixed assets; costs of acquiring and integrating acquisitions; the cost of any fundamental restructuring; material claims and settlements; significant recycling of amounts from equity to the income statement; and unrealised gains/losses on financial assets/liabilities.
Adjusted operating profit excludes the amortisation of acquired intangible assets, primarily customer relationships, as we do not believe that the amortisation charge in the Consolidated Income Statement provides useful information about the cash costs of running our business, as these assets will be supported and maintained by ongoing marketing and promotional expenditure, which is already reflected in operating costs. Amortisation of software, however, is included in adjusted operating profit as it is similar in nature to other capital expenditure. The costs of any restructuring are excluded from adjusted operating profit where they represent fundamental changes in individual operations around the Group, and are not expected to recur in those operations.
SEPARATELY DISCLOSED ITEMSThe Separately Disclosed Items are described in the table below:
2016£m
2015£m
Operating costs:Amortisation of acquisition intangibles (a) (14.0) (21.4)Acquisition costs (b) (2.8) (5.8)Restructuring costs (c) (21.4) (6.7)Loss on disposal of businesses (d) (2.0) –Impairment of goodwill and other assets (e) – (589.4)Material claims and settlements (f) – (3.6)Total operating costs (40.2) (626.9)Net financing costs – –Total before income tax (40.2) (626.9)Income tax credit on Separately Disclosed Items 22.5 38.2Total (17.7) (588.7)
(a) Of the amortisation of acquisition intangibles in the current year, £3.9m (2015: £13.4m) relates to the customer contracts and customer relationships acquired with the purchase of Moody International Limited (‘Moody’) in 2011, and £5.0m (2015: £0.4m) relates to the customer relationships acquired with the purchase of PSI Group in 2015.
(b) Acquisition costs comprise £2.5m (2015: £5.2m) for transaction costs in respect of current year acquisitions, and £0.3m in respect of prior years’ acquisitions (2015: £0.6m).
(c) During the year, the Group has implemented various fundamental restructuring activities, consistent with the new Company structure and 5x5 strategy. These activities included site consolidations, closure of non-core business units, re-engineering of underperforming businesses and the delayering of management structures.
(d) Three small non-core businesses were disposed of in 2016.
(e) In 2015, £589.4m of impairment of goodwill and other assets comprised £577.3m for the Industry Services CGU and £12.1m in respect of computer software.
(f) Material claims and settlements relate to a commercial claim that is separately disclosable due to its nature.

INTERTEK GROUP PLC ANNUAL REPORT AND ACCOUNTS 2016104
FINANCIAL STATEMENTS NOTES TO THE FINANCIAL STATEMENTS
NOTES TO THE FINANCIAL STATEMENTS continued4 Expenses and auditor’s remunerationAn analysis of operating costs by nature is outlined below:
2016£m
2015£m
Employee costs 1,140.6 956.2Depreciation and software amortisation 89.5 85.2Impairment of goodwill and other assets – 589.4Other expenses 967.4 819.0Total 2,197.5 2,449.8
Certain expenses are outlined below, including fees paid to the auditors of the Group:
2016£m
2015£m
Included in profit for the year are the following expenses:Property rentals 76.6 65.6Lease and hire charges – fixtures, fittings and equipment 21.2 17.1(Profit)/loss on disposal of property, fixtures, fittings, equipment and software (0.1) 0.2
2016£m
2015£m
Auditor’s remuneration: Audit of these financial statements 0.5 0.5Amounts receivable by the auditors and their associates in respect of: Audit of financial statements of subsidiaries pursuant to legislation 2.6 2.0 Total audit fees payable pursuant to legislation 3.1 2.5 Audit-related services 0.1 – Taxation compliance services 0.1 0.3 Taxation advisory services – 0.1 Other – 0.2Total 3.3 3.1
5 EmployeesTotal employee costs are shown below:
Employee costs 2016
£m2015
£m
Wages and salaries 971.9 814.3Equity-settled transactions 15.2 12.9Social security costs 108.3 89.4Pension costs (note 16) 45.2 39.6Total employee costs 1,140.6 956.2
Details of pension arrangements and equity-settled transactions are set out in notes 16 and 17 respectively.
Average number of employees by division 2016 2015
Products 22,427 19,712Trade 9,468 9,269Resources 7,598 7,836Central 2,078 2,118Total average number for the year ended 31 December 41,571 38,935Total actual number at 31 December 42,452 41,434
The total remuneration of the Directors is shown below:
Directors’ emoluments 2016
£m2015
£m
Directors’ remuneration 7.3 4.6Amounts charged under the long-term incentive scheme 0.1 –Company contributions to the defined contribution schemes – 0.2Total Directors’ emoluments 7.4 4.8

INTERTEK GROUP PLC ANNUAL REPORT AND ACCOUNTS 2016 105
FINANCIAL STATEMENTSNOTES TO THE FINANCIAL STATEMENTS
6 TaxationACCOUNTING POLICYIncome tax for the year comprises current and deferred tax. Income tax is recognised in the same primary statement as the accounting transaction to which it relates.
Current taxCurrent tax is the expected tax payable on the taxable income for the year, using tax rates enacted or substantively enacted at the reporting date, and any adjustment to tax payable in respect of previous years.
The Group recognises liabilities for anticipated tax issues based on estimates of the additional taxes that are likely to become due. Amounts are accrued based on management’s interpretation of specific tax law and the likelihood of settlement. Where the outcome of discussions with tax authorities is different from the amount initially recorded, this difference will impact the tax provisions in the period the determination is made.
Deferred taxDeferred tax is provided using the balance sheet liability method, providing for temporary differences between the carrying amount of assets and liabilities for financial reporting purposes and the amounts used for taxation purposes, except for:
• recognition of consolidated goodwill;• the initial recognition of assets or liabilities in a transaction that is not a business combination and that affects neither accounting
nor taxable profit; and• differences relating to investments in subsidiaries, branches, associates and interest in joint ventures, the reversal of which is under
the control of the Group and where it is probable that the difference will not reverse in the foreseeable future.
The amount of deferred tax provided is based on the expected manner of realisation or settlement of the carrying amount of assets and liabilities, using tax rates that have been enacted or substantively enacted at the balance sheet date, for the periods when the asset is realised or the liability is settled. Deferred tax assets and liabilities are offset if there is a legally enforceable right to offset current tax liabilities and assets and they relate to income taxes levied by the same tax authority on the same taxable entity, or on different taxable entities which intend to settle current tax liabilities and assets on a net basis or their tax assets and liabilities will be realised simultaneously.
A deferred tax asset is recognised only to the extent that it is probable that future taxable profits will be available against which the temporary difference can be utilised. The carrying amount of deferred tax assets is reviewed at each balance sheet date and reduced to the extent that it is no longer probable that sufficient taxable profits will be available to allow all or part of the deferred tax asset to be utilised.
Any additional income taxes that arise from the distribution of dividends are recognised at the same time as the liability to pay the related dividend.
TAX EXPENSEThe Group operates across many different tax jurisdictions. Income and profits are earned and taxed in the individual countries in which they occur.
The income tax expense for the profit before tax for the year ended 31 December 2016 is £75.5m (2015: £39.3m). The Group’s consolidated effective tax rate for the year ended 31 December 2016 is 21.8% (2015: 12.8%).
The income tax expense for the adjusted profit before tax for the year ended 31 December 2016 is £98.0m (2015: £77.5m). The Group’s adjusted consolidated effective tax rate for the 12 months ended 31 December 2016 is 25.3% (2015: 24.3%).
Differences between the consolidated effective tax rate of 21.8% and notional statutory UK rate of 20.0% include, but are not limited to: the mix of profits; the effect of tax rates in foreign jurisdictions; non-deductible expenses; the effect of utilised tax losses; and under/over provisions in previous periods.
The Group receives tax incentives in certain jurisdictions, resulting in a lower tax charge to the income statement. Without these incentives the adjusted effective tax rate would be 28.0% (2015: 26.7%). The Group’s tax rate is affected by its financing arrangements that are in place to fund business operations in overseas territories. There is no guarantee that these reduced rates will continue to be applicable in future years (see note 22).

INTERTEK GROUP PLC ANNUAL REPORT AND ACCOUNTS 2016106
FINANCIAL STATEMENTS NOTES TO THE FINANCIAL STATEMENTS
NOTES TO THE FINANCIAL STATEMENTS continued6 Taxation (continued)Tax chargeThe total income tax charge, comprising the current tax charge and the movement in deferred tax, recognised in the income statement is analysed as follows:
2016£m
2015£m
Current tax charge for the period 86.4 72.6Adjustments relating to prior year liabilities (0.3) (2.6)Current tax 86.1 70.0Deferred tax movement related to current year (0.9) (35.1)Deferred tax movement related to prior year (9.7) 4.4Deferred tax movement (10.6) (30.7)Total tax in income statement 75.5 39.3
Tax on adjusted result 98.0 77.5Tax on Separately Disclosed Items (22.5) (38.2)Total tax in income statement 75.5 39.3
Reconciliation of effective tax rateThe following table provides a reconciliation of the UK statutory corporation tax rate to the effective tax rate of the Group on profit before taxation.
2016£m
2015£m
Profit/(loss) before taxation 347.1 (307.7)Notional tax charge at UK standard rate 20.0% (2015: 20.25%) 69.4 (62.3)Differences in overseas tax rates 11.0 (2.6)Tax on dividends 10.1 7.0Non-deductible expenses 4.7 3.5Tax exempt income (5.6) (3.9)Impairment losses with no tax effect – 97.3Movement in unrecognised deferred tax (1.7) 0.5Adjustments in respect of prior years (10.1) 1.8Other* (2.3) (2.0)Total tax in income statement 75.5 39.3*The Other category contains R&D tax credits £0.9m (2015: £0.9m).
During 2015, the UK Government announced a phased reduction in the main rate of corporation tax from 20% to 18% over a period of three years from 1 April 2017. In 2016, the UK Government announced a further reduction in the UK corporation tax rate to 17% from 1 April 2020 and was substantively enacted in September 2016.
Income tax recognised in other comprehensive income (‘OCI’)As noted in the accounting policy, tax is recognised in the same place as the relevant accounting charge. The income tax recognised on items recorded in other comprehensive income is shown below:
Before tax2016
£m
Tax credit2016
£m
Net of tax2016
£m
Before tax2015
£m
Tax credit2015
£m
Net of tax2015
£m
Foreign exchange translation differences of foreign operations 279.5 – 279.5 2.0 – 2.0
Net exchange (loss)/gain on hedges of net investments in foreign operations (194.1) – (194.1) (33.1) – (33.1)
Gain on fair value of cash flow hedges 14.3 – 14.3 – – –Remeasurements on defined benefit pension schemes (5.2) – (5.2) (2.2) – (2.2)Deferred tax assets recognised in other comprehensive
income – 2.8 2.8 – 3.0 3.0Total other comprehensive income for the year 94.5 2.8 97.3 (33.3) 3.0 (30.3)

INTERTEK GROUP PLC ANNUAL REPORT AND ACCOUNTS 2016 107
FINANCIAL STATEMENTSNOTES TO THE FINANCIAL STATEMENTS
6 Taxation (continued)Income tax recognised directly in equityAs noted in the accounting policy, tax is recognised in the same place as the relevant accounting charge. The income tax on items recognised in equity is shown below:
Before tax2016
£m
Tax credit2017
£m
Net of tax2016
£m
Before tax2015
£m
Tax charge2015
£m
Net of tax2015
£m
Equity-settled transactions 16.6 0.5 17.1 12.9 (0.5) 12.4
DEFERRED TAXRecognised deferred tax assets and liabilitiesDeferred tax assets and liabilities are attributable to the following:
Assets2016
£m
Assets2015
£m
Liabilities 2016
£m
Liabilities 2015
£m
Net2016
£m
Net2015
£m
Intangible assets 0.8 0.4 (72.0) (67.6) (71.2) (67.2)Property, fixtures, fittings and equipment 9.9 19.1 (15.3) (5.6) (5.4) 13.5Pensions 1.4 1.3 – – 1.4 1.3Equity-settled transactions 6.0 4.3 – – 6.0 4.3Provisions and other temporary differences 46.5 29.2 (2.6) (1.9) 43.9 27.3Tax value of losses 24.9 11.8 – – 24.9 11.8Total 89.5 66.1 (89.9) (75.1) (0.4) (9.0)As shown on balance sheet:Deferred tax assets* 48.3 42.7Deferred tax liabilities* (48.7) (51.7)Total (0.4) (9.0)* The deferred tax by category shown above is not netted off within companies or jurisdictions. The balance sheet shows the net position within companies or jurisdictions.
The difference between the two asset and liability totals is £41.1m, but the net liability of £0.4m is the same in both cases.
Movements in deferred tax temporary differences during the yearThe movement in the year in deferred tax assets and liabilities is shown below:
1 January 2016
£m
Exchange adjustments
£mAcquisitions
£m
Recognised in income
statement£m
Recognised in equity
and OCI£m
31 December 2016
£m
Intangible assets (67.2) (12.1) (2.7) 10.8 – (71.2)Property, fixtures, fittings and equipment 13.5 (3.1) – (15.8) – (5.4)Pensions 1.3 – – 0.4 (0.3) 1.4Equity-settled transactions 4.3 – – 1.0 0.7 6.0Provisions and other temporary differences 27.3 6.6 5.0 5.0 – 43.9Tax value of losses 11.8 2.6 – 9.2 1.3 24.9Total (9.0) (6.0) 2.3 10.6 1.7 (0.4)
1 January 2015
£m
Exchange adjustments
£mAcquisitions
£m
Recognised in income
statement£m
Recognised in equity
and OCI£m
31 December 2015
£m
Intangible assets (50.6) (3.0) (26.2) 12.6 – (67.2)Property, fixtures, fittings and equipment 2.4 (0.7) – 11.8 – 13.5Pensions 1.0 – – 0.3 – 1.3Equity-settled transactions 4.6 0.1 – (0.8) 0.4 4.3Provisions and other temporary differences 28.5 0.6 – (1.8) – 27.3Tax value of losses 3.5 (0.3) – 8.6 – 11.8Total (10.6) (3.3) (26.2) 30.7 0.4 (9.0)

INTERTEK GROUP PLC ANNUAL REPORT AND ACCOUNTS 2016108
FINANCIAL STATEMENTS NOTES TO THE FINANCIAL STATEMENTS
NOTES TO THE FINANCIAL STATEMENTS continued6 Taxation (continued)UNRECOGNISED DEFERRED TAX ASSETSDeferred tax assets have not been recognised in respect of the items shown below. The numbers shown are the gross temporary differences, and to calculate the potential deferred tax asset it is necessary to multiply these by the tax rates in each case:
2016£m
2015£m
Property, fixtures, fittings and equipment 46.6 46.4Pensions 23.9 18.4Intangibles 24.6 22.8Equity-settled transactions – –Provisions and other temporary differences 15.0 12.1Tax losses 77.8 71.9Total 187.9 171.6
Deferred tax assets have not been recognised in respect of these items because it is not probable that future taxable profits will be available in certain jurisdictions against which the Group can utilise the benefits from them.
There is a temporary difference of £296.2m (2015: £206.1m) which relates to unremitted post-acquisition overseas earnings. No deferred tax is provided on this amount as the distribution of these retained earnings is under the control of the Group and there is no intention to either repatriate from, or sell, the associated subsidiaries in the foreseeable future.
7 Earnings per ordinary shareThe calculation of earnings per ordinary share is based on profit attributable to ordinary shareholders of the Company and the weighted average number of ordinary shares in issue during the year. Diluted earnings per share is calculated by adjusting the weighted average number of ordinary shares in issue on the assumption of conversion of all potentially dilutive ordinary shares. Potential ordinary shares shall be treated as dilutive when, and only when, their conversion to ordinary shares would decrease earnings per share or increase loss per share from continuing operations. Basic loss per share in 2015 is therefore equal to diluted loss per share.
In addition to the earnings per share required by IAS 33: Earnings Per Share, an adjusted earnings per share has also been calculated and is based on earnings excluding the effect of amortisation of acquisition intangibles, goodwill impairment and other Separately Disclosed Items. It has been calculated to allow shareholders a better understanding of the trading performance of the Group. Details of the adjusted earnings per share are set out below:
2016£m
2015£m
Profit/(loss) attributable to ordinary shareholders 255.0 (360.5)Separately Disclosed Items after tax (note 3) 17.7 588.7Adjusted earnings 272.7 228.2Number of shares (millions)Basic weighted average number of ordinary shares 160.9 160.8Potentially dilutive share awards 1.7 1.4Diluted weighted average number of shares 162.6 162.2
Basic earnings/(loss) per share 158.5p (224.2)pPotentially dilutive share awards (1.7)p –Diluted earnings/(loss) per share 156.8p (224.2)p
Adjusted basic earnings per share 169.5p 141.9pPotentially dilutive share awards (1.8)p (1.2)pAdjusted diluted earnings per share 167.7p 140.7p

INTERTEK GROUP PLC ANNUAL REPORT AND ACCOUNTS 2016 109
FINANCIAL STATEMENTSNOTES TO THE FINANCIAL STATEMENTS
8 Property, plant and equipmentACCOUNTING POLICYProperty, plant and equipmentOwned assetsItems of property, plant and equipment are measured at cost less accumulated depreciation and accumulated impairment losses. Cost includes expenditure that is directly attributable to the acquisition of the asset.
Leased assetsLeases in which the Group assumes substantially all the risks and rewards of ownership are classified as finance leases. Where land and buildings are held under finance leases, the accounting treatment of the land is considered separately from that of the buildings. Leased assets acquired by way of finance leases are stated at an amount equal to the lower of their fair value and the present value of the minimum lease payments at inception of the lease, less accumulated depreciation and impairment losses.
Other leases are operating leasesThese leased assets are not recognised in the Group’s statement of financial position.
DepreciationDepreciation is charged to the income statement on a straight-line basis over the estimated useful lives of items of property, plant and equipment. Leased assets are depreciated over the shorter of the expected lease term and their useful lives. Land is not depreciated.
The estimated useful lives are as follows:
Freehold buildings and long leasehold buildings 50 yearsShort leasehold buildings Term of lease Fixtures, fittings, plant and equipment 3 to 10 years
Depreciation methods, residual values and the useful lives of assets are reassessed at each reporting date.
ImpairmentNon-financial assetsThe carrying amounts of the Group’s non-financial assets, other than inventories and deferred tax assets, are reviewed at each reporting date to determine whether there is any indication of impairment. If any such indication exists, then the asset’s recoverable amount is estimated to determine the level of any impairment.
INTERTEK GROUP PLC ANNUAL REPORT AND ACCOUNTS 2016110
FINANCIAL STATEMENTS NOTES TO THE FINANCIAL STATEMENTS
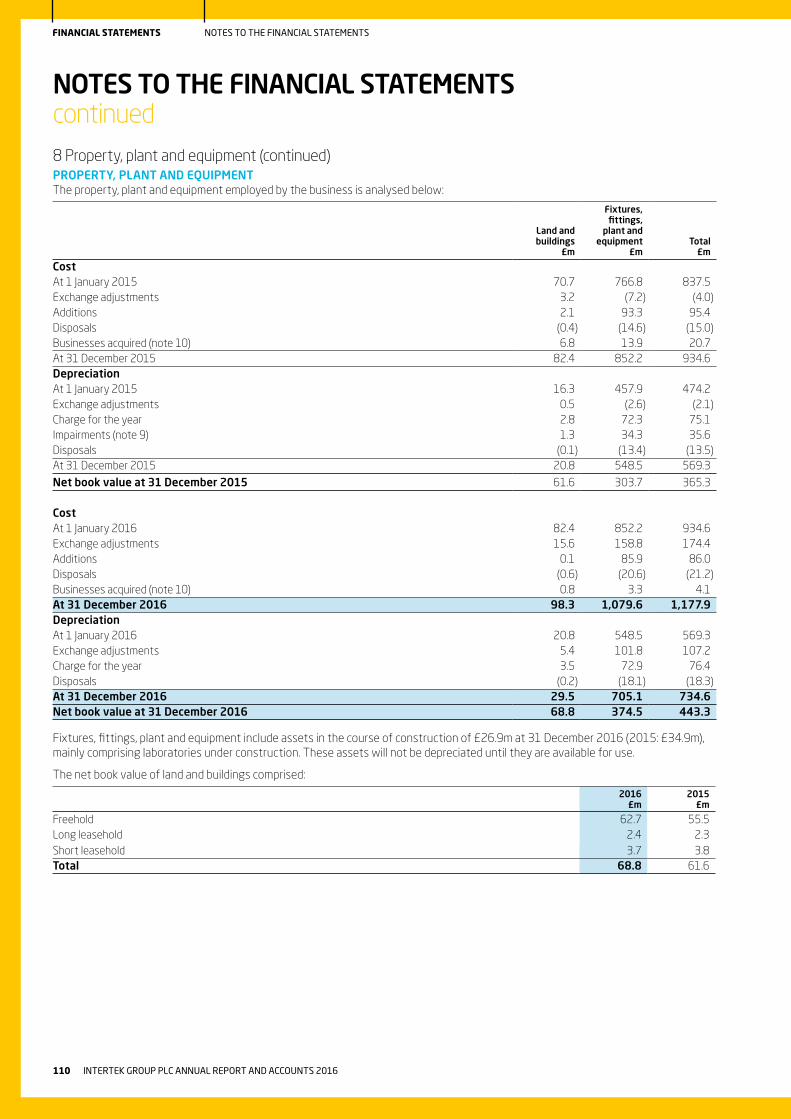
NOTES TO THE FINANCIAL STATEMENTS continued8 Property, plant and equipment (continued)PROPERTY, PLANT AND EQUIPMENTThe property, plant and equipment employed by the business is analysed below:
Land andbuildings
£m
Fixtures,fittings,
plant andequipment
£mTotal
£m
CostAt 1 January 2015 70.7 766.8 837.5Exchange adjustments 3.2 (7.2) (4.0)Additions 2.1 93.3 95.4Disposals (0.4) (14.6) (15.0)Businesses acquired (note 10) 6.8 13.9 20.7At 31 December 2015 82.4 852.2 934.6DepreciationAt 1 January 2015 16.3 457.9 474.2Exchange adjustments 0.5 (2.6) (2.1)Charge for the year 2.8 72.3 75.1Impairments (note 9) 1.3 34.3 35.6Disposals (0.1) (13.4) (13.5)At 31 December 2015 20.8 548.5 569.3
Net book value at 31 December 2015 61.6 303.7 365.3
CostAt 1 January 2016 82.4 852.2 934.6Exchange adjustments 15.6 158.8 174.4Additions 0.1 85.9 86.0Disposals (0.6) (20.6) (21.2)Businesses acquired (note 10) 0.8 3.3 4.1At 31 December 2016 98.3 1,079.6 1,177.9DepreciationAt 1 January 2016 20.8 548.5 569.3Exchange adjustments 5.4 101.8 107.2Charge for the year 3.5 72.9 76.4Disposals (0.2) (18.1) (18.3)At 31 December 2016 29.5 705.1 734.6Net book value at 31 December 2016 68.8 374.5 443.3
Fixtures, fittings, plant and equipment include assets in the course of construction of £26.9m at 31 December 2016 (2015: £34.9m), mainly comprising laboratories under construction. These assets will not be depreciated until they are available for use.
The net book value of land and buildings comprised:
2016£m
2015£m
Freehold 62.7 55.5Long leasehold 2.4 2.3Short leasehold 3.7 3.8Total 68.8 61.6

INTERTEK GROUP PLC ANNUAL REPORT AND ACCOUNTS 2016 111
FINANCIAL STATEMENTSNOTES TO THE FINANCIAL STATEMENTS
8 Property, plant and equipment (continued)CommitmentsOperating lease paymentsPayments made under operating leases are recognised in the income statement on a straight-line basis over the expected term of the lease. Lease incentives received are recognised in the income statement as an integral part of the total lease expense over the term of the lease.
At 31 December, the Group had future unprovided commitments under non-cancellable operating leases due as follows:
Land and buildings
2016£m
Other2016
£m
Total2016
£m
Land and buildings
2015£m
Other2015
£m
Total2015
£m
Within one year 65.2 6.1 71.3 51.5 5.0 56.5In the second to fifth years inclusive 119.9 8.1 128.0 84.5 5.0 89.5Over five years 74.0 0.8 74.8 62.6 – 62.6Total 259.1 15.0 274.1 198.6 10.0 208.6
The Group leases various laboratories, testing and inspection sites, administrative offices and equipment under lease agreements which have varying terms, escalation clauses and renewal rights.
Contracts for capital expenditure which are not provided in the financial statements amounted to £4.6m (2015: £4.4m).
9 Goodwill and other intangible assetsACCOUNTING POLICYGoodwillGoodwill arises on the acquisition of businesses. Goodwill represents the difference between the cost of acquisition and the Group’s interest in the fair value of the identifiable assets and liabilities acquired.
Goodwill is stated at cost less any accumulated impairment losses. Goodwill is allocated to cash generating units (‘CGUs’) and is not amortised but is tested annually for impairment.
Acquisitions on or after 1 January 2010From 1 January 2010, the Group has prospectively applied IFRS 3 ‘Business Combinations (revised 2008)’.
Business combinations are accounted for using the acquisition method at the acquisition date, which is the date on which control is obtained.
The Group measures goodwill as the fair value of the consideration transferred less the net recognised amount (generally fair value) of the identifiable assets acquired and liabilities assumed, all measured as of the acquisition date.
Costs related to the acquisition, other than those associated with the issue of debt or equity securities, are expensed as incurred. Costs relating to acquisitions are shown in Separately Disclosed Items.
Any contingent consideration payable is recognised at fair value at the acquisition date with subsequent changes recognised in profit or loss.
If at the reporting date the fair values of the acquiree’s identifiable assets, liabilities and contingent liabilities can only be established provisionally, then these values are used. Adjustments to the fair values can be made within 12 months of the acquisition date and are taken as adjustments to goodwill.
Acquisitions between 1 January 2004 and 31 December 2009For acquisitions between 1 January 2004 and 31 December 2009, goodwill represents the excess of the cost of the acquisition over the Group’s interest in the recognised amount (generally fair value) of the identifiable assets, liabilities and contingent liabilities of the acquiree.
Transaction costs, other than those associated with the issue of debt or equity securities, that the Group incurred in connection with business combinations were capitalised as part of the cost of the acquisition.
The Group has taken advantage of the exemption permitted by IFRS 1 and has not restated goodwill on acquisitions prior to 1 January 2004, the date of transition to IFRS. In respect of acquisitions prior to 1 January 2004, goodwill represents the amount recognised under the Group’s previous accounting framework.

INTERTEK GROUP PLC ANNUAL REPORT AND ACCOUNTS 2016112
FINANCIAL STATEMENTS NOTES TO THE FINANCIAL STATEMENTS
NOTES TO THE FINANCIAL STATEMENTS continued9 Goodwill and other intangible assets (continued)Other intangible assetsWhen the Group makes an acquisition, management review the business and assets acquired to determine whether any intangible assets should be recognised separately from goodwill. If, based on management’s judgement, such an asset is identified, then it is valued by discounting the probable future cash flows expected to be generated by the asset, over the estimated life of the asset. Where there is uncertainty over the amount of economic benefit and the useful life, this is factored into the calculation.
Intangible assets arising on acquisitions and computer software are stated at cost less accumulated amortisation and accumulated impairment losses. Identifiable intangibles are those which can be sold separately or which arise from legal rights regardless of whether those rights are separable, and which have finite useful lives.
Amortisation is charged to the income statement on a straight-line basis over the estimated useful lives. The estimated useful lives are as follows:
Computer software Up to 7 yearsCustomer relationships Up to 10 years Know-how Trade names
Up to 5 yearsUp to 5 years
Licences Contractual life Covenants not to compete Contractual life
ImpairmentGoodwill is not subject to amortisation and is tested annually for impairment and when circumstances indicate that the carrying value may be impaired.
Other intangible assets are subject to amortisation and are reviewed for impairment whenever events or changes in circumstances indicate that the amount carried in the statement of financial position may be less than its recoverable amount.
Any impairment is recognised in the income statement. Impairment is determined for goodwill by assessing the recoverable amount of each asset or group of assets, i.e. cash generating unit, to which the goodwill relates. A CGU represents an asset grouping at the lowest level for which there are separately identifiable cash flows.
The recoverable amount of an asset or a CGU is the greater of its fair value less costs to sell and value in use. In assessing value in use, the estimated future cash flows are discounted to their present value using a pre-tax discount rate that reflects current market assessments of the time value of money and the risks specific to the asset. The estimation process is complex due to the inherent risks and uncertainties and if different estimates were used this could materially change the projected value of the cash flows. An impairment loss in respect of goodwill is not reversed.

INTERTEK GROUP PLC ANNUAL REPORT AND ACCOUNTS 2016 113
FINANCIAL STATEMENTSNOTES TO THE FINANCIAL STATEMENTS
9 Goodwill and other intangible assets (continued)INTANGIBLESThe intangibles employed by the business are analysed below:
Other intangible assets
Goodwill£m
Customerrelationships
£mLicences
£m
Other acquisition intangibles
£m
Computer software
£mTotal
£m
CostAt 1 January 2015 792.8 232.3 8.1 17.1 103.0 360.5Exchange adjustments 14.6 3.7 0.2 0.4 4.9 9.2Additions – – – – 16.8 16.8Disposals – – – – (0.1) (0.1)Businesses acquired (note 10) 157.9 59.8 – 5.7 1.4 66.9At 31 December 2015 965.3 295.8 8.3 23.2 126.0 453.3Amortisation and impairment lossesAt 1 January 2015 12.9 124.0 7.7 16.2 37.7 185.6Exchange adjustments (0.1) 1.4 0.2 0.4 1.5 3.5Charge for the year – 21.1 0.2 0.1 10.1 31.5Disposals – – – – (0.1) (0.1)Impairment 481.4 60.3 – – 12.1 72.4At 31 December 2015 494.2 206.8 8.1 16.7 61.3 292.9Net book value at 31 December 2015 471.1 89.0 0.2 6.5 64.7 160.4
CostAt 1 January 2016 965.3 295.8 8.3 23.2 126.0 453.3Exchange adjustments 144.0 44.9 1.1 (4.3) 22.5 64.2Additions – – – – 19.5 19.5Disposal – (0.4) – – (0.5) (0.9)Businesses acquired (note 10) 29.3 10.8 – – – 10.8At 31 December 2016 1,138.6 351.1 9.4 18.9 167.5 546.9Amortisation and impairment lossesAt 1 January 2016 494.2 206.8 8.1 16.7 61.3 292.9Exchange adjustments 58.3 18.3 1.1 1.4 7.5 28.3Charge for the year – 13.5 0.2 0.3 13.1 27.1Disposal – (0.3) – – (0.5) (0.8)Impairment – – – – 0.6 0.6At 31 December 2016 552.5 238.3 9.4 18.4 82.0 348.1Net book value at 31 December 2016 586.1 112.8 – 0.5 85.5 198.8
Other intangible assets The other acquisition intangibles of £0.5m (2015: £6.5m) consist of covenants not to compete and know-how. The average remaining amortisation period for customer relationships is seven years (2015: seven years).
Computer software net book value of £85.5m at 31 December 2016 (2015: £64.7m) includes software in construction of £32.0m (2015: £30.5m).
GoodwillGoodwill arising from acquisitions in the current and prior year has been allocated to reportable segments as follows:
2016£m
2015£m
Products 15.0 141.3Trade 14.3 –Resources – 16.6At 31 December 29.3 157.9

INTERTEK GROUP PLC ANNUAL REPORT AND ACCOUNTS 2016114
FINANCIAL STATEMENTS NOTES TO THE FINANCIAL STATEMENTS
NOTES TO THE FINANCIAL STATEMENTS continued9 Goodwill and other intangible assets (continued)The total carrying amount of goodwill by operating segment is as follows, which is also used for the assessment of the Group’s impairment review. Following the change in Group strategy described in Note 2, where the former Consumer Goods, Commercial & Electrical and Chemicals & Pharmaceuticals divisions have been mostly aggregated into the Products division; the former Commodities division has primarily moved to the Trade division and the former Industry & Assurance division has primarily moved to Resources, certain business lines within those former segments have also been reallocated to better align to the structural growth drivers of each division. This has had a consequential effect on the allocation of goodwill to CGUs. As such, the prior year goodwill allocation has been represented to reflect those changes.
As a result of the above realignment, Industry Services has been redefined to include Exploration & Production. For reference, the goodwill of Industry Services of £13.0m in 2015 comprised £9.0m for Industry Services and £4.0m for Exploration & Production.
2016£m
Represented2015
£m
Industry Services 15.8 13.0Business Assurance 12.2 10.7Food & Agriculture Services 17.1 14.0Cargo & Analytical Assessment 54.6 35.7Government & Trade Services 0.9 0.7Minerals 40.7 34.1Softlines 6.2 5.9Hardlines 5.8 4.4
Product Assurance 4.3 3.5Electrical & Wireless 71.6 43.9Transportation Technologies 38.5 32.0Building & Construction 235.9 197.9Chemicals & Pharma/Health, Environmental & Regulatory 82.5 75.3Net book value at 31 December* 586.1 471.1* All goodwill is recorded in local currency. Additions during the year are converted at the exchange rate on the date of the transaction and the goodwill at the end of the
year is stated at closing exchange rates.
Impairment reviewIn order to determine whether impairments are required, the Group estimates the recoverable amount of each operating segment or CGU. The calculation is based on projecting future cash flows over a five-year period and using a terminal value to incorporate expectations of growth thereafter. A discount factor is applied to obtain a value in use which is the recoverable amount.
Key assumptionsThe key assumptions include the rate of revenue and profit growth within each of the territories and business lines in which the Group operates. These are based on the Group’s approved budget and five-year Strategic Plan. The long-term growth rate is also key since it is used in the perpetuity calculations. Finally, the discount rate used to bring the cash flow back to a present value varies depending on the location of the operation and the nature of the operations. The estimated future cash flows are discounted to their present value using a discount rate that reflects current market assessments of the time value of money and the risks specific to the asset.
The calculation of the value in use is sensitive to long-term growth rates and discount rates. Long-term growth rates predict growth beyond the Group’s planning cycle, and range from 1.7% to 2.5% (2015: 1.7% to 3.5%). The discount rate for each CGU reflects the Group’s weighted average cost of capital adjusted for the risks specific to the CGU. Pre-tax discount rates ranged from 9.5% to 12.4% (2015: 10.2% to 12.7%).
Sensitivity analysisNone of the reasonable downside sensitivity scenarios on key assumptions would cause the carrying amount of each CGU to exceed its recoverable amount. The sensitivities modelled by management include:
(i) Assuming revenues decline each year by 1% in 2018 to 2021 from the 2017 budgeted revenues, with margins increasing with base assumptions.
(ii) Assuming zero growth in operating profit margins in 2017 to 2021 with revenues increasing per base assumptions.
(iii) Assuming an increase in the discount rates used by 1%.
Management considers that the likelihood of any or all of the above scenarios occurring is low.

INTERTEK GROUP PLC ANNUAL REPORT AND ACCOUNTS 2016 115
FINANCIAL STATEMENTSNOTES TO THE FINANCIAL STATEMENTS
10 AcquisitionsACQUISITIONS IN 2016On 3 October 2016, the Group completed the acquisition of EWA-Canada Ltd, a leading provider of cyber security and assurance services for products, equipment and networks across multiple industries, for an estimated purchase price of £25.1m (£25.0m net of cash acquired), generating goodwill of £18.8m.
On 8 January 2016, the Group acquired FIT Italia SRL, an Italian company specialising in providing assurance services to the retail and agricultural sectors through food quality and safety assessments. On 11 November 2016, the Group entered into an agreement with Laboratorios ABC Quimica, Investigacion y Analisis, S.A. de C.V ('ABC') to form an environmental services Joint Venture in Mexico. ABC is a leading provider of water testing and analytical services. Cash consideration for these two ventures was £17.9m (£17.3m net of cash acquired) generating goodwill of £15.5m.
Provisional details of the net assets acquired and fair value adjustments are set out in the following tables. These analyses are provisional and amendments may be made to these figures in the 12 months following the date of acquisition.
2016
EWA-Canada Ltd
Total
Book value prior to
acquisition£m
Provisional fair value
adjustments£m
Fair value to Group on acquisition
£m
Property, plant and equipment 0.7 – 0.7Goodwill – 18.8 18.8Other intangible assets – 6.3 6.3Trade and other receivables 3.0 – 3.0Trade and other payables (2.1) – (2.1)Deferred tax liabilities – (1.7) (1.7)Net assets acquired 1.6 23.4 25.0
2016
Other acquisitions
Total
Book value prior to
acquisition£m
Provisional fair value
adjustments£m
Fair value to Group on acquisition
£m
Property, plant and equipment 3.4 – 3.4Goodwill – 15.5 15.5Other intangible assets – 4.4 4.4Trade and other receivables 3.8 (2.0) 1.8Trade and other payables (2.5) (3.0) (5.5)Provisions for liabilities and charges (0.2) – (0.2)Deferred tax liabilities – (1.0) (1.0)Attributable to Non-Controlling Interest (1.1) – (1.1)Net assets acquired 3.4 13.9 17.3
Goodwill and intangible assetsThe total goodwill arising on acquisitions made during 2015 was £34.3m. Goodwill in respect of 2015 acquisitions decreased by £5.0m. The goodwill arising represents the value of the assembled workforce and the benefits the Company expects to gain from increasing its presence in the relevant sectors in which the acquired businesses operate. The intangible assets of £10.7m primarily represent the value placed on customer relationships and the deferred tax thereon was £2.7m.
Consideration paidThe total cash consideration paid for the acquisitions in the year was £35.5m (2015: £237.2m), with further contingent consideration payable of £7.5m. Cash consideration includes cash and debt acquired of £0.7m. The estimated purchase price was £42.3m.
Put option over non-controlling interestAn earnout arrangement exists resulting in a put option over the minority shareholding related to ABC. This put option is exercisable at certain points through to 2019. The net present value of the put option liability has been recognised as a non-current financial liability under IAS 39.
Contribution of acquisitions to revenue and profitsIn total acquisitions made during 2016 contributed revenues of £6.8m and a net profit after tax of £1.0m from their respective dates of acquisition to 31 December 2016. The Group revenue and profit after tax for the year ended 31 December 2016 would have been £2,590.2m and £274.8m respectively if all the acquisitions were assumed to have been made on 1 January 2016.

INTERTEK GROUP PLC ANNUAL REPORT AND ACCOUNTS 2016116
FINANCIAL STATEMENTS NOTES TO THE FINANCIAL STATEMENTS
NOTES TO THE FINANCIAL STATEMENTS continued10 Acquisitions (continued)ACQUISITIONS IN 2015On 23 November 2015, the Group completed the acquisition of Professional Service Industries, Inc., for a purchase price of £220.9m (£216.2m net of cash acquired), generating goodwill of £140.1m. PSI is a provider of industry-leading testing and assurance services to the commercial and civil construction markets and non-destructive testing for onshore pipelines in the USA.
On 3 February 2015, the Group acquired Adelaide Inspection Services Pty Ltd, an Australian-based business providing non-destructive testing and associated services to the power generation, construction, oil, gas and mining industries. On 10 September 2015, the Group acquired Dansk Institut for Certificering A/S, a Danish company that provides business assurance services to a wide range of industries including Hospitality, Transport and Food. On 8 October 2015, the Group acquired MT Group LLC and Materials Testing Lab, Inc, (together ‘MT’), a leading provider in the US of materials testing and inspection services to the building industry. Cash consideration for these three acquisitions was £18.1m (£16.9m net of cash acquired) generating goodwill of £12.8m.
The fair value adjustments 12 months from the date of acquisition were:
2016 2015
Professional Service Industries, Inc.
Total
Book value prior to
acquisition£m
Fair value adjustments
£m
Fair value to Group on acquisition
£m
Book value prior to
acquisition£m
Provisional fair value
adjustments£m
Fair value to Group on acquisition
£m
Property, plant and equipment 15.9 3.8 19.7 15.9 3.8 19.7Goodwill 108.1 32.0 140.1 108.1 38.0 146.1Other intangible assets 66.1 0.1 66.2 66.1 0.1 66.2Trade and other receivables 50.7 (0.5) 50.2 50.7 (0.8) 49.9Trade and other payables (24.6) (1.6) (26.2) (24.6) (2.7) (27.3)Provisions for liabilities and charges – (12.6) (12.6) – (13.2) (13.2)Deferred tax liabilities (26.8) 5.6 (21.2) (26.8) 0.8 (26.0)Net assets acquired 189.4 26.8 216.2 189.4 26.8 215.4
2016 2015
Other acquisitions
Total
Book value prior to
acquisition£m
Fair value adjustments
£m
Fair value to Group on acquisition
£m
Book value prior to
acquisition£m
Provisional fair value
adjustments£m
Fair value to Group on acquisition
£m
Property, plant and equipment 1.0 – 1.0 1.0 – 1.0Goodwill – 12.8 12.8 – 11.8 11.8Other intangible assets – 0.7 0.7 – 0.7 0.7Inventories 0.2 – 0.2 0.2 – 0.2Trade and other receivables 4.8 – 4.8 4.8 – 4.8Trade and other payables (2.4) – (2.4) (2.4) – (2.4)Deferred tax liabilities – (0.2) (0.2) – (0.2) (0.2)Net assets acquired 3.6 13.3 16.9 3.6 12.3 15.9

INTERTEK GROUP PLC ANNUAL REPORT AND ACCOUNTS 2016 117
FINANCIAL STATEMENTSNOTES TO THE FINANCIAL STATEMENTS
11 Trade and other receivablesACCOUNTING POLICYTrade receivables are recognised initially at the value of the invoice sent to the customer and subsequently at the amounts considered recoverable (amortised cost).
Estimates are used in determining the level of receivables that will not, in the opinion of the Directors, be collected. Based on historical default rates, reflecting the track record of payments by the Group’s customers, the Group believes that no impairment allowance is necessary in respect of trade receivables which are less than six months outstanding, unless there are specific circumstances such as the bankruptcy of a customer which would render the trade receivable irrecoverable.
The Group provides fully for all trade receivables over 12 months old as these are considered likely to be irrecoverable, and 25% of balances six to 12 months old. Where recovery is in doubt, a provision is made against the specific trade receivable until such time as the Group believes the amount to be irrecoverable. At that time the trade receivable is written off.
TRADE AND OTHER RECEIVABLESTrade and other receivables are analysed below:
2016£m
2015£m
Trade receivables 472.8 413.7Other receivables 60.0 57.9Prepayments and accrued income 118.9 111.8Fixed assets held for resale 0.1 0.1Total trade and other receivables 651.8 583.5
Trade receivables are shown net of an allowance for impairment losses of £23.9m (2015: £20.0m) and are all expected to be recovered within 12 months. Impairment on trade receivables charged as part of operating costs was £7.8m (2015: £6.9m).
There is no material difference between the above amounts for trade and other receivables and their fair value, due to their short-term duration. There is no concentration of credit risk with respect to trade receivables as the Group has a large number of customers who are internationally dispersed.
The ageing of trade receivables at the reporting date was as follows:
2016£m
2015£m
Under 3 months 399.9 342.0Between 3 and 6 months 49.0 50.1Between 6 and 12 months 27.5 26.5Over 12 months 20.3 15.1Gross trade receivables 496.7 433.7Allowance for impairment (23.9) (20.0)Trade receivables, net of allowance 472.8 413.7
Included in trade receivables under three months of £399.9m (2015: £342.0m) are trade receivables of £218.5m (2015: £185.1m) which are not yet due for payment under the Group’s standard terms and conditions of sale.
The movement in the allowance for impairment in respect of trade receivables during the year was as follows:
Impairment allowance for doubtful trade receivables2016
£m2015
£m
At 1 January 20.0 18.3Exchange differences 3.1 (0.7)Acquisitions – 1.6Cash recovered 0.8 0.6Impairment loss recognised 7.8 6.9Receivables written off (7.8) (6.7)At 31 December 23.9 20.0
There were no material individual impairments of trade receivables.

INTERTEK GROUP PLC ANNUAL REPORT AND ACCOUNTS 2016118
FINANCIAL STATEMENTS NOTES TO THE FINANCIAL STATEMENTS
NOTES TO THE FINANCIAL STATEMENTS continued12 Trade and other payablesACCOUNTING POLICYTrade payablesTrade payables are recognised at the value of the invoice received from a supplier. The carrying value of trade payables is considered approximate to fair value.
Put option over non-controlling interestPut options held by non-controlling interests that arise on acquisition are recognised initially at the present value of the redemption amount. They are subsequently measured at amortised cost using the effective interest method. The discount is unwound through the Income Statement as a finance charge.
TRADE AND OTHER PAYABLESTrade and other payables are analysed below:
Current2016
£m
Current2015
£m
Non-current2016
£m
Non-current2015
£m
Trade payables 107.3 64.7 – –Other payables 25.5 41.6 26.1 9.5Accruals and deferred income 274.0 250.3 7.6 7.8Total trade and other payables 406.8 356.6 33.7 17.3
The Group’s exposure to liquidity risk related to trade payables is disclosed in note 14.
The key assumptions in arriving at the value of the put options over shares held by non-controlling interests are the performance of those businesses; the risk adjusted discount rate taking into account the risk free rate and the gross domestic product growth in the countries of those underlying businesses.
13 ProvisionsACCOUNTING POLICYA provision is recognised in the balance sheet when the Group has a present legal or constructive obligation that can be estimated reliably as a result of a past event, and it is probable that an outflow of economic benefits will be required to settle the obligation.
PROVISIONSContingent
consideration£m
Claims£m
Other£m
Total£m
At 1 January 2016 4.4 18.5 12.2 35.1Exchange adjustments 0.7 0.7 0.5 1.9Provided in the year: – 5.6 22.8 28.4 in respect of current year acquisitions 7.9 – – 7.9 in respect of prior year acquisitions 1.0 (0.6) – 0.4Released during the year (0.2) (1.2) (1.0) (2.4)Utilised during the year – (3.5) (20.0) (23.5)At 31 December 2016 13.8 19.5 14.5 47.8Included in:Current liabilities – 19.5 14.5 34.0Non-current liabilities 13.8 – – 13.8At 31 December 2016 13.8 19.5 14.5 47.8
The Group is involved in various claims and lawsuits incidental to the ordinary course of its business. The outcome of such litigation and the timing of any potential liability cannot be readily foreseen, as it is often subject to legal proceedings. Based on information currently available, the Directors consider that the cost to the Group of an unfavourable outcome arising from such litigation is unlikely to have a materially adverse effect on the financial position of the Group in the foreseeable future.
The provision for claims of £19.5m (2015: £18.5m) represents an estimate of the amounts payable in connection with identified claims from customers, former employees and other plaintiffs and associated legal costs. The timing of the cash outflow relating to the provisions is uncertain, but is likely to be within one year. Details of contingent liabilities in respect of claims are set out in note 22.
The other provision of £14.5m (2015: £12.2m) includes restructuring provisions. The timing of the cash outflow is uncertain, but is likely to be within one year.

INTERTEK GROUP PLC ANNUAL REPORT AND ACCOUNTS 2016 119
FINANCIAL STATEMENTSNOTES TO THE FINANCIAL STATEMENTS
14 Borrowings and financial instrumentsACCOUNTING POLICYNet financing costsNet financing costs comprise interest expense on borrowings, facility fees, interest receivable on funds invested, net foreign exchange gains or losses, interest income and expense relating to pension assets and liabilities and gains and losses on hedging instruments that are recognised in the income statement. Interest income and interest expense are recognised as they accrue using the effective interest rate method.
Loans and receivablesLoans and receivables comprise trade and other receivables. Loans and receivables are recognised initially at fair value and subsequently at amortised cost less impairment losses (including bad debt provision).
Cash and cash equivalentsCash and cash equivalents comprise cash balances and call deposits. Bank overdrafts that are repayable on demand and form an integral part of the Group’s cash management are included as a component of cash and cash equivalents for the purpose of the statement of cash flows. Net debt comprises borrowings less cash and cash equivalents.
Non-derivative financial liabilitiesTrade and other payables are recognised initially at fair value and subsequently at their amortised cost.
Interest-bearing borrowings are initially recognised at fair value less transaction costs. Subsequent to initial recognition, interest-bearing borrowings are stated at amortised cost with any difference between cost and redemption value being recognised in the income statement over the period of the borrowings on an effective interest basis.
The fair value of put option liabilities over non-controlling interests is calculated using a present value calculation, incorporating observable and non-observable inputs. This valuation technique has been adopted as it most closely mirrors the contractual arrangement.
Derivative financial instrumentsThe Group uses derivative financial instruments, including interest rate swaps and forward exchange contracts, to hedge economically its exposure to foreign exchange and interest rate risks arising from operational, financing and investment activities. In accordance with its treasury policy, the Group does not hold or issue derivative financial instruments for speculative purposes.
Derivative financial instruments are recognised initially and subsequently at fair value; attributable transaction costs are recognised in profit or loss when incurred. The gain or loss on re-measurement to fair value at each period end is recognised immediately in the income statement except where derivatives qualify for hedge accounting.
The fair value of interest rate swaps is the estimated amount that the Group would receive or pay to terminate the swap at the balance sheet date.
The fair value of forward exchange contracts is their quoted market price at the balance sheet date, being the present value of the difference between the quoted forward price and the exercise price of the contract.
HedgingHedge of monetary assets and liabilitiesWhere a derivative financial instrument is used economically to hedge the foreign exchange exposure of a recognised monetary asset or liability, no hedge accounting is applied and any gain or loss on the hedging instrument is recognised in the income statement in the same caption as the foreign exchange on the related item.
Hedge of net investment in a foreign operationThe portion of the gain or loss on an instrument designated as a hedge of a net investment in a foreign operation that is determined to be an effective hedge is recognised directly in equity in the translation reserve. The ineffective portion is recognised immediately in the income statement. The Group has external borrowings denominated in foreign currencies which are used to hedge the net investment in its foreign operations.
Cash flow hedges Cash flow hedges comprise derivative financial instruments designated in a hedging relationship to manage interest rate risk to which the cash flows of certain assets and liabilities are exposed. The effective portion of changes in the fair value of the derivative that is designated and qualifies for hedge accounting is recognised in other comprehensive income. The ineffective portion is recognised immediately in the income statement. Amounts accumulated in equity are reclassified to the income statement in the period in which the hedged item affects profit or loss. However, where a forecasted transaction results in a non-financial asset or liability, the accumulated fair value movements previously deferred in equity are included in the initial cost of the asset or liability.
ImpairmentA financial asset is assessed at each reporting date to determine whether there is any objective evidence that it is impaired. A financial asset is considered to be impaired if objective evidence indicates that one or more events have had a negative effect on the estimated future cash flows of that asset.

INTERTEK GROUP PLC ANNUAL REPORT AND ACCOUNTS 2016120
FINANCIAL STATEMENTS NOTES TO THE FINANCIAL STATEMENTS
NOTES TO THE FINANCIAL STATEMENTS continued14 Borrowings and financial instruments (continued)Net financing costsNet financing costs are shown below:
Recognised in income statement2016
£m2015
£m
Finance incomeInterest on bank balances 0.9 1.0Total finance income 0.9 1.0Finance expenseInterest on borrowings (26.7) (26.2)Net pension interest cost (note 16) (0.8) (0.8)Foreign exchange differences on revaluation of net monetary assets and liabilities 5.7 3.1Facility fees and other* (1.5) (1.3)Total finance expense* (23.3) (25.2)Net financing costs* (22.4) (24.2)* Includes £nil (2015: £nil) relating to SDIs.
Analysis of net debt2016
£m2015
£m
Cash and cash equivalents per the Statement of Financial Position 175.6 141.1Overdrafts (16.8) (25.1)Cash per the Statement of Cash Flows 158.8 116.0
The components of net debt are outlined below:
1 January 2016
£mCash flow
£m
Exchange adjustments
£m
31 December 2016
£m
Cash 116.0 (6.3) 49.1 158.8Borrowings:Revolving credit facility US$800m 2021 (253.8) 73.5 (61.9) (242.2)Bilateral term loan facilities US$100m 2018 (67.5) – (14.3) (81.8)Bilateral term loan facilities US$60m 2016 (40.4) 41.8 (1.4) –Senior notes US$75m 2016 (50.6) 52.6 (2.0) –Senior notes US$100m 2017 (67.4) – (14.4) (81.8)Senior notes US$20m 2019 (13.5) – (2.9) (16.4)Senior notes US$150m 2020 (101.2) – (21.5) (122.7)Senior notes US$15m 2021 (10.1) – (2.1) (12.2)Senior notes US$140m 2022 (94.5) – (20.0) (114.5)Senior notes US$40m 2023 (27.0) – (5.7) (32.7)Senior notes US$125m 2024 (84.4) – (17.9) (102.3)Senior notes US$40m 2025 (27.0) – (5.7) (32.7)Senior notes US$75m 2026 (50.6) – (10.7) (61.3)Other* (3.4) 1.8 (0.3) (1.9)Total borrowings (891.4) 169.7 (180.8) (902.5)Total net debt (775.4) 163.4 (131.7) (743.7)* Other borrowings of £4.8m (2015: £6.2m) and facility fees.

INTERTEK GROUP PLC ANNUAL REPORT AND ACCOUNTS 2016 121
FINANCIAL STATEMENTSNOTES TO THE FINANCIAL STATEMENTS
14 Borrowings and financial instruments (continued)
1 January 2015
£mCash flow
£m
Exchange adjustments
£m
31 December 2015
£m
Cash 119.5 8.0 (11.5) 116.0Borrowings:Revolving credit facility US$800m 2020 (124.1) (123.9) (5.8) (253.8)Bilateral term loan facilities US$100m 2017 (25.8) (39.8) (1.9) (67.5)Bilateral term loan facilities US$60m 2016 (38.6) – (1.8) (40.4)Senior notes US$100m 2015 (64.4) 63.5 0.9 –Senior notes US$75m 2016 (48.3) – (2.3) (50.6)Senior notes US$100m 2017 (64.4) – (3.0) (67.4)Senior notes US$20m 2019 (12.9) – (0.6) (13.5)Senior notes US$150m 2020 (96.7) – (4.5) (101.2)Senior notes US$15m 2021 (9.7) – (0.4) (10.1)Senior notes US$140m 2022 (90.2) – (4.3) (94.5)Senior notes US$40m 2023 (25.8) – (1.2) (27.0)Senior notes US$125m 2024 (80.6) – (3.8) (84.4)Senior notes US$40m 2025 (25.8) – (1.2) (27.0)Senior notes US$75m 2026 (48.3) – (2.3) (50.6)Other* 2.6 (6.2) 0.2 (3.4)Total borrowings (753.0) (106.4) (32.0) (891.4)Total net debt (633.5) (98.4) (43.5) (775.4)
BORROWINGSBorrowings are split into current and non-current as outlined below:
Current2016
£m
Current2015
£m
Non-current2016
£m
Non-current2015
£m
Senior term loans and notes 81.8 90.5 815.9 794.7Other borrowings 4.8 6.2 – –Total borrowings 86.6 96.7 815.9 794.7
Analysis of debt2016
£m2015
£m
Debt falling due:In one year or less 86.6 96.7Between one and two years 81.1 134.2Between two and five years 391.3 367.0Over five years 343.5 293.5Total borrowings 902.5 891.4
Description of borrowingsTotal undrawn committed borrowing facilities as at 31 December 2016 were £412.0m (2015: £286.0m).
US$800m revolving credit facilityThe Group’s principal bank facility comprises a US$800m multi-currency revolving credit facility. In July 2016, US$672m of the facility was extended to June 2021. Advances under the facility bear interest at a rate equal to LIBOR, or their local currency equivalent, plus a margin, depending on the Group’s leverage. Drawings under this facility at 31 December 2016 were £242.2m (2015: £253.8m).
Bilateral term loan facility 1On 21 December 2012 the Group signed a US$20m bilateral term loan which was increased on 4 April 2014 to US$40m. This facility was further increased in November 2015 to US$100m, and the maturity of this facility was also extended to November 2018. Advances under this facility bear interest at a rate equal to LIBOR plus a margin. Drawings under this facility at 31 December 2016 were £81.8m (2015: £67.5m).
Bilateral term loan facility 2On 21 December 2012 the Group signed a US$20m bilateral term loan which was increased on 4 April 2014 to US$60m. The extended maturity of this facility was March 2016. Advances under this facility bore interest at a rate equal to LIBOR plus a margin. Drawings under this facility at 31 December 2016 were £nil (2015: £40.4m).

INTERTEK GROUP PLC ANNUAL REPORT AND ACCOUNTS 2016122
FINANCIAL STATEMENTS NOTES TO THE FINANCIAL STATEMENTS
NOTES TO THE FINANCIAL STATEMENTS continued14 Borrowings and financial instruments (continued)BORROWINGS (CONTINUED)Private placement bondsIn December 2008 the Group issued US$75m of senior notes. The notes, which were repaid on 10 June 2016, paid a fixed annual interest rate of 8.0%.
In December 2010 the Group issued US$250m of senior notes. These notes were issued in two tranches with US$100m repayable on 15 December 2017 at a fixed annual interest rate of 3.2% and US$150m repayable on 15 December 2020 at a fixed annual interest rate of 3.91%.
In October 2011 the Group issued US$265m of senior notes. These notes were issued in three tranches with US$20m repayable on 18 January 2019 at a fixed annual interest rate of 3.0%, US$140m repayable on 18 January 2022 at a fixed annual interest rate of 3.75% and US$105m repayable on 18 January 2024 at a fixed annual interest rate of 3.85%.
In February 2013 the Group issued US$80m of senior notes. These notes were issued in two tranches with US$40m repayable on 14 February 2023 at a fixed annual interest rate of 3.10% and US$40m repayable on 14 February 2025 at a fixed annual interest rate of 3.25%.
In July 2014 the Group issued US$110m of senior notes. These notes were issued in four tranches with US$15m repayable on 31 July 2021 at a fixed annual interest rate of 3.37%, US$20m repayable on 31 July 2024 at a fixed annual interest rate of 3.86%, US$60m repayable on 31 October 2026 at a fixed annual interest rate of 4.05% and US$15m repayable on 31 December 2026 at a fixed annual interest rate of 4.10%.
FINANCIAL RISKSDetails of the Group’s treasury controls, exposures and the policies and processes for managing capital and credit, liquidity, interest rate and currency risk are set out below, and in the Strategic Report – Financial Review that starts on page 34.
Credit risk Exposure to credit riskCredit risks arise mainly from the possibility that customers may not be able to settle their obligations as agreed. The Group monitors the creditworthiness of customers on an ongoing basis. The Group’s credit risk is diversified due to the large number of entities, industries and regions that make up the Group’s customer base.
The carrying amount of financial assets represents the maximum credit exposure. At the reporting date this was as follows:
2016£m
2015£m
Trade receivables, net of allowance (note 11) 472.8 413.7Cash and cash equivalents 158.8 116.0Total 631.6 529.7
The maximum exposure to credit risk for trade receivables at the reporting date by geographic region was as follows:
2016£m
2015£m
Asia Pacific 131.5 111.5Americas 180.4 160.2Europe, Middle East and Africa 160.9 142.0Total 472.8 413.7
Counterparty riskCash and cash equivalents and available borrowing facilities are at risk in the event that the counterparty is not able to meet its obligations in regards to the cash held or facilities available to the Group. The Group also enters into transactions with counterparties in relation to derivative financial instruments. If the counterparty was not able to meet its obligations, the Group may be exposed to additional foreign currency or interest rate risk.
The Group, wherever possible, enters into arrangements with counterparties who have robust credit standing, which the Group defines as a financial institution with a credit rating of at least investment grade. The Group has existing banking relationships with a number of ‘relationship banks’ that meet this criterion, and seeks to use their services wherever possible while avoiding excessive concentration of credit risk. Given the diverse geographic nature of the Group’s activities, it is not always possible to use a relationship bank. Therefore the Group has set limits on the level of deposits to be held at non-relationship banks to minimise the risk to the Group. It is also Group policy to remit any excess funds from local entities back to Intertek Group Treasury in the UK. Given the controls in place, and based on a current assessment of our banking relationships, management does not expect any counterparty to fail to meet its obligations.

INTERTEK GROUP PLC ANNUAL REPORT AND ACCOUNTS 2016 123
FINANCIAL STATEMENTSNOTES TO THE FINANCIAL STATEMENTS
14 Borrowings and financial instruments (continued)Liquidity riskLiquidity risk is the risk that the Group will not be able to meet its obligations as and when they fall due. The Group’s policy is to:
• ensure sufficient liquidity is available to Group companies in the amounts, currencies and locations required to support the Group’s operations;
• ensure the Group has adequate available sources of funding to protect against unforeseen internal and external events; and• avoid excess liquidity which restricts growth and impacts the cost of financing.
To ensure this policy is met, the Group monitors cash balances on a daily basis, projects cash requirements on a rolling basis and funds itself using debt instruments with a range of maturities.
The following are the contractual cash flows of financial liabilities/(assets) including interest (for floating rate instruments, interest payments are based on the interest rate at 31 December 2016):
2016
Carrying amount
£m
Contractual cash flows
£m
Six months or less
£m
6-12 months
£m1-2 years
£m2-5 years
£m
More than five years
£m
Non-derivative financial liabilitiesSenior term loans and notes 897.7 1,031.8 13.1 94.9 142.8 535.7 245.3Other loans 4.8 4.8 – 4.8 – – –Trade payables (note 12) 107.3 107.3 103.9 3.1 0.3 – –Put option liability over non-controlling
interest 8.6 9.6 – – – 9.6 –
1,018.4 1,153.5 117.0 102.8 143.1 545.3 245.3Derivative financial liabilities/
(assets)Forward exchange contracts: Outflow – 658.1 657.9 0.2 – – – Inflow (8.0) (666.1) (665.9) (0.2) – – –
(8.0) (8.0) (8.0) – – – –Total 1,010.4 1,145.5 109.0 102.8 143.1 545.3 245.3
2015
Carrying amount
£m
Contractual cash flows
£m
Six months or less
£m
6-12 months
£m1-2 years
£m2-5 years
£m
More than five years
£m
Non-derivative financial liabilitiesSenior term loans and notes 885.2 1,014.7 52.9 62.8 173.0 420.5 305.5Other loans 6.2 6.2 – 6.2 – – –Trade payables (note 12) 64.7 64.7 63.2 1.5 – – –
956.1 1,085.6 116.1 70.5 173.0 420.5 305.5Derivative financial liabilities/
(assets)Forward exchange contracts: Outflow – 423.4 366.5 56.9 – – – Inflow (1.6) (425.0) (367.7) (57.3) – – –
(1.6) (1.6) (1.2) (0.4) – – –Total 954.5 1,084.0 114.9 70.1 173.0 420.5 305.5

INTERTEK GROUP PLC ANNUAL REPORT AND ACCOUNTS 2016124
FINANCIAL STATEMENTS NOTES TO THE FINANCIAL STATEMENTS
NOTES TO THE FINANCIAL STATEMENTS continued14 Borrowings and financial instruments (continued)Interest rate riskThe Group’s objective is to manage the risk to the business from movements in interest rates, and to provide stability and predictability of the near term (12 month horizon) interest expense. Under the Group’s Treasury policy, management may fix the interest rates on up to 80% of the Group’s debt portfolio for the period of the current financial year. The Group’s debt portfolio beyond this period is to be managed within the range of a 20%-60% fixed to floating rate ratio. To do this the Group uses hedging instruments where considered appropriate. A cash flow hedge is in place in respect of a borrowing that is repayable in 2020.
SensitivityAt 31 December 2016, it is estimated that the impact on variable rate net debt of a general increase of 3% in interest rates would be a decrease in the Group’s profit before tax of approximately £9.3m (2015: £4.5m). This analysis assumes all other variables remain constant.
Foreign currency riskThe Group’s objective in managing foreign currency risk is to safeguard the Group’s financial assets from economic loss due to fluctuations in foreign currencies, and to protect margins on cross currency contracts and operations. To achieve this, the Group’s policy is to hedge its foreign currency exposures where appropriate.
The net assets of foreign subsidiaries represent a significant portion of the Group’s shareholders’ funds and a substantial percentage of the Group’s revenue and operating costs are incurred in currencies other than sterling. Because of the high proportion of international activity, the Group’s profit is exposed to exchange rate fluctuations. Two types of risk arise as a result: (i) translation risk, that is, the risk of adverse currency fluctuations in the translation of foreign currency operations and foreign assets and liabilities into sterling and (ii) transaction risk, that is, the risk that currency fluctuations will have a negative effect on the value of the Group’s commercial cash flows in various currencies.
The foreign currency profiles of cash, trade receivables and payables subject to translation risk and transaction risk, at the reporting date were as follows:
2016
Carrying amount
£mSterling
£mUS dollar
£m
Chinese renminbi
£m
Hong Kong dollar
£mEuro
£m
Other currencies
£m
Cash 158.8 4.1 7.6 55.0 1.0 0.5 90.6Trade receivables (note 11) 472.8 44.8 158.6 44.9 14.0 44.5 166.0Trade payables (note 12) 107.3 14.6 30.8 14.9 3.7 11.2 32.1
2015
Cash 116.0 6.2 13.6 16.4 2.2 1.3 76.3Trade receivables (note 11) 413.7 37.7 138.1 37.6 11.2 40.9 148.2Trade payables (note 12) 64.7 11.0 15.3 9.0 2.1 8.8 18.5

INTERTEK GROUP PLC ANNUAL REPORT AND ACCOUNTS 2016 125
FINANCIAL STATEMENTSNOTES TO THE FINANCIAL STATEMENTS
14 Borrowings and financial instruments (continued)RECOGNISED ASSETS AND LIABILITIESChanges in the fair value of forward foreign exchange contracts that economically hedge monetary assets and liabilities in foreign currencies and for which no hedge accounting is applied are recognised in the income statement.
HEDGE OF NET INVESTMENT IN FOREIGN SUBSIDIARIESThe Group’s foreign currency denominated loans are designated as a hedge of the Group’s investment in its respective subsidiaries. The carrying amount of these loans at 31 December 2016 was £857.7m (2015: £888.2m).
A foreign exchange loss of £194.1m (2015: loss £33.1m) was recognised in the translation reserve in equity on translation of these loans to sterling.
SENSITIVITYIt is estimated that a general increase of 10% in the value of sterling against the US dollar (the main currency impacting the Group) would have decreased the Group’s profit before tax for 2016 by approximately £20.8m (2015: £15.9m). This analysis assumes all other variables remain constant.
FAIR VALUESThe table below sets out a comparison of the book values and corresponding fair values of all the Group’s financial instruments by class.
Book value2016
£m
Fair value2016
£m
Book value2015
£m
Fair value2015
£m
Financial assetsCash and cash equivalents 158.8 158.8 116.0 116.0Trade receivables (note 11) 472.8 472.8 413.7 413.7Forward exchange contracts* 8.0 8.0 1.6 1.6Total financial assets 639.6 639.6 531.3 531.3Financial liabilitiesInterest bearing loans and borrowings* 902.5 909.9 891.4 900.6Trade payables (note 12) 107.3 107.3 64.7 64.7Put option liability over non-controlling interest 8.6 8.6 – –Total financial liabilities 1,018.4 1,025.8 956.1 965.3* Interest bearing loans and borrowing, and derivative liabilities are categorised as Level 2 under which the fair value is measured using inputs other than quoted prices
observable for the liability, either directly or indirectly.

INTERTEK GROUP PLC ANNUAL REPORT AND ACCOUNTS 2016126
FINANCIAL STATEMENTS NOTES TO THE FINANCIAL STATEMENTS
NOTES TO THE FINANCIAL STATEMENTS continued15 Capital and reservesACCOUNTING POLICYDividendsInterim dividends are recognised as a movement in equity when they are paid. Final dividends are reported as a movement in equity in the year in which they are approved by the shareholders.
Own shares held by the Employee Share Ownership Trust (‘ESOT’)Transactions of the Group sponsored ESOT are included in the Group financial statements. In particular, the Trust’s purchases of shares in the Company are debited directly in equity to retained earnings.
Share capital
Group and Company2016
Number2016
£m2015
£m
Allotted, called up and fully paid:Ordinary shares of 1p each at start of year 161,361,777 1.6 1.6Share Awards 24,998 – –Ordinary shares of 1p each at end of year 161,386,775 1.6 1.6Shares classified in shareholders’ funds 1.6 1.6
The holders of ordinary shares are entitled to receive dividends and are entitled to vote at general meetings of the Company.
During the year, the Company issued 24,998 (2014: nil) ordinary shares in respect of all share plans.
Purchase of own shares for trustDuring the year ended 31 December 2016, the Company financed the purchase of 200,000 (2015: 200,126) of its own shares with an aggregate nominal value of £2,000 (2015: £2,001) for £6.4m (2015: £5.2m) which was charged to retained earnings in equity and was held by the ESOT. This trust is managed and controlled by an independent offshore trustee. During the year, 221,309 shares were utilised to satisfy the vesting of share awards and share options (note 17). At 31 December 2016, the ESOT held 493,629 shares (2015: 514,938 shares) with an aggregate nominal value of £4,936 (2015: £5,149). The associated cash outflow of £6.4m (2015: £5.2m) has been presented as a financing cash flow.
Dividends2016
£m
2016Pence per
share2015
£m
2015Pence per
share
Amounts recognised as distributions to equity holders:Final dividend for the year ended 31 December 2014 – – 53.3 33.1Interim dividend for the year ended 31 December 2015 – – 27.4 17.0Final dividend for the year ended 31 December 2015 56.8 35.3 – –Interim dividend for the year ended 31 December 2016 31.2 19.4 – –Dividends paid 88.0 54.7 80.7 50.1
After the reporting date, the Directors proposed a final dividend of 43.0p per share in respect of the year ended 31 December 2016, which is expected to amount to £69.4m. This dividend is subject to approval by shareholders at the Annual General Meeting and therefore, in accordance with IAS 10: Events after the reporting date, it has not been included as a liability in these financial statements. If approved, the final dividend will be paid to shareholders on 2 June 2017.
RESERVESTranslation reserveThe translation reserve comprises foreign currency differences arising from the translation of the financial statements of foreign operations as well as the translation of liabilities that hedge the Group’s net investment in foreign operations.
OtherThis reserve includes a merger difference that arose in 2002 on the conversion of share warrants into share capital, as well as the cash flow hedge reserve.

INTERTEK GROUP PLC ANNUAL REPORT AND ACCOUNTS 2016 127
FINANCIAL STATEMENTSNOTES TO THE FINANCIAL STATEMENTS
16 Employee benefitsACCOUNTING POLICYPension schemesDefined contribution plansA defined contribution plan is a post-employment benefit plan under which an entity pays fixed contributions into a separate entity and will have no legal or constructive obligation to pay further amounts. Obligations for contributions to defined contribution pension plans are recognised as an employee benefit expense in the income statement as incurred.
Defined benefit plansA defined benefit plan is a post-employment benefit plan other than a defined contribution plan.
The Group’s net obligation in respect of material defined benefit pension plans is calculated separately for each plan by estimating the amount of future benefit that employees have earned in return for their service in the current and prior years; that benefit is discounted to determine its present value. The fair value of any plan assets are deducted.
In calculating the defined benefit deficit, the discount rate is the yield at the reporting date on AA credit-rated bonds that have maturity dates approximating the terms of the Group’s obligations and that are denominated in the same currency in which the benefits are expected to be paid. The calculation is performed annually by a qualified actuary using the Projected Unit credit method.
The increase in the present value of the liabilities expected to arise from the employees’ services in the accounting period is charged to the operating profit in the income statement. The expected return on the schemes’ assets and the interest on the present value of the schemes’ liabilities, during the accounting period, are shown as finance income and finance expense respectively.
The Group operates a number of pension schemes throughout the world. In most locations, these are defined contribution arrangements. However, there are significant defined benefit schemes in the United Kingdom, Hong Kong and Switzerland. The United Kingdom and Hong Kong schemes are funded schemes, with assets held in separate trustee administered funds and the Switzerland scheme is an insured scheme. The schemes in the United Kingdom and Hong Kong were closed to new entrants in 2002 and 2000, respectively. Other funded defined benefit schemes are not considered to be material and are therefore accounted for as if they were defined contribution schemes.
The Group recognises all actuarial remeasurements in each year in equity through the consolidated statement of comprehensive income.
In June 2011, the International Accounting Standards Board issued revisions to IAS 19 Employee Benefits (‘IAS 19’) that provide changes in the recognition, presentation and disclosure of post-employment benefits. The Group has adopted the revised accounting standard from 1 January 2013.
TOTAL PENSION COSTThe total pension cost included in operating profit for the Group was:
2016£m
2015£m
Defined contribution schemes (41.6) (36.3)Defined benefit schemes – current service cost and administration expenses (3.6) (3.3)Pension cost included in operating profit (note 5) (45.2) (39.6)
The pension cost for the defined benefit schemes was assessed in accordance with the advice of qualified actuaries. The last full triennial actuarial valuation of The Intertek Pension Scheme in the United Kingdom (‘United Kingdom Scheme’) was carried out as at 1 April 2013, and for accounting purposes has been updated to 31 December 2015 for IAS 19 purposes. The last full actuarial valuation of the Hong Kong scheme was carried out as at 31 December 2013, for local accounting purposes but this has been updated to 31 December 2015 for IAS 19 purposes. The Swiss scheme was actuarially valued for IAS 19 purposes at 31 December 2013 and for accounting purposes has been updated to 31 December 2015 for IAS 19 purposes. The average duration of the schemes are 20 years, 10 years and 15 years for the United Kingdom, Hong Kong and Switzerland schemes respectively.

INTERTEK GROUP PLC ANNUAL REPORT AND ACCOUNTS 2016128
FINANCIAL STATEMENTS NOTES TO THE FINANCIAL STATEMENTS
NOTES TO THE FINANCIAL STATEMENTS continued16 Employee benefits (continued)DEFINED BENEFIT SCHEMESThe cost of defined benefit schemesThe amounts recognised in the income statement were as follows:
2016£m
2015£m
Current service cost (3.0) (2.9)Scheme administration expenses (0.5) (0.4)Net pension interest cost (note 14) (0.8) (0.8)Total charge (4.3) (4.1)
The current service cost and scheme administration expenses are included in operating costs in the income statement and pension interest cost and interest income are included in net financing costs.
Included in Other Comprehensive Income:
2016£m
2015£m
Remeasurements arising from: Demographic assumptions 4.1 0.7 Financial assumptions (26.1) (0.5) Experience adjustment 4.1 (0.5) Asset valuation 12.9 (1.6)Other (0.2) (0.3)Total (5.2) (2.2)
Company contributionsThe Company assessed the triennial actuarial valuation and its impact on the scheme funding plan in 2017 and future years. In 2017 the Group expects to make normal contributions of £0.8m (2016: £0.8m) and a special contribution of £2.8m (2016: £2.8m) to the United Kingdom Scheme. The next triennial valuation (due as at 1 April 2016) is currently underway and will conclude after the date of signature of these financials statements. This will include a review of the company’s future contribution requirements.
The Hong Kong Scheme has an annual actuarial valuation, identifying the funding requirements for 2017.
Pension liability for defined benefit schemesThe amounts recognised in the statement of financial position for defined benefit schemes were as follows:
United Kingdom Scheme
£m
Hong Kong Scheme
£m
SwitzerlandScheme
£mTotal
£m
Fair value of scheme assets 105.9 21.9 15.7 143.5Present value of funded defined benefit obligations (129.8) (26.8) (18.7) (175.3)Deficit in schemes (23.9) (4.9) (3.0) (31.8)
The fair value changes in the scheme assets are shown below:
2016£m
2015£m
Fair value of scheme assets at 1 January 120.9 120.1Interest income 3.7 3.7Normal contributions by the employer 1.9 1.6Special contributions by the employer 2.8 2.8Contributions by scheme participants 0.6 0.5Benefits paid (5.2) (7.5)Effect of exchange rate changes on overseas schemes 6.2 1.5Remeasurements 12.9 (1.6)Scheme administration expenses (0.5) (0.4)Contribution to fund scheme administration expenses 0.2 0.2Fair value of scheme assets at 31 December 143.5 120.9

INTERTEK GROUP PLC ANNUAL REPORT AND ACCOUNTS 2016 129
FINANCIAL STATEMENTSNOTES TO THE FINANCIAL STATEMENTS
16 Employee benefits (continued)ASSET ALLOCATIONInvestment statements were provided by the Investment Managers which showed that, as at 31 December 2015 the invested assets of the United Kingdom Scheme totalled £105.9m (2015: £89.4m) and of the Hong Kong Scheme totalled £21.9m (2015: £17.6m) broken down as follows:
United Kingdom Scheme Hong Kong Scheme
Asset class2016
£m2015
£m2016
£m2015
£m
Equities 50.4 41.8 14.0 11.3Property 8.6 8.4 – –Bonds – – 7.9 6.2Absolute Return Fund* 25.2 23.0 – –Liability Driven Investment** 16.4 13.0 – –Cash 5.3 3.2 – 0.1Total 105.9 89.4 21.9 17.6
* The Absolute Return Fund aims to provide positive investment returns in all conditions over the medium to long term. The investment managers have a wide investment remit and look to exploit market inefficiencies through active allocation to a diverse range of market positions. The Fund uses a combination of traditional assets and investment strategies based on derivatives and is able to take long- and short-term positions in markets.
** The LDI Fund provides the hedge against adverse movements in inflation and interest rates. It seeks to match the sensitivity of the Scheme’s liability cash flow to changes in interest rates and inflation; it is invested in gilts, swaps, futures, repo contracts and money market instruments.
The United Kingdom Scheme had no bank account assets as at 31 December 2016 (2015: £0.1m).
All invested assets of the United Kingdom and Hong Kong Schemes are unquoted. The Switzerland Scheme is fully insured.
Changes in the present value of the defined benefit obligations were as follows:
2016£m
2015£m
Defined benefit obligations at 1 January 147.8 145.4Current service cost 3.0 2.9Interest cost 4.5 4.5Contributions by scheme participants 0.3 0.5Benefits paid (5.2) (7.5)Effect of exchange rate changes on overseas schemes 7.6 1.7Remeasurements 17.3 0.3Defined benefit obligations at 31 December 175.3 147.8
Principal actuarial assumptions:
United Kingdom Scheme Hong Kong Scheme Switzerland Scheme
2016%
2015%
2016%
2015%
2016%
2015%
Discount rate 2.7 3.7 1.9 1.6 0.4 0.8Inflation rate (based on CPI) 2.4 2.5 n/a n/a n/a n/aRate of salary increases 3.4 3.3 4.0 4.0 1.0 1.0Rate of pension increases:CPI subject to a maximum of 5% p.a. 2.4 2.5 n/a n/a n/a n/aIncreases subject to a maximum of 2.5% p.a. 1.9 1.9 n/a n/a n/a n/a
The retirement arrangement in Hong Kong pays a lump sum to members instead of a pension and the Switzerland Scheme is an insured plan.

INTERTEK GROUP PLC ANNUAL REPORT AND ACCOUNTS 2016130
FINANCIAL STATEMENTS NOTES TO THE FINANCIAL STATEMENTS
NOTES TO THE FINANCIAL STATEMENTS continued16 Employee benefits (continued)Life expectancy assumptions at year end for:
United Kingdom Scheme Hong Kong Scheme* Switzerland Scheme2016 2015 2016 2015 2016 2015
Male aged 40 49.4 47.2 n/a n/a 42.8 41.6Male aged 65 22.2 22.2 n/a n/a 19.8 18.9Female aged 40 51.5 49.1 n/a n/a 45.4 44.6Female aged 65 24.2 24.5 n/a n/a 21.9 21.4* The retirement arrangement in Hong Kong pays a lump sum to members instead of a pension at the point of retirement. Since the amount of the lump sum is not related to
the life expectancy of the member, the post-retirement mortality is not a relevant assumption for the Hong Kong Scheme.
The table above shows, for the United Kingdom Scheme, the number of years a male or female is expected to live, assuming they were aged either 40 or 65 at 31 December. The mortality tables adopted in 2016 for the United Kingdom Scheme are the S2PA projected by year of birth, based on the CMI 2015 mortality projection model with a 1.25% long-term annual rate for future improvement. In 2015 the S1PA tables were used, based on the CMI 2013 mortality projection model. For the Switzerland Scheme, the mortality table adopted for 2016 is the BVG2015, an update to the BVG 2010, an industry standard in Switzerland which is based on statistical evidence of major Switzerland pension funds.
SENSITIVITY ANALYSISThe table below sets out the sensitivity on the United Kingdom and Hong Kong pension assets and liabilities as at 31 December 2016 of the two main assumptions:
UK Scheme Hong Kong Scheme
Change in assumptionsLiabilities
£m
Increase/ (decrease) in deficit
£mLiabilities
£m
Increase/ (decrease) in deficit
£m
No change 129.8 – 26.8 –0.25% rise in discount rate 123.5 (6.3) 26.2 (0.6)0.25% fall in discount rate 136.6 6.8 27.4 0.60.25% rise in inflation 136.4 6.6 26.8 –0.25% fall in inflation 123.6 (6.2) 26.8 –
The United Kingdom Scheme is also subject to the mortality assumption. If the mortality tables used are rated up/down one year, the value placed on the liabilities increases by £5.9m and decreases by £5.9m respectively.
FUNDING ARRANGEMENTS United Kingdom SchemeThe trustees use the Projected Unit credit method with a three-year control period. Currently the scheme members pay contributions at the rate of 8.5% of salary. The employer pays contributions of 16.4% of salary, plus £0.2m per year to fund scheme expenses, and is due to make an additional contribution of £2.8m in 2017 to reduce the deficit disclosed by the 2013 valuation.
Hong Kong SchemeThe Trustees use the Attained Age funding method. The last actuarial valuation was as at 31 December 2013. Scheme members do not contribute to the scheme. The employer pays contributions of 8.5% of salaries including 0.6% in respect of scheme expenses.
Funding RisksThe main risks for the Schemes are:
Investment return risk: If the assets underperform the returns assumed in setting the funding targets then additional contributions may be required at subsequent valuations.
Investment matching risk: The Schemes invest significantly in equities, whereas the funding targets are closely related to the returns on bonds. If equities fall in value relative to the matching asset of bonds, additional contributions may be required.
Longevity risk: If future improvements in longevity exceed the assumptions made for Scheme funding then additional contributions may be required.
Role of Third PartiesThe United Kingdom Scheme is managed by Trustees on behalf of its members. The Trustees take advice from appropriate third parties including investment advisors, actuaries and lawyers as necessary.
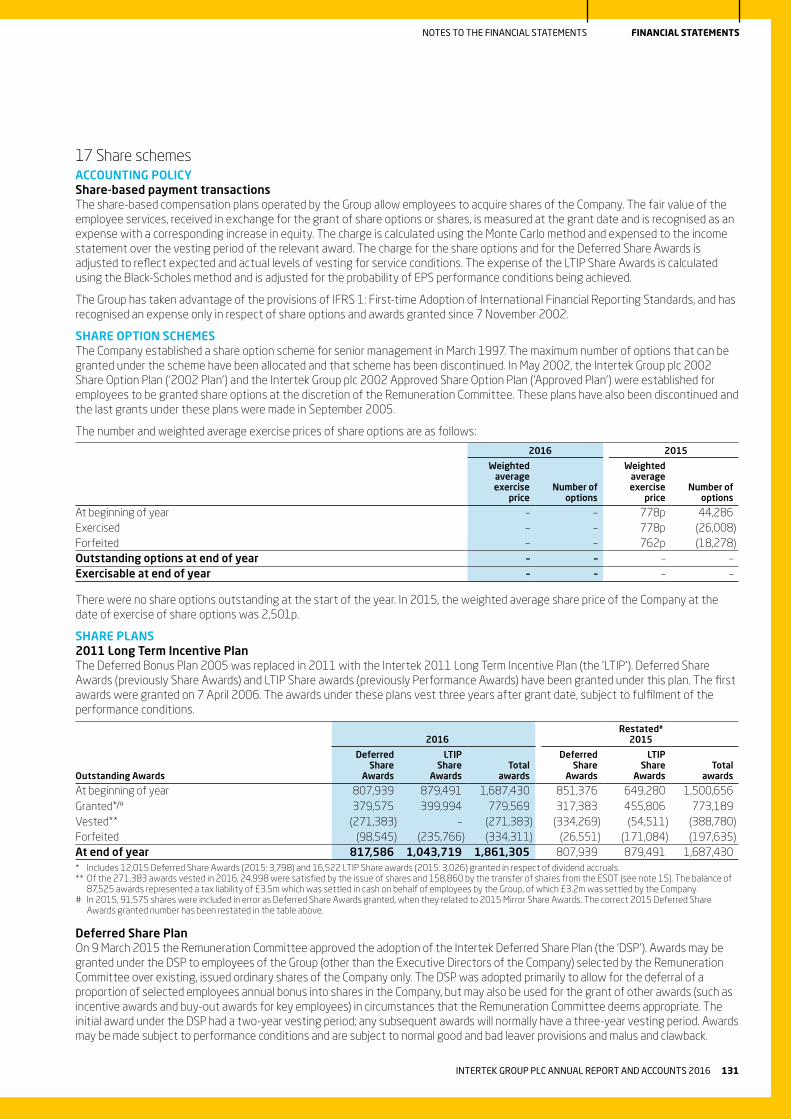
INTERTEK GROUP PLC ANNUAL REPORT AND ACCOUNTS 2016 131
FINANCIAL STATEMENTSNOTES TO THE FINANCIAL STATEMENTS
17 Share schemesACCOUNTING POLICYShare-based payment transactionsThe share-based compensation plans operated by the Group allow employees to acquire shares of the Company. The fair value of the employee services, received in exchange for the grant of share options or shares, is measured at the grant date and is recognised as an expense with a corresponding increase in equity. The charge is calculated using the Monte Carlo method and expensed to the income statement over the vesting period of the relevant award. The charge for the share options and for the Deferred Share Awards is adjusted to reflect expected and actual levels of vesting for service conditions. The expense of the LTIP Share Awards is calculated using the Black-Scholes method and is adjusted for the probability of EPS performance conditions being achieved.
The Group has taken advantage of the provisions of IFRS 1: First-time Adoption of International Financial Reporting Standards, and has recognised an expense only in respect of share options and awards granted since 7 November 2002.
SHARE OPTION SCHEMESThe Company established a share option scheme for senior management in March 1997. The maximum number of options that can be granted under the scheme have been allocated and that scheme has been discontinued. In May 2002, the Intertek Group plc 2002 Share Option Plan (‘2002 Plan’) and the Intertek Group plc 2002 Approved Share Option Plan (‘Approved Plan’) were established for employees to be granted share options at the discretion of the Remuneration Committee. These plans have also been discontinued and the last grants under these plans were made in September 2005.
The number and weighted average exercise prices of share options are as follows:
2016 2015
Weighted average exercise
priceNumber of
options
Weighted average exercise
priceNumber of
options
At beginning of year – – 778p 44,286Exercised – – 778p (26,008)Forfeited – – 762p (18,278)Outstanding options at end of year – – – –Exercisable at end of year – – – –
There were no share options outstanding at the start of the year. In 2015, the weighted average share price of the Company at the date of exercise of share options was 2,501p.
SHARE PLANS2011 Long Term Incentive PlanThe Deferred Bonus Plan 2005 was replaced in 2011 with the Intertek 2011 Long Term Incentive Plan (the 'LTIP'). Deferred Share Awards (previously Share Awards) and LTIP Share awards (previously Performance Awards) have been granted under this plan. The first awards were granted on 7 April 2006. The awards under these plans vest three years after grant date, subject to fulfilment of the performance conditions.
Outstanding Awards
2016Restated#
2015
DeferredShare
Awards
LTIPShare
AwardsTotal
awards
Deferred Share
Awards
LTIPShare
AwardsTotal
awards
At beginning of year 807,939 879,491 1,687,430 851,376 649,280 1,500,656Granted*/# 379,575 399,994 779,569 317,383 455,806 773,189Vested** (271,383) – (271,383) (334,269) (54,511) (388,780)Forfeited (98,545) (235,766) (334,311) (26,551) (171,084) (197,635)At end of year 817,586 1,043,719 1,861,305 807,939 879,491 1,687,430* Includes 12,015 Deferred Share Awards (2015: 3,798) and 16,522 LTIP Share awards (2015: 3,026) granted in respect of dividend accruals.** Of the 271,383 awards vested in 2016, 24,998 were satisfied by the issue of shares and 158,860 by the transfer of shares from the ESOT (see note 15). The balance of
87,525 awards represented a tax liability of £3.5m which was settled in cash on behalf of employees by the Group, of which £3.2m was settled by the Company.# In 2015, 91,575 shares were included in error as Deferred Share Awards granted, when they related to 2015 Mirror Share Awards. The correct 2015 Deferred Share
Awards granted number has been restated in the table above.
Deferred Share PlanOn 9 March 2015 the Remuneration Committee approved the adoption of the Intertek Deferred Share Plan (the ‘DSP’). Awards may be granted under the DSP to employees of the Group (other than the Executive Directors of the Company) selected by the Remuneration Committee over existing, issued ordinary shares of the Company only. The DSP was adopted primarily to allow for the deferral of a proportion of selected employees annual bonus into shares in the Company, but may also be used for the grant of other awards (such as incentive awards and buy-out awards for key employees) in circumstances that the Remuneration Committee deems appropriate. The initial award under the DSP had a two-year vesting period; any subsequent awards will normally have a three-year vesting period. Awards may be made subject to performance conditions and are subject to normal good and bad leaver provisions and malus and clawback.

INTERTEK GROUP PLC ANNUAL REPORT AND ACCOUNTS 2016132
FINANCIAL STATEMENTS NOTES TO THE FINANCIAL STATEMENTS
NOTES TO THE FINANCIAL STATEMENTS continued17 Share schemes (continued)
Outstanding Awards
2016 2016 2015 2015
Deferred ShareAwards
TotalAwards
Deferred Share Awards
Total awards
At beginning of year 101,886 101,886 – –Granted* 40,927 40,927 101,886 101,886Vested** (24,376) (24,376) – –Forfeited (900) (900) – –At end of year 117,537 117,537 101,886 101,886* Includes 1,642 Deferred Share Awards (2015: 659) granted in respect of dividend accruals.** Of the 24,376 awards vested in 2016, 12,955 were satisfied by the transfer of shares from the ESOT (see note 15). The balance of 11,421 awards represented a tax
liability of £0.4m which was settled in cash on behalf of employees by the Company.
Mirror Share AwardsOn 20 May 2015, André Lacroix was granted conditional rights to acquire 183,149 shares under a one-off arrangement as a condition of his recruitment as CEO of the Company. The award comprised two parts, tranche A and B, with tranche A vesting on 20 May 2016 and tranche B vesting on 20 May 2017. 93,385 shares vested in 2016, which included 1,810 shares granted in respect of dividend accruals. 49,494 awards were satisfied by the transfer of shares from the ESOT (see note 15) and the balance of 43,891 awards represented a tax liability of £1.3m which was settled in cash by the Company. Further details are shown in the Remuneration report on pages 63 to 77.
Equity-settled transactionsDuring the year ended 31 December 2016, the Group recognised an expense of £16.6m (2015: £12.9m), of which £1.4m (2015: £nil) related to restructuring SDIs. The fair values and the assumptions used in their calculations are set out below:
2016 Awards
DeferredShare
Awards (DSP)Share
Awards
LTIP ShareAwards EPS
element
LTIP ShareAwards TSR
element
Fair value at measurement date (pence) 3,376 3,113 3,113 2,073Share price (pence) 3,376 3,113 3,113 3,113Expected volatility n/a n/a n/a 23.4%Risk free interest rate n/a n/a n/a 0.5%Time to maturity (years) 1-3 3 3 3
2015 AwardsDeferred
Share Awards (DSP)
Share Awards
LTIP ShareAwards EPS
element
LTIP ShareAwards TSR
element
Fair value at measurement date (pence) 2,570 2,570 2,394 1,317Share price (pence) 2,570 2,570 2,394 2,394Expected volatility n/a n/a n/a 21.0%Risk free interest rate n/a n/a n/a 0.9%Time to maturity (years) 2 3 3 3
The expected volatility is based on the historical volatility, adjusted for any expected changes to future volatility due to publicly available information.
All Share Awards are granted under a service condition. Such condition is not taken into account in the fair value measurement at grant date. The LTIP Share Awards (TSR element) are granted under a performance related market condition and as a result this condition is taken into account in the fair value measurement at grant date.
18 Subsequent eventsNo post balance sheet events were identified between 31 December 2016 and the date of signing this report.
19 Capital managementThe Directors determine the appropriate capital structure of Intertek; specifically how much capital is raised from shareholders (equity) and how much is borrowed from financial institutions (debt) in order to finance the Group’s activities. These activities include ongoing operations as well as acquisitions as described in note 10.

INTERTEK GROUP PLC ANNUAL REPORT AND ACCOUNTS 2016 133
FINANCIAL STATEMENTSNOTES TO THE FINANCIAL STATEMENTS
19 Capital management (continued)The Group’s policy is to maintain a robust capital base (including cash and debt) to ensure the market and key stakeholders retain confidence in the capital profile. Debt capital is monitored by Group Treasury assessing the liquidity buffer on a short and longer-term basis as discussed in note 14. The Group uses key performance indicators, including return on invested capital and adjusted diluted earnings per share to monitor the capital position of the Group to ensure it is being utilised effectively. The dividend policy also forms part of the Board’s capital management policy, and the Board ensures there is appropriate earnings cover for the dividend proposed at both the interim and year end.
20 Non-controlling interestACCOUNTING POLICYAcquisitions of non-controlling interests are accounted for as transactions with owners in their capacity as owners and therefore no goodwill is recognised as a result of such transactions.
NON-CONTROLLING INTERESTAn analysis of the movement in non-controlling interest is shown below:
2016£m
2015£m
At 1 January 27.8 26.1Exchange adjustments 5.1 1.0Share of profit for the year 16.6 13.5Adjustment arising from changes in non-controlling interest 1.5 0.5Dividends paid to non-controlling interest (16.3) (13.3)At 31 December 34.7 27.8
21 Related partiesIDENTITY OF RELATED PARTIESThe Group has a related party relationship with its key management. Transactions between the Company and its subsidiaries and between subsidiaries have been eliminated on consolidation and are not discussed in this note.
TRANSACTIONS WITH KEY MANAGEMENT PERSONNELKey management personnel compensation, including the Group’s Directors, is shown in the table below:
2016£m
2015£m
Short-term benefits 8.5 6.9Post-employment benefits 0.6 0.5Equity-settled transactions 4.5 1.1Total 13.6 8.5
More detailed information concerning Directors’ remuneration, shareholdings, pension entitlements, share options and other long-term incentive plans is shown in the audited part of the Remuneration report. Apart from the above, no member of key management had a personal interest in any business transactions of the Group.
22 Contingent liabilities2016
£m2015
£m
Guarantees, letters of credit and performance bonds 31.4 23.6
LITIGATIONThe Group is involved in various claims and lawsuits incidental to the ordinary course of its business, including claims for damages, negligence and commercial disputes regarding inspection and testing, and disputes with employees and former employees. The Group is not currently party to any legal proceedings other than ordinary litigation incidental to the conduct of business. The Group maintains appropriate insurance cover to provide protection from the small number of significant claims it is subject to from time to time.
TAXThe Group operates in more than 100 countries and is subject to a wide range of complex tax laws and regulations. At any point in time it is normal for there to be a number of open years in any particular territory which may be subject to enquiry by local authorities. In some jurisdictions the Group receives tax incentives (see note 6) which are subject to renewal and review and reduce the amount of tax payable. Where the effect of the laws and regulations is unclear, estimates are used in determining the liability for the tax to be paid on past profits which are recognised in the financial statements. The Group considers the estimates, assumptions and judgements to be reasonable but this can involve complex issues which may take a number of years to resolve. The final determination of prior year tax liabilities could be different from the estimates reflected in these financial statements.

INTERTEK GROUP PLC ANNUAL REPORT AND ACCOUNTS 2016134
FINANCIAL STATEMENTS NOTES TO THE FINANCIAL STATEMENTS
NOTES TO THE FINANCIAL STATEMENTS continued23 Principal Group companiesThe principal subsidiaries whose results or financial position, in the opinion of the Directors, principally affect the figures of the Group have been shown below. All the subsidiaries shown were consolidated with Intertek Group plc as at 31 December 2016. Unless otherwise stated, these entities are wholly-owned subsidiaries and the address of the registered office is Academy Place, 1-9 Brook Street, Brentwood, Essex, CM14 5NQ, United Kingdom for all related undertakings included in this note.
Company nameCountry of Incorporation and principal place of operation Activity
Intertek Testing Services Shenzhen Limited (iv) China TradingIntertek Testing Services Limited Shanghai (iii) China TradingIntertek USA, Inc. (v) USA TradingIntertek Testing Services NA, Inc. (vi) USA TradingIntertek Testing Services Holdings Limited (i) England HoldingIntertek Finance plc England FinanceIntertek Testing Services Hong Kong Limited (vii) Hong Kong TradingTesting Holdings USA Inc. (viii) USA HoldingIntertek USD Finance Limited England FinanceIntertek Holdings Limited (i) England FinanceLabtest Hong Kong Limited (ix) Hong Kong TradingIntertek Technical Services, Inc. (ii)(x) USA TradingRCG-Moody International Limited England Holding(i) Directly owned by Intertek Group plc.(ii) Ownership held in Ordinary and Preference shares.(iii) Equity shareholding 85%, Company controlled by the Group based on management’s assessment; Registered office address is: Room 1605, No 201,
NanQuan North Road, Pudong, Shanghai, China.(iv) Registered office address is: Room A201, No.1, Qianwan Yi Road, Qianhai Shenzhen-Hongkong Cooperation Zone, Shenzhen, China.(v) Registered office address is: CT Corporation System, 5615 Corporate Blvd., Suite 400B, Baton Rouge LA 70808, United States.(vi) Registered office address is: 3933 US Route 11, Cortland, NY, 13045, United States.(vii) Registered office address is: 2/F Garment Centre, 576 Castle Peak Road, Kowloon, Hong Kong.(viii) Registered office address is: Corporation Trust Center, 1209 Orange Street, Wilmington, DE, 19801, United States.(ix) Registered office address is: 11/F, Unit IJK, Garment Centre, 576 Castle Peak Road, Kowloon, Hong Kong.(x) Registered office address is: 25025 I-45 North, Suite #111, The Woodlands TX 77380, United States.
GROUP COMPANIESIn accordance with section 409 of the Companies Act 2006 a full list of related undertakings is set out below. Related undertakings comprise subsidiaries, partnerships, associates, joint ventures and joint arrangements. The above principal subsidiaries have not been duplicated in the list below. Unless otherwise stated the share capital disclosed comprises ordinary shares which are indirectly held by Intertek Group plc as at the year end 31 December 2016. No subsidiary undertakings have been excluded from the consolidation.
FULLY OWNED SUBSIDIARIES 0949491 B.C. Limited1620-400 Burrard Street, Vancouver BC V 6C 3A6, Canada4th Strand, LLC3000 Northwoods Parkway, Suite 330, Norcross GA 30071, United StatesAdelaide Inspection Services Pty LimitedLevel 3, 235 St Georges Terrace, Perth WA 6000, AustraliaAgeus Solutions Inc. 505 March Road, Suite 100, Kanata ON K2K 2V6, CanadaAlta Analytical Laboratory, Inc. (i) 2 Riverway, Suite 500, Houston TX 77056, United StatesAmtac Certification Services Limited Architectural Testing Holdings, Inc. 2711 Centerville Road, Suite 400, Wilmington DE 19808, United StatesArchitectural Testing, Inc. 130, Derry Court, York PA 17406, United StatesAtlantic Verification Cape (Proprietary) Limited Noland House, River Park, Mowbray, 7700, South AfricaCaleb Brett Ecuador S.A. Centro Commercial Mall del Sol, Av. Joaquín Orrantia González y Juan Tanca Marengo, Torre B, Piso 5, Oficina 505, Guayaquil, EcuadorCantox US Inc. 100 Davidson Avenue, Suite #102, Somerset, NJ 08873, United StatesCapcis Limited Center for the Evaluation of Clean Energy Technology, Inc. 3933 US Route 11, Cortland, NY 13045, United StatesCharon Insurance LimitedThomas Miller (Bermuda) Ltd, Canon’s Court, 22 Victoria Street, Hamilton, HM12, Bermuda
Coscomply (i)
ZAC Ecopark 2, 27400, Heudeboville, FranceElectrical Mechanical Instrument Services (UK) Limited Unit 19 & 20 Wellheads Industrial Centre, Dyce, Aberdeen, AB21 7GA, ScotlandElectronic Warfare Associates-Canada, Ltd 1223 Michael St, Suite 200, Ottawa ON K1J 7T2, CanadaEntela-Taiwan, Inc. 4700 Broadmoor Avenue SE, Suite 200, Kentwood MI 49512, United StatesEsperanza Guernsey Holdings Ltd. PO Box 472, St Julian’s Court, St Julian's Avenue, St Peter Port, GY1 6AX, GuernseyEsperanza International Services (Southern Africa) (Pty.) LimitedCharter House, 13 Brand Road, Glenwood, Durban, South AfricaFIT Italia SRL Via Mozzi 4/6, 24127, Bergamo, ItalyFour Front Research (India) Pvt Limited (ii) Plot# 847, 5th Floor, Near Electricity Substation, Ayyappa Society Road, Madhapur, Hyderabad, Andhra Pradesh, 500081, IndiaGellatly Hankey Marine Services (M) Sdn. Bhd. Unit 30-01 Level 30, Tower A, Vertical Business Suite, Avenue 3, Bangsar South, No. 8, Jalan Kerinchi, 59200 Kuala Lumpur, MalaysiaGenalysis Laboratory Services Pty Limited (vi) Level 3, 235 St Georges Terrace, Perth WA 6000, AustraliaGeotechnical Services Pty Limited Level 3, 235 St Georges Terrace, Perth WA 6000, AustraliaGlobal X-Ray & Testing Corporation P.O. Box 1536, Morgan City LA 70380, United StatesGlobal X-Ray Holdings, Inc. (v) 112 East Service Road, Morgan City LA 70381, United StatesHawks Acquisition Holding, Inc Corporation Service Company, 2711 Centerville Rd. Suite 400 Wilmington, DE New Castle County DE 19808, United States

INTERTEK GROUP PLC ANNUAL REPORT AND ACCOUNTS 2016 135
FINANCIAL STATEMENTSNOTES TO THE FINANCIAL STATEMENTS
23 Principal Group companies (continued)FULLY OWNED SUBSIDIARIES (CONTINUED)Hi-Tech Holdings, Inc. CT Corporation System, 1200 S.Pine Island Road, Plantation FL 33324, United StatesHi-Tech Testing Service, Inc.CT Corporation System, 1999 Bryan Street Suite 900, Dallas TX 75201, United StatesH.P. White Laboratory Inc. 3114 Scarboro Road, Street MD 21154, United StatesInspection Services (US), LLC Corporation Trust Center, 1209 Orange Street, Wilmington, DE, 19801, United StatesInteco Group Services Limited (i) Akara Building Suite #8, 24th De Castro Street, Wickhams Cay 1, Road Town, Tortola, British Virgin IslandsInternational Cargo Services, Inc. (i) c/o CT Corp, 8550 United Plaza Blvd, Baton Rouge LA 70809, United StatesInternational Inspection Services Limited 33/37 Athol Street, Douglas, IM1 1LB, Isle of ManIntertek (Mauritius) Limited 2 Palmerston Road, Pheonix, MauritiusIntertek (Schweiz) AG TechCenter, Kaegenstrasse 18, 4153 Reinach, SwitzerlandIntertek Academy A/S Vejstruprodvej 31–33, 6093, Sjolund, DenmarkIntertek Argentina Certificaciones S.A. (iii) Cerrito 1136 3rd floor CF, Ciudad Autónoma de, Buenos Aires, C1010AAX, ArgentinaIntertek Aruba N.V. Lago Heights Straat 28A, San Nicolas, ArubaIntertek Asset Integrity Management, Inc. 1710 Sens Road, La Porte, TX 77571, United StatesIntertek ATI SRL 266-268 Calea Rahovei Street, Building 61, 1st Floor, Sector 5, Bucharest, RomaniaIntertek Australia Holdings Pty Limited Level 3, 235 St Georges Terrace, Perth WA 6000, AustraliaIntertek Azeri Limited 2236 Mirza Davud Str., Xatai District, Baku, AZ 1026, AzerbaijanIntertek BA EOOD 24A Akad. Metodi Popov Str., Floor 5, Sofia, 1113, BulgariaIntertek Bangladesh Limited Phoenix Tower, Plot–407 (3rd Floor), Tejgaon I/A, Dhaka, BangladeshIntertek Belgium NV Kruisschansweg 11, 2040 Antwerp, BelgiumIntertek Burkina Faso Ltd Sarl (i) Ouagadougou, Secteur 13, Parcelle 21, Lot 11 Section EO Arrondissement de Nongr'Masson, Ouagadougou 11 Burkina Faso, 11 GP 1429, Burkina FasoIntertek C&T Australia Holdings PTY Ltd (i) Level 3, 235 St Georges Terrace, Perth WA 6000, AustraliaIntertek C&T Australia Pty Ltd (i) Level 3, 235 St Georges Terrace, Perth WA 6000, AustraliaIntertek Caleb Brett (Uruguay) S.A. Cerrito 507, 4th Floor, Of. 46 and 47, Montevideo, 11000, UruguayIntertek Caleb Brett Chile S.A. Coyancura 2283, Piso 12, Providencia, Santiago, ChileIntertek Caleb Brett Colombia S.A. Calle 97, No.19A–57, Bogota, ColombiaIntertek Caleb Brett El Salvador S.A. de C.V. Recinto Industrial de RASA zona industrial de Acajutla, Sonsonate, El SalvadorIntertek Caleb Brett Germany GmbH Witternstrasse 14, 21107, Hamburg, GermanyIntertek Caleb Brett Panama, Inc. (i) Zona Procesadora para la Exportacion de Albrook, Building 6, Ancon Panama, PanamaIntertek Caleb Brett Venezuela C.A. 2a AV El Mirador Edif. Saragon Palace Piso, PH-602/603 La Campina, Caracas, 1050, VenezuelaIntertek Canada Newco Limited 1829 32nd Avenue, Lachine QC H8T 3JI, CanadaIntertek Capacitacion Chile Spa Coyancura 2283, Piso 12, Providencia, Santiago, ChileIntertek Capital Resources Limited Intertek Certification AB Torshamnsgatan 43, Box 1103, Kista, S-164 22, SwedenIntertek Certification AS Leif Weldings vei 8, 3208 Sandfjord, Norway
Intertek Certification France 67 Boulevard Bessières, 75017, Paris, FranceIntertek Certification GmbH Marie-Bernays-Ring 19a, 41199 Monchengladbach, GermanyIntertek Certification International Sdn. Bhd. 6-L12-01, Level 12, Tower 2, Menara PGRM, No. 6 & 8 Jalan Pudu Ulu, Cheras, 56100 Kuala Lumpur, MalaysiaIntertek Certification Japan Limited Nihonbashi N Bldg, 1-4-2, Nihonbashi – Horidomecho, Chuo-ku, Tokyo, 103-0012, JapanIntertek Certification Limited Intertek Commodities Botswana (Proprietary) Limited (i)First Floor, Time Square, Plot 134 Independence Avenue, Gaborone, BotswanaIntertek Commodities Mozambique Lda Rua 1233, NR 72 R/C, Distrito Urbano 1, Maputo, MozambiqueIntertek Consulting & Training (UK) Limited Northpoint Aberdeen Science & Energy Park, Exploration Drive, Bridge of Don, Aberdeen, AB23 8HZ, United KingdomIntertek Consulting & Training (USA), Inc. 201 Energy Parkway, Suite 240, Lafayette LA 70508, United StatesIntertek Consulting & Training Colombia Limitada Calle 97, No.19A – 57, Bogota, ColombiaIntertek Consulting & Training Egypt 46 B Street #7, Maadi, Cairo, EgyptIntertek Consulting AB Torshamnsgatan 43, Box 1103, KISTA, S-164 22, SwedenIntertek Consumer Goods GmbH Würzburger Strasse, 152, 90766 Furth, GermanyIntertek Curacao N.V Barendslaan #3, Rio Canario Willemstad, Curacao, Netherlands AntillesIntertek de Guatemala SA 46 Calle 21-53 Zona 12, Expobodega 46, Edificio 10, Guatemala Ciudad, GuatemalaIntertek de Nicaragua S.A. Zona Franca Astro KM 47, Carretera Tipitapa Masaya, Nave 20, Managua, NicaraguaIntertek Denmark A/S Dokhavnsvej 3, 4400, Kalundborg, DenmarkIntertek Deutschland GmbH Stangenstr.1, 70771 Leinfelden-Echterdingen, GermanyIntertek DIC A/S Vejstruprodvej 31–33, 6093, Sjolund, DenmarkIntertek do Brasil Laboratorios Ltda (85%)Alameda Tocantins No 630, Galpao 5, Alphaville Centro Industrial e Empresarial, Barueri, CEP 06455 – 020, BrazilIntertek Egypt for Testing Services 2nd Floor, Block 13001, Piece 15, Street 13, First Industrial Zone, (Beside Abou Ghali Motors), Elobour City, Cairo, EgyptIntertek Engineering Service Shanghai Limited Room 308A, 3rd Floor, No. 1 Building, No.1287, Shangcheng Road, Pulot Free Trade Zone, Shanghai, ChinaIntertek Engineering Services (Wuhu) Ltd No. 65 Chang Ye Street, YinHu District, Wuhu, ChinaIntertek Evaluate AB Torshamnsgatan 43, Box 1103, Kista, S-164 22, SwedenIntertek Finance Ireland Unlimited Company 8th Floor, Block E, Iveagh Court, Harcourt Road, Dublin 2, IrelandIntertek Finance No. 2 Ltd Intertek Finland OY Teknoublevardi 3-5, FI-01530 Vantaa, FinlandIntertek Fisheries Certification Limited Intertek Food Services GmbH Olof-Palme-Strasse 8, 28719 Bremen, GermanyIntertek France ZAC Ecopark 2, 27400, Heudeboville, FranceIntertek Fujairah FZC P.O. Box 1307, Fujairah, United Arab EmiratesIntertek Genalysis (Zambia) Limited Plot No 25/26 Nkwazi House, Nkwazi and Cha Cha Cha Roads, PO Box 31014, Lusaka, ZambiaIntertek Genalysis Madagascar SA Saint Denis Terrain II, Parcel 2 Ambatofotsy, Ampandrianomby, MadagascarIntertek Genalysis SI Ltd c/o Baoro & Associates, Top Floor, Y. Sato Building, Point Cruz, Honiara City, Solomon Islands

INTERTEK GROUP PLC ANNUAL REPORT AND ACCOUNTS 2016136
FINANCIAL STATEMENTS NOTES TO THE FINANCIAL STATEMENTS
NOTES TO THE FINANCIAL STATEMENTS continued23 Principal Group companies (continued)FULLY OWNED SUBSIDIARIES (CONTINUED)Intertek Genalysis South Africa Pty Limited Level 3, 235 St Georges Terrace, Perth WA 6000, AustraliaIntertek Ghana Limited A&A Complex, Block B, Ground Floor, Osu Badu Street, Accra, GhanaIntertek Global (Iraq) Limited (i) Intertek Global International LLC Building 242, Office No.3, C-Ring Road, PO Box 47146, Doha, QatarIntertek Global Limited 1st Floor, Liberation House, Castle Street, St Helier, JE1 1GL, JerseyIntertek Health Sciences Inc. 2233 Argentia Road, Suite # 201, Mississauga ON L5N 2X7, CanadaIntertek Holding Deutschland GmbH Stangenstr.1, 70771 Leinfelden-Echterdingen, GermanyIntertek Holdings FranceZAC Ecopark 2, 27400 Heudebouville, FranceIntertek Holdings Italia SRL Via Guido Miglioli 2/A, Cernusco sul Naviglio, 20063, Milano, ItalyIntertek Holdings Nederland B.V. Leerlooierstraat 135, 3194AB Hoogvliet, Rotterdam, NetherlandsIntertek Holdings Norge AS Oljeveien 2, Tananger, 4056, NorwayIntertek Hungary Kft. (ii)Ground Floor 3, Szilágyi Erzsébet alley 1., Budapest, 1024, HungaryIntertek Ibérica Spain S.L. Alda. Recalde, 27-5., 48009, Bilbao, Vizcaya, SpainIntertek India Private Limited E-20, Block B1, Mohan Co-operative Industrial Area, Mathura Road, New Delhi, 110044, IndiaIntertek Industrial Services GmbHMarie-Bernays-Ring 19a, 41199 Monchengladbach, GermanyIntertek Industry and Certification Services (Thailand) Limited.539/2 Gypsum Metropolitan Tower, 11C Fl., Sri-Ayudhaya Road, Tanon – Phayathai Subdistrict, Khet Ratchathewi, Bangkok, 10400, ThailandIntertek Industry Services (PTY) LTD3 EL Wak Street, Vereeniging, 1930, Gauteng, South AfricaIntertek Industry Services (S) Pte Ltd 2 International Business Park, #10-09/10, The Strategy, 609930, SingaporeIntertek Industry Services Brasil LtdaAlameda Mamore 503, Alphaville, Barueri-SP, 06454-040-SP, BrazilIntertek Industry Services Colombia Limited Calle 93B No.19–35/37 Office 501, Bogota, ColombiaIntertek Industry Services Japan LimitedNihonbashi N Bldg, 1-4-2, Nihonbashi – Horidomecho, Chuo-ku, Tokyo, 103-0012, JapanIntertek Industry Services Romania Srl 266-268 Calea Rahovei Street, Building 63, 8th Floor, Sector 5, Bucharest, RomaniaIntertek Industry WLL Office # 24, Building 400, Road 3207, Mahooz, Block 332, Manama, Kingdom of BahrainIntertek Inspection Services Ltd2561 Avenue Georges V, Montreal-Est Québec H1L 6S4, CanadaIntertek Inspection Services Scandinavia ASLeif Weldings vei 8, 3208 Sandfjord, NorwayIntertek Inspection Services UK LimitedIntertek Insurance Surveyors and Loss Assessors Private Limited (ii)
E-20, Block B1, Mohan Co-operative Industrial Area, Mathura Road, New Delhi, 110044, IndiaIntertek International France67 Boulevard Bessières, 75017, Paris, FranceIntertek International Guinee S.A.R.L. (i)Conakry Republique de Guinee, Compte Bancaire: 52481.369.10 0 (SGBG), Conakry, Guinea
Intertek International Inc. 24900 Pitkin Road, Site 200, The Woodlands TX 77386, United StatesIntertek International Kazakhstan, LLC 4 Khakimov Str., Atyrau City, 060005, KazakhstanIntertek International LimitedIntertek International LLC Matbuotchilar street, 32. Office No.502, Tashkent, 100060, UzbekistanIntertek International Ltd Egypt 69, Road 161, Intersection with Road 104, Ground Floor, Maadi, Cairo, EgyptIntertek International Nederland BV Leerlooierstraat 135, 3194AB Hoogvliet, Rotterdam, NetherlandsIntertek International Niger SARLBP 2769, 2nd Floor Lot 792 Block Q, Independance Boulevard, Rue GM-20, NigerIntertek International Suriname N.V. Prins Hendrikstraat 49, Paramaribo, SurinameIntertek International Tanzania Limited Minazini Street, Kilwa Road 5, Dar es Salaam, Tanzania, United Republic of TanzaniaIntertek Italia SpA Via Guido Miglioli 2/A, Cernusco sul Naviglio, 20063, Milano, ItalyIntertek Japan K.K. Pier City Shibaura Building, 4F, 3-18-1, Kaigan, Minato-ku, Tokyo, 108-0022, JapanIntertek Kalite Servisleri Limited Sirketi Icerenkoy mahallesi Eski Uskudar Yolu cadessi, VIP Center No: 10, Kat 12, Daire 13, Atasehir, Istanbul, TurkeyIntertek Korea Industry Service Ltd Yeouido Dept Bldg #916, 36-2, Yeouido-Dong, Youngdeungpo-Gu, Seoul, 150-749, Republic of KoreaIntertek Labtest S.A.R.L Route 110, (par Chefchaouni), Lot Saadi no. 20, Q.I. Aïn Sebaâ 20 250, 4eme Etage, Casablanca, MoroccoIntertek Ltd Borco Administration Bldg, West Sunrise Highway, Freeport, Grand Bahama, BahamasIntertek Management Services (Australia) Pty Ltd Level 3, 235 St Georges Terrace, Perth WA 6000, AustraliaIntertek Med SARL AUZone Franche Logistique Tanger Med, Plateau Bureaux 4, Lot 130, Tanger, MoroccoIntertek Medical Diagnostic Testing Centre (Shanghai) Co. Ltd Room 101, 1F, No 6 Building, 1218 Wan Rong Road, Zha Bei District, Shanghai, ChinaIntertek Minerales Services SARL (i)
Rue KM 10, Route de Kouroussa S/P Karifamoriah, Commune Urbaine de Kankan, GuineaIntertek Minerals Limited Osu Badu Street, Airport Residential Area, Accra, Greater Accra, CP8196, GhanaIntertek Myanmar Limited Classic Strand Cono, No.693/701, Room (4-A), (4th Floor), Merchant Road, Pabedan Township, Yangon, MyanmarIntertek Nederland B.V. Leerlooierstraat 135, 3194 AB Hoogvliet Rt, Rotterdam, The NetherlandsIntertek Nominees Limited Intertek Overseas Holdings Limited Intertek Overseas Holdings, Eritrea Limited (i)
3rd Floor, Warsay Avenue, P.O. Box 4588, Asmara, EritreaIntertek Pakistan (Private) Limited Intertek House, Shams Centre, 172-S, P.E.C.H.S, Block No.2, Tariq Road, Karachi, PakistanIntertek Poland sp.z o.o. Cyprysowa 23 B, 02-265, Warsaw, PolandIntertek Poland-Certification Sp. z.o.o. w likwidacji (ii) Ul. Mickiewicza, 18A , 60-833, Poznan, PolandIntertek Polychemlab B.V. Koolwaterstofstraat 1, 6161 RA, Geleen, NetherlandsIntertek Portugal, Unipessoal Lda Rua Antero de Quental, 221-Sala 102, 4455-586, Perafita-Matosinhos, PortugalIntertek Quality Services Ltd (i) Intertek Resource Solutions (Trinidad) Limited#91-92 Union Road, Marbella, Trinidad, Trinidad and TobagoIntertek Resource Solutions, Inc. 24900 Pitkin Rd., Ste. 200, The Woodlands TX 77386, United States

INTERTEK GROUP PLC ANNUAL REPORT AND ACCOUNTS 2016 137
FINANCIAL STATEMENTSNOTES TO THE FINANCIAL STATEMENTS
23 Principal Group companies (continued)FULLY OWNED SUBSIDIARIES (CONTINUED)Intertek Rus JSC 8, 2nd Brestskaya Str., 125047, Moscow, Russian FederationIntertek S.R.O Sokolovská 131/86, Karlín, Praha 8, 186 00, Czech RepublicIntertek Saudi Arabia Limited (i) Intertek Saudi Arabia Limited Southern Olaya Center, Office No. 213, Makkah Al-Mukaramah Street, P.O. Box 2526, Al-Khobar, 31952, Saudi ArabiaIntertek ScanBi Diagnostics AB Box 166, SE-230 53, Alnarp, SwedenIntertek Secretaries Limited (i) Intertek Semko AB Torshamnsgatan 43, Box 1103, Kista, S-164 22, SwedenIntertek Services (Pty) Ltd 151 Monument Road, Aston Manor, 1619, South AfricaIntertek Servicios C.A. (i) Res. San Ignacio, Calle San Ignacio de Loyola con Avenue Francisco de Miranda, Local 3, Chacao, Caracas, VenezuelaIntertek Settlements Limited (i) Intertek Statius N.V. Man 'O' War #B3, Oranjestad, St. Eustatius, Netherlands AntillesIntertek Surveying Services (USA), LLC 3033 Chimney Rock Road, Suite 625, Houston TX 77056, United StatesIntertek Surveying Services UK Limited Redshank House, Alness Point Business Park, Alness, Highland, IV17 OUP, ScotlandIntertek Technical Inspections Canada Inc. (iv) 1829 32nd Avenue, Montreal H8T 3J1, CanadaIntertek Technical Services PTY Limited Level 3, 235 St Georges Terrace, Perth WA 6000, AustraliaIntertek Testing & Certification Limited Intertek Testing and Inspection Services UK Limited Intertek Testing Management Limited Intertek Testing Services (Australia) Pty Limited Level 3, 235 St Georges Terrace, Perth WA 6000, AustraliaIntertek Testing Services (Cambodia) Company Limited 13AC, Street 337, Sangkat Boeung Kak I, Khan Tuol Kork, Phnom Penh, CambodiaIntertek Testing Services (East Africa) Pty Limited Djibouti Free Zone, Room 19, Rue De Venice, P.O. Box 6419, Djibouti, Republique de Djibouti, South AfricaIntertek Testing Services (Fiji) Limited c/- BDO, Level 10, FNPF Place, 343 Victoria Parade, Suva, FijiIntertek Testing Services (Guangzhou) Ltd 3F Hengyun Building, 235 Kaifa Ave, Guangzhou Economic & Technological Development District, Guangzhou, 510730, ChinaIntertek Testing Services (ITS) Canada Ltd. 105-9000 Bill Fox Way, Burnaby BC V5J 5J3, CanadaIntertek Testing Services (Japan) K. K. Nihonbashi N Bldg, 1-4-2, Nihonbashi – Horidomecho, Chuo-ku, Tokyo, 103-0012, JapanIntertek Testing Services (NZ) Limited 3 Kepa Road, Ruakaka, Northland, 0171, New Zealand Intertek Testing Services (Shanghai FTZ) Co., LtdBuild T52-8, No. 1201, Gui Qiao Road, Jinqiao Development Area, Pudong District, Shanghai, 201206, ChinaIntertek Testing Services (Singapore) Pte Ltd. 80 Bendemeer Road #03-02, Hyflux Innovation Centre, 339949, SingaporeIntertek Testing Services (Thailand) Limited 1285/5 Prachachuen Road, Wong-Sawang Sub-District, Bangsue District, Bangkok, 10800, ThailandIntertek Testing Services Argentina S.A. Cerrito 1136, piso 3ro, Frente. Ciudad Autonoma de Buenos Aires, (C1010AAX), ArgentinaIntertek Testing Services Bolivia S.A. Calle Chichapi # 2125, Santa Cruz, de la Sierra, BoliviaIntertek Testing Services Caleb Brett Egypt Limited Intertek Testing Services Center LLC Office 165-N, Letter A, 21 Rozenshteina Street, 198095, Saint Petersburg, Russian Federation
Intertek Testing Services Chongqing Co., Limited 1-2/F, Building #3, 5 Gangcheng East Ring Road, Jiangbei District, Chongqing, ChinaIntertek Testing Services de Honduras, S.A. Edificio la Pradera, locales 5 y 6. 1-2 Ave, 1 calle, Puerto Cortes, Barrio el Centro, Honduras Intertek Testing Services De Mexico, S.A. De C.V. (iii) Poniente 134, No 660 Industrial Vallejo, Mexico DF CP, 02300, MexicoIntertek Testing Services Environmental Laboratories Inc. (i)Lexis Document Services, 15 East North Street, Dover, Delaware, 19901, United StatesIntertek Testing Services International (Hong Kong) Limited 11/F, Unit IJK, Garment Centre, 576 Castle Peak Road, Kowloon, Hong KongIntertek Testing Services International AB (i)
Box 1103, Kista, 16422, SE, SwedenIntertek Testing Services Korea Limited 1st Fl., Aju Digital Tower, 284-56, Seongsu-dong 2-ga, Seongdong-gu, Seoul 133-120, Republic of KoreaIntertek Testing Services NA Limited1829 32nd Avenue, Lachine QC H8T 3JI, CanadaIntertek Testing Services NA Sweden AB (i)
c/o Intertek Semko AB, Box 1103, Kista, 16422, SwedenIntertek Testing Services Namibia (Proprietary) Limited 15th Floor, Frans Indongo Gardens, Dr Frans Indongo Street, Windhoek, NamibiaIntertek Testing Services Pacific Limited 11/F, Unit IJK, Garment Centre, 576 Castle Peak Road, Kowloon, Hong KongIntertek Testing Services Peru S.A. Jr. Mariscal Jose de la Mar No. 200 Urb., Res. El Pino, San Luis, Lima, PeruIntertek Testing Services Philippines, Inc. Intertek Building, 2307 Chino Roces Avenue Extension, Metro Manila, Makati City, 1231, PhilippinesIntertek Testing Services Taiwan Limited 8F No. 423 Ruiguang Rd, Neihu District, Taipei, 11492, TaiwanIntertek Testing Services Tianjin Limited 2-F, No. 7 GuiYuan Road, Yi Shang Hu Tong Building, Hua Yuan High-tech Industry Park, Tianjin, ChinaIntertek Timor, S.A. Hotel Timor, Colmera, Vera Cruz, Dili, Timor-LesteIntertek Torton Limited11/F, Unit IJK, Garment Centre, 576 Castle Peak Road, Kowloon, Hong KongIntertek Training Malaysia Sdn. Bhd. 6-L12-01, Level 12, Tower 2, Menara PGRM, No. 6 & 8 Jalan Pudu Ulu, Cheras, 56100 Kuala Lumpur, MalaysiaIntertek Trinidad Limited #91-92 Union Road, Marabella, Trinidad and TobagoIntertek UK Holdings Limited Intertek Ukraine Chernomorskogo Kazachestva, 115, Office 507, Odessa, 65003, UkraineIntertek USA Finance LLCc/o CSC Services of Nevada, Inc., 2215-B Renaissance Dr, Las Vegas NV 89919, United StatesIntertek Vietnam Limited 3rd & 4th floor, Au Viet Building, No. 01 Le Duc Tho Str., Mai Dich Ward, Cau Giay District, Hanoi City, VietnamIntertek West Africa SARL Rue du Canal de Vridi Face Appontement, SIAP, Abidjan, 15 BP 882, Cote d'IvoireIntertek West Lab AS Oljev 2, 4056 Tananger, 1124 Sola, NorwayITS (PNG) LimitedSection 27 Allotment 27, Voco Point, Lae, Morobe Province, Papua New GuineaITS Hong Kong NA, Limited (i) 2/F Garment Centre, 576 Castle Peak Road, Kowloon, Hong KongITS Labtest Bangladesh Limited Phoenix Tower, Plot – 407 (3rd Floor), Tejgaon I/A, Dhaka, BangladeshITS Testing Holdings Canada Limited (Canada)3771 North Fraser Way, Suite 17, Burnaby BC V5J 5G5, CanadaITS Testing Services (UK) LimitedLabtest International Inc. 2107 Swift Drive, No 200, Oak Brook, Illinois, 60523, United States

INTERTEK GROUP PLC ANNUAL REPORT AND ACCOUNTS 2016138
FINANCIAL STATEMENTS NOTES TO THE FINANCIAL STATEMENTS
NOTES TO THE FINANCIAL STATEMENTS continued23 Principal Group companies (continued)FULLY OWNED SUBSIDIARIES (CONTINUED)Lintec Testing Services Limited Louisiana Grain Services, Inc. (i) c/o CT Corp, 8550 United Plaza Blvd, Baton Rouge LA 70809, United StatesMace Land Company, Inc. 3114 Scarboro Road, Street MD 21154, United StatesManagement & Industrial Consultancy (i) 59 Road No.104, Second Floor, Maadi, Cairo, EgyptManagement Systems International Limited (i) Material Testing Lab, Inc. 145 Sherwood Avenue, Farmingdale NY 11735, United StatesMaterials Testing & Inspection Services Limited McPhar Geoservices (Philippines) Inc. (i) Building 7 & 8 Philcrest 1 Compound, Km23 West Service Road, Bo. Cupang , Muntinlupa City, PhilippinesMelbourn Scientific Limited Melbourn Scientific, Saxon Way, Melbourn, Hertfordshire, Royston, SG8 6DN, United KingdomMetoc LimitedMidwest Engineering Services, Inc. CT Corporation System, 8020 Excelsior Dr. Suite 200, Madison WI 53717, United StatesMoody Algerie SARL Cité SERBAT, Bat. B2/C2, N°03, Garidi 1, 16051, Kouba, Wilaya d'Alger, AlgeriaMoody Energy Technical Service Co Ltd Rm. A201, B-2 East 3rd, Ring Road North Road, Chaoyang District, Beijing, 100027, ChinaMoody International (Holdings) Limited Moody International (India) Private Limited E-20, Block B1, Mohan Co-operative Industrial Area, Mathura Road, New Delhi, 110044, IndiaMoody International (Malaysia) Sdn. Bhd. 6-L12-01, Level 12, Tower 2, Menara PGRM, No. 6 & 8 Jalan Pudu Ulu, Cheras, 56100 Kuala Lumpur, MalaysiaMoody International (Russia) Limited Moody International Angola Ltda Rua de Macau, Edifico ex Edil Apto 1, Res de Chao Esq. C.P 215, Cabinda, AngolaMoody International Certification India Limited E-20, Block B1, Mohan Co-operative Industrial Area, Mathura Road, New Delhi, 110044, IndiaMoody International de Argentina SA Cerrito 1136, 2nd Floor, CF, Buenos Aires, C1010AAX, ArgentinaMoody International Holdings LLC 24900 Pitkin Rd., Ste. 200, The Woodlands TX 77386, United StatesMoody International LLC (i) 18A Kikvidze str., 01133, Kiev, UkraineMoody International Philippines Inc. (i)Intertek Building, 2310 Chino Roces Avenue Extension, Metro Manila, Makati City, 1231, PhilippinesMoody International Scandinavia AB (i) Box 1103, Kista, 16422, SE, SwedenMoody Shanghai Consulting Ltd 1F, No. 5 Building, 912 Bibo Road, Zhangjiang Hi-Tech Park, Shanghai, 201203, ChinaMoody United Certification Limited (i)
2F, No. 5 Building, 912 Bibo Road, Pudong, Shanghai, 201203, ChinaMT Group LLC 145 Sherwood Avenue, Farmingdale NY 11735, United StatesMT Operating of New Jersey LLC 145 Sherwood Avenue, Farmingdale NY 11735, United StatesMT Operating of New York LLC 145 Sherwood Avenue, Farmingdale NY 11735, United StatesNDT Services Limited Northern Territory Environmental Laboratories Pty Ltd (i) Level 3, 235 St Georges Terrace, Perth WA 6000, Australia
Paulsen & Bayes-Davy Ltd 11/F, Unit IJK, Garment Centre, 576 Castle Peak Road, Kowloon, Hong KongPetroleum Services of Union Lab Sdn. Bhd. Suite C-7-10 (B), Level 9, Block C, UE3 Corporate Offices, Menara Uncang Emas, No 85 Jalan Loke Yew, Taman Miharja, 55200 Kuala Lumpur, MalaysiaPittsburgh Testing Laboratory, Inc PSI, 850 Poplar Street, Pittsburgh PA 15220, United StatesProfessional Service Industries Holding, Inc. Corporation Trust Center, 1209 Orange Street, Wilmington, DE, 19801, United StatesProfessional Service Industries (Canada) Inc. (i) 200 Bay Street, Suite 3800, Royal Bank Plaza, South Tower, Toronto ON M5J 2J7, CanadaProfessional Service Industries, Inc. Corporation Trust Center, 1209 Orange Street, Wilmington, DE, 19801, United StatesPSI Acquisitions, Inc. Corporation Service Company, 2711 Centerville Road, Suite 400, Wilmington 19808, United StatesPT. Moody Technical Services Graha STR 3rd floor, Suite#302, Jl. Ampera Raya No. 11, Jakarta, 12550, IndonesiaPT. RCG Moody Graha STR 3rd floor, Suite#302, Jl. Ampera Raya No. 11, Jakarta, 12550, IndonesiaRCG Moody International Uruguay S.A. Cerrito 507, 4th Floor, Off. 46, 47, Montevideo 11000, UruguayS.A.R.L. Intertek OCA France Route Industrielle – Centre Routier, 76600, Gonfreville L'Orcher, FranceSchindler & Associates (L.C.) (i) 24900 Pitkin Rd., Ste. 200, The Woodlands TX 77386, United StatesShanghai Orient Intertek Testing Services Company Limited Build T52-8, No. 1201, Gui Qiao Road, Jinqiao Development Area, Pudong District, Shanghai, 201206, ChinaShanghai Tianxiao Investment Consultancy Company Limited Room 520, No. 5-6, Lane 1218, WanRong Road, ZhaBei District, Shanghai, ChinaTechnical Company for Testing and Conformity Services & Systems LLC Gates No. 1/2/6, Building 73/ Area 903, Karadah, Al Rusafa, Baghdad, IraqTesting Holdings Sweden AB Torshamnsgatan 43, Box 1103, Kista, S-164 22, SwedenTradegood Singapore Pte. Ltd. (i) 80 Bendemeer Road #03-02, Hyflux Innovation Centre, 339949, SingaporeTradegood WFOE – Beijing Rui Gu Information Consultancy Company Ltd (i)
Room 802, Information Building, Linyin North Road No.13, Pinggu District, Beijing City, 101200, ChinaTradegood.com International Limited 11/F, Unit IJK, Garment Centre, 576 Castle Peak Road, Kowloon, Hong KongUAB Intertek Lithuania (ii)
Jogailos 9, Vilnius, LithuaniaVan Sluys & Bayet NV Kruisschansweg 11, 2040 Antwerp, BelgiumWhite Land Company, Inc. 3114 Scarboro Road, Street MD 21154, United StatesWilson Inspection X-Ray Services, Inc. Michael E Wilson, 6010 Edgewater Dr., Corpus Christi TX 78412, United StatesWisco SE Asia PTE Limited (i) 80 Bendemeer Road #03-02, Hyflux Innovation Centre, 339949, SingaporeYickson Enterprises Limited 11/F, Unit IJK, Garment Centre, 576 Castle Peak Road, Kowloon, Hong KongYoungever Holdings Ltd. 171 Main Street, Road Town, P.O. Box 4041, Tortola, VG 1110, British Virgin Islands

INTERTEK GROUP PLC ANNUAL REPORT AND ACCOUNTS 2016 139
FINANCIAL STATEMENTSNOTES TO THE FINANCIAL STATEMENTS
23 Principal Group companies (continued)RELATED UNDERTAKINGS WHERE THE EFFECTIVE INTEREST IS LESS THAN 100%Caleb Brett Abu Dhabi LLC (49%)CB UAE (Private) Ltd, c/o Al Nahiya Group, PO Box 3728, Abu Dhabi, United Arab EmiratesEuro Mechanical Instrument Services LLC (49%)PO Box 46153, Abu Dhabi, United Arab EmiratesInternational Inspection Services LLC (70%) PO Box 193, Al Hamriyah, Muscat, PC 131, OmanIntertek (Qeshm Island) Limited (51%)Unit 107, Goldis Building, Valiasr Boulevard, Qeshm Island, Islamic Republic of IranIntertek Angola LDA (99%)282 Rua Amilcar Cabral no.147 2nd floor, Apartment Z, Luanda, AngolaIntertek do Brasil Inspecoes Ltda (99%)Av Eng. Augusto Barata s/n, Alamoa, Santos, SP, CEP11095-650, BrazilIntertek ETL SEMKO KOREA Limited (90%)5F, Intertek building, Gongdan-ro, 160beon-gil 3, Gunpo-si, Gyeonggi-do, 15845, Republic of KoreaIntertek Kimsco Co. Ltd.(vii) (50%)Intertek Building, 3, Gongdan-ro, 160beon-gil, Gunpo-si, Gyeonggi-do, 15845, Republic of KoreaIntertek Lanka (Private) Limited (70%)Intertek House, No: 282, Kaduwela Road, Battaramulla, Sri LankaIntertek Libya Technical Services and Consultations Company Spa (65%)PO Box 3788, Al Shaat Road, Souq Al-Juma, Tripoli, LibyaIntertek Life Bridge (Shanghai) Testing Services Co., Ltd. (80%)Room 401, Building #5-6, Lane 1218, WanRong Road, JinAn District, Shanghai, Shandong, ChinaIntertek Robotic Laboratories Pty Limited(vii) (50%)15 Davison Street, Maddington WA 6109, AustraliaIntertek Test Hizmetleri Anonim Sirketi (85%)Merkez Mahallesi, Sanayi Cad. No.23, Altindag Plaza, Yenibosna-34197, Istanbul, TurkeyIntertek Testing Services (Hangzhou) Limited (70%)No. 16, First Street South, Hangzhou Economic Development Zone, Hangzhou, Zhejiang Province, 310018, ChinaIntertek Testing Services (South Africa) (Proprietary) Limited (75%)5th Floor, Charter House, 13 Brand Road, Glenwood, Durban, South AfricaIntertek Testing Services Nigeria Limited (65.93%)No. 2 Bombay Crescent, Apapa, Lagos, NigeriaIntertek Testing Services Wuxi Ltd (70%)No. 8 Fubei Road, Xishan Economic Development Zone, Wuxi, Jiangsu, 214101, ChinaITS (Subic Bay), Inc. (99%)Area 8 – 10, Lots 11/12 Boton Wharf, Argonaut Highway, Subic Bay, Freeport Zone, Olongapo City, PhilippinesITS Caleb Brett Deniz Survey A S(viii) (50%)Ulus Mah. Oz Topuz cad. no.32, Besiktas, Istanbul, 34340, TurkeyITS Testing Services Holdings (M) Sdn Bhd (49%)Unit 30-01, Level 30, Tower A, Vertical Business Suite, Avenue 3, Bangsar South, No.8, Jalan Kerinchi, 59200 Kuala Lumpur, Malaysia
ITS Testing Services (M) Sdn Bhd (74%)Unit 30-01 Level 30, Tower A, Vertical Business Suite, Avenue 3, Bangsar South, No. 8, Jalan Kerinchi, 59200 Kuala Lumpur, Malaysia Laboratorios ABC Química, Investigación y Análisis(vii) (10%)Jacarandas No. 19, Colonia San Clemente, Delegación Álvaro Obregón, Mexico City, C.P. 01740, México, Ciudad de México Laboratory Services International Rotterdam B.V (75%)Pittsburghstraat 9, 3047 BL, Rotterdam, NetherlandsLynx Diagnostics Inc.(viii) (50%)#220, 8 Perron Street, St Albert AB T8N 1E4, CanadaMoody International Bangladesh Limited (99.9%)House 6, Road 17/A, Block E, Ground Floor, Banani, Dhaka, 1213, BangladeshMoody International Certification Limited (40%) Brivibas iela 85, Riga, LV-1001Moody International Certification Ltd (40%)53, Nautic, Triq l-Ortolan, San Gwann, SGN 1943, MaltaMoody International Holdings Chile Ltda (99%)Coyancura 2283, Piso 12, Providencia, Santiago, ChileMoody International SA (35%) 4 Rue Des Brasseurs, Zone 3 Abidjan, Cote d'IvoireMoody International Lanka (Private) Ltd. (99.9%)no. 5, St Albans Place, Colombo – 4, Sri LankaPT Citrabuana Indoloka (viii) (50%)Jl. Raya Bogor KM 28, RT/RW. 04/07, Kel. Pekayon, Kec. Pasar Rebo, Jakarta Timur, 13710, IndonesiaPT. Intertek Utama Services (viii) (50%)Jl. Raya Bogor KM. 28, RT/RW. 04/07, Kel. Pekayon, Kec. Pasar Rebo, Jakarta Timur, 13710, IndonesiaQatar Calibration Services LLC (49%)Petrotec, PO Box 16069, 8th Floor, Toyota Tower, Doha, QatarRCG Moody International de Venezuela S.A. (i) (99%)Res Morgana, p_4, #04, Av.Andres Bello, Fco de Miranda, Los Polos Grandes, Caracas, VenezuelaShanghai Moody Management & Technical Services Co. Ltd (90%)Room 225, No. 14 at Lane No. 1700 Luo Shan Road, Shanghai, ChinaSociete Tunisienne d’Inspection Caleb Brett SARL (51%) 67 rue Ech-Chem, Tunis, 1002, TunisiaUzIntertek Testing Services LLC (51%)Abdulla Kodiriy Str., C-4, House 24,100017, Tashkent, Uzbekistan
ASSOCIATESIntertek Riyadh Geotechnique and Foundations Laboratory (51%)Buildings Number 1 and 2, Khamra Area, Mikaish 2, Jeddeh, Saudi ArabiaDecernis LLC (20%)1250 Connecticut Avenue, NW, Suite 200, Washington WA DC 20036, United States
(i) Dormant Company.(ii) In Liquidation.(iii) Ownership held in class of A shares and B shares.(iv) Ownership held in class of A shares and E shares.(v) Ownership held in ordinary and preference shares.(vi) Shares held in Class A, B, C, D, E and F.(vii) Ownership held in class I Series B shares and class II Series B shares.(viii) Intertek shares joint control over the company under a shareholders’
agreement, and its rights to the profit, assets and liabilities of the company are dependent on the performance of the Group’s brands rather than the effective equity ownership of the company.

INTERTEK GROUP PLC ANNUAL REPORT AND ACCOUNTS 2016140
FINANCIAL STATEMENTS INTERTEK GROUP PLC – COMPANY PRIMARY STATEMENTS AND NOTES INTERTEK GROUP PLC – COMPANY PRIMARY STATEMENTS AND NOTES
INTERTEK GROUP PLC – COMPANY BALANCE SHEET
As at 31 December 2016 Notes2016
£m2015
£m
Fixed assetsInvestments in subsidiary undertakings (d) 318.1 308.1
Current assetsDebtors due after more than one year (e) 124.5 124.5Debtors due within one year 57.9 66.9
182.4 191.4Cash at bank and in hand 0.5 1.0
182.9 192.4Creditors due within one yearOther creditors (13.2) (30.6)
(13.2) (30.6)Net current assets 169.7 161.8Total assets less current liabilities 487.8 469.9
Creditors due after one yearOther creditors (f) (26.4) (55.2)
(26.4) (55.2)Net assets 461.4 414.7
Capital and reservesCalled up share capital (g) 1.6 1.6Share premium (g) 257.8 257.8Profit and loss account (g) 202.0 155.3Shareholders’ funds 461.4 414.7
The profit for the financial year was £129.4m (2015: £21.8m).
The financial statements on pages 140 to 144 were approved by the Board on 6 March 2017 and were signed on its behalf by:
André Lacroix Edward LeighChief Executive Officer Chief Financial Officer

INTERTEK GROUP PLC ANNUAL REPORT AND ACCOUNTS 2016 141
FINANCIAL STATEMENTS INTERTEK GROUP PLC – COMPANY PRIMARY STATEMENTS AND NOTES INTERTEK GROUP PLC – COMPANY PRIMARY STATEMENTS AND NOTES
INTERTEK GROUP PLC – COMPANY STATEMENT OF CHANGES IN EQUITY
Notes
Sharecapital
£m
Sharepremium
£m
Retainedearnings
£m
Totalequity
£m
At 1 January 2015 1.6 257.8 208.3 467.7Total comprehensive income for the yearProfit (b) – – 21.8 21.8Total comprehensive income for the year – – 21.8 21.8Transactions with owners of the company recognised
directly in equityContributions by and distributions to the owners of
the companyDividends paid (c) – – (80.7) (80.7)Purchase of own shares – – (5.2) (5.2)Tax paid on Share Awards vested – – (1.8) (1.8)Equity-settled transactions (d) – – 12.9 12.9Total contributions by and distributions to the owners of the
company – – (74.8) (74.8)At 31 December 2015 1.6 257.8 155.3 414.7
At 1 January 2016 1.6 257.8 155.3 414.7Total comprehensive income for the yearProfit (b) – – 129.4 129.4Total comprehensive income for the year – – 129.4 129.4Transactions with owners of the company recognised
directly in equityContributions by and distributions to the owners of
the companyDividends paid (c) – – (88.0) (88.0)Purchase of own shares – – (6.4) (6.4)Tax paid on Share Awards vested – – (4.9) (4.9)Equity-settled transactions (d) – – 16.6 16.6Total contributions by and distributions to the owners of the
company – – (82.7) (82.7)At 31 December 2016 1.6 257.8 202.0 461.4

INTERTEK GROUP PLC ANNUAL REPORT AND ACCOUNTS 2016142
FINANCIAL STATEMENTS INTERTEK GROUP PLC – COMPANY PRIMARY STATEMENTS AND NOTES INTERTEK GROUP PLC – COMPANY PRIMARY STATEMENTS AND NOTES
(A) ACCOUNTING POLICIES – COMPANYThe following accounting policies have been applied consistently in dealing with items which are considered material in relation to the Company’s financial statements.
Basis of preparationThese financial statements were prepared in accordance with Financial Reporting Standard 101 Reduced Disclosure Framework (‘FRS 101’). The amendments to FRS 101 (2014/15 Cycle) issued in July 2015 and effective immediately have been applied.
In preparing these financial statements, the Company applies the recognition, measurement and disclosure requirements of International Financial Reporting Standards as adopted by the EU (‘Adopted IFRSs’), but makes amendments where necessary in order to comply with Companies Act 2006 and has set out below where advantage of the FRS 101 disclosure exemptions has been taken.
In these financial statements, the Company has applied the exemptions available under FRS 101 in respect of the following disclosures:
• a Cash Flow Statement and related notes;• Comparative period reconciliations for share capital;• Disclosures in respect of transactions with wholly owned subsidiaries;• Disclosures in respect of capital management; • the effects of new but not yet effective IFRSs; • an additional balance sheet for the beginning of the earliest comparative period following the retrospective change
in accounting policy; • Disclosures in respect of the compensation of Key Management Personnel; and• Certain disclosures required by IFRS 13 Fair Value Measurement and the disclosures required by IFRS 7 Financial Instrument
Disclosures on the basis that the consolidated financial statements include the equivalent disclosures.
As the consolidated financial statements include the equivalent disclosures, the Company has also taken the exemptions under FRS 101 available in respect of IFRS 2 Share Based Payments in respect of group settled share based payments.
The Company proposes to continue to adopt the reduced disclosure framework of FRS 101 in its next financial statements.
Under Section 408 of the Companies Act 2006 the Company is exempt from the requirement to present its own profit and loss account.
The accounting policies set out below have, unless otherwise stated, been applied consistently to all periods presented in these financial statements.
Foreign currenciesTransactions in foreign currencies are recorded to the Company’s functional currency, sterling, using the rate of exchange ruling at the date of the transaction. Monetary assets and liabilities in foreign currencies are translated into sterling at the rates of exchange prevailing at the balance sheet date. All foreign exchange differences are taken to the profit and loss account.
TaxationTax on the profit or loss for the year comprises current and deferred tax. Tax is recognised in the profit and loss account except to the extent that it relates to items recognised directly in equity or other comprehensive income, in which case it is recognised directly in equity or other comprehensive income.
Current tax is the expected tax payable or receivable on the taxable income or loss for the year, using tax rates enacted or substantively enacted at the balance sheet date, and any adjustment to tax payable in respect of previous years.
Deferred tax is provided on temporary differences between the carrying amounts of assets and liabilities for financial reporting purposes and the amounts used for taxation purposes. The following temporary differences are not provided for: the initial recognition of goodwill; the initial recognition of assets or liabilities that affect neither accounting nor taxable profit other than in a business combination; and differences relating to investments in subsidiaries to the extent that they will probably not reverse in the foreseeable future. The amount of deferred tax provided is based on the expected manner of realisation or settlement of the carrying amount of assets and liabilities, using tax rates enacted or substantively enacted at the balance sheet date.
A deferred tax asset is recognised only to the extent that it is probable that future taxable profits will be available against which the temporary difference can be utilised.
NOTES TO THE COMPANY FINANCIAL STATEMENTS

INTERTEK GROUP PLC ANNUAL REPORT AND ACCOUNTS 2016 143
FINANCIAL STATEMENTS INTERTEK GROUP PLC – COMPANY PRIMARY STATEMENTS AND NOTES INTERTEK GROUP PLC – COMPANY PRIMARY STATEMENTS AND NOTES
Dividends on shares presented within shareholders’ fundsDividend income is recognised in profit or loss on the date that the Company’s right to receive payment is established.
Dividends unpaid at the balance sheet date are only recognised as a liability at that date to the extent that they are appropriately authorised and are no longer at the discretion of the Company. Unpaid dividends that do not meet these criteria are disclosed in the notes to the financial statements.
Investments in subsidiariesInvestments in subsidiaries are stated at cost less any provisions for impairment.
Intercompany financial guaranteesWhen the Company enters into financial guarantee contracts to guarantee the indebtedness of other companies in the Group, the Company considers these to be insurance arrangements and accounts for them as such. In this respect the Company treats the guarantee contract as a contingent liability, until such time as it becomes probable that the Company will be required to make a payment under the guarantee.
Share-based paymentsIntertek Group plc runs a share ownership programme that allows Group employees to acquire shares in the Company. Details of the share schemes are given in note 17 of the Group financial statements.
(B) PROFIT AND LOSS ACCOUNTAmounts paid to the Company’s auditor and their associates in respect of services to the Company, other than the audit of the Company’s financial statements, have not been disclosed as the information is required instead to be disclosed on a consolidated basis. The Company does not have any employees.
Details of the remuneration of the Directors are set out in the Remuneration report.
(C) DIVIDENDSThe aggregate amount of dividends comprises:
2016£m
2015£m
Final dividend paid in respect of prior year but not recognised as a liability in that year 56.8 53.3Interim dividends paid in respect of the current year 31.2 27.4Aggregate amount of dividends paid in the financial year 88.0 80.7
The aggregate amount of dividends proposed and recognised as liabilities as at 31 December 2016 is £nil (2015: £nil). The aggregate amount of dividends proposed and not recognised as liabilities as at 31 December 2016 is £69.4m (2015: £57.0m).
(D) INVESTMENT IN SUBSIDIARY UNDERTAKINGS
2016£m
2015£m
Cost and net book valueAt 1 January 308.1 300.9Additions due to share-based payments 16.6 12.9Recharges of share-based payments to subsidiaries (6.6) (5.7)At 31 December 318.1 308.1
The Company has granted options over its own shares and made Share Awards to the employees of its direct and indirectly-owned subsidiaries, and as such, the Company recognises an increase in the cost of investment in subsidiaries of £16.6m (2015: £12.9m). Details of the principal operating subsidiaries are set out in note 23 to the Group financial statements.
The Company had two direct subsidiary undertakings at 31 December 2016; Intertek Testing Services Holdings Limited and Intertek Holdings Limited, both of which are holding companies, are incorporated in the United Kingdom and registered in England and Wales. All interests are in the ordinary share capital and all are wholly owned. In the opinion of the Directors, the value of the investments in subsidiary undertakings is not less than the amount at which the investments are stated in the balance sheet.
There is no impairment to the carrying value of these investments.

INTERTEK GROUP PLC ANNUAL REPORT AND ACCOUNTS 2016144
FINANCIAL STATEMENTS INTERTEK GROUP PLC – COMPANY PRIMARY STATEMENTS AND NOTES INTERTEK GROUP PLC – COMPANY PRIMARY STATEMENTS AND NOTES
NOTES TO THE COMPANY FINANCIAL STATEMENTS continued(E) DEBTORS DUE AFTER MORE THAN ONE YEAR
2016£m
2015£m
Amounts owed by Group undertakings 124.5 124.5
The amounts owed by Group undertakings represent long-term loans due in two to five years, which carry interest based on the denomination of the borrowing currency.
(F) CREDITORS DUE AFTER MORE THAN ONE YEAR
2016£m
2015£m
Amounts owed to Group undertakings 26.4 55.2
The amounts owed to Group undertakings represent long-term loans due in two to five years, which carry interest based on the denomination of the borrowing currency.
(G) STATEMENT OF CHANGES IN EQUITYDetails of share capital are set out in note 15 and details of share-based payments are set out in note 17 to the Group financial statements.
A profit and loss account for Intertek Group plc has not been presented as permitted by Section 408 of the Companies Act 2006. The profit for the financial year, before dividends paid to shareholders of £88.0m (2015: £80.7m), was £129.4m (2015: £21.8m) which was mainly in respect of dividends received from subsidiaries.
The Company has sufficient distributable reserves to pay dividends for a number of years, and when required the Company can receive dividends from its subsidiaries to further increase distributable reserves.
The Group settled in cash the tax element of the Share Awards vested in 2016 amounting to £5.2m of which the Company settled £4.9m (2015: £1.8m).
During the year ended 31 December 2016, the Company purchased, through its Employee Benefit Trust, 200,000 (2015: 200,126) of its own shares with an aggregate nominal value of £2,000 (2015: £2,001) for £6.4m (2015: £5.2m) which was charged to profit and loss in equity.
(H) RELATED PARTY TRANSACTIONSDetails of related party transactions are set out in note 21 of the Group financial statements.
(I) CONTINGENT LIABILITIESThe Company is a member of a group of UK companies that are part of a composite banking cross guarantee arrangement. This is a joint and several guarantee given by all members of the Intertek UK cash pool, guaranteeing the total gross liability position of the pool which was £5.9m at 31 December 2016 (2015: £10.5m).
From time to time, in the normal course of business, the Company may give guarantees in respect of certain liabilities of subsidiary undertakings.
(J) POST BALANCE SHEET EVENTSDetails of post balance sheet events relevant to the Company and the Group are given in note 18 of the Group financial statements.