notes to the consolidated financial · pdf filethe group’s consolidated financial...
TRANSCRIPT
1. Reporting EntityAsahi Group Holdings, Ltd. (“the Company”) is a corporation domiciled in Japan. The Company and its subsidiaries (“the Group”) are engaged primarily in manufacturing and marketing of alcohol beverages, soft drinks, and food.
2. Basis of PreparationThe Group’s consolidated financial statements have been prepared in accordance with International Financial Reporting Standards (IFRS). The Company is qualified as a “Specified Company” as provided in Article 1-2 of “Ordinance on Terminology, Forms and Preparation Methods of Consolidated Financial Statements” (Ordinance of the Ministry of Finance No. 28 of 1976). Article 93 of this ordinance allows Specified Companies to prepare consolidated financial statements under IFRS. The Group’s consolidated financial statements for the year ended December 31, 2016 were authorized for issue by Akiyoshi Koji, President and Representative Director, and Kenji Hamada, Chief Financial Officer, on March 29, 2017. The Group has adopted IFRS from the current year (begins on January 1, 2016 and ends on December 31, 2016), and the consolidated financial statements for the current year are the first consolidated financial statements pre-pared in accordance with IFRS. The date of transition to IFRS is January 1, 2015. For the transition, the Group has adopted IFRS 1 “First-time Adoption of International Financial Reporting Standards.” The effect of the transition to IFRS on the Group’s financial position, financial performance, and cash flows is described in “41. Disclosures regarding the Transition to IFRS.”
The Group’s consolidated financial statements are prepared on the cost basis, except for the financial instruments and other items as described in “5. Significant Accounting Policies.”
The preparation of consolidated financial statements in conformity with IFRS requires accounting estimates on certain critical items. It also requires management to make judgments in applying the Group’s accounting policies.
The Group’s consolidated financial statements are presented in Japanese yen, which is the functional currency of the Company. Amounts presented in the consolidated financial statements are rounded down to the nearest million yen.
3. Early Application of New Standards and InterpretationsThe Group has early applied IFRS 9 “Financial Instruments” (2014).
NOTES TO THE CONSOLIDATED FINANCIAL STATEMENTSAsahi Group Holdings, Ltd. and Consolidated Subsidiaries
8 ASAHI GROUP HOLDINGS, LTD.
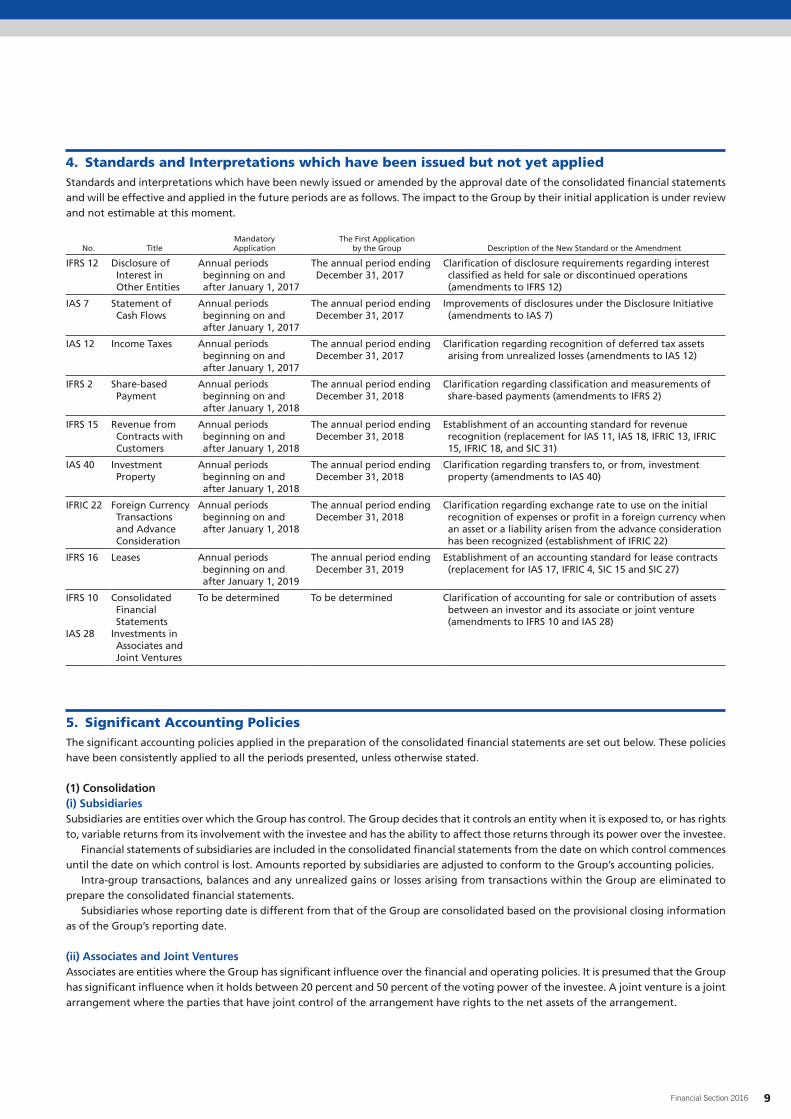
4. Standards and Interpretations which have been issued but not yet appliedStandards and interpretations which have been newly issued or amended by the approval date of the consolidated financial statements and will be effective and applied in the future periods are as follows. The impact to the Group by their initial application is under review and not estimable at this moment.
No. TitleMandatory Application
The First Application by the Group Description of the New Standard or the Amendment
IFRS 12 Disclosure of Interest in Other Entities
Annual periods beginning on and after January 1, 2017
The annual period ending December 31, 2017
Clarification of disclosure requirements regarding interest classified as held for sale or discontinued operations (amendments to IFRS 12)
IAS 7 Statement of Cash Flows
Annual periods beginning on and after January 1, 2017
The annual period ending December 31, 2017
Improvements of disclosures under the Disclosure Initiative (amendments to IAS 7)
IAS 12 Income Taxes Annual periods beginning on and after January 1, 2017
The annual period ending December 31, 2017
Clarification regarding recognition of deferred tax assets arising from unrealized losses (amendments to IAS 12)
IFRS 2 Share-based Payment
Annual periods beginning on and after January 1, 2018
The annual period ending December 31, 2018
Clarification regarding classification and measurements of share-based payments (amendments to IFRS 2)
IFRS 15 Revenue from Contracts with Customers
Annual periods beginning on and after January 1, 2018
The annual period ending December 31, 2018
Establishment of an accounting standard for revenue recognition (replacement for IAS 11, IAS 18, IFRIC 13, IFRIC 15, IFRIC 18, and SIC 31)
IAS 40 Investment Property
Annual periods beginning on and after January 1, 2018
The annual period ending December 31, 2018
Clarification regarding transfers to, or from, investment property (amendments to IAS 40)
IFRIC 22 Foreign Currency Transactions and Advance Consideration
Annual periods beginning on and after January 1, 2018
The annual period ending December 31, 2018
Clarification regarding exchange rate to use on the initial recognition of expenses or profit in a foreign currency when an asset or a liability arisen from the advance consideration has been recognized (establishment of IFRIC 22)
IFRS 16 Leases Annual periods beginning on and after January 1, 2019
The annual period ending December 31, 2019
Establishment of an accounting standard for lease contracts (replacement for IAS 17, IFRIC 4, SIC 15 and SIC 27)
IFRS 10
IAS 28
Consolidated Financial Statements
Investments in Associates and Joint Ventures
To be determined To be determined Clarification of accounting for sale or contribution of assets between an investor and its associate or joint venture (amendments to IFRS 10 and IAS 28)
5. Significant Accounting PoliciesThe significant accounting policies applied in the preparation of the consolidated financial statements are set out below. These policies have been consistently applied to all the periods presented, unless otherwise stated.
(1) Consolidation(i) SubsidiariesSubsidiaries are entities over which the Group has control. The Group decides that it controls an entity when it is exposed to, or has rights to, variable returns from its involvement with the investee and has the ability to affect those returns through its power over the investee.
Financial statements of subsidiaries are included in the consolidated financial statements from the date on which control commences until the date on which control is lost. Amounts reported by subsidiaries are adjusted to conform to the Group’s accounting policies.
Intra-group transactions, balances and any unrealized gains or losses arising from transactions within the Group are eliminated to prepare the consolidated financial statements.
Subsidiaries whose reporting date is different from that of the Group are consolidated based on the provisional closing information as of the Group’s reporting date.
(ii) Associates and Joint VenturesAssociates are entities where the Group has significant influence over the financial and operating policies. It is presumed that the Group has significant influence when it holds between 20 percent and 50 percent of the voting power of the investee. A joint venture is a joint arrangement where the parties that have joint control of the arrangement have rights to the net assets of the arrangement.
9Financial Section 2016
Investments in associates and joint ventures are accounted for using the equity method (equity-accounted investees). Under the equity method, an investment is initially recognized at cost. The consolidated financial statements include the Group’s share of changes in equity interest from the date that the Group obtained significant influence or joint control until the date on which the Group loses significant influence or joint control. The Group’s investments include goodwill recognized on the acquisition.
With regard to certain equity-accounted investees that operate in China, it is impracticable to access their financial statements in a timely manner although their reporting date is the same with that of the Group, due to regulatory constraints in the jurisdictions where such entities (including their parents) are located or listed or in the light of relationships with other shareholders. As a result, the con-solidated financial statements are prepared based on financial information for the period ended three months before the Group’s reporting date with adjustments for the effects of important transactions and events occurred between the end of the reporting period of the associate or joint venture and that of the Group.
Necessary adjustments are made when accounting policies of the associates and joint ventures are different from those of the Group to retain consistency.
(2) Business CombinationsThe Group applies the acquisition method to business combinations. The consideration is measured at fair value on the acquisition date which represents the total fair value of the assets transferred, the liabilities assumed and the equity instruments issued by the Group. Goodwill is recognized when the cost exceeds the fair values of the identifiable assets acquired and the liabilities assumed. On the contrary, when the cost is less than the fair values of the identifiable net assets, the excess is recognized in profit or loss. The Group elects to recognize non-controlling interests in the acquiree for each business combination, either at fair value or at the proportionate share of the identifiable net assets at the acquisition date, elected on a transaction-by-transaction basis. Acquisition-related costs are expensed as incurred. Additional acquisition of non-controlling interest after control is obtained is accounted for as equity transactions, and goodwill does not arise from such transactions accordingly.
The Group has elected to use an exemption in IFRS 1 and thereby does not apply IFRS 3 “Business Combinations” retrospectively to business combinations that occurred before the transition date. Those business combinations are accounted for under the previous GAAP (Japanese GAAP).
The Group applies book value accounting to acquisitions under common control, which are business combinations in which all of the combining entities or businesses are ultimately controlled by the same party or parties both before and after the business combinations, and that control is not transitory.
(3) Foreign Currency Translation(i) Functional Currency and Presentation CurrenciesItems included in the financial statements of each of the Group entities are measured using the currency of the primary economic environment in which the entity operates (“the functional currency”). The consolidated financial statements are presented in Japanese yen, which is the Group’s presentation currency.
(ii) Transactions and BalancesForeign currency transactions are translated into the functional currency using the exchange rates prevailing at the dates of the transac-tions. Foreign exchange gains and losses resulting from the settlement or translation of monetary assets and liabilities denominated in foreign currencies using the exchange rate at the reporting date are recognized in profit or loss, except for exchange differences arising from financial assets measured through other comprehensive income and qualifying cash flow hedges that are recognized in other comprehensive income.
(iii) Foreign OperationThe financial performance and the financial position of all group companies (none of them operates in a hyperinflationary economy) that have a functional currency different from the presentation currency are translated into the presentation currency using the following methods:(a) assets and liabilities are translated using the exchange rate at the reporting date;(b) income and expenses are translated at an average exchange rate (except for when use of the average exchange rate does not rea-
sonably approximate the cumulative effect of translation at the transaction dates, in which case income and expenses are translated using the exchange rate at each transaction date); and
(c) all resulting exchange differences are recognized in other comprehensive income and accumulated as translation difference on foreign operations within other components of equity.
In the case of partial disposal or sale of foreign operations, exchange differences accumulated through other comprehensive income are reclassified to profit or loss as a part of gains or losses related to the transaction.
The Group has elected to use an exemption in IFRS 1, and thereby reclassified all of the cumulative translation differences arising from foreign operations to retained earnings at the date of IFRS transition.
10 ASAHI GROUP HOLDINGS, LTD.

(4) Property, Plant and EquipmentBuildings and structures, machinery and vehicles, tools, fixtures and fittings, and land primarily consist of manufacturing and production facilities and properties of the head office. Items of property, plant and equipment are measured at cost less accumulated depreciation and impairment losses. The cost includes the purchase price, the cost directly related to acquisition of the assets, the costs of dismantling and removing the item and restoring the site on which the item has been located and borrowing costs to be capitalized.
Subsequent expenditures are included in the related asset’s carrying amount or recognized as a separate asset, as appropriate, only if it is probable that future economic benefits associated with the item will flow to the Group and the cost of the item can be measured reliably. The carrying amount of the replaced part is derecognized. All other repair and maintenance costs are recognized in profit or loss as incurred.
Land is not depreciated. The cost of each asset other than land is depreciated to residual value on a straight-line basis over the esti-mated useful lives, mainly as follows:
Buildings and structures 3–50 years Machinery and vehicles 2–15 years Tools, fixtures and fittings 2–20 yearsThe residual values, useful lives and the depreciation method are reviewed at each reporting date and adjusted if appropriate.Gains and losses on disposals are measured as the difference between the considerations and the carrying amount, and are recog-
nized in profit or loss.The Group has elected to use an exemption in IFRS 1, and thereby used fair value at the transition date as deemed cost for certain
items of property, plant and equipment.
(5) Borrowing CostsBorrowing costs that are directly attributable to the acquisition, construction or production of a qualifying asset, are capitalized until the assets get ready for their intended use or sale. Income earned on a temporary investment of specific borrowings until they are used for qualifying assets is deducted from the borrowing costs eligible for capitalization.
All other borrowing costs are recognized in profit or loss as incurred.
(6) Goodwill and Intangible Assets(i) GoodwillGoodwill is reviewed for impairment testing annually and is recognized at acquisition cost less accumulated impairment losses. Any impairment loss recognized on goodwill is not subsequently reversed. Gains or losses arising from sale of a business include the carrying amount of goodwill associated with the business.
Goodwill is allocated to cash-generating units or groups of cash-generating units which are expected to benefit from of the busi-ness combination.
(ii) TrademarksSeparately acquired trademarks are recognized at cost. Trademarks acquired through a business combination are recognized at their acquisition-date fair values. Trademarks are recognized at cost less accumulated amortization and impairment losses. Trademarks are amortized on a straight-line basis over their estimated useful lives mainly from 20 to 40 years, except for items with indefinite useful lives.
(iii) SoftwareSoftware is recognized at cost less accumulated amortization and impairment losses.
Development costs that are directly attributable to design and testing of software of the Group are recognized as intangible assets only if the expenditures can be measured reliably, the product or procedure is technically feasible, future economic benefits are prob-able and the Group intends to and has sufficient resources to complete development and use the asset.
Other development expenditures that do not meet these criteria are expensed as incurred. Development costs previously expensed are not recognized as assets in a subsequent period.
Software is amortized mainly over five years which is their estimated useful life.Costs associated with maintaining software are expensed as incurred.
(iv) Other Intangible AssetsOther intangible assets are measured at cost. They are amortized over the estimated useful lives, and are measured at cost less accumu-lated amortization and impairment losses. However, there are some assets that are not amortized since they last as long as the business continues, and thereby their useful lives are indefinite (e.g. land leasehold right). Amortization cost is allocated on a straight-line basis over the estimated useful lives.
The residual values, useful lives and the amortization method of intangible assets are reviewed at each reporting date and adjusted if appropriate.
11Financial Section 2016

(7) LeasesThe Group leases certain property, plant and equipment and intangible assets as a lessee. Leased property, plant and equipment and intangible assets where the Group holds substantially all the risks and rewards of ownership are classified as finance leases. Finance leases are capitalized at the lease commencement at the lower of the fair value of the leased property and the present value of the mini-mum lease payments.
Each lease payment is apportioned between the outstanding liability and finance expense. The interest elements, that are the finance expense, are recognized in profit or loss over the lease term so as to produce a constant rate of interest on the remaining bal-ance of the liability. A property, plant and equipment or an intangible asset under a finance lease is depreciated or amortized over the shorter of the useful life of the asset and the lease term.
Leases other than finance leases are classified as operating leases. A lease payment for an operating lease, less any lease incentive received or receivable from the lessor, is recognized in profit or loss on a straight-line basis over the lease term.
(8) Impairment of Non-financial AssetsGoodwill and intangible assets with indefinite useful lives are not amortized but reviewed annually for impairment testing. Assets that are subject to depreciation or amortization are reviewed for impairment when occurrence of an event or a change in circumstances indicates that the carrying amount may not be recoverable. An impairment loss is recognized for the amount by which the asset’s car-rying amount exceeds its recoverable amount. The recoverable amount is the higher of an asset’s fair value less costs of disposal and value in use. For the purpose of assessing impairment, assets are divided into the smallest groups of assets that generate independent cash inflows (cash-generating units). Impairment losses on non-financial assets other than goodwill are subsequently reviewed for pos-sible reversal at each reporting date.
(9) Financial Instruments(i) Financial Assetsa. Initial Recognition and MeasurementThe Group recognizes financial assets when it becomes a party to the contract. Financial assets purchased or sold in a regular way are recognized on the trade date. Financial assets are classified as assets measured at amortized cost or measured at fair value.
Financial assets measured at fair value through profit or loss are measured at their fair value upon initial recognition. Financial assets measured at fair value through other comprehensive income and financial assets measured at amortized cost are recognized at their fair value plus transaction costs that are directly attributable to the transactions.
The Group determines the classification under IFRS 9 “Financial Instruments” on the basis of the facts and circumstances that existed at the date of transition. Equity instruments are designated as equity investments at fair value through other comprehensive income.(a) Financial Assets measured at Amortized Cost Financial assets are classified as assets measured at amortized cost only if the assets are held within the Group’s business model
whose objective is to hold assets in order to collect contractual cash flow, and the contractual terms of the financial assets give rise on specified dates to cash flows which are solely payments of principal and interest on the principal amount outstanding.
(b) Financial Assets measured at Fair ValueAssets that do not meet either of the aforementioned two criteria are classified as financial assets measured at fair value. As for a financial asset measured at fair value, the Group measures such an asset at fair value through profit or loss or may desig-nate it as a financial asset measured at fair value through other comprehensive income on an individual basis, except for equity instruments held for trading purposes which should always be measured at fair value through profit or loss. The designation as a financial asset measured at fair value through other comprehensive income is irrevocable. Please refer to (v) Derivatives and Hedge Accounting for derivatives.
b. Subsequent MeasurementFinancial assets are subsequently measured based on the classification of the asset as follows:(a) Financial Assets measured at Amortized Cost Financial assets measured at amortized cost are measured using the effective interest method.(b) Financial Assets measured at Fair Value Financial assets measured at fair value are measured at fair value at the reporting date.
Changes in fair value are recognized in profit or loss or in other comprehensive income according to the classification of the finan-cial assets.
Dividends received from equity instruments designated as financial assets measured at fair value through other comprehensive income are recognized in profit or loss. In cases that fair value of these financial assets is significantly declined or disposed, gain or loss accumulated in other comprehensive income is reclassified to retained earnings within equity.
c. DerecognitionFinancial assets are derecognized when the contractual rights to receive cash flows from the financial assets expire or are transferred in a transaction in which substantially all the risks and rewards of ownership of the financial assets are transferred to another entity.
12 ASAHI GROUP HOLDINGS, LTD.
(ii) Impairment of Financial AssetsThe Group assesses recoverability of financial assets measured at amortized cost and estimates expected credit loss at each reporting date.
A loss allowance for expected credit losses is measured at an amount equal to 12-month expected credit losses for financial assets whose credit risk has not increased significantly since initial recognition. A loss allowance is measured at an amount equal to the lifetime credit losses for financial assets whose credit risk has increased significantly since initial recognition. Trade receivables, on the contrary, always require a loss allowance be measured at an amount equal to the lifetime credit losses.
Interest income for financial assets whose credit risk has significantly increased and there is objective evidence of impairment is measured by applying the effective interest rate to the net carrying amount of the financial asset less loss allowance.
Indicators used by the Group to assess whether there is any objective evidence of impairment include:• Significant financial difficulties of the issuer or the borrower;• A breach of contract, such as default or past due event in interest or principal payments;• The lender(s) of the borrower, for economic or contractual reasons relating to the borrower’s financial difficulty, having granted to
the borrower a concession(s) that the lender(s) would not otherwise consider;• It is becoming probable that the borrower will enter bankruptcy or other financial reorganization; or• The disappearance of an active market for that financial asset because of financial difficulties
The Group directly reduces the gross carrying amount of a financial asset when there is no reasonable expectations of recovering the financial asset in its entirety or a portion thereof.
A loss allowance may be reversed when credit risk decreases due to a subsequent event which can be objectively related to the past impairment (such as an improvement in the borrower’s credit rating). The reversal of the previously recognized impairment loss is rec-ognized in profit or loss.
(iii) Financial Liabilitya. Initial Recognition and MeasurementThe Group recognizes financial liabilities when the Group becomes a party to the contract. Financial liabilities are classified into liabili-ties measured at fair value through profit or loss or liabilities measured at amortized cost. Financial liabilities measured at fair value through profit or loss is recognized at their fair value upon initial recognition, and financial liabilities measured at amortized cost is measured at their fair value less transaction costs directly attributable to the acquisition upon initial recognition.
b. Subsequent MeasurementFinancial liabilities are subsequently measured according to the classification as follows:(a) Financial Liabilities measured at Fair Value through Profit or Loss
Financial liabilities measured at fair value through profit or loss are measured at fair value at each reporting date.(b) Financial Liabilities measured at Amortized Cost
Financial liabilities measured at amortized cost are measured using the effective interest method.
c. DerecognitionFinancial liabilities are derecognized when the Group’s contractual obligations are discharged, canceled or expired.
(iv) Offset of Financial InstrumentsFinancial assets and liabilities are offset and the net amount is presented in the consolidated statement of financial position only when there is a legally enforceable right to offset the financial instruments and there is an intention to settle on a net basis or realize the asset and settle the liability simultaneously.
(v) Derivatives and Hedge AccountingDerivatives are initially recognized at fair value on the date when the derivative contract is concluded and are subsequently remeasured at fair value at each reporting date. Gain or loss on remeasurement are accounted for differently based on whether the derivative is designated as a hedging instrument, and if so, the nature of the hedged item. The Group designates certain derivatives as hedging instruments in cash flow hedges for items such as certain risks associated with recognized assets and liabilities or forecast transactions in which their occurrence is highly probable.
The Group documents the relationship between hedging instruments and hedged items, as well as its risk management objectives and strategy for undertaking these hedging transactions at the inception of the transaction. The Group also documents its assessment, both at the inception and on an ongoing basis, of whether the derivatives used in hedging transactions are effective in offsetting changes in cash flows of hedged items.
Effectiveness of a hedge is continuously assessed. It is considered effective when all of the following conditions are met: there is an economic relationship between hedged items and hedging instruments; the effect of credit risk does not dominate value that results from that economic relationship; and the hedge ratio of the hedging relationship is the same as that resulting from the quantity of the hedged item that the entity actually hedges and the quantity of the hedging instrument that the entity actually uses to hedge that quantity of hedged item.
13Financial Section 2016
The effective portion of changes in fair value of a derivative that is designated and qualified as a hedging instrument in a cash flow hedge is recognized in other comprehensive income. Gain or loss relating to the hedge ineffectiveness is immediately recog-nized in profit or loss.
Accumulated gain and loss recognized in other comprehensive income is reclassified to profit or loss in the same period when cash flows arising from the hedged item affect profit or loss. When the hedged item is a forecast transaction that will result in recognition of a non-financial asset such as inventory or property, plant and equipment, the accumulated gain and loss through other comprehen-sive income is reclassified and included in the initial cost of the asset. These amounts are ultimately recognized in cost of sales when included in inventory and in depreciation cost when included in property, plant and equipment.
Hedge accounting is prospectively terminated when the hedging instrument expires or is sold, and the hedge no longer meets the criteria for hedge accounting. In cases that hedged future cash flow is still expected to occur, any related cumulative gain or loss recog-nized in other comprehensive income continues to be accumulated in equity. On the other hand, cumulative gain or loss recognized in other comprehensive income is immediately charged to profit or loss if the hedged forecast transaction is no longer expected to occur.
(10) Cash and Cash EquivalentsCash and cash equivalents consist of cash on hand, bank deposits withdrawable on demand, and short-term investments that are readily convertible to cash and subject to insignificant risk of change in value with maturities of three months or less.
(11) InventoriesInventories are stated at the lower of cost and net realizable value. The Group generally measures costs of merchandise, finished goods and work in progress by the weighted-average method, and costs of raw materials and supplies by the moving-average method. Costs of merchandise, finished goods, and work in progress consist of costs of raw materials, direct labor, other direct costs and related pro-duction overheads based on the normal capacity of the production facilities. Net realizable value is the estimated selling price in the ordinary course of business, less expected selling expenses related thereto.
(12) Assets or Disposal Group Held for SaleThe Group classifies a non-current asset (or disposal group) as held for sale when its carrying amount will be recovered principally through a sale rather than through continuing use, the sale is highly probable and the asset is available for immediate sale in its present condition. The Group does not depreciate or amortize a non-current asset (or disposal group) classified as held for sale and measures it at the lower of its carrying amount and fair value less costs to sell.
(13) Employee Benefits(i) Post-employment BenefitsThe Group has various pension plans. The Group has defined benefit plans, and some consolidated subsidiaries establish retirement benefits trusts. In addition to those plans, certain consolidated subsidiaries have defined contribution plans and advance payment system of retirement benefits.
The defined benefit plan is the post-employment plan other than the defined contribution plan. The defined contribution plan is the plan in which the employer pays fixed contributions to a separate entity and has no legal or constructive obligation to pay further amounts.
Under defined benefit plans, the Group estimates the defined benefit obligation as expected future payments resulting from employee service in the current and prior periods for each plan. The defined benefit obligation is discounted to the present value. The Group recognizes net retirement benefit liability (assets) at the present value of defined benefit obligation less the fair value of plan assets. The defined benefit obligation is calculated using the projected unit credit method. The discount rate is determined based on the market interest rates of high-quality corporate bonds at the end of the reporting period which have maturities corresponding to the future settlements in each year. The pension plans are generally funded through payments to the fund managed by insurance companies and trust companies based on periodic actuarial review.
In cases that net retirement benefit assets may be recognized under defined benefit plans, the asset is limited to the present value of economic benefits which the Group receives in the form of future refund from the plan or reduction of future contribution to the plan. The Group takes into consideration the minimum funding requirement applied to the Group’s plans when calculating the present value of economic benefits. The Group recognizes economic benefits only when they are realizable within the period in which the plans continue to exist or at the time of settlement of the plan obligation.
The Group recognizes the effect of remeasurement on net assets and net liabilities arising from the defined benefit plans in other comprehensive income and then immediately reclassifies it to retained earnings.
The obligation under the defined contribution plans is recognized as employee benefit expense in profit or loss over the period in which the employees provide services.
(ii) Short-term Employee BenefitsShort-term employee benefits are recognized as an expense in the period that the related services are rendered by the employees. Short-term employee benefits are not discounted. Bonuses are recognized as liabilities for the amount estimated to be paid when the Group has present legal or constructive obligation, and the obligation can be reliably estimated.
14 ASAHI GROUP HOLDINGS, LTD.
(14) Share-based PaymentEquity-settled share-based payments granted to employees are measured at fair value at the grant date, and then generally recog-nized as an expense over the vesting period. The same amount is recognized as an increase in equity. However, if the equity-settled share-based payments granted are immediately vested, the entire amount is recognized as an expense and an increase in equity at the grant date.
The Group has elected to use an exemption in IFRS 1 for share-based payments vested prior to the transition date.
(15) ProvisionsThe Group recognizes provisions when it has a present legal or constructive obligation as a result of past events, it is probable that an outflow of resources will be required to settle the obligation, and the amount can be reliably estimated.
Where there are a number of similar obligations, the likelihood that an outflow of resources will be required in settlement is deter-mined by class of similar obligations as a whole. A provision is recognized even if the likelihood of an outflow with a certain item included in the same class of obligations may be small.
Provisions are measured at the present value of the future cash flows expected to be required to settle the obligation using a pre-tax discount rate that reflects current market assessments of the time value of money and the risks specific to the obligation. An increase in the provision due to passage of time is recognized as interest expense.
(16) EquityOrdinary shares are classified as equity.
Incremental costs directly attributable to issuance of new ordinary shares or share options are deducted from equity.When any company within the Group purchases the Company’s shares (treasury shares), the consideration paid including any directly
attributable incremental costs (net of tax) is deducted from equity attributable to owner of the Company until the shares are canceled or reissued. When such ordinary shares are subsequently reissued, any consideration received, net of directly attributable incremental costs and the related tax effects, is recognized in equity attributable to owners of the Company.
(17) RevenueRevenue consists of fair value of consideration received or receivable for sales of goods and rendering of services in the Group’s normal business operations. Revenue is measured at net amount after eliminating goods returned, rebates, and trade discounts.
(i) Sales of Goods• Alcohol Beverages — manufacture and sales of beer, low-malt beer (happoshu), distilled spirits (shochu), whisky and other alcohol
products, operation of restaurants, wholesales and others• Soft Drinks — manufacture and sales of soft drinks and others• Food — manufacture and sales of food and pharmaceuticals• Overseas — manufacture and sales of beer and other alcohol products and soft drinks, and others
The Group recognizes revenue when it has transferred the significant risks and rewards of ownership of the goods to the customer, it is probable that the economic benefits associated with the transaction will flow to the Group, the costs incurred or to be incurred in respect of the transaction and probability of return of the goods can be measured reliably, it retains neither continuing managerial involvement with the goods and the amount of revenue can be measured reliably. Revenue is ordinarily recognized when the Group delivers goods to customers and unfulfilled obligation no longer exists.
(ii) Rendering of ServicesThe Group is engaged in real estate business such as property management, logistic business such as warehousing, and others. Revenue is recognized when the service is rendered.
(iii) Gross and Net Presentation of RevenueRevenue is presented in gross amount when the Group is exposed to significant risks and rewards of the sales of goods or rendering of services and thereby considered acting as a principal in the transaction. Under transactions where the Group is not exposed to sig-nificant risks and rewards of the sales of goods or rendering of services and thereby considered acting as an agent in the transaction, revenue is presented in net amount of the consideration received and payment to the third party.
(iv) Interest IncomeInterest income is recognized based on the effective interest method.
(v) Dividend IncomeDividend income is recognized when the right to receive the payment is established.
15Financial Section 2016

(18) Government GrantsGovernment grants are recognized when there is reasonable assurance that the Group complies with the conditions attaching to them and the grants will be received. Government grants which are intended to compensate specific costs are recognized in profit or loss on a systematic basis over the period in which the Group recognizes the corresponding expenses. Government grants related to assets are recognized as deferred income, and then recognized in profit or loss on a straight-line basis over the estimated useful lives of the related assets. Non-monetary grants measured at fair value are accounted for in the same way. Grants related to income are recognized and presented in ‘Other operating income’ in the period when the Group recognizes the corresponding expenses.
(19) DividendsDividends payable to the shareholders of the Company are recognized as liabilities in the period in which the dividends are approved at the shareholder’s meeting for annual dividends and in the period in which the dividends are approved at the Board of Directors meeting for interim dividends.
(20) Income TaxIncome tax expenses comprise current and deferred taxes. Income tax is recognized in profit or loss for the period, except to the extent it relates to a transaction which is recognized in other comprehensive income or directly in equity. In those cases, income tax is also recognized in other comprehensive income or directly in equity.
Current tax is measured at the amount that is expected to be paid to or recovered from tax authorities. The taxes are calculated at tax rates under applicable tax laws that have been enacted or substantively enacted at the reporting date.
Deferred tax is recognized on temporary differences between the tax bases of assets and liabilities and their carrying amounts in the consolidated statement of financial position. However, deferred tax liability is not recognized for a temporary difference arising from the initial recognition of goodwill. Similarly, deferred tax asset or liability is not recognized for a temporary difference arising from initial recognition of an asset or liability in a transaction that is not a business combination and that affects neither accounting profit or loss nor taxable profit (tax loss). Deferred tax is measured at tax rates that have been enacted or substantively enacted at the reporting date and expected to apply in the period when the related deferred income tax asset is realized or the deferred income tax liability is settled under applicable tax laws.
Deferred tax asset is recognized to the extent that it is probable that taxable profit will be available against which the temporary differences can be utilized.
Deferred tax asset and liability is recognized for temporary differences arising from investments in subsidiaries and associates although deferred tax liability is not recognized if the Group is able to control the timing of the reversal of the temporary difference and it is probable that the temporary difference will not reverse in the foreseeable future.
Deferred tax assets and deferred tax liabilities are offset when there is a legally enforceable right to offset current tax asset against current tax liability, and income taxes are levied by the same taxation authority on the same taxable entity.
(21) Accounting for Consumption TaxConsumption tax received as an agent from customers which will be paid to tax authorities is excluded from revenue, cost of sales and related expenses in the consolidated statement of profit or loss.
6. Significant Accounting Estimates and JudgmentsIn the preparation of the consolidated financial statements, management makes judgments, estimates and assumptions that affect the application of the accounting policies and the reporting amounts of assets, liabilities, revenue and expenses. The estimates and the underlying assumptions are reviewed on an ongoing basis. The effects of a change in accounting estimates are recognized in the period in which the estimate is revised and in the future periods. The estimates and the underlying assumptions that have significant risks which could result in a material adjustment to the carrying amounts of assets and liabilities within the next year are as follows:
• Impairment of non-financial assets (Notes 12, 13)• Recoverability of deferred tax assets (Note 28)• Fair value of financial instruments (Note 31)• Employee benefits (Note 19)• Contingencies (Note 38)
16 ASAHI GROUP HOLDINGS, LTD.

7. Segment Information(1) General InformationThe Group determines operating segments based on the report that is reviewed by the management and utilized in its strategic decision-making.
The operating segments are components of the Group for which separate financial information is available and regularly reviewed by the management so as to make decisions about how to allocate resources.
The Group mainly manufactures and sells alcohol beverages, soft drinks and food in the domestic market, and alcohol beverages and soft drinks in overseas markets.
The Group has identified 4 reportable segments, “Alcohol Beverages,” “Soft Drinks,” “Food” and “Overseas” accordingly.• Alcohol Beverages — manufacture and sales of beer, low-malt beer (happoshu), distilled spirits (shochu), whisky and other alcohol
products, operation of restaurants, wholesales, and others• Soft Drinks — manufacture and sales of soft drinks and others• Food — manufacture and sales of food and pharmaceuticals• Overseas — manufacture and sales of beer and other alcohol products and soft drinks, and others• Other — logistics and others
The management evaluates the performance of each operating segment based on the results of measure of segment profit or loss.
Previous Year (ended December 31, 2015)
Millions of yen
Alcohol Beverages Soft Drinks Food Overseas Other Segment total Adjustments Consolidated
Revenue:
External customers 946,029 345,928 109,130 248,241 40,197 1,689,527 — 1,689,527
Intersegment 24,929 4,354 2,176 2,210 57,069 90,741 (90,741) —
Total revenue 970,958 350,283 111,306 250,452 97,267 1,780,268 (90,741) 1,689,527
Segment profit (loss) 105,790 17,054 6,942 (16,063) 2,216 115,941 (19,315) 96,626
Segment assets 730,754 313,444 90,509 609,352 21,118 1,765,178 39,495 1,804,673
Other items
Depreciation and amortization expense 29,133 23,454 3,236 12,907 391 69,124 1,620 70,745
Impairment losses 5,965 — 175 20,959 — 27,099 — 27,099
Share of profit (loss) of entities accounted for using equity method 210 — (10) 17,388 — 17,589 37 17,627
Investments accounted for using equity method 841 — — 188,942 — 189,783 779 190,563
Additions to non-current assets other than financial instruments and deferred tax assets 30,044 22,368 5,411 15,784 267 73,877 855 74,733
Adjustments to the segment profit or loss of ¥(19,315) million include overhead costs of ¥(18,470) million which are not allocated to the reportable segments, and elimination of intersegment transactions of ¥(844) million. Overhead costs are primarily group management expenses incurred at the Company that is a pure holding company. The price in intersegment transactions is in accordance with the transaction price with external customers.
Adjustments to the segment assets of ¥39,495 million include the corporate assets of ¥62,008 million, which are not allocated to the reportable segments, and elimination of ¥(22,513) million to offset intersegment receivables and payables. The corporate assets are primarily assets held by the Company, which is a pure holding company.
17Financial Section 2016

Current Year (ended December 31, 2016)
Millions of yen
Alcohol Beverages Soft Drinks Food Overseas Other Segment total Adjustments Consolidated
Revenue:
External customers 950,438 355,991 109,130 247,760 43,581 1,706,901 — 1,706,901
Intersegment 26,211 7,914 1,693 2,556 58,698 97,073 (97,073) —
Total revenue 976,649 363,905 110,824 250,316 102,279 1,803,975 (97,073) 1,706,901
Segment profit (loss) 111,192 32,775 11,377 (8) 1,983 157,320 (20,430) 136,889
Segment assets 718,898 291,331 89,833 953,770 25,552 2,079,387 6,994 2,086,381
Other items
Depreciation and amortization expense 27,249 22,222 3,265 14,744 436 67,918 3,212 71,131
Impairment losses 3,063 — — 3,272 — 6,336 — 6,336
Share of profit (loss) of entities accounted for using equity method 66 — — 1,842 — 1,908 65 1,974
Investments accounted for using equity method 882 — — 139,707 — 140,590 807 141,398
Additions to non-current assets other than financial instruments and deferred tax assets 36,981 18,691 3,763 18,003 445 77,886 4,569 82,455
Adjustments to the segment profit or loss of ¥(20,430) million include overhead costs of ¥(20,410) million which are not allocated to the reportable segments, and elimination of intersegment transactions of ¥(20) million. Overhead costs are primarily group management expenses incurred at the Company that is a pure holding company. The price in intersegment transactions is in accordance with the transaction price with external customers.
Adjustments to the segment assets of ¥6,994 million include the corporate assets of ¥33,093 million, which are not allocated to the reportable segments, and elimination of ¥(26,099) million to offset intersegment receivables and payables. The corporate assets are primarily assets held by the Company, which is a pure holding company.
(2) Information about Products and ServicesPlease refer to (1) General Information.
(3) Information about Geographical AreasWith regard to information about geographical areas, revenue to external customers and non-current assets are classified into Japan or overseas based on customers’ locations and asset locations, respectively.
Revenue from External Customers
Millions of yen
Previous year(ended December 31, 2015)
Current year(ended December 31, 2016)
Japan 1,424,786 1,439,716
Overseas 264,741 267,185
Total 1,689,527 1,706,901
Non-current Assets
Millions of yen
Transition date(as of January 1, 2015)
Previous year(as of December 31, 2015)
Current year (as of December 31, 2016)
Japan 545,223 541,952 531,798
Overseas 248,481 211,212 541,805
Total 793,704 753,164 1,073,603
18 ASAHI GROUP HOLDINGS, LTD.
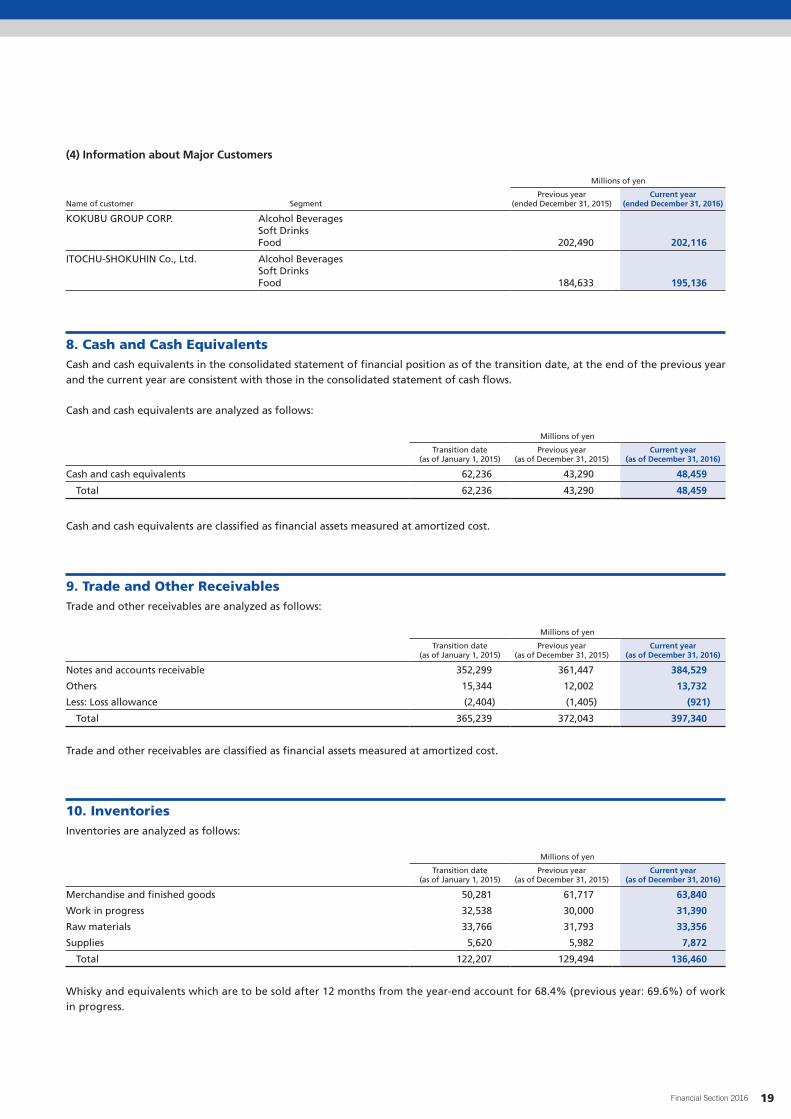
(4) Information about Major Customers
Segment
Millions of yen
Name of customerPrevious year
(ended December 31, 2015)Current year
(ended December 31, 2016)
KOKUBU GROUP CORP. Alcohol BeveragesSoft DrinksFood 202,490 202,116
ITOCHU-SHOKUHIN Co., Ltd. Alcohol BeveragesSoft DrinksFood 184,633 195,136
8. Cash and Cash EquivalentsCash and cash equivalents in the consolidated statement of financial position as of the transition date, at the end of the previous year and the current year are consistent with those in the consolidated statement of cash flows.
Cash and cash equivalents are analyzed as follows:
Millions of yen
Transition date(as of January 1, 2015)
Previous year(as of December 31, 2015)
Current year (as of December 31, 2016)
Cash and cash equivalents 62,236 43,290 48,459
Total 62,236 43,290 48,459
Cash and cash equivalents are classified as financial assets measured at amortized cost.
9. Trade and Other ReceivablesTrade and other receivables are analyzed as follows:
Millions of yen
Transition date(as of January 1, 2015)
Previous year(as of December 31, 2015)
Current year (as of December 31, 2016)
Notes and accounts receivable 352,299 361,447 384,529
Others 15,344 12,002 13,732
Less: Loss allowance (2,404) (1,405) (921)
Total 365,239 372,043 397,340
Trade and other receivables are classified as financial assets measured at amortized cost.
10. InventoriesInventories are analyzed as follows:
Millions of yen
Transition date(as of January 1, 2015)
Previous year(as of December 31, 2015)
Current year (as of December 31, 2016)
Merchandise and finished goods 50,281 61,717 63,840
Work in progress 32,538 30,000 31,390
Raw materials 33,766 31,793 33,356
Supplies 5,620 5,982 7,872
Total 122,207 129,494 136,460
Whisky and equivalents which are to be sold after 12 months from the year-end account for 68.4% (previous year: 69.6%) of work in progress.
19Financial Section 2016

The Group recognized ¥925,927 million of inventories as an expense in the current year (previous year: ¥1,009,728 million). It is included in “Cost of sales.”
No inventory is pledged as collateral for liabilities.“Cost of sales” includes cost of raw materials amounting to ¥381,872 million (previous year: ¥384,525 million).
11. Disposal Groups Held for SaleDisposal groups classified as held for sale are analyzed as follows:
Millions of yen
Transition date(as of January 1, 2015)
Previous year(as of December 31, 2015)
Current year(as of December 31, 2016)
Cash and cash equivalents — — 972
Inventories — — 124
Plant, property and equipment — — 2,040
Others — — 104
Total assets — — 3,241
Trade and other payables — — 243
Others — — 663
Total liabilities — — 907
The disposal groups held for sale in the current year are composed of assets and liabilities held by 3 subsidiaries belonging to the Overseas segment. The Group pursues to select and concentrate in core competence, and determined to sell the shares in those 3 sub-sidiaries since those subsidiaries conduct non-core business of the Group. The Group plans to sell the shares within 1 year from the end of the current year, and those plans have already been initiated.
The fair value of the disposal groups less costs to sell amounted to ¥2,334 million. As a result, the Group recognized impairment losses of ¥389 million in the current year, which were included in “Other operating expense” in the consolidated statement of profit or loss.
12. Property, Plant and EquipmentProperty, plant and equipment is analyzed as follows:
Carrying Amount
Millions of yen
Buildings and structures
Machinery and vehicles
Tools, fixtures and fittings Land
Construction in progress Other Total
Transition date (as of January 1, 2015) 166,972 140,999 78,387 133,981 20,617 109 541,067
Separate acquisitions 5,019 17,656 21,797 876 14,393 — 59,742
Acquisitions through business combinations 994 231 494 1,019 16 — 2,756
Disposals (1,551) (2,871) (1,370) (3,564) (5) (23) (9,385)
Exchange differences (2,307) (5,172) (983) (1,372) (1,199) (7) (11,042)
Transfers from construction in progress 6,220 15,557 1,024 — (22,900) 98 —
Impairment losses* (1,181) (493) (33) (4,863) — — (6,571)
Depreciation (14,433) (24,349) (17,355) — — (42) (56,180)
Other (12) (283) 52 7 (1,583) 9 (1,809)
Previous year (as of December 31, 2015) 159,721 141,274 82,012 126,084 9,339 144 518,576
Separate acquisitions 7,165 17,165 19,560 364 22,237 — 66,494
Acquisitions through business combinations 16,706 23,416 8,036 8,426 26 — 56,613
Disposals (2,045) (1,492) (435) (6,631) (16) — (10,622)
Exchange differences (106) (710) 182 196 (592) 7 (1,022)
Transfers from construction in progress 3,490 6,274 2,251 — (12,016) — —
Impairment losses* (215) (266) (17) — — — (499)
Depreciation (13,872) (22,750) (18,947) — — (38) (55,609)
Transfers to assets held for sale (1,885) (263) (36) — (84) (119) (2,389)
Other (19) (54) (39) — (663) 7 (770)
Current year (as of December 31, 2016) 168,939 162,593 92,567 128,440 18,229 0 570,771
* Please refer to “13. Goodwill and Intangible Assets” regarding recognition of impairment losses etc.
20 ASAHI GROUP HOLDINGS, LTD.
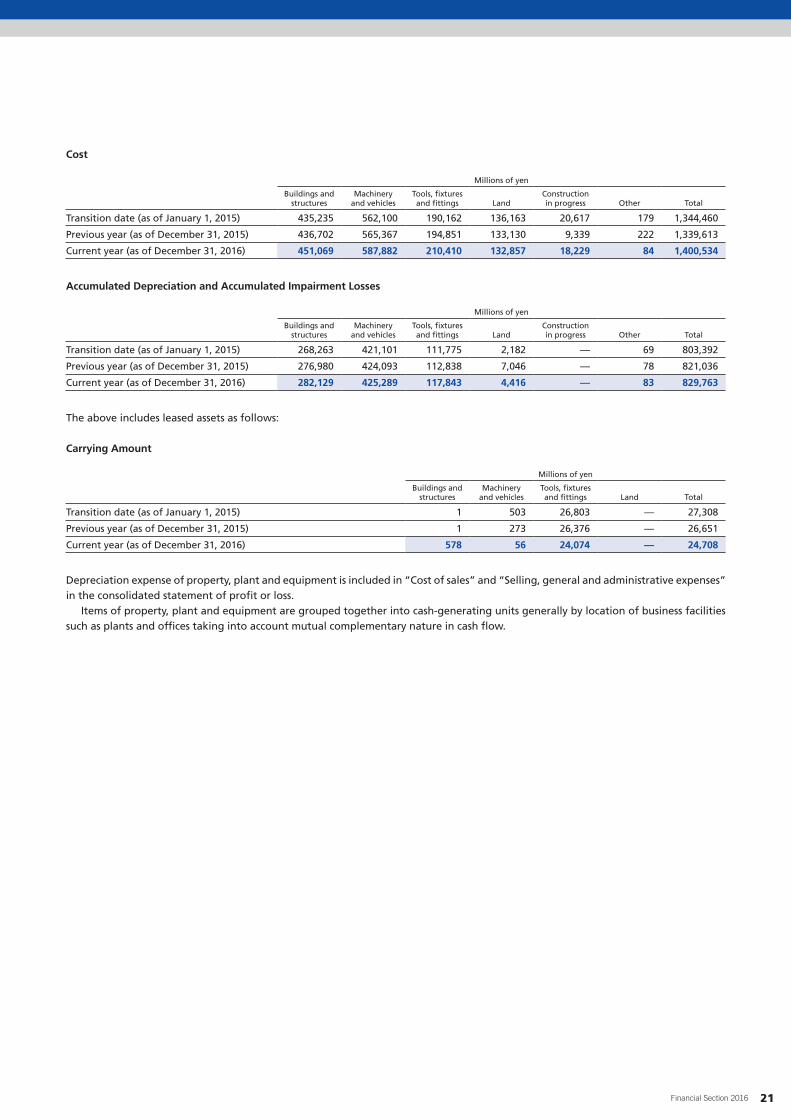
Cost
Millions of yen
Buildings and structures
Machinery and vehicles
Tools, fixtures and fittings Land
Construction in progress Other Total
Transition date (as of January 1, 2015) 435,235 562,100 190,162 136,163 20,617 179 1,344,460
Previous year (as of December 31, 2015) 436,702 565,367 194,851 133,130 9,339 222 1,339,613
Current year (as of December 31, 2016) 451,069 587,882 210,410 132,857 18,229 84 1,400,534
Accumulated Depreciation and Accumulated Impairment Losses
Millions of yen
Buildings and structures
Machinery and vehicles
Tools, fixtures and fittings Land
Construction in progress Other Total
Transition date (as of January 1, 2015) 268,263 421,101 111,775 2,182 — 69 803,392
Previous year (as of December 31, 2015) 276,980 424,093 112,838 7,046 — 78 821,036
Current year (as of December 31, 2016) 282,129 425,289 117,843 4,416 — 83 829,763
The above includes leased assets as follows:
Carrying Amount
Millions of yen
Buildings and structures
Machinery and vehicles
Tools, fixtures and fittings Land Total
Transition date (as of January 1, 2015) 1 503 26,803 — 27,308
Previous year (as of December 31, 2015) 1 273 26,376 — 26,651
Current year (as of December 31, 2016) 578 56 24,074 — 24,708
Depreciation expense of property, plant and equipment is included in “Cost of sales” and “Selling, general and administrative expenses” in the consolidated statement of profit or loss.
Items of property, plant and equipment are grouped together into cash-generating units generally by location of business facilities such as plants and offices taking into account mutual complementary nature in cash flow.
21Financial Section 2016

13. Goodwill and Intangible Assets(1) Carrying Amount, Cost and Accumulated Amortization and Accumulated Impairment LossesGoodwill and intangible assets are analyzed as follows:
Carrying Amount
Millions of yen
Goodwill Trademarks Software Other Total
Transition date (as of January 1, 2015) 133,705 72,410 15,347 18,582 240,046
Separate acquisitions — 9 5,564 6,192 11,767
Acquisitions through business combinations 20,236 2,168 205 1,065 23,676
Disposals — — (330) (104) (434)
Exchange differences (11,375) (2,652) (239) (1,758) (16,025)
Impairment losses (17,555) (2,972) — — (20,528)
Amortization — (4,517) (4,929) (5,117) (14,564)
Other (2) 103 24 (578) (452)
Previous year (as of December 31, 2015) 125,008 64,550 15,644 18,282 223,485
Separate acquisitions — 0 4,853 3,737 8,591
Acquisitions through business combinations 143,680 118,642 204 4,284 266,812
Disposals — (1) (118) (445) (565)
Exchange differences 5,330 7,019 335 128 12,814
Impairment losses (4,729) — — — (4,729)
Amortization — (5,076) (5,369) (5,075) (15,522)
Transfers to assets held for sale — — — (2) (2)
Other — (58) 46 666 654
Current year (as of December 31, 2016) 269,290 185,075 15,596 21,575 491,538
Cost
Millions of yen
Goodwill Trademarks Software Other Total
Transition date (as of January 1, 2015) 163,936 93,624 59,518 24,692 341,771
Previous year (as of December 31, 2015) 172,795 92,048 61,694 34,058 360,596
Current year (as of December 31, 2016) 321,807 217,159 66,051 40,349 645,367
Accumulated Amortization and Accumulated Impairment Losses
Millions of yen
Goodwill Trademarks Software Other Total
Transition date (as of January 1, 2015) 30,231 21,213 44,170 6,110 101,725
Previous year (as of December 31, 2015) 47,787 27,498 46,050 15,775 137,111
Current year (as of December 31, 2016) 52,516 32,083 50,455 18,773 153,828
The above includes leased assets as follows:
Carrying Amount
Millions of yen
Software Other Total
Transition date (as of January 1, 2015) 355 — 355
Previous year (as of December 31, 2015) 295 — 295
Current year (as of December 31, 2016) 241 — 241
There were no significant internally generated intangible assets as of the transition date, the end of the previous year and that of the current year.
Amortization costs are included in “Cost of sales” and “Selling, general and administrative expenses” in the consolidated statement of profit or loss.
22 ASAHI GROUP HOLDINGS, LTD.
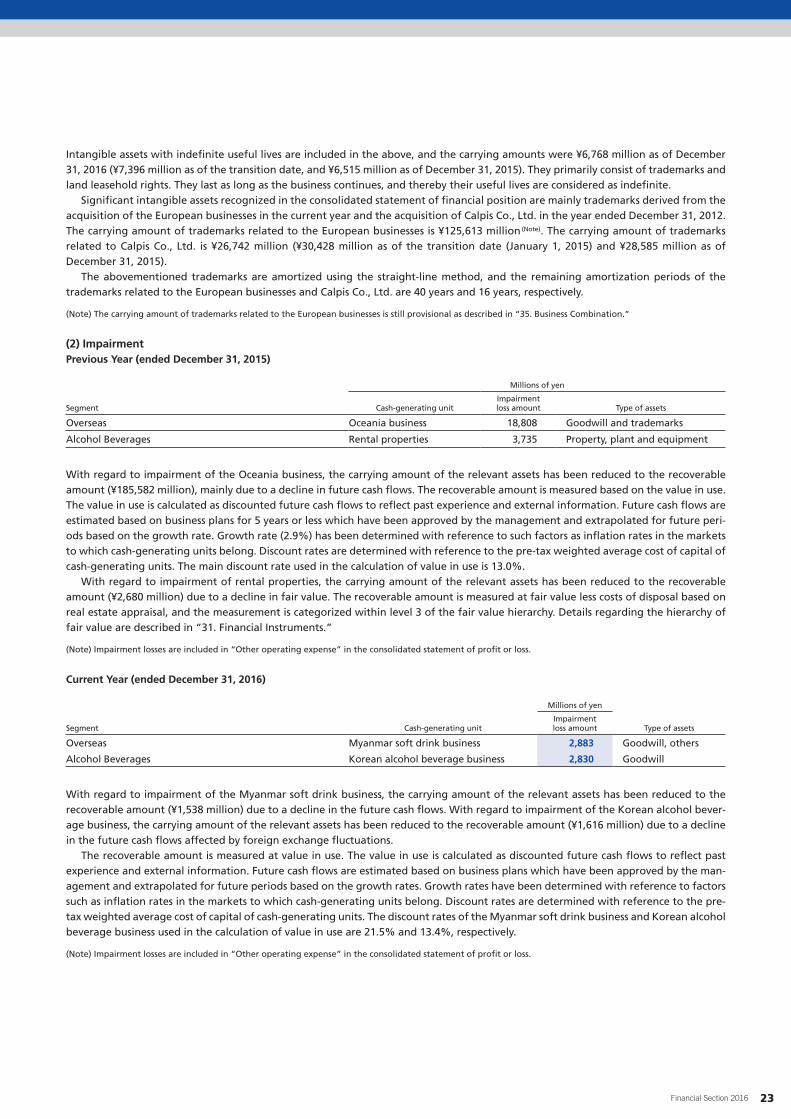
Intangible assets with indefinite useful lives are included in the above, and the carrying amounts were ¥6,768 million as of December 31, 2016 (¥7,396 million as of the transition date, and ¥6,515 million as of December 31, 2015). They primarily consist of trademarks and land leasehold rights. They last as long as the business continues, and thereby their useful lives are considered as indefinite.
Significant intangible assets recognized in the consolidated statement of financial position are mainly trademarks derived from the acquisition of the European businesses in the current year and the acquisition of Calpis Co., Ltd. in the year ended December 31, 2012. The carrying amount of trademarks related to the European businesses is ¥125,613 million(Note). The carrying amount of trademarks related to Calpis Co., Ltd. is ¥26,742 million (¥30,428 million as of the transition date (January 1, 2015) and ¥28,585 million as of December 31, 2015).
The abovementioned trademarks are amortized using the straight-line method, and the remaining amortization periods of the trademarks related to the European businesses and Calpis Co., Ltd. are 40 years and 16 years, respectively.
(Note) The carrying amount of trademarks related to the European businesses is still provisional as described in “35. Business Combination.”
(2) ImpairmentPrevious Year (ended December 31, 2015)
Millions of yen
Segment Cash-generating unitImpairment loss amount Type of assets
Overseas Oceania business 18,808 Goodwill and trademarks
Alcohol Beverages Rental properties 3,735 Property, plant and equipment
With regard to impairment of the Oceania business, the carrying amount of the relevant assets has been reduced to the recoverable amount (¥185,582 million), mainly due to a decline in future cash flows. The recoverable amount is measured based on the value in use. The value in use is calculated as discounted future cash flows to reflect past experience and external information. Future cash flows are estimated based on business plans for 5 years or less which have been approved by the management and extrapolated for future peri-ods based on the growth rate. Growth rate (2.9%) has been determined with reference to such factors as inflation rates in the markets to which cash-generating units belong. Discount rates are determined with reference to the pre-tax weighted average cost of capital of cash-generating units. The main discount rate used in the calculation of value in use is 13.0%.
With regard to impairment of rental properties, the carrying amount of the relevant assets has been reduced to the recoverable amount (¥2,680 million) due to a decline in fair value. The recoverable amount is measured at fair value less costs of disposal based on real estate appraisal, and the measurement is categorized within level 3 of the fair value hierarchy. Details regarding the hierarchy of fair value are described in “31. Financial Instruments.”
(Note) Impairment losses are included in “Other operating expense” in the consolidated statement of profit or loss.
Current Year (ended December 31, 2016)
Millions of yen
Segment Cash-generating unitImpairment loss amount Type of assets
Overseas Myanmar soft drink business 2,883 Goodwill, others
Alcohol Beverages Korean alcohol beverage business 2,830 Goodwill
With regard to impairment of the Myanmar soft drink business, the carrying amount of the relevant assets has been reduced to the recoverable amount (¥1,538 million) due to a decline in the future cash flows. With regard to impairment of the Korean alcohol bever-age business, the carrying amount of the relevant assets has been reduced to the recoverable amount (¥1,616 million) due to a decline in the future cash flows affected by foreign exchange fluctuations.
The recoverable amount is measured at value in use. The value in use is calculated as discounted future cash flows to reflect past experience and external information. Future cash flows are estimated based on business plans which have been approved by the man-agement and extrapolated for future periods based on the growth rates. Growth rates have been determined with reference to factors such as inflation rates in the markets to which cash-generating units belong. Discount rates are determined with reference to the pre-tax weighted average cost of capital of cash-generating units. The discount rates of the Myanmar soft drink business and Korean alcohol beverage business used in the calculation of value in use are 21.5% and 13.4%, respectively.
(Note) Impairment losses are included in “Other operating expense” in the consolidated statement of profit or loss.
23Financial Section 2016
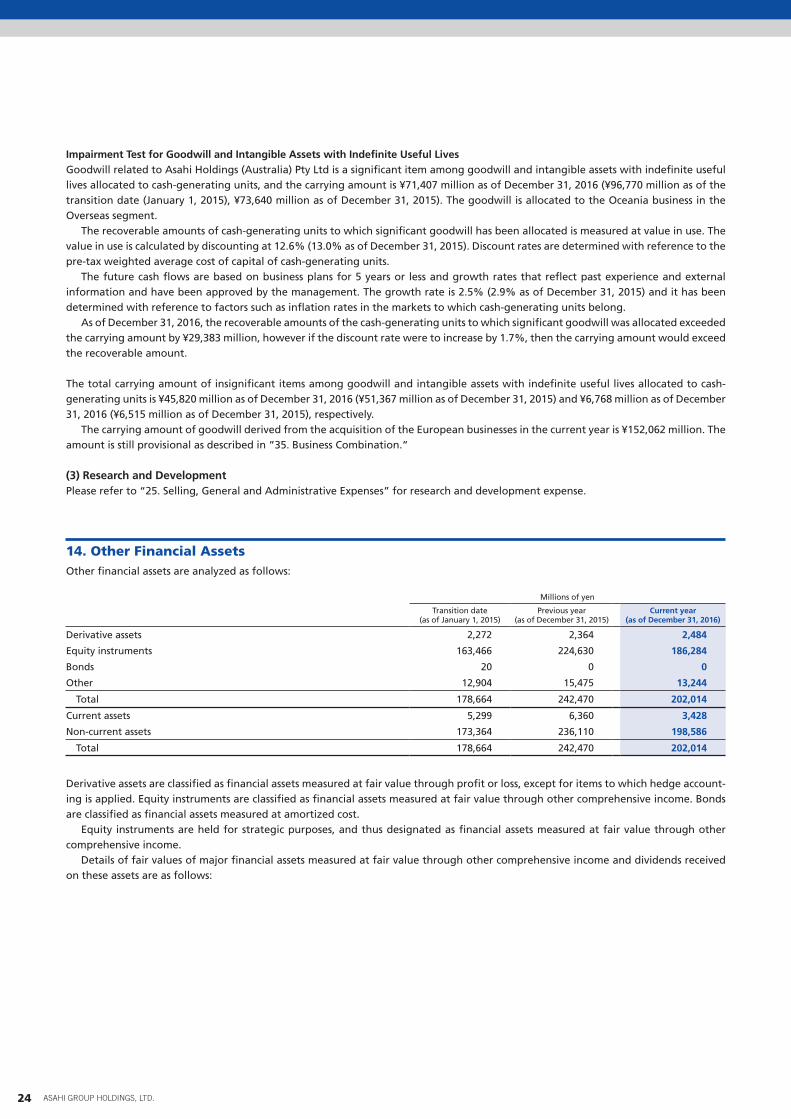
Impairment Test for Goodwill and Intangible Assets with Indefinite Useful LivesGoodwill related to Asahi Holdings (Australia) Pty Ltd is a significant item among goodwill and intangible assets with indefinite useful lives allocated to cash-generating units, and the carrying amount is ¥71,407 million as of December 31, 2016 (¥96,770 million as of the transition date (January 1, 2015), ¥73,640 million as of December 31, 2015). The goodwill is allocated to the Oceania business in the Overseas segment.
The recoverable amounts of cash-generating units to which significant goodwill has been allocated is measured at value in use. The value in use is calculated by discounting at 12.6% (13.0% as of December 31, 2015). Discount rates are determined with reference to the pre-tax weighted average cost of capital of cash-generating units.
The future cash flows are based on business plans for 5 years or less and growth rates that reflect past experience and external information and have been approved by the management. The growth rate is 2.5% (2.9% as of December 31, 2015) and it has been determined with reference to factors such as inflation rates in the markets to which cash-generating units belong.
As of December 31, 2016, the recoverable amounts of the cash-generating units to which significant goodwill was allocated exceeded the carrying amount by ¥29,383 million, however if the discount rate were to increase by 1.7%, then the carrying amount would exceed the recoverable amount.
The total carrying amount of insignificant items among goodwill and intangible assets with indefinite useful lives allocated to cash-generating units is ¥45,820 million as of December 31, 2016 (¥51,367 million as of December 31, 2015) and ¥6,768 million as of December 31, 2016 (¥6,515 million as of December 31, 2015), respectively.
The carrying amount of goodwill derived from the acquisition of the European businesses in the current year is ¥152,062 million. The amount is still provisional as described in ”35. Business Combination.”
(3) Research and DevelopmentPlease refer to “25. Selling, General and Administrative Expenses” for research and development expense.
14. Other Financial AssetsOther financial assets are analyzed as follows:
Millions of yen
Transition date(as of January 1, 2015)
Previous year(as of December 31, 2015)
Current year(as of December 31, 2016)
Derivative assets 2,272 2,364 2,484
Equity instruments 163,466 224,630 186,284
Bonds 20 0 0
Other 12,904 15,475 13,244
Total 178,664 242,470 202,014
Current assets 5,299 6,360 3,428
Non-current assets 173,364 236,110 198,586
Total 178,664 242,470 202,014
Derivative assets are classified as financial assets measured at fair value through profit or loss, except for items to which hedge account-ing is applied. Equity instruments are classified as financial assets measured at fair value through other comprehensive income. Bonds are classified as financial assets measured at amortized cost.
Equity instruments are held for strategic purposes, and thus designated as financial assets measured at fair value through other comprehensive income.
Details of fair values of major financial assets measured at fair value through other comprehensive income and dividends received on these assets are as follows:
24 ASAHI GROUP HOLDINGS, LTD.

Transition Date (as of January 1, 2015)
Millions of yen
Description Fair value
KAGOME CO., LTD. 18,280
OHSHO FOOD SERVICE CORP. 9,862
SPC Kappa Co., Ltd. 9,003
IMPERIAL HOTEL, LTD. 8,206
The Dai-ichi Life Insurance Company, Limited 7,364
DAIICHIKOSHO CO., LTD. 6,911
COLOWIDE CO., LTD. 6,512
Seven & i Holdings Co., Ltd. 4,915
Sumitomo Realty & Development Co., Ltd. 4,701
ORION BREWERIES, LTD. 4,186
Previous Year (as of December 31, 2015)
Millions of yen
Description Fair value
Ting Hsin (Cayman Islands) Holding Corp. 38,540
KAGOME CO., LTD. 21,160
SPC Kappa Co., Ltd. 11,136
DAIICHIKOSHO CO., LTD. 10,186
OHSHO FOOD SERVICE CORP. 8,568
IMPERIAL HOTEL, LTD. 8,281
The Dai-ichi Life Insurance Company, Limited 8,140
COLOWIDE CO., LTD. 6,680
Seven & i Holdings Co., Ltd. 6,258
THE ROYAL HOTEL, LIMITED 6,119
Current Year (as of December 31, 2016)
Millions of yen
Description Fair value
Ting Hsin (Cayman Islands) Holding Corp. 33,420
DAIICHIKOSHO CO., LTD. 9,794
OHSHO FOOD SERVICE CORP. 9,049
SPC Kappa Co., Ltd. 8,598
IMPERIAL HOTEL, LTD. 7,107
ORION BREWERIES, LTD. 6,891
The Dai-ichi Life Insurance Company, Limited 6,811
COLOWIDE CO., LTD. 6,489
SKYLARK CO., LTD 5,275
CHIMNEY CO., LTD. 5,060
Millions of yen
Previous year(ended December 31, 2015)
Current year(ended December 31, 2016)
Dividends received 2,112 2,505
25Financial Section 2016

Certain items designated as financial assets measured at fair value through comprehensive income have been disposed of during the year as a process of reviewing business relationships. The fair values, cumulative gain or loss at the disposal date and dividends received up to the disposal date are as follows:
Millions of yen
Previous year (ended December 31, 2015) Current year (ended December 31, 2016)
Fair value Cumulative gain or loss Dividends received Fair value Cumulative gain or loss Dividend received
2,064 637 61 30,632 11,616 287
Cumulative gain or loss previously recognized in other components of equity is reclassified to retained earnings when the underlying financial asset is sold, or its fair value is significantly declined compared to the cost. Such amount was ¥18,252 million in the current year (¥1,210 million in the previous year ended December 31, 2015).
15. Other Assets“Other current assets” and “Other non-current assets” are analyzed as follows:
Millions of yen
Transition date(as of January 1, 2015)
Previous year(as of December 31, 2015)
Current year(as of December 31, 2016)
Prepaid expenses 15,473 16,653 19,151
Other 16,109 16,281 24,075
Total 31,583 32,935 43,227
Current assets 18,992 21,832 31,934
Non-current assets 12,590 11,103 11,293
Total 31,583 32,935 43,227
16. Trade and Other PayablesTrade and other payables are analyzed as follows:
Millions of yen
Transition date(as of January 1, 2015)
Previous year(as of December 31, 2015)
Current year(as of December 31, 2016)
Notes and accounts payable 130,504 126,900 159,455
Other payables and accrued expenses 144,452 146,192 173,184
Total 274,956 273,092 332,639
Trade and other payables are classified as financial liabilities measured at amortized cost.
26 ASAHI GROUP HOLDINGS, LTD.
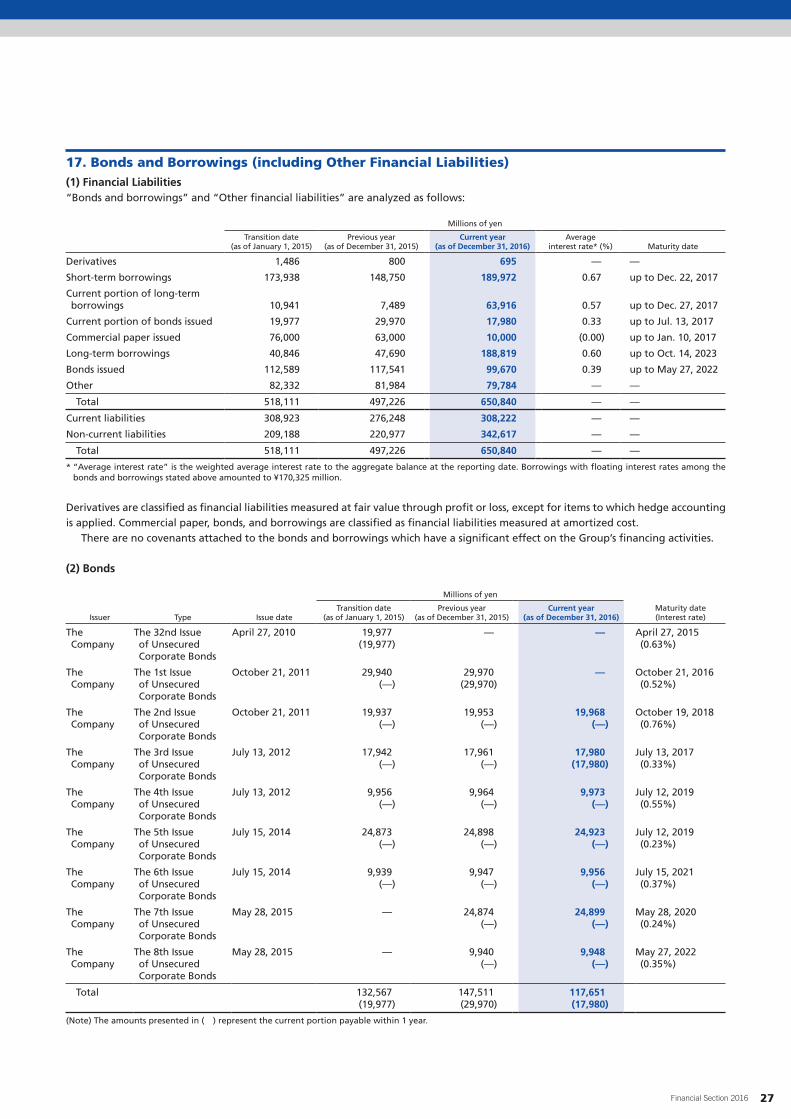
17. Bonds and Borrowings (including Other Financial Liabilities)(1) Financial Liabilities“Bonds and borrowings” and “Other financial liabilities” are analyzed as follows:
Millions of yen
Transition date (as of January 1, 2015)
Previous year (as of December 31, 2015)
Current year (as of December 31, 2016)
Average interest rate* (%) Maturity date
Derivatives 1,486 800 695 — —
Short-term borrowings 173,938 148,750 189,972 0.67 up to Dec. 22, 2017
Current portion of long-term borrowings 10,941 7,489 63,916 0.57 up to Dec. 27, 2017
Current portion of bonds issued 19,977 29,970 17,980 0.33 up to Jul. 13, 2017
Commercial paper issued 76,000 63,000 10,000 (0.00) up to Jan. 10, 2017
Long-term borrowings 40,846 47,690 188,819 0.60 up to Oct. 14, 2023
Bonds issued 112,589 117,541 99,670 0.39 up to May 27, 2022
Other 82,332 81,984 79,784 — —
Total 518,111 497,226 650,840 — —
Current liabilities 308,923 276,248 308,222 — —
Non-current liabilities 209,188 220,977 342,617 — —
Total 518,111 497,226 650,840 — —
* “Average interest rate” is the weighted average interest rate to the aggregate balance at the reporting date. Borrowings with floating interest rates among the bonds and borrowings stated above amounted to ¥170,325 million.
Derivatives are classified as financial liabilities measured at fair value through profit or loss, except for items to which hedge accounting is applied. Commercial paper, bonds, and borrowings are classified as financial liabilities measured at amortized cost.
There are no covenants attached to the bonds and borrowings which have a significant effect on the Group’s financing activities.
(2) Bonds
Millions of yen
Issuer Type Issue dateTransition date
(as of January 1, 2015)Previous year
(as of December 31, 2015)Current year
(as of December 31, 2016)Maturity date (Interest rate)
The Company
The 32nd Issue of Unsecured Corporate Bonds
April 27, 2010 19,977 (19,977)
— — April 27, 2015 (0.63%)
The Company
The 1st Issue of Unsecured Corporate Bonds
October 21, 2011 29,940 (—)
29,970 (29,970)
— October 21, 2016 (0.52%)
The Company
The 2nd Issue of Unsecured Corporate Bonds
October 21, 2011 19,937 (—)
19,953 (—)
19,968 (—)
October 19, 2018 (0.76%)
The Company
The 3rd Issue of Unsecured Corporate Bonds
July 13, 2012 17,942 (—)
17,961 (—)
17,980 (17,980)
July 13, 2017 (0.33%)
The Company
The 4th Issue of Unsecured Corporate Bonds
July 13, 2012 9,956 (—)
9,964 (—)
9,973 (—)
July 12, 2019 (0.55%)
The Company
The 5th Issue of Unsecured Corporate Bonds
July 15, 2014 24,873 (—)
24,898 (—)
24,923 (—)
July 12, 2019 (0.23%)
The Company
The 6th Issue of Unsecured Corporate Bonds
July 15, 2014 9,939 (—)
9,947 (—)
9,956 (—)
July 15, 2021 (0.37%)
The Company
The 7th Issue of Unsecured Corporate Bonds
May 28, 2015 — 24,874 (—)
24,899 (—)
May 28, 2020 (0.24%)
The Company
The 8th Issue of Unsecured Corporate Bonds
May 28, 2015 — 9,940 (—)
9,948 (—)
May 27, 2022 (0.35%)
Total 132,567 (19,977)
147,511 (29,970)
117,651 (17,980)
(Note) The amounts presented in ( ) represent the current portion payable within 1 year.
27Financial Section 2016
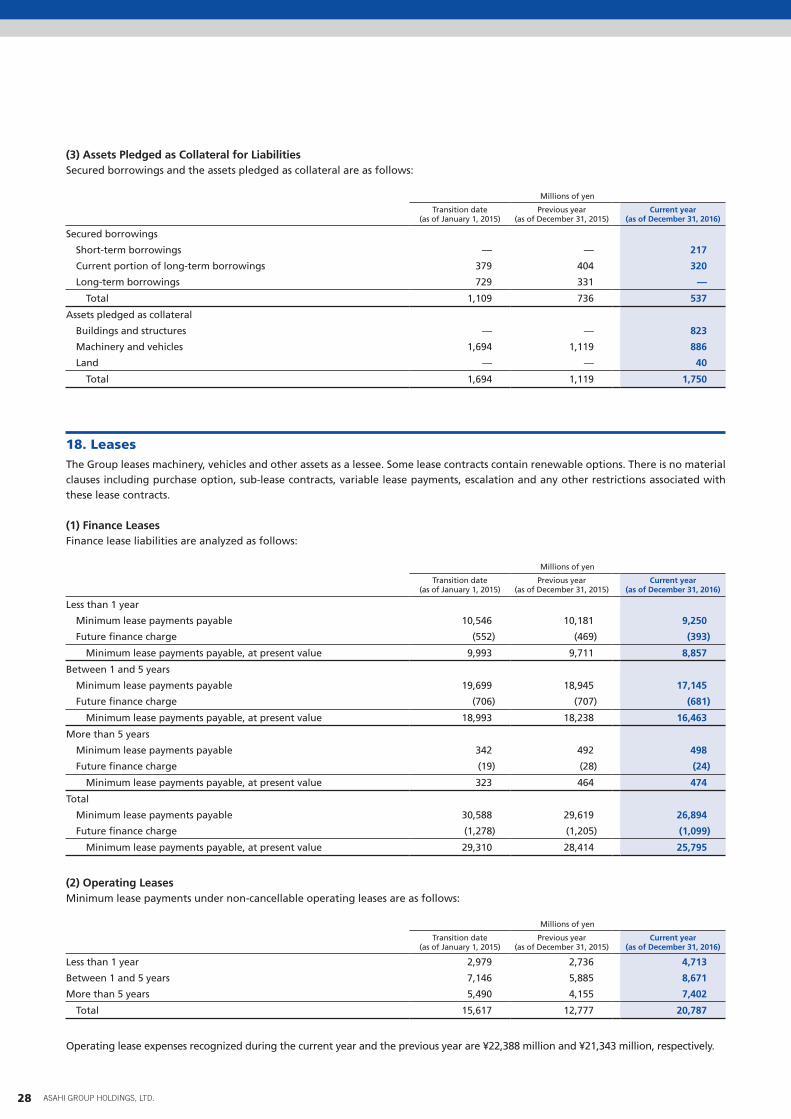
(3) Assets Pledged as Collateral for LiabilitiesSecured borrowings and the assets pledged as collateral are as follows:
Millions of yen
Transition date(as of January 1, 2015)
Previous year(as of December 31, 2015)
Current year(as of December 31, 2016)
Secured borrowings
Short-term borrowings — — 217
Current portion of long-term borrowings 379 404 320
Long-term borrowings 729 331 —
Total 1,109 736 537
Assets pledged as collateral
Buildings and structures — — 823
Machinery and vehicles 1,694 1,119 886
Land — — 40
Total 1,694 1,119 1,750
18. LeasesThe Group leases machinery, vehicles and other assets as a lessee. Some lease contracts contain renewable options. There is no material clauses including purchase option, sub-lease contracts, variable lease payments, escalation and any other restrictions associated with these lease contracts.
(1) Finance LeasesFinance lease liabilities are analyzed as follows:
Millions of yen
Transition date(as of January 1, 2015)
Previous year(as of December 31, 2015)
Current year(as of December 31, 2016)
Less than 1 year
Minimum lease payments payable 10,546 10,181 9,250
Future finance charge (552) (469) (393)
Minimum lease payments payable, at present value 9,993 9,711 8,857
Between 1 and 5 years
Minimum lease payments payable 19,699 18,945 17,145
Future finance charge (706) (707) (681)
Minimum lease payments payable, at present value 18,993 18,238 16,463
More than 5 years
Minimum lease payments payable 342 492 498
Future finance charge (19) (28) (24)
Minimum lease payments payable, at present value 323 464 474
Total
Minimum lease payments payable 30,588 29,619 26,894
Future finance charge (1,278) (1,205) (1,099)
Minimum lease payments payable, at present value 29,310 28,414 25,795
(2) Operating LeasesMinimum lease payments under non-cancellable operating leases are as follows:
Millions of yen
Transition date(as of January 1, 2015)
Previous year(as of December 31, 2015)
Current year(as of December 31, 2016)
Less than 1 year 2,979 2,736 4,713
Between 1 and 5 years 7,146 5,885 8,671
More than 5 years 5,490 4,155 7,402
Total 15,617 12,777 20,787
Operating lease expenses recognized during the current year and the previous year are ¥22,388 million and ¥21,343 million, respectively.
28 ASAHI GROUP HOLDINGS, LTD.

19. Employee Benefits(1) Overview of Defined Benefit PlansThe Group has defined benefit plans such as a defined benefit corporate pension plan and lump-sum retirement benefit plan. In addi-tion, some consolidated subsidiaries have defined contribution pension plans and a system for advance payment of retirement bene-fits. For entities incorporated in Japan, the defined benefit corporate pension plan has been established in accordance with the Defined-Benefit Corporate Pension Act of Japan. The Group pays out lump-sum benefits upon the retirement of employees and then annuity for a certain period of time after retirement in accordance with the terms of the Group’s plans based on the Act. The benefits are calculated based on the pension points reflecting the length of service periods and compensation for each period.
The Group manages plan assets for the purpose of increasing the value of plan assets within the acceptable range of risks in order to ensure the benefits for participants (including potential pensioners in the future periods). The Group has developed a basic policy for the management of plan assets and implements the policy consistently. The Group considers the expected rate of return and risks inherent in the investments, and then develops the optimum combination of plan assets called the policy asset mix. The Group controls asset management through appointing appropriate asset managers, reviewing the financial status on a regular basis, developing the long-term asset management policy and monitoring the situation of asset allocation. The policy asset mix is regularly reviewed in order to correspond with the market environment or funding status, which can change from the initial assumption. Lump-sum retirement benefit plans are to pay out lump-sum benefits when an employee retires due to reaching retirement age or voluntary retirement. These payments are settled by internal reserves, but not by external funds. Lump-sum retirement benefits are paid based on the Group’s rules and regulations of retirement.
(2) Defined Benefit Plans(i) ReconciliationPresent value of defined benefit obligation is analyzed as follows:
Millions of yen
Previous year(ended December 31, 2015)
Current year(ended December 31, 2016)
Balance at beginning of period 107,727 108,636
Current service cost 5,655 5,822
Interest expense 1,043 1,281
Remeasurements
Actuarial gains and losses* (1,013) 8,167
Past service cost 214 16
Benefits paid (5,399) 4,635)
Acquisitions through business combinations 775 38,242
Other (366) 2,377
Balance at end of period 108,636 159,909
* Actuarial gains and losses are mainly due to changes in financial assumptions.
Fair value of plan assets is analyzed as follows:
Millions of yen
Previous year(ended December 31, 2015)
Current year(ended December 31, 2016)
Balance at beginning of period 103,065 110,600
Interest income 1,012 1,402
Remeasurements
Gains on plan assets 3,406 (1,012)
Contribution to plan by employer 7,298 5,930
Contribution to plan by employees — 75
Benefits paid (4,037) (3,745)
Acquisitions through business combinations 175 43,446
Other (320) 2,563
Balance at end of period 110,600 159,259
29Financial Section 2016
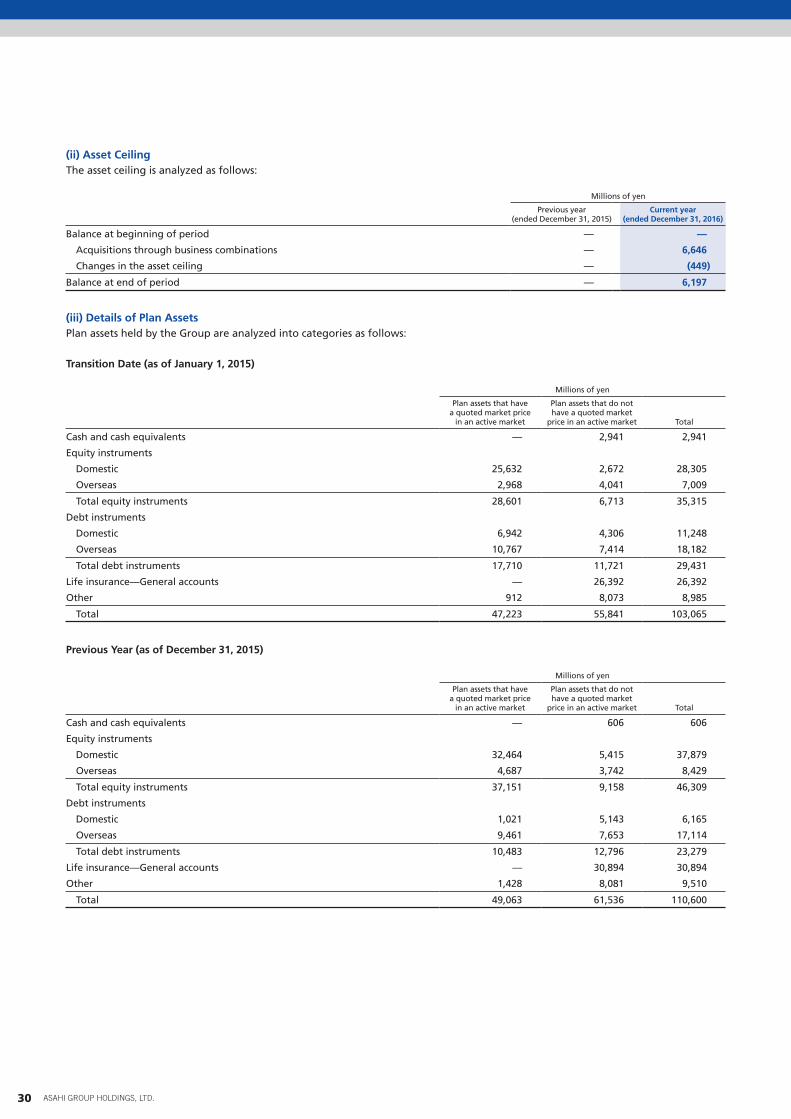
(ii) Asset CeilingThe asset ceiling is analyzed as follows:
Millions of yen
Previous year(ended December 31, 2015)
Current year(ended December 31, 2016)
Balance at beginning of period — —
Acquisitions through business combinations — 6,646
Changes in the asset ceiling — (449)
Balance at end of period — 6,197
(iii) Details of Plan AssetsPlan assets held by the Group are analyzed into categories as follows:
Transition Date (as of January 1, 2015)
Millions of yen
Plan assets that have a quoted market price
in an active market
Plan assets that do not have a quoted market
price in an active market Total
Cash and cash equivalents — 2,941 2,941
Equity instruments
Domestic 25,632 2,672 28,305
Overseas 2,968 4,041 7,009
Total equity instruments 28,601 6,713 35,315
Debt instruments
Domestic 6,942 4,306 11,248
Overseas 10,767 7,414 18,182
Total debt instruments 17,710 11,721 29,431
Life insurance—General accounts — 26,392 26,392
Other 912 8,073 8,985
Total 47,223 55,841 103,065
Previous Year (as of December 31, 2015)
Millions of yen
Plan assets that have a quoted market price
in an active market
Plan assets that do not have a quoted market
price in an active market Total
Cash and cash equivalents — 606 606
Equity instruments
Domestic 32,464 5,415 37,879
Overseas 4,687 3,742 8,429
Total equity instruments 37,151 9,158 46,309
Debt instruments
Domestic 1,021 5,143 6,165
Overseas 9,461 7,653 17,114
Total debt instruments 10,483 12,796 23,279
Life insurance—General accounts — 30,894 30,894
Other 1,428 8,081 9,510
Total 49,063 61,536 110,600
30 ASAHI GROUP HOLDINGS, LTD.
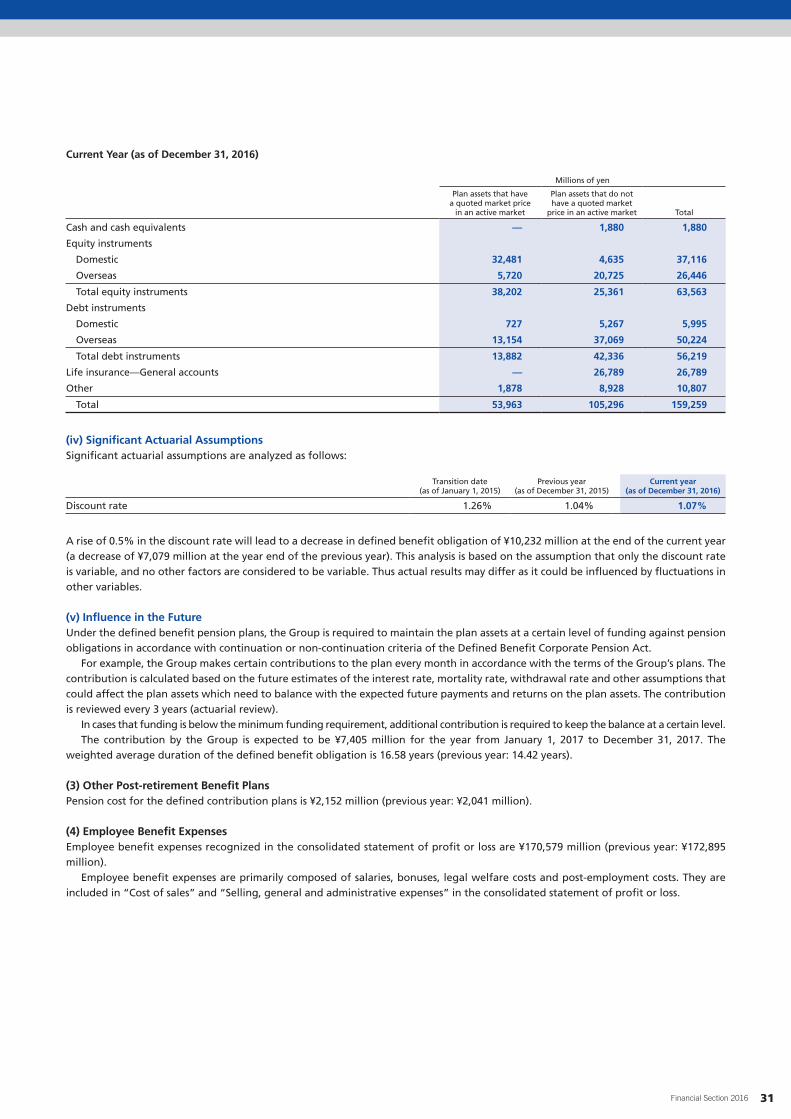
Current Year (as of December 31, 2016)
Millions of yen
Plan assets that have a quoted market price
in an active market
Plan assets that do not have a quoted market
price in an active market Total
Cash and cash equivalents — 1,880 1,880
Equity instruments
Domestic 32,481 4,635 37,116
Overseas 5,720 20,725 26,446
Total equity instruments 38,202 25,361 63,563
Debt instruments
Domestic 727 5,267 5,995
Overseas 13,154 37,069 50,224
Total debt instruments 13,882 42,336 56,219
Life insurance—General accounts — 26,789 26,789
Other 1,878 8,928 10,807
Total 53,963 105,296 159,259
(iv) Significant Actuarial AssumptionsSignificant actuarial assumptions are analyzed as follows:
Transition date(as of January 1, 2015)
Previous year(as of December 31, 2015)
Current year(as of December 31, 2016)
Discount rate 1.26% 1.04% 1.07%
A rise of 0.5% in the discount rate will lead to a decrease in defined benefit obligation of ¥10,232 million at the end of the current year (a decrease of ¥7,079 million at the year end of the previous year). This analysis is based on the assumption that only the discount rate is variable, and no other factors are considered to be variable. Thus actual results may differ as it could be influenced by fluctuations in other variables.
(v) Influence in the FutureUnder the defined benefit pension plans, the Group is required to maintain the plan assets at a certain level of funding against pension obligations in accordance with continuation or non-continuation criteria of the Defined Benefit Corporate Pension Act.
For example, the Group makes certain contributions to the plan every month in accordance with the terms of the Group’s plans. The contribution is calculated based on the future estimates of the interest rate, mortality rate, withdrawal rate and other assumptions that could affect the plan assets which need to balance with the expected future payments and returns on the plan assets. The contribution is reviewed every 3 years (actuarial review).
In cases that funding is below the minimum funding requirement, additional contribution is required to keep the balance at a certain level.The contribution by the Group is expected to be ¥7,405 million for the year from January 1, 2017 to December 31, 2017. The
weighted average duration of the defined benefit obligation is 16.58 years (previous year: 14.42 years).
(3) Other Post-retirement Benefit PlansPension cost for the defined contribution plans is ¥2,152 million (previous year: ¥2,041 million).
(4) Employee Benefit ExpensesEmployee benefit expenses recognized in the consolidated statement of profit or loss are ¥170,579 million (previous year: ¥172,895 million).
Employee benefit expenses are primarily composed of salaries, bonuses, legal welfare costs and post-employment costs. They are included in “Cost of sales” and “Selling, general and administrative expenses” in the consolidated statement of profit or loss.
31Financial Section 2016

20. Other Liabilities“Other current liabilities” and “Other non-current liabilities” are analyzed as follows:
Millions of yen
Transition date(as of January 1, 2015)
Previous year(as of December 31, 2015)
Current year(as of December 31, 2016)
Accrued alcohol tax 110,361 110,044 113,944
Accrued consumption tax 26,633 17,866 17,395
Accrued bonus 4,693 4,925 4,313
Other 8,697 13,721 10,183
Total 150,385 146,558 145,837
Other current liabilities 147,420 143,770 142,828
Other non-current liabilities 2,964 2,787 3,009
Total 150,385 146,558 145,837
21. Equity and Other Equity Interest(1) Issued Capital and ReservesThe number of shares authorized and shares issued are as follows:
Thousands of shares
Shares authorized Shares issued
Transition date (as of January 1, 2015) 972,305 483,585
Increase (Decrease) — —
Previous year (as of December 31, 2015) 972,305 483,585
Increase (Decrease) — —
Current year (as of December 31, 2016) 972,305 483,585
There are no par-value shares. Issued shares are fully paid.
Reserves are analyzed as follows:
(i) Share PremiumUnder the Companies Act of Japan, share premium is composed of capital reserve and other capital surplus. The Act stipulates that one-half or more of the proceeds from issuing a share should be recognized as share capital, and the rest should be recognized as capital reserve.
(ii) Retained EarningsRetained earnings are composed of legal reserve and other retained earnings. Under the Companies Act of Japan, one-tenth of appro-priation should be reserved in capital reserve or legal reserve until the total of these amounts reaches one-fourth of the share capital, and the rest of the appropriation can be distributed as dividends.
(2) Treasury SharesTreasury shares held by the Company, subsidiaries and associates are as follows:
Thousands of shares
Transition date (as of January 1, 2015)
Previous year (as of December 31, 2015)
Current year (as of December 31, 2016)
Held by the Company 20,984 25,676 25,453
Held by subsidiaries and associates 9 9 9
32 ASAHI GROUP HOLDINGS, LTD.

22. DividendsPrevious Year (ended December 31, 2015)(1) Dividends Paid
Resolution Type of sharesTotal dividends (Millions of yen)
Dividends per share (Yen) Reference date Effective date
Annual General Meeting of Shareholders held on March 26, 2015
Ordinary shares 10,639 23.00 Dec. 31, 2014 Mar. 27, 2015
Board of Directors meeting held on August 5, 2015
Ordinary shares 10,989 24.00 Jun. 30, 2015 Sep. 1, 2015
(2) Dividends That Will Be Effective in the Following Year of the Reference Date
Resolution Type of sharesResources of
dividendsTotal dividends (Millions of yen)
Dividends per share (Yen) Reference date Effective date
Annual General Meeting of Shareholders held on March 24, 2016)
Ordinary shares Retained earnings
11,905 26.00 Dec. 31, 2015 Mar. 25, 2016
Current Year (ended December 31, 2016)(1) Dividends Paid
Resolution Type of sharesTotal dividends (Millions of yen)
Dividends per share (Yen) Reference date Effective date
Annual General Meeting of Shareholders held on March 24, 2016
Ordinary shares 11,905 26.00 Dec. 31, 2015 Mar. 25, 2016
Board of Directors meeting held on August 3, 2016
Ordinary shares 11,911 26.00 Jun. 30, 2016 Sep. 1, 2016
(2) Dividends That Will Be Effective in the Following Year of the Reference Date
Resolution Type of sharesResources of
dividendsTotal dividends (Millions of yen)
Dividends per share (Yen) Reference date Effective date
Annual General Meeting of Shareholders held on March 28, 2017
Ordinary shares Retained earnings
12,827 28.00 Dec. 31, 2016 Mar. 29, 2017
23. Share-based PaymentsThe Company has implemented share option plans and the Performance-Linked Stock Compensation Plan.
(1) Details of Share Option PlansThe Company has share option plans. Options are granted based on the resolution by the Board of Directors in accordance with the terms approved at the general meeting of shareholders.
The details of each plan are as follows:
Date of resolution March 30, 2005 March 30, 2006
Title and number of the grantees 45 members including Directors, Audit & Supervisory Board Members and executive officers
48 members including Directors, Audit & Supervisory Board Members and executive officers
Type and number of shares granted Ordinary Shares: 600,000 shares Ordinary Shares: 620,000 shares
Date of grant March 30, 2005 March 30, 2006
Vesting conditions N/A N/A
Vesting period N/A N/A
Exercise price (Yen) 1,374 1,688
Exercise period Between March 30, 2007 and March 29, 2015
Between March 30, 2008 and March 29, 2016
33Financial Section 2016
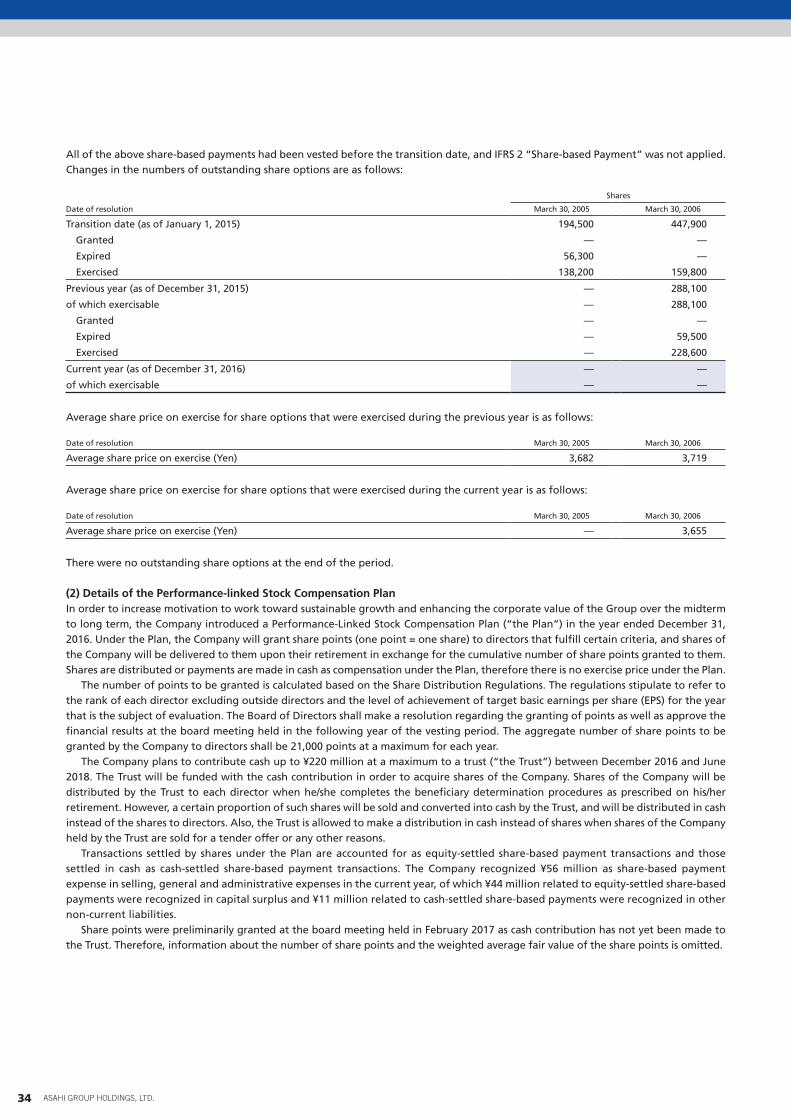
All of the above share-based payments had been vested before the transition date, and IFRS 2 “Share-based Payment” was not applied. Changes in the numbers of outstanding share options are as follows:
Shares
Date of resolution March 30, 2005 March 30, 2006
Transition date (as of January 1, 2015) 194,500 447,900
Granted — —
Expired 56,300 —
Exercised 138,200 159,800
Previous year (as of December 31, 2015) — 288,100
of which exercisable — 288,100
Granted — —
Expired — 59,500
Exercised — 228,600
Current year (as of December 31, 2016) — —
of which exercisable — —
Average share price on exercise for share options that were exercised during the previous year is as follows:
Date of resolution March 30, 2005 March 30, 2006
Average share price on exercise (Yen) 3,682 3,719
Average share price on exercise for share options that were exercised during the current year is as follows:
Date of resolution March 30, 2005 March 30, 2006
Average share price on exercise (Yen) — 3,655
There were no outstanding share options at the end of the period.
(2) Details of the Performance-linked Stock Compensation PlanIn order to increase motivation to work toward sustainable growth and enhancing the corporate value of the Group over the midterm to long term, the Company introduced a Performance-Linked Stock Compensation Plan (“the Plan”) in the year ended December 31, 2016. Under the Plan, the Company will grant share points (one point = one share) to directors that fulfill certain criteria, and shares of the Company will be delivered to them upon their retirement in exchange for the cumulative number of share points granted to them. Shares are distributed or payments are made in cash as compensation under the Plan, therefore there is no exercise price under the Plan.
The number of points to be granted is calculated based on the Share Distribution Regulations. The regulations stipulate to refer to the rank of each director excluding outside directors and the level of achievement of target basic earnings per share (EPS) for the year that is the subject of evaluation. The Board of Directors shall make a resolution regarding the granting of points as well as approve the financial results at the board meeting held in the following year of the vesting period. The aggregate number of share points to be granted by the Company to directors shall be 21,000 points at a maximum for each year.
The Company plans to contribute cash up to ¥220 million at a maximum to a trust (“the Trust”) between December 2016 and June 2018. The Trust will be funded with the cash contribution in order to acquire shares of the Company. Shares of the Company will be distributed by the Trust to each director when he/she completes the beneficiary determination procedures as prescribed on his/her retirement. However, a certain proportion of such shares will be sold and converted into cash by the Trust, and will be distributed in cash instead of the shares to directors. Also, the Trust is allowed to make a distribution in cash instead of shares when shares of the Company held by the Trust are sold for a tender offer or any other reasons.
Transactions settled by shares under the Plan are accounted for as equity-settled share-based payment transactions and those settled in cash as cash-settled share-based payment transactions. The Company recognized ¥56 million as share-based payment expense in selling, general and administrative expenses in the current year, of which ¥44 million related to equity-settled share-based payments were recognized in capital surplus and ¥11 million related to cash-settled share-based payments were recognized in other non- current liabilities.
Share points were preliminarily granted at the board meeting held in February 2017 as cash contribution has not yet been made to the Trust. Therefore, information about the number of share points and the weighted average fair value of the share points is omitted.
34 ASAHI GROUP HOLDINGS, LTD.

24. Revenue“Revenue” is analyzed as follows:
Millions of yen
Previous year (ended December 31, 2015)
Current year (ended December 31, 2016)
Sales of goods 1,660,257 1,676,467
Rendering of services 29,270 30,433
Total 1,689,527 1,706,901
25. Selling, General and Administrative Expenses“Selling, general and administrative expenses” is analyzed as follows:
Millions of yen
Previous year (ended December 31, 2015)
Current year (ended December 31, 2016)
Sales commissions 96,052 106,991
Advertising 50,549 48,092
Transportation 61,355 59,621
Employee benefits 118,286 117,039
Depreciation and amortization 30,548 31,836
Research and development 10,399 9,550
Other 78,803 87,110
Total 445,996 460,241
26. Other Operating Income and Expense“Other operating income” and “Other operating expense” are analyzed as follows:
(1) Other Operating Income
Millions of yen
Previous year (ended December 31, 2015)
Current year (ended December 31, 2016)
Gains on sales of property, plant and equipment 1,097 6,096
Other 2,417 1,907
Total 3,514 8,004
(2) Other Operating Expense
Millions of yen
Previous year (ended December 31, 2015)
Current year (ended December 31, 2016)
Losses on disposals of property, plant and equipment 4,863 4,771
Impairment losses 27,099 6,336
Other 15,616 8,493
Total 47,580 19,600
35Financial Section 2016

27. Finance Income and Finance Costs“Finance income” and “Finance costs” are analyzed as follows:
(1) Finance Income
Millions of yen
Previous year (ended December 31, 2015)
Current year (ended December 31, 2016)
Interest received
Financial assets measured at amortized cost 586 331
Dividends received
Financial assets measured at fair value through other comprehensive income 2,112 2.505
Gains on change in fair value of derivatives
Financial assets measured at fair value through profit or loss 312 251
Other — 18
Total 3,011 3,106
(2) Finance Costs
Millions of yen
Previous year (ended December 31, 2015)
Current year (ended December 31, 2016)
Interest paid
Financial liabilities measured at amortized cost 3,875 3,763
Foreign exchange loss 751 706
Other 469 (403)
Total 5,095 4,066
28. Income Taxes(1) Deferred Tax Assets and Deferred Tax Liabilities“Deferred tax assets” and “Deferred tax liabilities” are mainly composed of the following:
Millions of yen
Transition date (as of Jan. 1, 2015)
Recognized in profit or loss
Recognized in OCI Other*
Previous year (as of Dec. 31, 2015)
Deferred tax assets
Allowance for credit losses 2,566 (638) — (1) 1,926
Retirement benefits 7,391 (1,980) (1,636) 220 3,995
Property, plant and equipment and intangible assets 36,905 (1,506) — 32 35,431
Unused tax losses 1,803 2,811 — 3 4,618
Income tax payable—enterprise tax 2,129 5 — (18) 2,116
Accrued bonus 1,829 70 — 1 1,901
Other 14,324 696 (386) (242) 14,392
Total of DTA 66,950 (540) (2,023) (4) 64,382
Deferred tax liabilities
Property, plant and equipment and intangible assets (43,809) 4,825 — (866) (39,850)
Equity instruments (20,915) — 1,942 (7,397) (26,371)
Retained earnings of subsidiaries and associates (8,781) (627) (1,340) — (10,748)
Other (4,428) (564) 163 2,104 (2,724)
Total of DTL (77,934) 3,633 765 (6,159) (79,694)
Net amount of DTA and DTL (10,983) 3,092 (1,258) (6,163) (15,312)
* Amounts in the column ‘Other’ are primarily deferred tax assets and deferred tax liabilities recognized through business combination. Exchange rate fluctuations are also included in other.
36 ASAHI GROUP HOLDINGS, LTD.
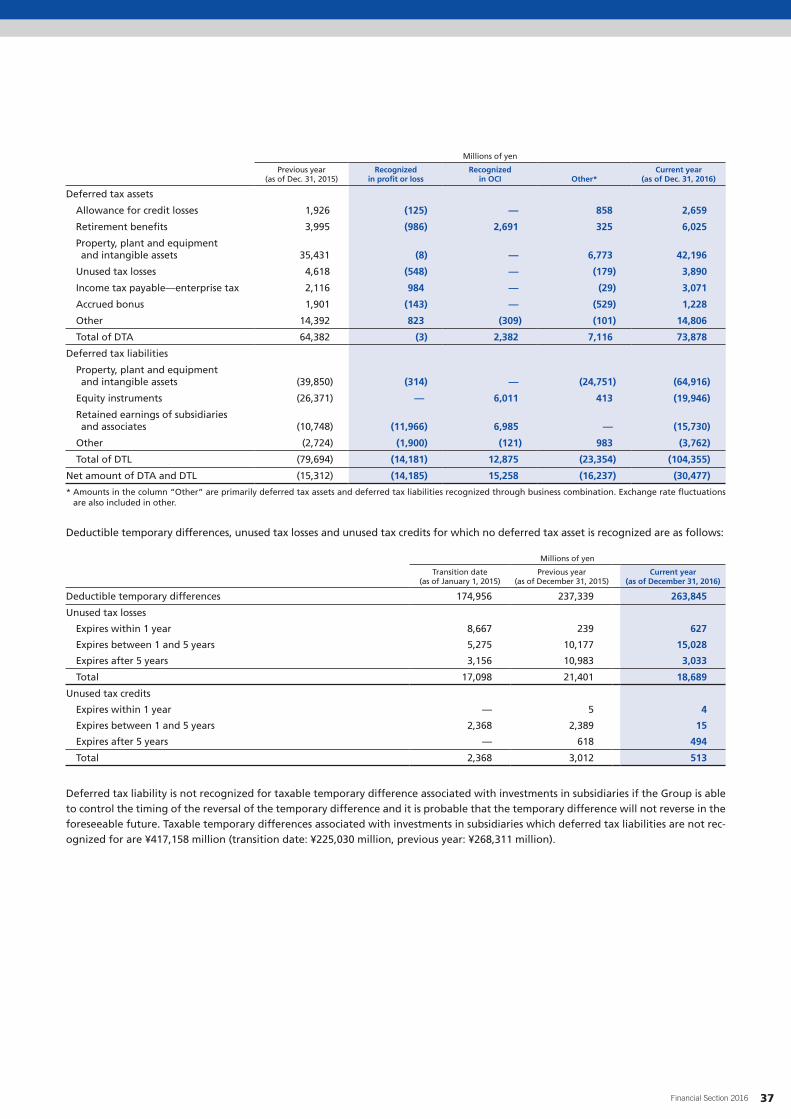
Millions of yen
Previous year (as of Dec. 31, 2015)
Recognized in profit or loss
Recognized in OCI Other*
Current year (as of Dec. 31, 2016)
Deferred tax assets
Allowance for credit losses 1,926 (125) — 858 2,659
Retirement benefits 3,995 (986) 2,691 325 6,025
Property, plant and equipment and intangible assets 35,431 (8) — 6,773 42,196
Unused tax losses 4,618 (548) — (179) 3,890
Income tax payable—enterprise tax 2,116 984 — (29) 3,071
Accrued bonus 1,901 (143) — (529) 1,228
Other 14,392 823 (309) (101) 14,806
Total of DTA 64,382 (3) 2,382 7,116 73,878
Deferred tax liabilities
Property, plant and equipment and intangible assets (39,850) (314) — (24,751) (64,916)
Equity instruments (26,371) — 6,011 413 (19,946)
Retained earnings of subsidiaries and associates (10,748) (11,966) 6,985 — (15,730)
Other (2,724) (1,900) (121) 983 (3,762)
Total of DTL (79,694) (14,181) 12,875 (23,354) (104,355)
Net amount of DTA and DTL (15,312) (14,185) 15,258 (16,237) (30,477)
* Amounts in the column “Other” are primarily deferred tax assets and deferred tax liabilities recognized through business combination. Exchange rate fluctuations are also included in other.
Deductible temporary differences, unused tax losses and unused tax credits for which no deferred tax asset is recognized are as follows:
Millions of yen
Transition date(as of January 1, 2015)
Previous year(as of December 31, 2015)
Current year(as of December 31, 2016)
Deductible temporary differences 174,956 237,339 263,845
Unused tax losses
Expires within 1 year 8,667 239 627
Expires between 1 and 5 years 5,275 10,177 15,028
Expires after 5 years 3,156 10,983 3,033
Total 17,098 21,401 18,689
Unused tax credits
Expires within 1 year — 5 4
Expires between 1 and 5 years 2,368 2,389 15
Expires after 5 years — 618 494
Total 2,368 3,012 513
Deferred tax liability is not recognized for taxable temporary difference associated with investments in subsidiaries if the Group is able to control the timing of the reversal of the temporary difference and it is probable that the temporary difference will not reverse in the foreseeable future. Taxable temporary differences associated with investments in subsidiaries which deferred tax liabilities are not rec-ognized for are ¥417,158 million (transition date: ¥225,030 million, previous year: ¥268,311 million).
37Financial Section 2016
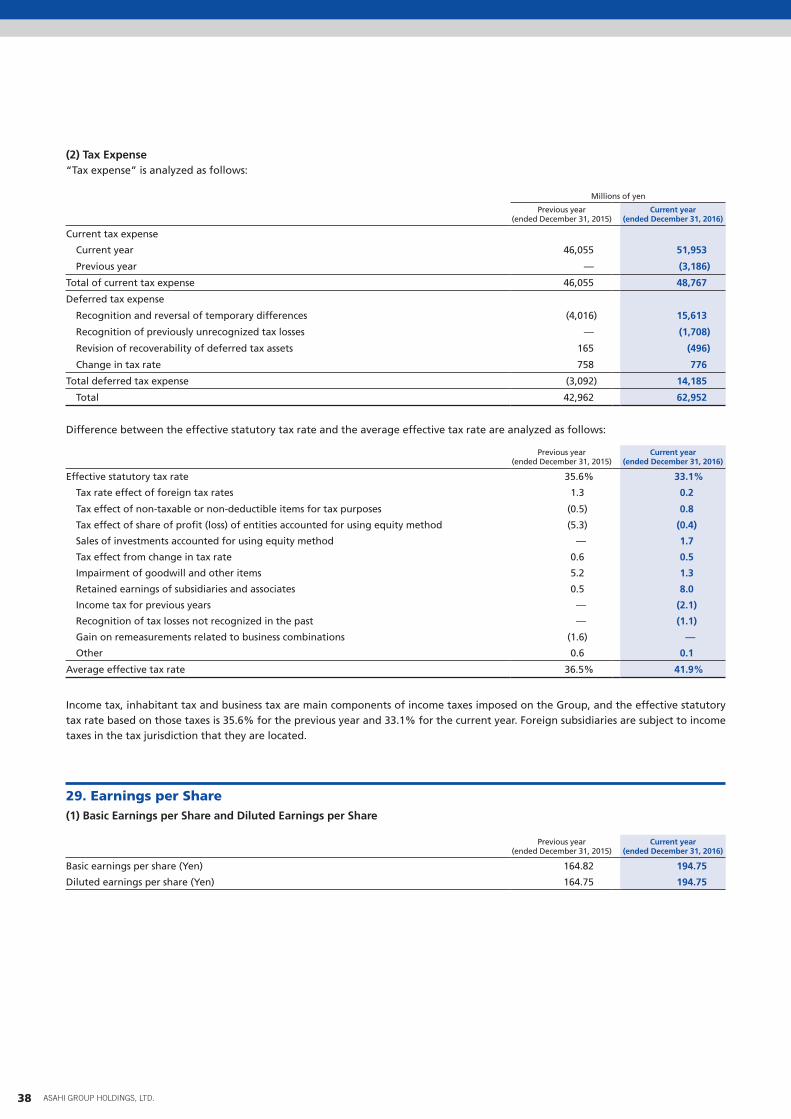
(2) Tax Expense“Tax expense” is analyzed as follows:
Millions of yen
Previous year (ended December 31, 2015)
Current year (ended December 31, 2016)
Current tax expense
Current year 46,055 51,953
Previous year — (3,186)
Total of current tax expense 46,055 48,767
Deferred tax expense
Recognition and reversal of temporary differences (4,016) 15,613
Recognition of previously unrecognized tax losses — (1,708)
Revision of recoverability of deferred tax assets 165 (496)
Change in tax rate 758 776
Total deferred tax expense (3,092) 14,185
Total 42,962 62,952
Difference between the effective statutory tax rate and the average effective tax rate are analyzed as follows:
Previous year (ended December 31, 2015)
Current year (ended December 31, 2016)
Effective statutory tax rate 35.6% 33.1%
Tax rate effect of foreign tax rates 1.3 0.2
Tax effect of non-taxable or non-deductible items for tax purposes (0.5) 0.8
Tax effect of share of profit (loss) of entities accounted for using equity method (5.3) (0.4)
Sales of investments accounted for using equity method — 1.7
Tax effect from change in tax rate 0.6 0.5
Impairment of goodwill and other items 5.2 1.3
Retained earnings of subsidiaries and associates 0.5 8.0
Income tax for previous years — (2.1)
Recognition of tax losses not recognized in the past — (1.1)
Gain on remeasurements related to business combinations (1.6) —
Other 0.6 0.1
Average effective tax rate 36.5% 41.9%
Income tax, inhabitant tax and business tax are main components of income taxes imposed on the Group, and the effective statutory tax rate based on those taxes is 35.6% for the previous year and 33.1% for the current year. Foreign subsidiaries are subject to income taxes in the tax jurisdiction that they are located.
29. Earnings per Share(1) Basic Earnings per Share and Diluted Earnings per Share
Previous year (ended December 31, 2015)
Current year (ended December 31, 2016)
Basic earnings per share (Yen) 164.82 194.75
Diluted earnings per share (Yen) 164.75 194.75
38 ASAHI GROUP HOLDINGS, LTD.

(2) Basis of Calculation for Basic and Diluted Earnings per Share
Previous year (ended December 31, 2015)
Current year (ended December 31, 2016)
Profit attributable to owners of parent (Millions of yen) 75,770 89,221
Weighted average number of ordinary shares outstanding (Shares) 459,725,310 458,122,963
Effect of dilution (Shares):
Warrant 194,412 16,663
Adjusted weighted average number of ordinary shares outstanding (Shares) 459,919,722 458,136,626
Description of equity instruments not included in calculation of diluted earnings per share because they were not dilutive for the year — —
30. Other Comprehensive IncomeOther comprehensive income and related tax effects are analyzed as follows:
Millions of yen
Previous year (ended December 31, 2015)
Current year (ended December 31, 2016)
Before tax Tax effects After tax Before tax Tax effects After tax
Items that will not be reclassified to profit or loss
Changes in fair value of financial instruments measured at fair value through other comprehensive income
Increase and decrease (2,575) 1,502 (1,073) (9,115) 6,104 (3,010)
Changes (2,575) 1,502 (1,073) (9,115) 6,104 (3,010)
Remeasurements of defined benefit plans
Increase and decrease 4,419 (1,426) 2,992 (9,180) 2,846 (6,333)
Changes 4,419 (1,426) 2,992 (9,180) 2,846 (6,333)
Share of other comprehensive income of entities accounted for using equity method
Increase and decrease (4) — (4) 30 — 30
Changes (4) — (4) 30 — 30
Items that might be reclassified to profit or loss
Cash flow hedges
Increase and decrease (359) 131 (227) (11,411) 3,747 (7,664)
Reclassification to profit or loss 45 (16) 29 53 (17) 35
Changes (313) 115 (197) (11,358) 3,729 (7,628)
Translation difference on foreign operations
Increase and decrease (29,759) — (29,759) 10,130 7 10,137
Reclassification to profit or loss — — — — — —
Changes (29,759) — (29,759) 10,130 7 10,137
Share of other comprehensive income of entities accounted for using equity method
Increase and decrease 7,863 (1,340) 6,523 (30,339) 8,631 (21,707)
Reclassification to profit or loss 8 — 8 4,677 (1,654) 3,023
Changes 7,872 (1,340) 6,532 (25,661) 6,977 (18,683)
Total other comprehensive income (20,360) (1,148) (21,509) (45,154) 19,665 (25,488)
39Financial Section 2016
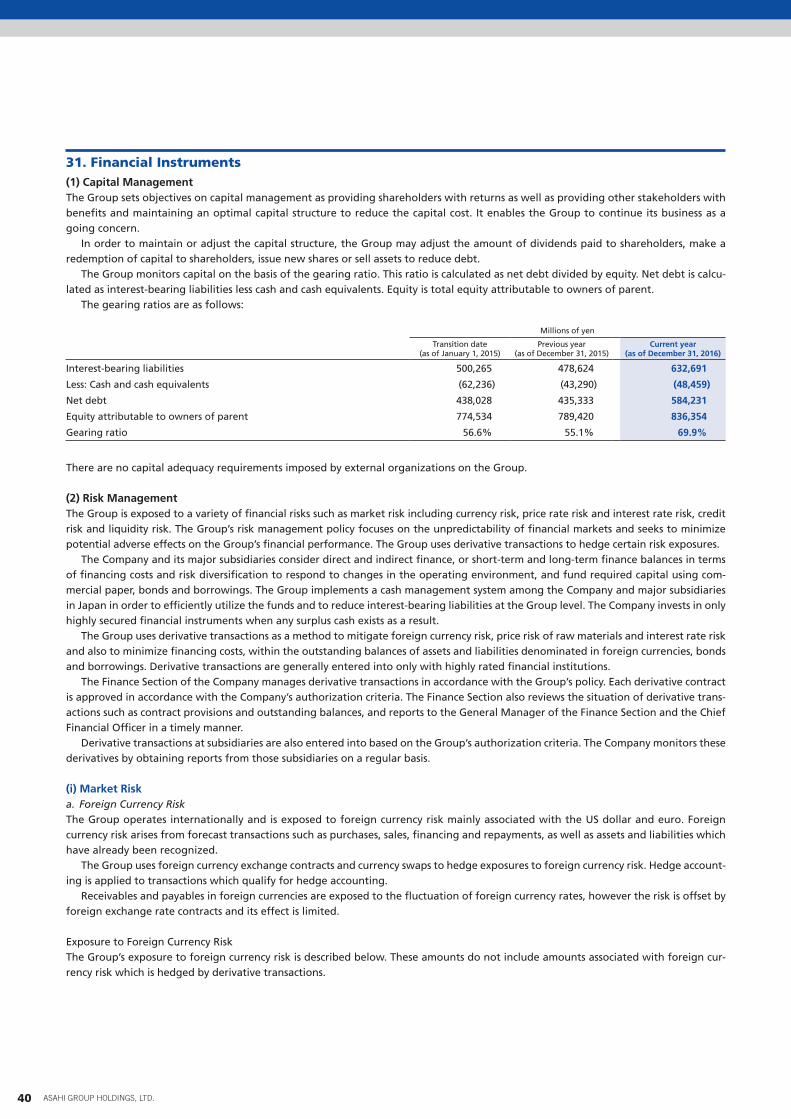
31. Financial Instruments(1) Capital ManagementThe Group sets objectives on capital management as providing shareholders with returns as well as providing other stakeholders with benefits and maintaining an optimal capital structure to reduce the capital cost. It enables the Group to continue its business as a going concern.
In order to maintain or adjust the capital structure, the Group may adjust the amount of dividends paid to shareholders, make a redemption of capital to shareholders, issue new shares or sell assets to reduce debt.
The Group monitors capital on the basis of the gearing ratio. This ratio is calculated as net debt divided by equity. Net debt is calcu-lated as interest-bearing liabilities less cash and cash equivalents. Equity is total equity attributable to owners of parent.
The gearing ratios are as follows:
Millions of yen
Transition date (as of January 1, 2015)
Previous year (as of December 31, 2015)
Current year (as of December 31, 2016)
Interest-bearing liabilities 500,265 478,624 632,691
Less: Cash and cash equivalents (62,236) (43,290) (48,459)
Net debt 438,028 435,333 584,231
Equity attributable to owners of parent 774,534 789,420 836,354
Gearing ratio 56.6% 55.1% 69.9%
There are no capital adequacy requirements imposed by external organizations on the Group.
(2) Risk ManagementThe Group is exposed to a variety of financial risks such as market risk including currency risk, price rate risk and interest rate risk, credit risk and liquidity risk. The Group’s risk management policy focuses on the unpredictability of financial markets and seeks to minimize potential adverse effects on the Group’s financial performance. The Group uses derivative transactions to hedge certain risk exposures.
The Company and its major subsidiaries consider direct and indirect finance, or short-term and long-term finance balances in terms of financing costs and risk diversification to respond to changes in the operating environment, and fund required capital using com-mercial paper, bonds and borrowings. The Group implements a cash management system among the Company and major subsidiaries in Japan in order to efficiently utilize the funds and to reduce interest-bearing liabilities at the Group level. The Company invests in only highly secured financial instruments when any surplus cash exists as a result.
The Group uses derivative transactions as a method to mitigate foreign currency risk, price risk of raw materials and interest rate risk and also to minimize financing costs, within the outstanding balances of assets and liabilities denominated in foreign currencies, bonds and borrowings. Derivative transactions are generally entered into only with highly rated financial institutions.
The Finance Section of the Company manages derivative transactions in accordance with the Group’s policy. Each derivative contract is approved in accordance with the Company’s authorization criteria. The Finance Section also reviews the situation of derivative trans-actions such as contract provisions and outstanding balances, and reports to the General Manager of the Finance Section and the Chief Financial Officer in a timely manner.
Derivative transactions at subsidiaries are also entered into based on the Group’s authorization criteria. The Company monitors these derivatives by obtaining reports from those subsidiaries on a regular basis.
(i) Market Riska. Foreign Currency RiskThe Group operates internationally and is exposed to foreign currency risk mainly associated with the US dollar and euro. Foreign currency risk arises from forecast transactions such as purchases, sales, financing and repayments, as well as assets and liabilities which have already been recognized.
The Group uses foreign currency exchange contracts and currency swaps to hedge exposures to foreign currency risk. Hedge account-ing is applied to transactions which qualify for hedge accounting.
Receivables and payables in foreign currencies are exposed to the fluctuation of foreign currency rates, however the risk is offset by foreign exchange rate contracts and its effect is limited.
Exposure to Foreign Currency RiskThe Group’s exposure to foreign currency risk is described below. These amounts do not include amounts associated with foreign cur-rency risk which is hedged by derivative transactions.
40 ASAHI GROUP HOLDINGS, LTD.
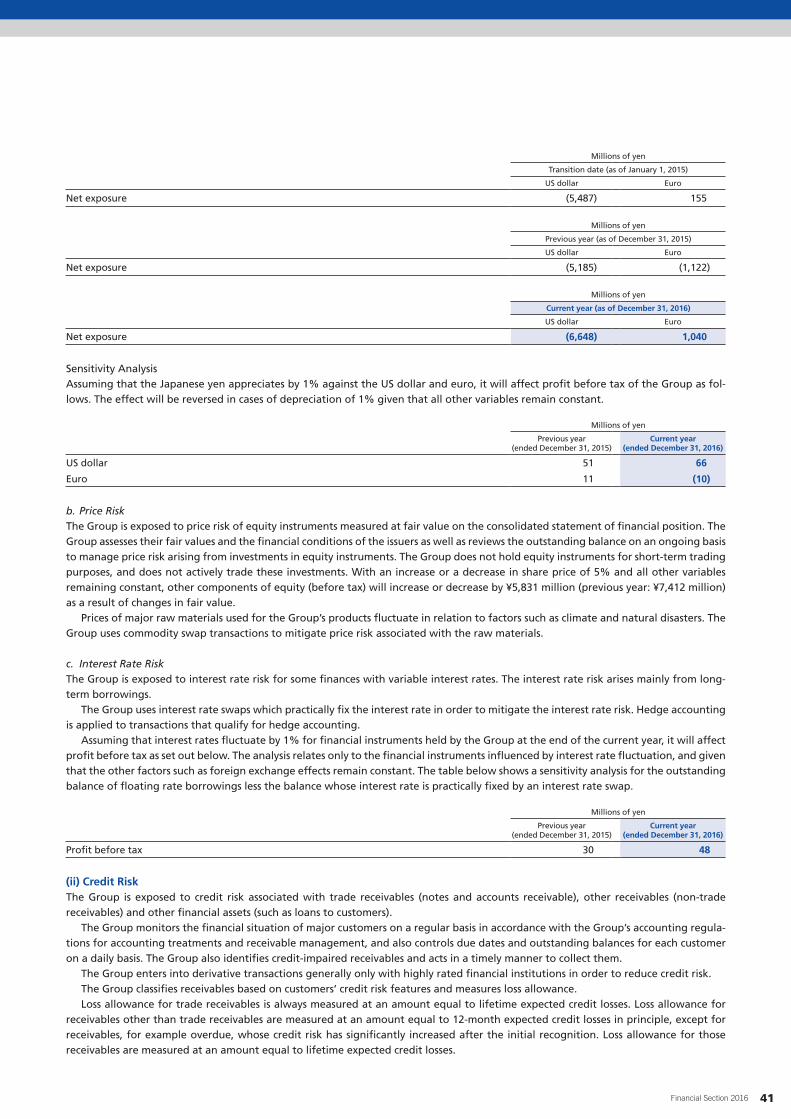
Millions of yen
Transition date (as of January 1, 2015)
US dollar Euro
Net exposure (5,487) 155
Millions of yen
Previous year (as of December 31, 2015)
US dollar Euro
Net exposure (5,185) (1,122)
Millions of yen
Current year (as of December 31, 2016)
US dollar Euro
Net exposure (6,648) 1,040
Sensitivity AnalysisAssuming that the Japanese yen appreciates by 1% against the US dollar and euro, it will affect profit before tax of the Group as fol-lows. The effect will be reversed in cases of depreciation of 1% given that all other variables remain constant.
Millions of yen
Previous year (ended December 31, 2015)
Current year (ended December 31, 2016)
US dollar 51 66
Euro 11 (10)
b. Price RiskThe Group is exposed to price risk of equity instruments measured at fair value on the consolidated statement of financial position. The Group assesses their fair values and the financial conditions of the issuers as well as reviews the outstanding balance on an ongoing basis to manage price risk arising from investments in equity instruments. The Group does not hold equity instruments for short-term trading purposes, and does not actively trade these investments. With an increase or a decrease in share price of 5% and all other variables remaining constant, other components of equity (before tax) will increase or decrease by ¥5,831 million (previous year: ¥7,412 million) as a result of changes in fair value.
Prices of major raw materials used for the Group’s products fluctuate in relation to factors such as climate and natural disasters. The Group uses commodity swap transactions to mitigate price risk associated with the raw materials.
c. Interest Rate RiskThe Group is exposed to interest rate risk for some finances with variable interest rates. The interest rate risk arises mainly from long-term borrowings.
The Group uses interest rate swaps which practically fix the interest rate in order to mitigate the interest rate risk. Hedge accounting is applied to transactions that qualify for hedge accounting.
Assuming that interest rates fluctuate by 1% for financial instruments held by the Group at the end of the current year, it will affect profit before tax as set out below. The analysis relates only to the financial instruments influenced by interest rate fluctuation, and given that the other factors such as foreign exchange effects remain constant. The table below shows a sensitivity analysis for the outstanding balance of floating rate borrowings less the balance whose interest rate is practically fixed by an interest rate swap.
Millions of yen
Previous year (ended December 31, 2015)
Current year (ended December 31, 2016)
Profit before tax 30 48
(ii) Credit RiskThe Group is exposed to credit risk associated with trade receivables (notes and accounts receivable), other receivables (non-trade receivables) and other financial assets (such as loans to customers).
The Group monitors the financial situation of major customers on a regular basis in accordance with the Group’s accounting regula-tions for accounting treatments and receivable management, and also controls due dates and outstanding balances for each customer on a daily basis. The Group also identifies credit-impaired receivables and acts in a timely manner to collect them.
The Group enters into derivative transactions generally only with highly rated financial institutions in order to reduce credit risk.The Group classifies receivables based on customers’ credit risk features and measures loss allowance.Loss allowance for trade receivables is always measured at an amount equal to lifetime expected credit losses. Loss allowance for
receivables other than trade receivables are measured at an amount equal to 12-month expected credit losses in principle, except for receivables, for example overdue, whose credit risk has significantly increased after the initial recognition. Loss allowance for those receivables are measured at an amount equal to lifetime expected credit losses.
41Financial Section 2016

Loss allowance is measured as follows:• Trade Receivables
The simplified approach is applied. Trade receivables are categorized according to customers’ credit risk features, and loss allow-ance is measured based on the historical credit loss ratio and expected future economic conditions for each category.
• Receivables other than Trade Receivables The general approach is applied. Loss allowance for receivables whose credit risk is considered not significantly increased is mea-sured based on the historical credit loss ratio of similar receivables and expected future economic conditions. Loss allowance for receivables whose credit risk is considered significantly increased and credit-impaired financial instruments is measured as the dif-ference between the present value of expected future cash flow discounted by the initial interest rate and the carrying amount.
Carrying amounts of financial assets subject to impairment and the amount of loss allowance are as follows:
Trade and Other Receivables
Millions of yen
Carrying amount
Financial assets with loss allowance measured
at 12-month expected credit losses
Financial assets with loss allowance measured at lifetime expected
credit losses
Financial assets to which the simplified approach is applied
Transition date (as of January 1, 2015) 15,253 91 352,299
Previous year (as of December 31, 2015) 11,843 158 361,447
Current year (as of December 31, 2016) 13,491 240 384,529
Financial assets with loss allowance measured at lifetime expected credit losses consist mainly of credit-impaired financial assets.
Credit Risk RatingThe credit risk rating of financial assets with loss allowance measured at lifetime expected credit losses is relatively low compared to that of financial asset with loss allowance measured at 12-month expected credit losses, whereas that of financial assets to which the simpli-fied approach is applied is equivalent to that of financial asset with loss allowance measured at 12-month expected credit losses. Credit risk of financial assets within the same stage is approximately the same.
The Group includes impairment loss related to credit risk in “Other operating expense” in the consolidated statement of profit or loss in the light of its immateriality.
Millions of yen
Loss allowance
Financial assets with loss allowance measured
at 12-month expected credit losses
Financial assets with loss allowance measured at lifetime expected
credit losses
Financial assets to which the simplified approach is applied
Transition date (as of January 1, 2015) 26 88 2,289
Increase 25 159 1,176
Utilization — (66) (289)
Reversal (26) (40) (1,791)
Other — (0) (145)
Previous year (as of December 31, 2015) 25 140 1,239
Increase 1 102 665
Utilization — (0) (307)
Reversal (25) (10) (1,174)
Other 0 (12) 277
Current year (as of December 31, 2016) 1 219 700
Other Financial Assets
Millions of yen
Carrying amount
Financial assets with loss allowance measured
at 12-month expected credit losses
Financial assets with loss allowance measured at lifetime expected
credit losses
Transition date (as of January 1, 2015) 8,517 5,831
Previous year (as of December 31, 2015) 9,842 4,991
Current year (as of December 31, 2016) 9,443 6,490
Financial assets with loss allowance measured at lifetime expected credit losses consist mainly of credit-impaired financial assets.
42 ASAHI GROUP HOLDINGS, LTD.
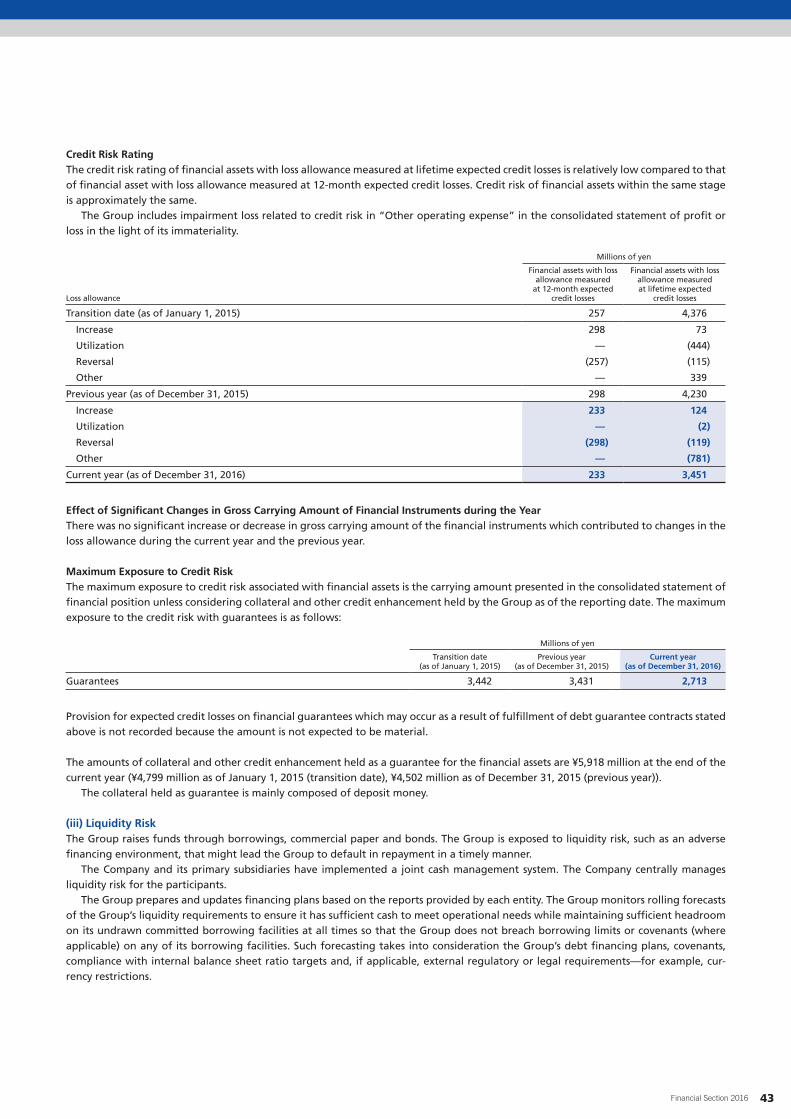
Credit Risk RatingThe credit risk rating of financial assets with loss allowance measured at lifetime expected credit losses is relatively low compared to that of financial asset with loss allowance measured at 12-month expected credit losses. Credit risk of financial assets within the same stage is approximately the same.
The Group includes impairment loss related to credit risk in “Other operating expense” in the consolidated statement of profit or loss in the light of its immateriality.
Millions of yen
Loss allowance
Financial assets with loss allowance measured
at 12-month expected credit losses
Financial assets with loss allowance measured at lifetime expected
credit losses
Transition date (as of January 1, 2015) 257 4,376
Increase 298 73
Utilization — (444)
Reversal (257) (115)
Other — 339
Previous year (as of December 31, 2015) 298 4,230
Increase 233 124
Utilization — (2)
Reversal (298) (119)
Other — (781)
Current year (as of December 31, 2016) 233 3,451
Effect of Significant Changes in Gross Carrying Amount of Financial Instruments during the YearThere was no significant increase or decrease in gross carrying amount of the financial instruments which contributed to changes in the loss allowance during the current year and the previous year.
Maximum Exposure to Credit RiskThe maximum exposure to credit risk associated with financial assets is the carrying amount presented in the consolidated statement of financial position unless considering collateral and other credit enhancement held by the Group as of the reporting date. The maximum exposure to the credit risk with guarantees is as follows:
Millions of yen
Transition date (as of January 1, 2015)
Previous year (as of December 31, 2015)
Current year (as of December 31, 2016)
Guarantees 3,442 3,431 2,713
Provision for expected credit losses on financial guarantees which may occur as a result of fulfillment of debt guarantee contracts stated above is not recorded because the amount is not expected to be material.
The amounts of collateral and other credit enhancement held as a guarantee for the financial assets are ¥5,918 million at the end of the current year (¥4,799 million as of January 1, 2015 (transition date), ¥4,502 million as of December 31, 2015 (previous year)).
The collateral held as guarantee is mainly composed of deposit money.
(iii) Liquidity RiskThe Group raises funds through borrowings, commercial paper and bonds. The Group is exposed to liquidity risk, such as an adverse financing environment, that might lead the Group to default in repayment in a timely manner.
The Company and its primary subsidiaries have implemented a joint cash management system. The Company centrally manages liquidity risk for the participants.
The Group prepares and updates financing plans based on the reports provided by each entity. The Group monitors rolling forecasts of the Group’s liquidity requirements to ensure it has sufficient cash to meet operational needs while maintaining sufficient headroom on its undrawn committed borrowing facilities at all times so that the Group does not breach borrowing limits or covenants (where applicable) on any of its borrowing facilities. Such forecasting takes into consideration the Group’s debt financing plans, covenants, compliance with internal balance sheet ratio targets and, if applicable, external regulatory or legal requirements—for example, cur-rency restrictions.
43Financial Section 2016
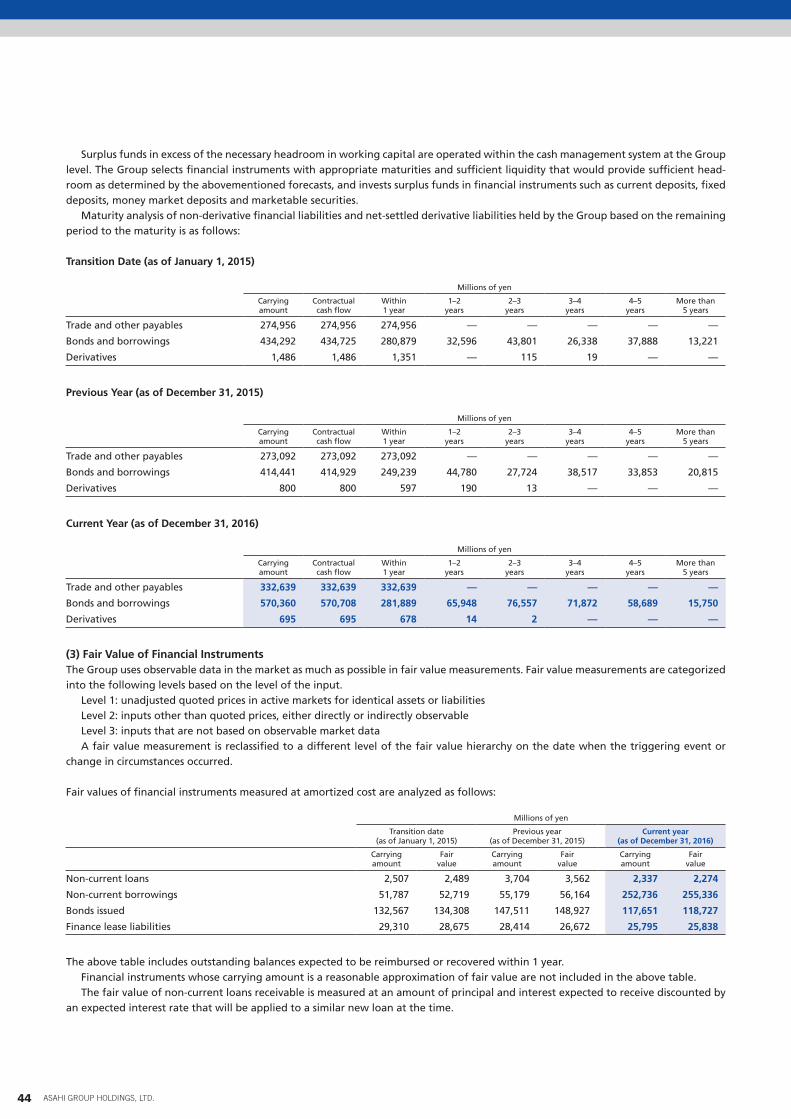
Surplus funds in excess of the necessary headroom in working capital are operated within the cash management system at the Group level. The Group selects financial instruments with appropriate maturities and sufficient liquidity that would provide sufficient head-room as determined by the abovementioned forecasts, and invests surplus funds in financial instruments such as current deposits, fixed deposits, money market deposits and marketable securities.
Maturity analysis of non-derivative financial liabilities and net-settled derivative liabilities held by the Group based on the remaining period to the maturity is as follows:
Transition Date (as of January 1, 2015)
Millions of yen
Carrying amount
Contractual cash flow
Within 1 year
1–2 years
2–3 years
3–4 years
4–5 years
More than 5 years
Trade and other payables 274,956 274,956 274,956 — — — — —
Bonds and borrowings 434,292 434,725 280,879 32,596 43,801 26,338 37,888 13,221
Derivatives 1,486 1,486 1,351 — 115 19 — —
Previous Year (as of December 31, 2015)
Millions of yen
Carrying amount
Contractual cash flow
Within 1 year
1–2 years
2–3 years
3–4 years
4–5 years
More than 5 years
Trade and other payables 273,092 273,092 273,092 — — — — —
Bonds and borrowings 414,441 414,929 249,239 44,780 27,724 38,517 33,853 20,815
Derivatives 800 800 597 190 13 — — —
Current Year (as of December 31, 2016)
Millions of yen
Carrying amount
Contractual cash flow
Within 1 year
1–2 years
2–3 years
3–4 years
4–5 years
More than 5 years
Trade and other payables 332,639 332,639 332,639 — — — — —
Bonds and borrowings 570,360 570,708 281,889 65,948 76,557 71,872 58,689 15,750
Derivatives 695 695 678 14 2 — — —
(3) Fair Value of Financial InstrumentsThe Group uses observable data in the market as much as possible in fair value measurements. Fair value measurements are categorized into the following levels based on the level of the input.
Level 1: unadjusted quoted prices in active markets for identical assets or liabilitiesLevel 2: inputs other than quoted prices, either directly or indirectly observableLevel 3: inputs that are not based on observable market dataA fair value measurement is reclassified to a different level of the fair value hierarchy on the date when the triggering event or
change in circumstances occurred.
Fair values of financial instruments measured at amortized cost are analyzed as follows:
Millions of yen
Transition date (as of January 1, 2015)
Previous year (as of December 31, 2015)
Current year (as of December 31, 2016)
Carrying amount
Fair value
Carrying amount
Fair value
Carrying amount
Fair value
Non-current loans 2,507 2,489 3,704 3,562 2,337 2,274
Non-current borrowings 51,787 52,719 55,179 56,164 252,736 255,336
Bonds issued 132,567 134,308 147,511 148,927 117,651 118,727
Finance lease liabilities 29,310 28,675 28,414 26,672 25,795 25,838
The above table includes outstanding balances expected to be reimbursed or recovered within 1 year.Financial instruments whose carrying amount is a reasonable approximation of fair value are not included in the above table.The fair value of non-current loans receivable is measured at an amount of principal and interest expected to receive discounted by
an expected interest rate that will be applied to a similar new loan at the time.
44 ASAHI GROUP HOLDINGS, LTD.

The fair value of non-current borrowings is measured at an amount of principal and interest expected to be paid discounted by an expected interest rate that will be applied to a similar new loan at the time.
The fair value of bonds is based on the price on bond markets, if available.The fair value of finance lease liabilities is measured at the present value of the total amount of principal and interest discounted by
an expected interest rate which will be applied to a similar new lease transaction at the time.In the above measurement of fair value, bonds are classified as Level 2 and other items as Level 3. The fair value of Level 2 bonds is
estimated using statistical prices announced by the Japan Securities Dealers Association. The fair value of Level 3 financial instruments is measured by discounting contractual cash flows at market interest rates, and the difference from the carrying amount is due to the difference between market interest rates and contractual interest rates.
Financial assets and liabilities measured at fair value are as follows:
Transition Date (as of January 1, 2015)
Millions of yen
Level 1 Level 2 Level 3 Total
Assets
Derivatives designated as hedging instruments — 621 — 621
Derivatives not designated as hedging instruments — 1,651 — 1,651
Equity instruments 126,485 99 36,881 163,466
Others 301 771 — 1,073
Total assets 126,787 3,144 36,881 166,813
Liabilities
Derivatives designated as hedging instruments — 1,048 — 1,048
Derivatives not designated as hedging instruments — 438 — 438
Total liabilities — 1,486 — 1,486
Previous Year (as of December 31, 2015)
Millions of yen
Level 1 Level 2 Level 3 Total
Assets
Derivatives designated as hedging instruments — 24 — 24
Derivatives not designated as hedging instruments — 2,340 — 2,340
Equity instruments 148,240 87 76,302 224,630
Others 191 755 — 947
Total assets 148,432 3,207 76,302 227,942
Liabilities
Derivatives designated as hedging instruments — 255 — 255
Derivatives not designated as hedging instruments — 545 — 545
Total liabilities — 800 — 800
There were no material transfers between Levels 1 and 2 during the year.
Current Year (as of December 31, 2016)
Millions of yen
Level 1 Level 2 Level 3 Total
Assets
Derivatives designated as hedging instruments — 587 — 587
Derivatives not designated as hedging instruments — 1,897 — 1,897
Equity instruments 116,625 71 69,588 186,284
Others 151 682 — 833
Total assets 116,777 3,238 69,588 189,603
Liabilities
Derivatives designated as hedging instruments — 695 — 695
Derivative not designated as hedging instruments — — — —
Total liabilities — 695 — 695
45Financial Section 2016

There were no material transfers between Levels 1 and 2 during the year.
The fair value of financial instruments traded in active markets is the quoted market prices at the reporting date. The financial instruments are categorized into Level 1. Financial instruments categorized into Level 1 comprise primarily equity instruments traded in active markets.
The fair value of financial instruments that are not traded in an active market (for example, interest rate swaps and foreign currency exchange contracts) is determined by using another valuation technique which maximizes the use of observable market input and mini-mizes the use of entity specific estimates as much as possible. If all significant inputs are observable, the financial instrument is catego-rized into Level 2.
If one or more of the significant inputs is not based on observable market data, the financial instrument (for example, an equity instrument that is not traded in an active market) is categorized into Level 3. These financial instruments are primarily valued with the comparable companies analysis method or the discounted cash flow method, using inputs that are reasonably available and that many market participants consider reasonable.
Financial instruments categorized into Level 3 are analyzed as follows:
Previous Year (ended December 31, 2015)
Millions of yen
Equity instruments measured at fair value
through other comprehensive income Derivatives
Balance at beginning of period 36,881 —
Gains (losses) recognized in profit or loss — —
Gains (losses) recognized in other comprehensive income (23,363) —
Purchases 74 —
Sales (966) —
Settlements — —
Effect of changes in scope of consolidation 63,853 —
Transfers into/out of Level 3 (135) —
Other (41) —
Balance at end of period 76,302 —
Of gains (losses) recognized in profit or loss: Gains (losses) for assets held at end of period — —
Current Year (ended December 31, 2016)
Millions of yen
Equity instruments measured at fair value
through other comprehensive income Derivatives
Balance at beginning of period 76,302 —
Gains (losses) recognized in profit or loss — —
Gains (losses) recognized in other comprehensive income (6,400) —
Purchases 398 —
Sales (672) —
Settlements — —
Transfers into/out of Level 3 — —
Other (40) —
Balance at end of period 69,588 —
Of gains (losses) recognized in profit or loss: Gains (losses) for assets held at end of period — —
The Group analyzes changes in fair value measurements (including Level 3) based on factors such as inputs. The result of fair value measurements and the calculation processes (including assessments of valuation performed by a third party) as well as the results of analysis for the factors which caused the changes in fair value are reported to the Chief Financial Officer, and then the Officer reviews them and reports to the Board of Directors as necessary.
The principal unobservable input used in calculating the fair value of equity instruments classified as Level 3 is the price book-value ratio in the comparable companies analysis method, which is distributed in a range from 0.8 times to 2.0 times (from 0.8 times to 1.7 times in the previous year).
46 ASAHI GROUP HOLDINGS, LTD.

Each calculation model used for fair value measurement is annually reviewed by the Finance Section. The Group also engages a review, if necessary, by an external independent specialist of fair value measurement. The Group sometimes uses internal estimates in fair value measurement. Various analysis are performed for internal estimates such as time-series comparison to review appropriateness of these estimates, and then the Chief Financial Officer reviews the details as needed.
As to financial instruments categorized into Level 3, significant changes in fair value are not expected in cases that an unobservable input is replaced by a reasonable alternative assumption.
(4) Derivatives and Hedge AccountingHedge accounting conducted in the Group’s risk management is described in “(2) Risk Management.”
(i) Effect on the Consolidated Statement of Financial PositionEffect of derivatives designated as hedging instruments is set out below. Carrying amounts of derivatives designated as hedging instru-ments are measured at fair value and included in “Other financial assets” or “Other financial liabilities” in the consolidated statement of financial position.
Transition Date (as of January 1, 2015)
Hedge type Hedging instrumentNotional amount (Millions of yen)
Carrying amount (fair value)
Assets (Millions of yen)
Liabilities (Millions of yen)
Cash flow hedge Foreign currency exchange contract 26,305 621 913
Interest rate swap 11,000 — 134
Total 37,305 621 1,048
The average rates applied to the foreign currency exchange contracts are ¥107.49 per US dollar and ¥136.71 per euro. The average interest rate applied to the interest swaps is 0.87%.
Previous Year (as of December 31, 2015)
Hedge type Hedging instrumentNotional amount (Millions of yen)
Carrying amount (fair value)
Assets (Millions of yen)
Liabilities (Millions of yen)
Cash flow hedge Foreign currency exchange contract 16,278 24 171
Interest rate swap 12,115 — 84
Total 28,393 24 255
The average rates applied to the foreign currency exchange contracts are ¥120.83 per US dollar and ¥134.00 per euro. The average interest rate applied to the interest swaps is 0.87%.
Current Year (as of December 31, 2016)
Hedge type Hedging instrumentNotional amount (Millions of yen)
Carrying amount (fair value)
Assets (Millions of yen)
Liabilities (Millions of yen)
Cash flow hedge Foreign currency exchange contract 296,180 577 583
Currency swap 1,274 — 60
Commodity swap 555 10 —
Interest rate swap 14,105 — 52
Total 312,116 587 695
The average rates applied to the foreign currency exchange contracts are ¥104.78 per US dollar and ¥120.39 per euro. The average interest rate applied to the interest swaps is 1.11%.
Hedge transactions conducted by the Group hedge all hedged items, and there are no transactions that only hedge certain risk elements.The periods for which the foreign currency exchange contract, currency swap, commodity swap and interest swap would hedge cash
flow fluctuations are approximately 2 years, 9 months, 2 years and 4 years at the longest, respectively.The ineffective portion recognized in profit or loss is not significant, and thus a description of changes in fair value is omitted for the
hedging instruments which were used as a basis to recognize the ineffective portion.
47Financial Section 2016

Fair value of derivatives that are not designated as hedging instruments is as follows:
Millions of yen
Transition date (as of January 1, 2015)
Previous year (as of December 31, 2015)
Current year (as of December 31, 2016)
Assets Liabilities Assets Liabilities Assets Liabilities
Foreign currency exchange contract 1,651 12 2,319 6 288 —
Currency swap — — — — 1,510 —
Commodity swap — 425 20 538 98 —
Total 1,651 438 2,340 545 1,897 —
Reserve of cash flow hedges is as follows:There is no reserve of cash flow hedges arising from hedging relationships for which their hedge accounting is terminated.
Millions of yen
Transition date (as of January 1, 2015)
Previous year (as of December 31, 2015)
Current year (as of December 31, 2016)
Foreign currency exchange contract (218) (82) (148)
Currency swap — — (48)
Commodity swap — — 8
Interest rate swap (86) (56) (30)
Total (305) (138) (219)
The ineffective portion recognized in profit or loss is not significant, and thus a description of changes in fair value is omitted for the hedging instruments which were used as a basis to recognize the ineffective portion.
(ii) Effect on the Consolidated Statement of Profit or Loss and the Consolidated Statement of Comprehensive IncomeEffect of derivatives designated as hedging instruments in cash flow hedges is as follows:
Previous Year (ended December 31, 2015)
Millions of yen
Risk type
Gains (losses) recognized in other comprehensive
income*
Amount reclassified from other equity interest
to profit or loss*
Line item in profit or loss on
reclassification
Currency risk (363) —
Interest rate risk 4 45 Interest paid
Total (359) 45
* The amounts are gross values before tax.
Current Year (ended December 31, 2016)
Millions of yen
Risk type
Gains (losses) recognized in other comprehensive
income*
Amount reclassified from other equity interest
to profit or loss*
Line item in profit or loss on
reclassification
Currency risk (11,408) —
Price risk 10 —
Interest rate risk (12) 53 Interest paid
Total (11,411) 53
* The amounts are gross values before tax.
There is no reclassification due to termination of hedge accounting. Reserve of cash flow hedges accumulated in other equity interest is reclassified and included in the cost of an asset such as inventory if the hedged item is a forecast transaction to acquire the asset.
The ineffective portion recognized in profit or loss is not significant.
48 ASAHI GROUP HOLDINGS, LTD.
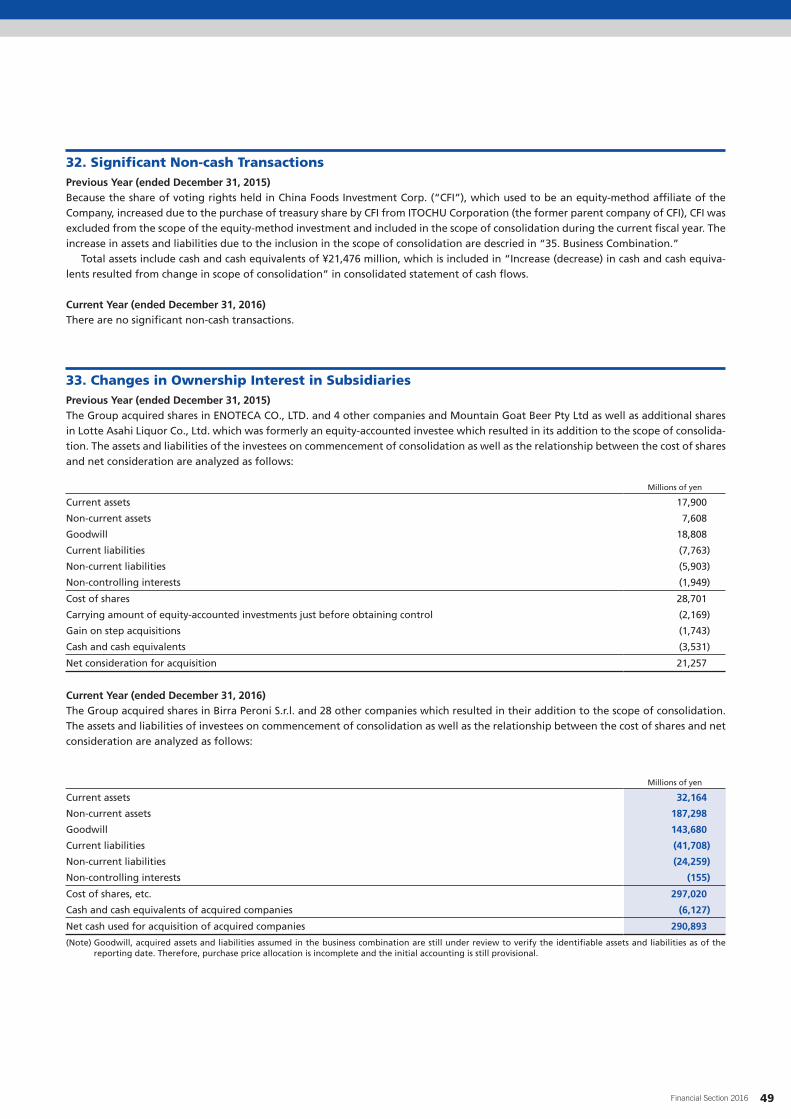
32. Significant Non-cash TransactionsPrevious Year (ended December 31, 2015)Because the share of voting rights held in China Foods Investment Corp. (“CFI”), which used to be an equity-method affiliate of the Company, increased due to the purchase of treasury share by CFI from ITOCHU Corporation (the former parent company of CFI), CFI was excluded from the scope of the equity-method investment and included in the scope of consolidation during the current fiscal year. The increase in assets and liabilities due to the inclusion in the scope of consolidation are descried in “35. Business Combination.”
Total assets include cash and cash equivalents of ¥21,476 million, which is included in “Increase (decrease) in cash and cash equiva-lents resulted from change in scope of consolidation” in consolidated statement of cash flows.
Current Year (ended December 31, 2016)There are no significant non-cash transactions.
33. Changes in Ownership Interest in SubsidiariesPrevious Year (ended December 31, 2015)The Group acquired shares in ENOTECA CO., LTD. and 4 other companies and Mountain Goat Beer Pty Ltd as well as additional shares in Lotte Asahi Liquor Co., Ltd. which was formerly an equity-accounted investee which resulted in its addition to the scope of consolida-tion. The assets and liabilities of the investees on commencement of consolidation as well as the relationship between the cost of shares and net consideration are analyzed as follows:
Millions of yen
Current assets 17,900
Non-current assets 7,608
Goodwill 18,808
Current liabilities (7,763)
Non-current liabilities (5,903)
Non-controlling interests (1,949)
Cost of shares 28,701
Carrying amount of equity-accounted investments just before obtaining control (2,169)
Gain on step acquisitions (1,743)
Cash and cash equivalents (3,531)
Net consideration for acquisition 21,257
Current Year (ended December 31, 2016)The Group acquired shares in Birra Peroni S.r.l. and 28 other companies which resulted in their addition to the scope of consolidation. The assets and liabilities of investees on commencement of consolidation as well as the relationship between the cost of shares and net consideration are analyzed as follows:
Millions of yen
Current assets 32,164
Non-current assets 187,298
Goodwill 143,680
Current liabilities (41,708)
Non-current liabilities (24,259)
Non-controlling interests (155)
Cost of shares, etc. 297,020
Cash and cash equivalents of acquired companies (6,127)
Net cash used for acquisition of acquired companies 290,893
(Note) Goodwill, acquired assets and liabilities assumed in the business combination are still under review to verify the identifiable assets and liabilities as of the reporting date. Therefore, purchase price allocation is incomplete and the initial accounting is still provisional.
49Financial Section 2016
34. Related-Party Transactions(1) Transactions and Outstanding Balances with Related PartiesThere is no material transactions with related parties.
(2) Key Management Personnel CompensationCompensation to the Group’s key management personnel is as follows:
Millions of yen
Previous year (ended December 31, 2015)
Current year (ended December 31, 2016)
Short-term employee benefits 350 465
The Performance-Linked Stock Compensation Plan is newly introduced for Directors excluding Outside Directors in the current year ended December 31, 2016.
In the current year ended December 31, 2016, the Company recognized ¥56 million (estimated amount) as share-based payment expense, but it is not included in the above. Since the Trust had not yet been created, information about the number of points could not be determined.
35. Business Combination(1) Business CombinationPrevious Year (ended December 31, 2015)(i) Outline of the transactiona. Name and business of the acquiree
China Foods Investment Corp.Management of Ting Hsin (Cayman Islands) Holding Corp. and its group companies
b. Purpose of the transactionA change in investment structure in Ting Hsin (Cayman Islands) Holding Corp. resulted in China Foods Investment Corp. (“CFI”) acquir-ing its own shares formerly held by ITOCHU Corporation, which had been the parent company of CFI, on March 3, 2015.
c. Acquisition date of the business combinationMarch 3, 2015
d. Legal form of the business combinationCFI repurchased a sufficient number of its own shares with consideration in cash for the Group to obtain control.
e. Description of obtaining control over the acquiree and proportion of voting rights acquiredThe Company acquired 100.0% of the voting rights, and is thereby considered as the acquirer.— Before the acquisition 25.9%— After the acquisition 100.0%
(ii) Effect on the GroupRevenue and profit generated since the acquisition date is minor. Assuming the business combination was conducted at the beginning of the period, revenue and profit for the period would be ¥1,689,527 million and ¥102,518 million, respectively. The amounts are unaudited by the independent auditor.
50 ASAHI GROUP HOLDINGS, LTD.

(iii) Acquisition-date fair value of assets and liabilities and goodwill
Millions of yen
Cash and cash equivalents 21,476
Trade and other receivables 438
Other 0
Total current assets 21,915
Other financial assets 63,853
Other 0
Total non-current assets 63,853
Total assets 85,769
Total current liabilities (23,147)
Total non-current liabilities (7,387)
Total liabilities (30,535)
Fair value of CFI’s shares held by the Company prior to the business combination 56,662
Goodwill 1,428
As a result of remeasuring the equity interest in CFI held by the Group prior to obtaining control at the acquisition-date fair value, the Group recognized a gain on step acquisition of ¥3,650 million. This gain is presented as “Gain on remeasurements related to business combinations” in the consolidated statement of profit or loss.
Goodwill of ¥1,428 million, which was calculated as the difference between acquisition cost and the fair value of the net asset of CFI, was recognized. However, the Company recorded an impairment loss on the entire amount of the goodwill for the year ended December 31, 2015, since the excess earning power of the acquisition had not been expected in the future.
Current Year (ended December 31, 2016)(i) Outline of the transactiona. Name and business of the acquiree
Company name Business
Birra Peroni S.r.l. Manufacture and sales of beer
Royal Grolsch NV Manufacture and sales of beer
Meantime Brewing Company Ltd. Manufacture and sales of beer
Asahi UK Ltd (formerly Miller Brands (UK) Ltd.) Import and sales of beer
Also another 25 entities that are primarily engaged in manufacturing, sales and distribution of beer
b. Purpose of the transactionThe Group has set out its Long-Term Vision to articulate foresight of the Group and its business in the future. The Group aims at enhance-ment of corporate value under the Medium-Term Management Policy which has been developed to realize the Long-Term Vision. With regard to the Long-Term Vision, the Group as a comprehensive beverage and food business group with the alcohol beverages business at its core, has set a goal to become a domestic industry leader focused on high added value and establish a distinct position as a global player that leverages strengths originating in Japan. In addition, as one of the strategic imperatives under the new Medium-Term Management Policy, the Group envisions strengthening its earning power by positioning the domestic profit base as the cornerstone of earnings and the overseas business as its growth engine. The Company has been working to expand its overseas growth platform, mainly in Asia and Oceania, for some time, and has suc-cessfully created a capable network in Southeast Asia, China and Oceania. In an environment with slower economic growth in emerging countries and further global consolidation, the Company intends to respond to various risks and opportunities and further accelerate its growth by leveraging strengths developed in Japan. As part of these strategies, the Company acquired the Peroni, Grolsch and Meantime brands, as well as the Italian, Dutch and British companies of SABMiller plc that manufacture and distribute these brands. Grolsch and Peroni are two of the best-known premium beer brands in the world with over 400 years and 150 years of history, respectively, and both are well recognized inter alia in Europe. Meantime is a pioneer brand in craft beer in the UK and is rapidly growing in popularity amongst the younger generation in urban areas such as London. Through these acquisitions, the Company aims to expand its growth platform in Europe and become a global player with a distinct position, leveraging the distribution networks of the target businesses to maximize synergies through increasing the presence of its flagship Asahi Super Dry brand.
51Financial Section 2016

c. Acquisition date of the business combinationOctober 11, 2016
d. Legal form of the business combinationThe Group purchased shares with cash consideration.
e. Proportion of voting rights acquired
Company name Proportion of voting rights
Birra Peroni S.r.l. 100%
Royal Grolsch NV 100%
Meantime Brewing Company Ltd. 100%
Asahi UK Ltd (formerly Miller Brands (UK) Ltd.) 100%
Proportion of voting rights in the other 25 entities are mainly 100%.
(ii) Effect on the GroupRevenue and profit generated by Birra Peroni S.r.l. and the other 28 entities since the acquisition date amounted to ¥26,384 million and ¥858 million, respectively. Assuming the business combination was conducted at the beginning of the period, revenue and profit for the period would be ¥1,800,773 million and ¥94,519 million, respectively. The amounts are unaudited by the independent auditor.
(iii) Consideration transferred and its detailsThe consideration transferred was ¥297,020 million, all of which was paid in cash.
(iv) Acquisition-related costsAcquisition-related costs amounted to ¥3,626 million and are included in “Selling, general and administrative expenses.”
(v) Acquired receivablesThe gross contractual amount of trade and other receivables acquired was ¥24,151 million in aggregate, and ¥16,120 million at fair value on the acquisition date.
(vi) Acquisition-date fair value of assets and liabilities, non-controlling interests and goodwill
Millions of yen
Cash and cash equivalents 6,127
Trade and other receivables 16,120
Other 9,916
Total current assets 32,164
Property, plant and equipment 56,613
Intangible assets 123,135
Other 7,550
Total non-current assets 187,298
Total assets 219,463
Trade and other payables (33,829)
Other (7,986)
Total current liabilities (41,815)
Total non-current liabilities (24,153)
Total liabilities (65,968)
Non-controlling interests (155)
Consideration transferred (297,020)
Goodwill 143,680
Non-controlling interests are measured at the proportionate share of the fair value of identifiable net assets in the acquiree.The initial accounting is still provisional because some of the items including the amount of goodwill incurred, assets acquired and
liabilities assumed are still under review and therefore the allocation is incomplete at the end of the period.Goodwill is primarily composed of synergies with the Group’s businesses and excess profitability that are expected to occur from the
acquisition, which do not individually fulfill the criteria for recognition.
52 ASAHI GROUP HOLDINGS, LTD.
(2) Transactions under Common ControlCurrent Year (ended December 31, 2016)The Company resolved to reorganize the domestic Soft Drinks Business and Food Business at the Board of Directors meeting held on June 3, 2015, and implemented the business restructuring on January 1, 2016.
(i) Purpose of the business reorganizationIt was implemented as part of strengthening our domestic businesses, which aims at making decisions more promptly by clarifying the areas of responsibility, responding swiftly to changes in the business environment and maximizing synergies within the businesses.
(ii) Outline of the business reorganizationReorganization of the domestic soft drinks businessa. Name of the entity involved in the transaction
Calpis Co., Ltd.
b. Name and description of businesses involved and legal form of the business combinationCalpis Foods Service Co., Ltd., a wholly owned subsidiary of Calpis Co., Ltd. that engages in the sale of dairy products, acquired the domestic soft drink manufacturing business and the dairy product business, including milk purchasing, of Calpis Co., Ltd. in an absorption-type split. Asahi Calpis Wellness Co., Ltd., a wholly owned subsidiary of the Company, succeeded the functional foods business (mail-order business and functional raw materials) and the animal feed business of Calpis Co., Ltd. in an absorption-type split. After the business transfer above, Calpis Co., Ltd. was absorbed in a merger with Asahi Soft Drinks Co., Ltd. as the surviving company. Calpis Foods Service Co., Ltd. changed its name to Calpis Co., Ltd.
c. Date of the business combinationJanuary 1, 2016
d. Name of the entities after the business combinationAsahi Soft Drinks Co., Ltd.Asahi Calpis Wellness Co., Ltd.Calpis Co., Ltd. (formerly Calpis Foods Service Co., Ltd.)
e. Other items regarding the outline of the business combinationThe Group made the transaction to enhance its business competitiveness by integrating the strengths of each of the entities involved, such as brands, product lines, technologies, sales networks and human resources, aiming to become a company growing in the domestic soft drinks industry with high-quality, customer-oriented product lines.
Reorganization of the domestic food businessa. Name and description of businesses involved and legal form of business combination
Asahi Group Foods, Ltd., a wholly owned subsidiary of the Company, succeeded all the business, excluding the operations relating to the manufacturing and the control of the production management (including the purchase operation of merchandise), of Asahi Food & Healthcare Co., Ltd., Wakodo Co., Ltd. and Amano Jitsugyo Co., Ltd. in an absorption-type split.
b. Date of the business combinationJanuary 1, 2016
c. Name of the company after the business combinationAsahi Group Foods, Ltd.
d. Other items regarding the outline of the business combinationThe reorganization was implemented with the goal of creating a management structure that increases the speed of decision-making and responds more rapidly to change by clearly defining business, as well as maximizing synergies within businesses.
53Financial Section 2016

36. Interest in Other Entities(1) Interest in SubsidiariesSubsidiaries included in the consolidated financial statements are as follows:
Previous Year (ended December 31, 2015)
Name LocationProportion of
ownership interest (%)
Asahi Breweries, Ltd. Sumida-ku, Tokyo 100.00
Masuda Co., Ltd. Kita-ku, Osaka 100.00(100.00)
NADAMAN CO., LTD Shinjuku-ku, Tokyo 51.14(51.14)
The Nikka Whiskey Distilling Co., Ltd. Minato-ku, Tokyo 100.00(100.00)
Sainte Neige Wine Co., Ltd. Yamanashi City, Yamanashi 100.00(100.00)
Satsumatsukasa Shuzo Co., Ltd. Aira City, Kagoshima 85.00(85.00)
ENOTECA CO., LTD. Minato-ku, Tokyo 100.00(100.00)
Asahi Soft Drinks Co., Ltd. Sumida-ku, Tokyo 100.00
Calpis Co., Ltd. Shibuya-ku, Tokyo 100.00
LB Co., Ltd. Hasuda City, Saitama 100.00
Asahi Calpis Beverage Co., Ltd. Taito-ku, Tokyo 100.00(100.00)
Asahi Group Foods, Ltd. Sumida-ku, Tokyo 100.00(100.00)
Asahi Food & Healthcare Co., Ltd. Sumida-ku, Tokyo 100.00
Wakodo Co., Ltd. Chiyoda-ku, Tokyo 100.00
Amano Jitsugyo Co., Ltd. Fukuyama City, Hiroshima 100.00
Asahi Beer (China) Investment Co., Ltd. Shanghai, China 100.00
Yantai Beer Tsingtao Asahi Co., Ltd. Shandong, China 40.00(40.00)
Beijing Beer Asahi Co., Ltd. Beijing, China 90.00
China Foods Investment Corp. Minato-ku, Tokyo 100.00
AI Beverage Holding Co., Ltd. Sumida-ku, Tokyo 100.00
Asahi Holdings (Australia) Pty Ltd Victoria, Australia 100.00
Schweppes Australia Pty Limited Victoria, Australia 100.00
Independent Liquor (NZ) Limited Papakura, New Zealand 100.00(100.00)
Asahi Group Holdings Southeast Asia Pte. Ltd. Singapore 100.00
Permanis Sdn. Bhd. Kuala Lumpur, Malaysia 100.00(100.00)
Etika Dairies Sdn. Bhd. Kuala Lumpur, Malaysia 100.00(100.00)
PT Tirta Sukses Perkasa Jakarta, Indonesia 80.00(80.00)
Asahi Loi Hein Company Limited Yangon, Myanmar 51.00(51.00)
Asahi Logistics Co., Ltd. Minato-ku, Tokyo 100.00
Asahi Professional Management Co., Ltd. Sumida-ku, Tokyo 100.00
Other 92 Subsidiaries — —
(Notes) 1. Percentage in ( ) represents indirect ownership interest out of the total ownership interest noted above. 2. The Group does not own a majority of voting rights in Yantai Beer Tsingtao Asahi Co., Ltd., but it is consolidated because voting rights including voting
rights held by associates of the Group account for a majority and it is judged to be under de facto control.
54 ASAHI GROUP HOLDINGS, LTD.

Current Year (ended December 31, 2016)
Name LocationProportion of
ownership interest (%)
Asahi Breweries, Ltd. Sumida-ku, Tokyo 100.00
Masuda Co., Ltd. Kita-ku, Osaka 100.00(100.00)
NADAMAN CO., LTD Shinjuku-ku, Tokyo 100.00(100.00)
The Nikka Whiskey Distilling Co., Ltd. Minato-ku, Tokyo 100.00(100.00)
Sainte Neige Wine Co., Ltd. Yamanashi City, Yamanashi 100.00(100.00)
Satsumatsukasa Shuzo Co., Ltd. Aira City, Kagoshima 85.00(85.00)
ENOTECA CO., LTD. Minato-ku, Tokyo 100.00(100.00)
Asahi Soft Drinks Co., Ltd. Sumida-ku, Tokyo 100.00
Calpis Co., Ltd. Sumida-ku, Tokyo 100.00
LB Co., Ltd. Hasuda City, Saitama 100.00
Asahi Soft Drink Sales Co., Ltd. Taito-ku, Tokyo 100.00(100.00)
Asahi Group Foods, Ltd. Shibuya-ku, Tokyo 100.00(100.00)
Asahi Food & Healthcare Co., Ltd. Sumida-ku, Tokyo 100.00
Wakodo Co., Ltd. Chiyoda-ku, Tokyo 100.00
Amano Jitsugyo Co., Ltd. Fukuyama City, Hiroshima 100.00
Asahi Beer (China) Investment Co., Ltd. Shanghai, China 100.00
Yantai Beer Tsingtao Asahi Co., Ltd. Shandong, China 40.00(40.00)
Beijing Beer Asahi Co., Ltd. Beijing, China 90.00
China Foods Investment Corp. Minato-ku, Tokyo 100.00
AI Beverage Holding Co., Ltd. Sumida-ku, Tokyo 100.00
Asahi Holdings (Australia) Pty Ltd Victoria, Australia 100.00
Schweppes Australia Pty Limited Victoria, Australia 100.00
Independent Liquor (NZ) Limited Papakura, New Zealand 100.00(100.00)
Asahi Group Holdings Southeast Asia Pte. Ltd. Singapore 100.00
Etika Beverages Sdn. Bhd. Kuala Lumpur, Malaysia 100.00(100.00)
Etika Dairies Sdn. Bhd. Kuala Lumpur, Malaysia 100.00(100.00)
PT Tirta Sukses Perkasa Jakarta, Indonesia 80.00(80.00)
Asahi Loi Hein Company Limited Yangon, Myanmar 51.00(51.00)
Asahi Europe Ltd Woking, United Kingdom 100.00
Asahi Logistics Co., Ltd. Minato-ku, Tokyo 100.00
Asahi Professional Management Co., Ltd. Sumida-ku, Tokyo 100.00
Other 106 Subsidiaries — —
(Notes) 1. Percentage in ( ) represents indirect ownership interest out of the total ownership interest noted above. 2. The Group does not own a majority of voting rights in Yantai Beer Tsingtao Asahi Co., Ltd., but it is consolidated because voting rights including voting
rights held by associates of the Group account for a majority and it is judged to be under de facto control. 3. The company names of Asahi Calpis Beverage Co., Ltd., Calpis Foods Service Co., Ltd and Permanis Sdn. Bhd. were changed to Asahi Soft Drink Sales Co.,
Ltd., Calpis Co., Ltd. and Etika Beverages Sdn. Bhd. respectively, in 2016.
55Financial Section 2016
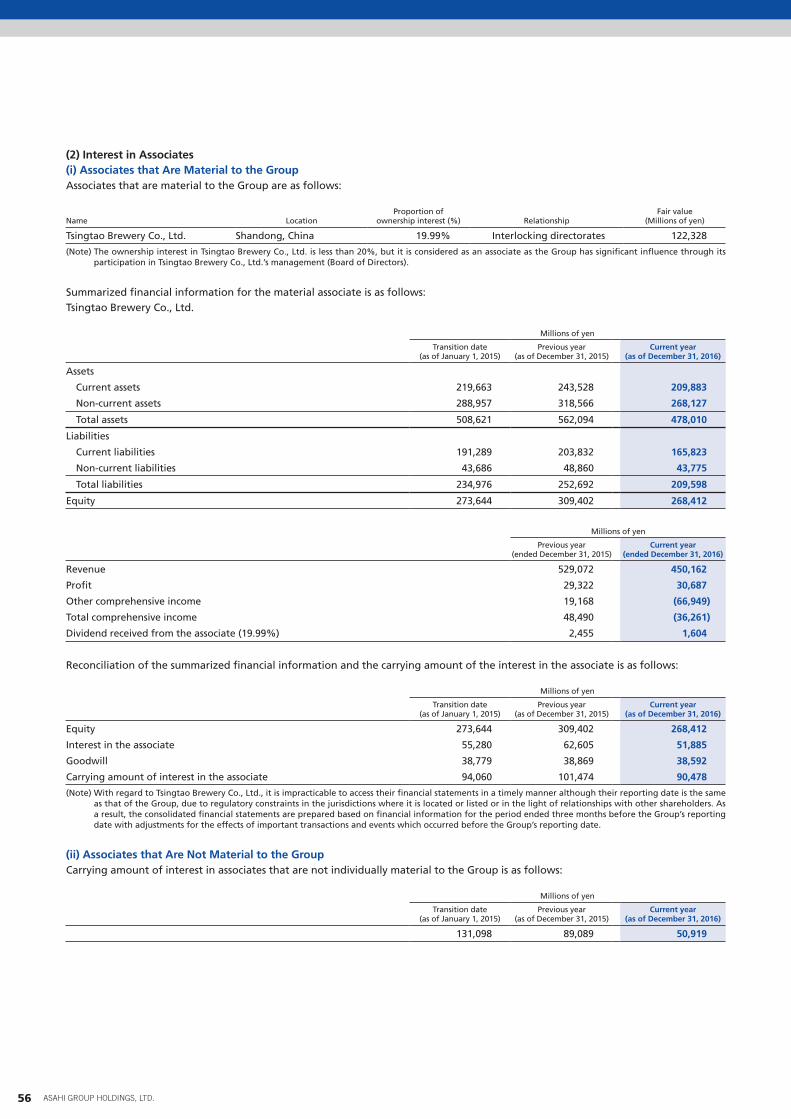
(2) Interest in Associates(i) Associates that Are Material to the GroupAssociates that are material to the Group are as follows:
Name LocationProportion of
ownership interest (%) RelationshipFair value
(Millions of yen)
Tsingtao Brewery Co., Ltd. Shandong, China 19.99% Interlocking directorates 122,328
(Note) The ownership interest in Tsingtao Brewery Co., Ltd. is less than 20%, but it is considered as an associate as the Group has significant influence through its participation in Tsingtao Brewery Co., Ltd.’s management (Board of Directors).
Summarized financial information for the material associate is as follows:Tsingtao Brewery Co., Ltd.
Millions of yen
Transition date (as of January 1, 2015)
Previous year (as of December 31, 2015)
Current year (as of December 31, 2016)
Assets
Current assets 219,663 243,528 209,883
Non-current assets 288,957 318,566 268,127
Total assets 508,621 562,094 478,010
Liabilities
Current liabilities 191,289 203,832 165,823
Non-current liabilities 43,686 48,860 43,775
Total liabilities 234,976 252,692 209,598
Equity 273,644 309,402 268,412
Millions of yen
Previous year (ended December 31, 2015)
Current year (ended December 31, 2016)
Revenue 529,072 450,162
Profit 29,322 30,687
Other comprehensive income 19,168 (66,949)
Total comprehensive income 48,490 (36,261)
Dividend received from the associate (19.99%) 2,455 1,604
Reconciliation of the summarized financial information and the carrying amount of the interest in the associate is as follows:
Millions of yen
Transition date (as of January 1, 2015)
Previous year (as of December 31, 2015)
Current year (as of December 31, 2016)
Equity 273,644 309,402 268,412
Interest in the associate 55,280 62,605 51,885
Goodwill 38,779 38,869 38,592
Carrying amount of interest in the associate 94,060 101,474 90,478
(Note) With regard to Tsingtao Brewery Co., Ltd., it is impracticable to access their financial statements in a timely manner although their reporting date is the same as that of the Group, due to regulatory constraints in the jurisdictions where it is located or listed or in the light of relationships with other shareholders. As a result, the consolidated financial statements are prepared based on financial information for the period ended three months before the Group’s reporting date with adjustments for the effects of important transactions and events which occurred before the Group’s reporting date.
(ii) Associates that Are Not Material to the GroupCarrying amount of interest in associates that are not individually material to the Group is as follows:
Millions of yen
Transition date (as of January 1, 2015)
Previous year (as of December 31, 2015)
Current year (as of December 31, 2016)
131,098 89,089 50,919
56 ASAHI GROUP HOLDINGS, LTD.
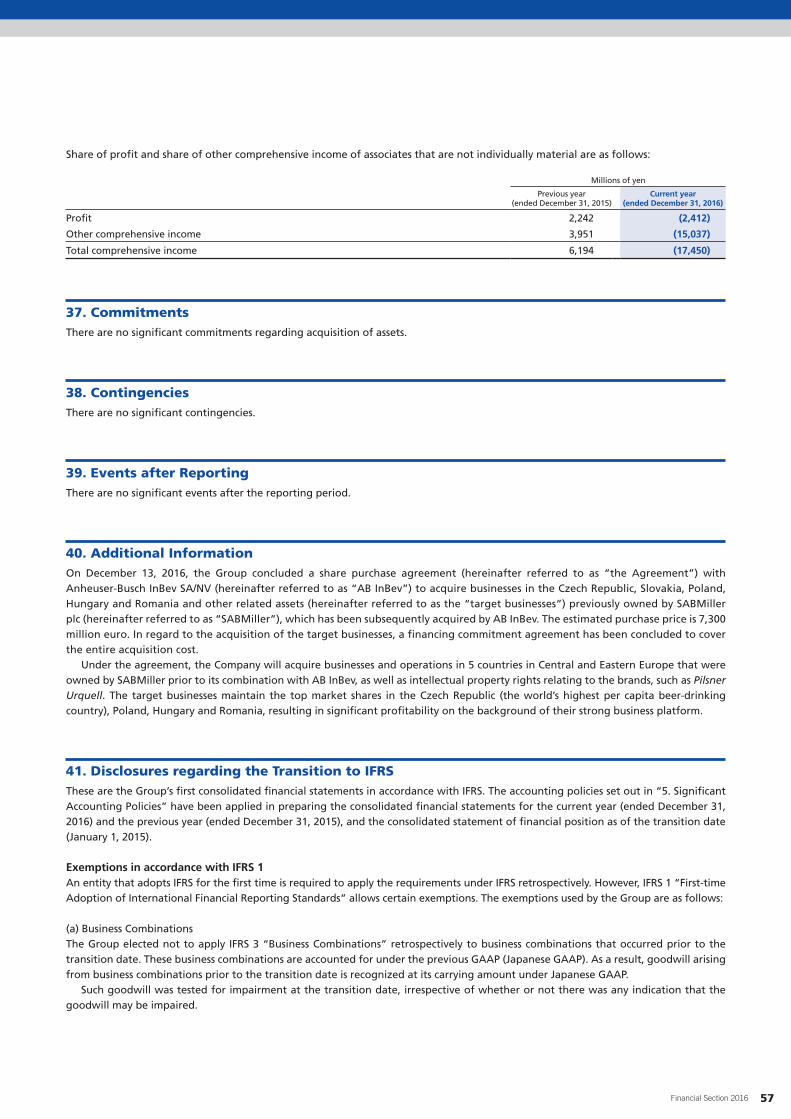
Share of profit and share of other comprehensive income of associates that are not individually material are as follows:
Millions of yen
Previous year (ended December 31, 2015)
Current year (ended December 31, 2016)
Profit 2,242 (2,412)
Other comprehensive income 3,951 (15,037)
Total comprehensive income 6,194 (17,450)
37. CommitmentsThere are no significant commitments regarding acquisition of assets.
38. ContingenciesThere are no significant contingencies.
39. Events after ReportingThere are no significant events after the reporting period.
40. Additional InformationOn December 13, 2016, the Group concluded a share purchase agreement (hereinafter referred to as “the Agreement”) with Anheuser-Busch InBev SA/NV (hereinafter referred to as “AB InBev”) to acquire businesses in the Czech Republic, Slovakia, Poland, Hungary and Romania and other related assets (hereinafter referred to as the “target businesses”) previously owned by SABMiller plc (hereinafter referred to as “SABMiller”), which has been subsequently acquired by AB InBev. The estimated purchase price is 7,300 million euro. In regard to the acquisition of the target businesses, a financing commitment agreement has been concluded to cover the entire acquisition cost.
Under the agreement, the Company will acquire businesses and operations in 5 countries in Central and Eastern Europe that were owned by SABMiller prior to its combination with AB InBev, as well as intellectual property rights relating to the brands, such as Pilsner Urquell. The target businesses maintain the top market shares in the Czech Republic (the world’s highest per capita beer-drinking country), Poland, Hungary and Romania, resulting in significant profitability on the background of their strong business platform.
41. Disclosures regarding the Transition to IFRSThese are the Group’s first consolidated financial statements in accordance with IFRS. The accounting policies set out in “5. Significant Accounting Policies” have been applied in preparing the consolidated financial statements for the current year (ended December 31, 2016) and the previous year (ended December 31, 2015), and the consolidated statement of financial position as of the transition date (January 1, 2015).
Exemptions in accordance with IFRS 1An entity that adopts IFRS for the first time is required to apply the requirements under IFRS retrospectively. However, IFRS 1 “First-time Adoption of International Financial Reporting Standards” allows certain exemptions. The exemptions used by the Group are as follows:
(a) Business CombinationsThe Group elected not to apply IFRS 3 “Business Combinations” retrospectively to business combinations that occurred prior to the transition date. These business combinations are accounted for under the previous GAAP (Japanese GAAP). As a result, goodwill arising from business combinations prior to the transition date is recognized at its carrying amount under Japanese GAAP.
Such goodwill was tested for impairment at the transition date, irrespective of whether or not there was any indication that the goodwill may be impaired.
57Financial Section 2016

(b) Deemed CostThe Group used fair value at the transition date as deemed cost for certain items of property, plant and equipment.
(c) Cumulative Translation Difference on Foreign OperationsThe Group deemed cumulative translation difference on foreign operations to be zero at the transition date.
(d) Share-based PaymentThe Group did not apply IFRS 2 “Share-based Payment” to equity instruments vested prior to the transition date.
(e) Designation of Financial Instruments Recognized prior to the Transition DateClassification under IFRS 9 is based on facts and circumstances as of the transition date, and equity instruments are designated as equity instruments measured at fair value through other comprehensive income.
Reconciliation from Japanese GAAP to IFRSReconciliation that is required to be disclosed on first-time adoption of IFRS is shown in the schedule below. The figures under Japanese GAAP at the transition date reflect effects of application of the “Accounting Standard for Retirement Benefits” (ASBJ Statement No. 26, May 17, 2012), “Guidance on the Accounting Standard for Retirement Benefits” (ASBJ Guidance No. 25, March 26, 2015), “Accounting Standard for Business Combinations” (ASBJ Statement No. 21, September 13, 2013), “Accounting Standard for Consolidated Financial Statements” (ASBJ Statement No. 22, September 13, 2013) and “Accounting Standard for Business Divestitures” (ASBJ Statement No. 7, September 13, 2013).
Reconciliation of Equity as of January 1, 2015 (Transition Date)
Millions of yen
Presentation under Japanese GAAPJapanese
GAAPEffect of transition IFRS Notes Presentation under IFRS
Assets Assets
Current assets Current assets
Cash and deposits 65,064 (2,827) 62,236 (A) Cash and cash equivalents
Notes and accounts receivable—trade 353,704 11,535 365,239 (B) (a) Trade and other receivables
Merchandise and finished goods (including work in progress) 82,117 40,090 122,207 (C) (a) Inventories
Raw materials and supplies 42,431 (42,431) (C)
Deferred tax assets 13,012 (13,012) (D) (b)
10,279 10,279 Income tax receivables
5,299 5,299 (A) (E) Other financial assets
Other 53,042 (34,049) 18,992 (B) Other current assets
Allowance for doubtful accounts (5,529) 5,529 (B)
Total current assets 603,842 (19,587) 584,254 Total current assets
Non-current assets Non-current assets
Property, plant and equipment 605,415 (64,347) 541,067 (c) Property, plant and equipment
Intangible assets
Goodwill 163,936 76,109 240,046 (d) Goodwill and intangible assets
Other intangible assets 99,930 (99,930)
Investments and other assets
Investment securities 375,044 (375,044) (F)
Long-term loans receivable 2,335 (2,335)
Long-term prepaid expenses 12,490 (12,490)
Net defined benefit assets 19,412 — 19,412 Net defined benefit assets
Deferred tax assets 8,470 21,713 30,184 (D) (b) Deferred tax assets
Other non-current assets 16,116 (16,116)
173,364 173,364 (E) Other financial assets
12,590 12,590 Other non-current assets
225,158 225,158 (F)Investments accounted for using equity method
Allowance for doubtful accounts (3,124) 3,124
Total non-current assets 1,300,027 (58,201) 1,241,825 Total non-current assets
Total assets 1,903,869 (77,789) 1,826,080 Total assets
58 ASAHI GROUP HOLDINGS, LTD.

Millions of yen
Presentation under Japanese GAAPJapanese
GAAPEffect of transition IFRS Notes Presentation under IFRS
Liabilities and equity
Liabilities Liabilities
Current liabilities Current liabilities
Notes and accounts payable—trade 130,402 144,554 274,956 (G) Trade and other payables
Short-term loans payable 173,938 106,918 280,856 Bonds and borrowings
Current portion of long-term loans payable 10,941 (10,941)
Current portion of bonds payable 20,000 (20,000)
Lease obligations 8,486 (8,486)
Accrued alcohol tax 110,361 (110,361)
Consumption tax payable 26,617 (26,617)
Income taxes payable 27,396 33 27,430 Income tax payables
Accounts payable—other 73,097 (73,097) (G)
Accrued expenses 71,137 (71,137) (G)
Deposits received 18,255 (18,255)
Commercial paper 76,000 (76,000)
Provision for bonuses 4,685 (4,685)
Other 6,054 (6,054)
28,066 28,066 (E) Other financial liabilities
147,420 147,420 Other current liabilities
Total current liabilities 757,374 1,356 758,731 Total current liabilities
Non-current liabilities Non-current liabilities
Bonds payable 113,000 40,435 153,435 Bonds and borrowings
Long-term loans payable 40,846 (40,846)
Lease obligations 14,810 (14,810)
Net defined benefit liability 23,872 201 24,073 Net defined benefit liabilities
Provision for directors’ retirement benefits 302 (302)
Asset retirement obligations 430 (430)
Deferred tax liabilities 48,611 (7,443) 41,168 (D) (b) Deferred tax liabilities
Other 38,198 (38,198)
55,753 55,753 (E) Other financial liabilities
2,964 2,964 Other non-current liabilities
Total non-current liabilities 280,071 (2,676) 277,395 Total non-current liabilities
Total liabilities 1,037,446 (1,319) 1,036,126 Total liabilities
Net assets Equity
Shareholders’ equity
Capital stock 182,531 — 182,531 Issued capital
Capital surplus 120,895 — 120,895 Share premium
Retained earnings 470,061 23,068 493,129 (f) Retained earnings
Treasury shares (58,176) — (58,176) Treasury shares
Total shareholders’ equity 715,311 (715,311)
Accumulated other comprehensive income 135,693 (99,538) 36,154 (e) Other components of equity
774,534 774,534Total equity attributable to owners of parent
Minority interests 15,419 0 15,419 Non-controlling interests
Total net assets 866,423 (76,469) 789,953 Total equity
Total liabilities and net assets 1,903,869 (77,789) 1,826,080 Total liabilities and equity
59Financial Section 2016
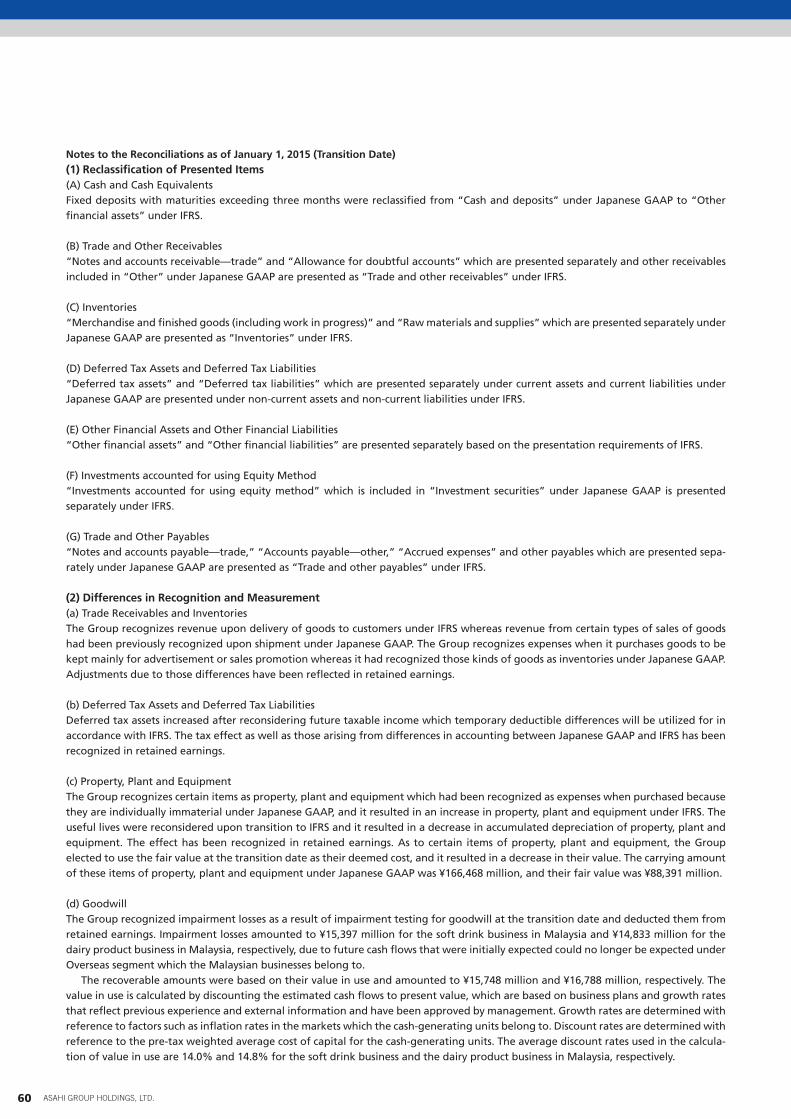
Notes to the Reconciliations as of January 1, 2015 (Transition Date)(1) Reclassification of Presented Items(A) Cash and Cash EquivalentsFixed deposits with maturities exceeding three months were reclassified from “Cash and deposits” under Japanese GAAP to “Other financial assets” under IFRS.
(B) Trade and Other Receivables“Notes and accounts receivable—trade” and “Allowance for doubtful accounts” which are presented separately and other receivables included in “Other” under Japanese GAAP are presented as “Trade and other receivables” under IFRS.
(C) Inventories“Merchandise and finished goods (including work in progress)” and “Raw materials and supplies” which are presented separately under Japanese GAAP are presented as “Inventories” under IFRS.
(D) Deferred Tax Assets and Deferred Tax Liabilities“Deferred tax assets” and “Deferred tax liabilities” which are presented separately under current assets and current liabilities under Japanese GAAP are presented under non-current assets and non-current liabilities under IFRS.
(E) Other Financial Assets and Other Financial Liabilities“Other financial assets” and “Other financial liabilities” are presented separately based on the presentation requirements of IFRS.
(F) Investments accounted for using Equity Method“Investments accounted for using equity method” which is included in “Investment securities” under Japanese GAAP is presented separately under IFRS.
(G) Trade and Other Payables“Notes and accounts payable—trade,” “Accounts payable—other,” “Accrued expenses” and other payables which are presented sepa-rately under Japanese GAAP are presented as “Trade and other payables” under IFRS.
(2) Differences in Recognition and Measurement(a) Trade Receivables and InventoriesThe Group recognizes revenue upon delivery of goods to customers under IFRS whereas revenue from certain types of sales of goods had been previously recognized upon shipment under Japanese GAAP. The Group recognizes expenses when it purchases goods to be kept mainly for advertisement or sales promotion whereas it had recognized those kinds of goods as inventories under Japanese GAAP. Adjustments due to those differences have been reflected in retained earnings.
(b) Deferred Tax Assets and Deferred Tax LiabilitiesDeferred tax assets increased after reconsidering future taxable income which temporary deductible differences will be utilized for in accordance with IFRS. The tax effect as well as those arising from differences in accounting between Japanese GAAP and IFRS has been recognized in retained earnings.
(c) Property, Plant and EquipmentThe Group recognizes certain items as property, plant and equipment which had been recognized as expenses when purchased because they are individually immaterial under Japanese GAAP, and it resulted in an increase in property, plant and equipment under IFRS. The useful lives were reconsidered upon transition to IFRS and it resulted in a decrease in accumulated depreciation of property, plant and equipment. The effect has been recognized in retained earnings. As to certain items of property, plant and equipment, the Group elected to use the fair value at the transition date as their deemed cost, and it resulted in a decrease in their value. The carrying amount of these items of property, plant and equipment under Japanese GAAP was ¥166,468 million, and their fair value was ¥88,391 million.
(d) GoodwillThe Group recognized impairment losses as a result of impairment testing for goodwill at the transition date and deducted them from retained earnings. Impairment losses amounted to ¥15,397 million for the soft drink business in Malaysia and ¥14,833 million for the dairy product business in Malaysia, respectively, due to future cash flows that were initially expected could no longer be expected under Overseas segment which the Malaysian businesses belong to.
The recoverable amounts were based on their value in use and amounted to ¥15,748 million and ¥16,788 million, respectively. The value in use is calculated by discounting the estimated cash flows to present value, which are based on business plans and growth rates that reflect previous experience and external information and have been approved by management. Growth rates are determined with reference to factors such as inflation rates in the markets which the cash-generating units belong to. Discount rates are determined with reference to the pre-tax weighted average cost of capital for the cash-generating units. The average discount rates used in the calcula-tion of value in use are 14.0% and 14.8% for the soft drink business and the dairy product business in Malaysia, respectively.
60 ASAHI GROUP HOLDINGS, LTD.
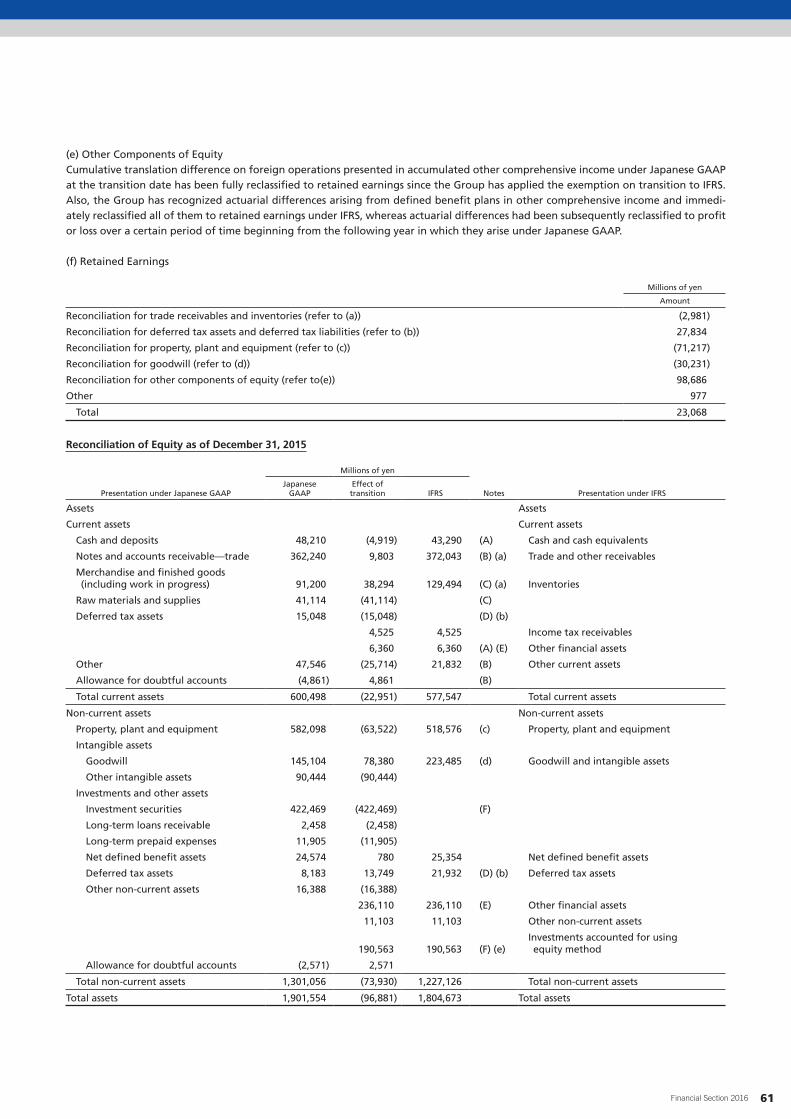
(e) Other Components of EquityCumulative translation difference on foreign operations presented in accumulated other comprehensive income under Japanese GAAP at the transition date has been fully reclassified to retained earnings since the Group has applied the exemption on transition to IFRS. Also, the Group has recognized actuarial differences arising from defined benefit plans in other comprehensive income and immedi-ately reclassified all of them to retained earnings under IFRS, whereas actuarial differences had been subsequently reclassified to profit or loss over a certain period of time beginning from the following year in which they arise under Japanese GAAP.
(f) Retained Earnings
Millions of yen
Amount
Reconciliation for trade receivables and inventories (refer to (a)) (2,981)
Reconciliation for deferred tax assets and deferred tax liabilities (refer to (b)) 27,834
Reconciliation for property, plant and equipment (refer to (c)) (71,217)
Reconciliation for goodwill (refer to (d)) (30,231)
Reconciliation for other components of equity (refer to(e)) 98,686
Other 977
Total 23,068
Reconciliation of Equity as of December 31, 2015
Millions of yen
Presentation under Japanese GAAPJapanese
GAAPEffect of transition IFRS Notes Presentation under IFRS
Assets Assets
Current assets Current assets
Cash and deposits 48,210 (4,919) 43,290 (A) Cash and cash equivalents
Notes and accounts receivable—trade 362,240 9,803 372,043 (B) (a) Trade and other receivables
Merchandise and finished goods (including work in progress) 91,200 38,294 129,494 (C) (a) Inventories
Raw materials and supplies 41,114 (41,114) (C)
Deferred tax assets 15,048 (15,048) (D) (b)
4,525 4,525 Income tax receivables
6,360 6,360 (A) (E) Other financial assets
Other 47,546 (25,714) 21,832 (B) Other current assets
Allowance for doubtful accounts (4,861) 4,861 (B)
Total current assets 600,498 (22,951) 577,547 Total current assets
Non-current assets Non-current assets
Property, plant and equipment 582,098 (63,522) 518,576 (c) Property, plant and equipment
Intangible assets
Goodwill 145,104 78,380 223,485 (d) Goodwill and intangible assets
Other intangible assets 90,444 (90,444)
Investments and other assets
Investment securities 422,469 (422,469) (F)
Long-term loans receivable 2,458 (2,458)
Long-term prepaid expenses 11,905 (11,905)
Net defined benefit assets 24,574 780 25,354 Net defined benefit assets
Deferred tax assets 8,183 13,749 21,932 (D) (b) Deferred tax assets
Other non-current assets 16,388 (16,388)
236,110 236,110 (E) Other financial assets
11,103 11,103 Other non-current assets
190,563 190,563 (F) (e)Investments accounted for using equity method
Allowance for doubtful accounts (2,571) 2,571
Total non-current assets 1,301,056 (73,930) 1,227,126 Total non-current assets
Total assets 1,901,554 (96,881) 1,804,673 Total assets
61Financial Section 2016

Millions of yen
Presentation under Japanese GAAPJapanese
GAAPEffect of transition IFRS Notes Presentation under IFRS
Liabilities and equity
Liabilities Liabilities
Current liabilities Current liabilities
Notes and accounts payable—trade 126,800 146,292 273,092 (G) Trade and other payables
Short-term loans payable 148,750 100,459 249,209 Bonds and borrowings
Current portion of long-term loans payable 7,489 (7,489)
Current portion of bonds payable 30,000 (30,000)
Lease obligations 7,567 (7,567)
Accrued alcohol tax 110,044 (110,044)
Accrued consumption taxes 17,857 (17,857)
Income taxes payable 23,460 16 23,476 Income tax payables
Accounts payable—other 69,521 (69,521) (G)
Accrued expenses 76,655 (76,655) (G)
Deposits received 18,076 (18,076)
Commercial paper 63,000 (63,000)
Provision for bonuses 4,917 (4,917)
Other 11,053 (11,053)
27,038 27,038 (E) Other financial liabilities
143,770 143,770 Other current liabilities
Total current liabilities 715,193 1,395 716,588 Total current liabilities
Non-current liabilities Non-current liabilities
Bonds payable 118,000 47,231 165,231 Bonds and borrowings
Long-term loans payable 47,690 (47,690)
Lease obligations 11,590 (11,590)
Net defined benefit liability 23,377 13 23,391 Net defined benefit liabilities
Provision for directors’ retirement benefits 237 (237)
Asset retirement obligations 441 (441)
Deferred tax liabilities 54,445 (17,199) 37,245 (D) (b) Deferred tax liabilities
Other 38,748 (38,748)
55,746 55,746 (E) Other financial liabilities
2,787 2,787 Other non-current liabilities
Total non-current liabilities 294,531 (10,129) 284,402 Total non-current liabilities
Total liabilities 1,009,725 (8,734) 1,000,991 Total liabilities
Net assets Equity
Shareholders’ equity
Capital stock 182,531 — 182,531 Issued capital
Capital surplus 120,524 — 120,524 Share premium
Retained earnings 524,859 24,225 549,084 (g) Retained earnings
Treasury shares (77,377) — (77,377) Treasury shares
Total shareholders’ equity 750,537 (750,537)
Accumulated other comprehensive income 127,134 (112,477) 14,657 (f) Other components of equity
789,420 789,420Total equity attributable to owners of parent
Minority interests 14,157 104 14,261 Non-controlling interests
Total net assets 891,829 (88,147) 803,682 Total equity
Total liabilities and net assets 1,901,554 (96,881) 1,804,673 Total liabilities and equity
62 ASAHI GROUP HOLDINGS, LTD.

Notes to the Reconciliations as of December 31, 2015(1) Reclassification of Presented Items(A) Cash and Cash EquivalentsFixed deposits with maturities exceeding three months were reclassified from “Cash and deposits” under Japanese GAAP to “Other financial assets” under IFRS.
(B) Trade and Other Receivables“Notes and accounts payable—trade” and “Allowance for doubtful accounts” which are presented separately and other receivables included in “Other” under Japanese GAAP are presented as “Trade and other receivables” under IFRS.
(C) Inventories“Merchandise and finished goods (including work in progress)” and “Raw materials and supplies” which are presented separately under Japanese GAAP are presented as “Inventories” under IFRS.
(D) Deferred Tax Assets and Deferred Tax Liabilities“Deferred tax assets” and “Deferred tax liabilities” which are presented separately under current assets and current liabilities under Japanese GAAP are presented under non-current assets and non-current liabilities under IFRS.
(E) Other Financial Assets and Other Financial Liabilities“Other financial assets” and “Other financial liabilities” are presented separately based on the presentation requirements of IFRS.
(F) Investments accounted for using Equity Method“Investments accounted for using equity method” which is included in “Investment securities” under Japanese GAAP is presented separately under IFRS.
(G) Trade and Other Payables“Notes and accounts payable—trade,” “Accounts payable—other,” “Accrued expenses” and other payables which are presented sepa-rately under Japanese GAAP are presented as “Trade and other payables” under IFRS.
(2) Differences in Recognition and Measurement(a) Trade Receivables and InventoriesThe Group recognizes revenue upon delivery of goods to customers under IFRS whereas revenue from certain types of sales of goods had been previously recognized upon shipment under Japanese GAAP. The Group recognizes expenses when it purchases goods to be kept mainly for advertisement or sales promotion whereas it had recognized those kinds of goods as inventories under Japanese GAAP. Adjustments due to those differences have been reflected in retained earnings.
(b) Deferred Tax Assets and Deferred Tax LiabilitiesDeferred tax assets increased after reconsidering future taxable income which temporary deductible differences will be utilized for in accordance with IFRS. The tax effect as well as those arising from differences in accounting between Japanese GAAP and IFRS has been recognized in retained earnings.
(c) Property, Plant and EquipmentThe Group recognizes certain items as property, plant and equipment which had been recognized as expenses when purchased because they are individually immaterial under Japanese GAAP, and it resulted in an increase in property, plant and equipment under IFRS. The useful lives were reconsidered upon transition to IFRS and it resulted in a decrease in accumulated depreciation of property, plant and equipment. The effect has been recognized in retained earnings. As to certain items of property, plant and equipment, the Group elected to use the fair value at the transition date as their deemed cost, and it resulted in a decrease in their value. The carrying amount of these items of property, plant and equipment under Japanese GAAP was ¥166,468 million, and their fair value was ¥88,391 million.
(d) GoodwillThe Group recognized impairment losses as a result of impairment testing for goodwill at the transition date and deducted them from retained earnings. Impairment losses amounted to ¥30,231 million for a business in the Overseas segment which related good-will had been allocated to, due to future cash flows that were initially expected could no longer be expected (Please refer to (2) (d) of “Notes to the Reconciliations as of January 1, 2015 (Transition Date)” for details). Goodwill had been amortized over the estimated useful lives under Japanese GAAP, but will no longer be amortized under IFRS on and after the transition date. The effect has been recognized in retained earnings.
63Financial Section 2016
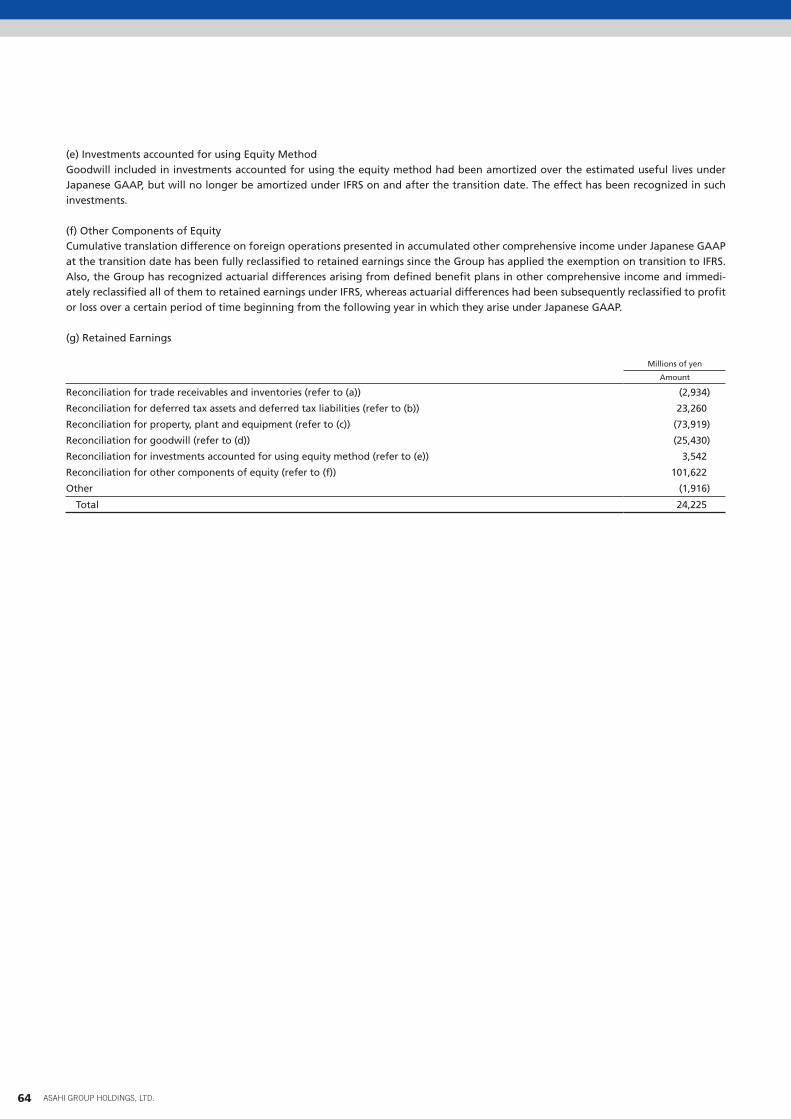
(e) Investments accounted for using Equity MethodGoodwill included in investments accounted for using the equity method had been amortized over the estimated useful lives under Japanese GAAP, but will no longer be amortized under IFRS on and after the transition date. The effect has been recognized in such investments.
(f) Other Components of EquityCumulative translation difference on foreign operations presented in accumulated other comprehensive income under Japanese GAAP at the transition date has been fully reclassified to retained earnings since the Group has applied the exemption on transition to IFRS. Also, the Group has recognized actuarial differences arising from defined benefit plans in other comprehensive income and immedi-ately reclassified all of them to retained earnings under IFRS, whereas actuarial differences had been subsequently reclassified to profit or loss over a certain period of time beginning from the following year in which they arise under Japanese GAAP.
(g) Retained Earnings
Millions of yen
Amount
Reconciliation for trade receivables and inventories (refer to (a)) (2,934)
Reconciliation for deferred tax assets and deferred tax liabilities (refer to (b)) 23,260
Reconciliation for property, plant and equipment (refer to (c)) (73,919)
Reconciliation for goodwill (refer to (d)) (25,430)
Reconciliation for investments accounted for using equity method (refer to (e)) 3,542
Reconciliation for other components of equity (refer to (f)) 101,622
Other (1,916)
Total 24,225
64 ASAHI GROUP HOLDINGS, LTD.
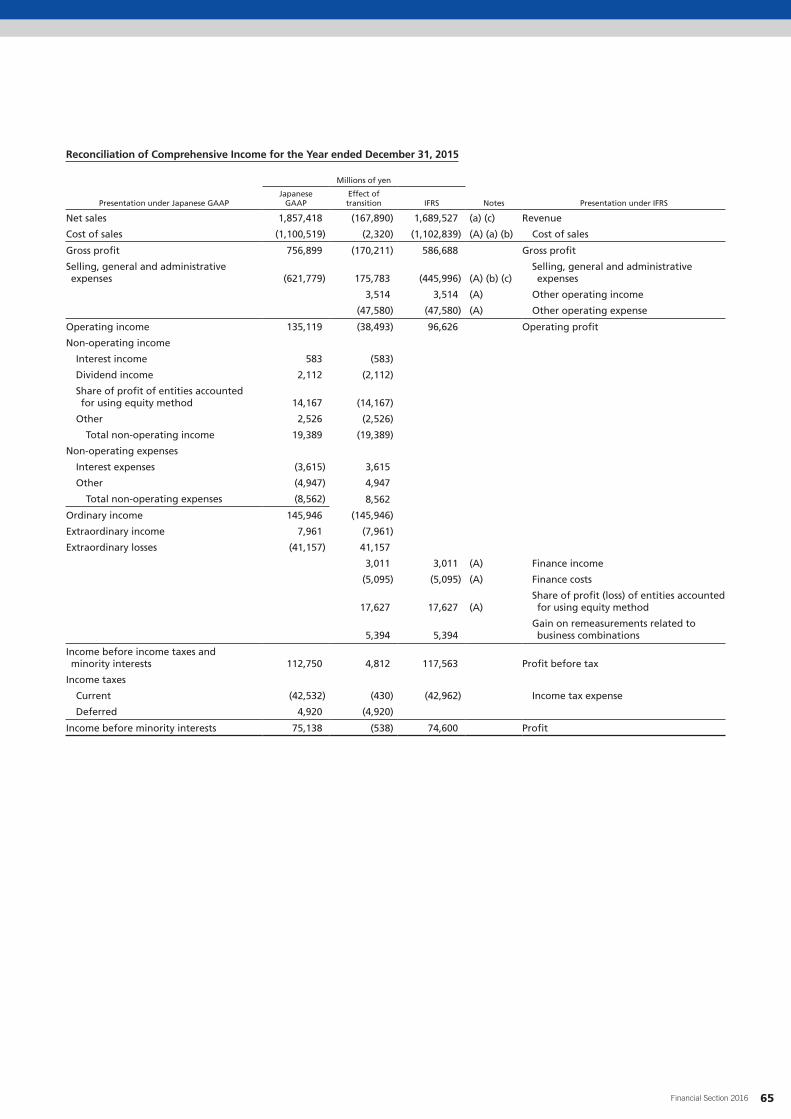
Reconciliation of Comprehensive Income for the Year ended December 31, 2015
Millions of yen
Presentation under Japanese GAAPJapanese
GAAPEffect of transition IFRS Notes Presentation under IFRS
Net sales 1,857,418 (167,890) 1,689,527 (a) (c) Revenue
Cost of sales (1,100,519) (2,320) (1,102,839) (A) (a) (b) Cost of sales
Gross profit 756,899 (170,211) 586,688 Gross profit
Selling, general and administrative expenses (621,779) 175,783 (445,996) (A) (b) (c)
Selling, general and administrative expenses
3,514 3,514 (A) Other operating income
(47,580) (47,580) (A) Other operating expense
Operating income 135,119 (38,493) 96,626 Operating profit
Non-operating income
Interest income 583 (583)
Dividend income 2,112 (2,112)
Share of profit of entities accounted for using equity method 14,167 (14,167)
Other 2,526 (2,526)
Total non-operating income 19,389 (19,389)
Non-operating expenses
Interest expenses (3,615) 3,615
Other (4,947) 4,947
Total non-operating expenses (8,562) 8,562
Ordinary income 145,946 (145,946)
Extraordinary income 7,961 (7,961)
Extraordinary losses (41,157) 41,157
3,011 3,011 (A) Finance income
(5,095) (5,095) (A) Finance costs
17,627 17,627 (A)Share of profit (loss) of entities accounted for using equity method
5,394 5,394Gain on remeasurements related to business combinations
Income before income taxes and minority interests 112,750 4,812 117,563 Profit before tax
Income taxes
Current (42,532) (430) (42,962) Income tax expense
Deferred 4,920 (4,920)
Income before minority interests 75,138 (538) 74,600 Profit
65Financial Section 2016

Millions of yen
Presentation under Japanese GAAPJapanese
GAAPEffect of transition IFRS Notes Presentation under IFRS
Other comprehensive income Other comprehensive income
Items that will not be reclassified to profit or loss
Valuation difference on available-for-sale securities 16,950 (18,023) (1,073)
Changes in fair value of financial instruments measured at fair value through other comprehensive income
Remeasurements of defined benefit plans, net of tax 618 2,374 2,992 (b) Remeasurements of defined benefit plans
Share of other comprehensive income of affiliated companies accounted for using equity method 7,382 (7,386) (4)
Share of other comprehensive income of entities accounted for using equity method
Items that might be reclassified to profit or loss
Deferred gains or losses on hedges 136 (334) (197) Cash flow hedges
Foreign currency translation adjustment (35,093) 5,334 (29,759) Translation difference on foreign operations
6,532 6,532Share of other comprehensive income of entities accounted for using equity method
Total other comprehensive income (10,005) (11,503) (21,509) Total other comprehensive income
Comprehensive income 65,133 (12,042) 53,090 Total comprehensive income
Notes to the Reconciliations of Comprehensive Income for the Year ended December 31, 2015(1) Reclassification of Presented Items(A) Cost of sales, other operating income (expense), selling, general and administrative expenses, share of profit (loss) of entities
accounted for using equity method, finance income, and finance costsItems presented as non-operating income, non-operating expenses, extraordinary income, and extraordinary losses under Japanese GAAP are presented as finance income and finance costs for finance-related items, and as cost of sales, other operating income (expense), selling, general and administrative expenses, and share of profit (loss) of entities accounted for using equity method for the other items under IFRS.
(2) Differences in Recognition and Measurement(a) Revenue and cost of salesNet sales are recognized primarily upon shipment under Japanese GAAP, whereas revenue is recognized primarily upon delivery of goods. In addition, certain rebates and some other items were presented in selling, general and administrative expenses under Japanese GAAP, whereas they are deducted from revenue under IFRS.
(b) Cost of sales, selling, general and administrative expenses, and remeasurements of defined benefit plansUnder Japanese GAAP, actuarial gains and losses on defined benefit plans are amortized over a certain period of time, beginning from the year following the year they are incurred. However, all actuarial gains and losses are recognized in other comprehensive income and immediately reclassified to retained earnings under IFRS.
(c) Selling, general and administrative expensesUnder Japanese GAAP, certain rebates and some other items were presented as selling, general and administrative expenses, whereas they are deducted from revenue under IFRS. In addition, goodwill was amortized over the estimated useful lives under Japanese GAAP, but is not amortized under IFRS.
Reconciliation of Cash Flows for the Year ended December 31, 2015There are no material differences between the consolidated statements of cash flows that were disclosed in accordance with Japanese GAAP and that in accordance with IFRS.
66 ASAHI GROUP HOLDINGS, LTD.