notes from the ambassador bank vault november 7, … from the ambassador bank vault november 7, 2017...
TRANSCRIPT
Notes from the Ambassador Bank Vault November 7, 2017
Mergers & Acquisitions: A Look at New York State Ain’t No Change in the Weather
Summary
Bank consolidation in New York should gradually pick up given the number of community banks that may lack the necessary scale to successfully overcome industry-wide earnings, regulatory, and technological challenges. Along with succession issues, all of these hurdles may be overcome through mergers. We also believe that the dysfunctional political environment may delay (or prevent) many pro-growth/business policies from being enacted and will convince some bankers that selling out may be the better option. Credit quality generally remains very good and should not impede conso lidation activity for the foreseeable future. We believe social factors, rather than financial or market forces , have prevented deal activity from accelerating in 2017. Since the onset of the Great Recession, bank mergers have been rare in both Upstate New York and the greater New York City metropolitan area. We define Upstate New York (“Upstate”) as the region north and west of New York City and Long Island. Upstate is more rural and includes the cities of Albany, Buffalo, Rochester, and Syracuse. New York City, and its associated markets, contrast vividly (culturally, demographically, economically, and politically) from Upstate. Thus, most of New York’s financial institutions cater to either Upstate or New York City. Generalizations, however, are meant to be broken; and exceptions include Bank of America Corporation, JPMorgan Chase & Co., and M&T Bank Corp. which operate across the state. Although banks are sold and not bought, the common desire to improve funding supports merger activity. Some institutions will find it more economical to gain customers via acquisitions versus organic growth. Banks typically must grow to increase earnings and dividends per share. Many Upstate markets have improved recently, but are mostly slower growing; and to consistently grow organically more than 3-4% is difficult. Potential buyers, in general, need to run efficiently to obtain high trading multiples in order to effect deals. Although there are relatively few larger in-state banks with the capacity to acquire, several out-of-state banks appear to be willing buyers. Potential buyers, moreover, generally possess strong currencies that can justify higher acquisition premiums, although anecdotal evidence suggests there is a pricing disparity between the value that potential sellers expect to receive and that which buyers are willing to pay. Merger of equals often make financial sense, but social factors have historically limited these transactions. Deals, however, are likely to be smaller in size - there are fewer mid-sized banks and smaller banks have more reasons to exit due primarily to the lack of economies of scale necessary to overcome earnings challenges. Since the start of 2008, there have been 37 merger transactions with New York sellers. Only 10 deals were announced since January 1, 2015, with the larger ones being the purchases of Long Island-based Astoria Financial by Sterling Bancorp on October 2, 2017, and Buffalo-based First Niagara by KeyCorp on July 29, 2016.
Rick Weiss Matt Resch Rob Pachence Eric Tesche Michael Rasmussen 610.724.7133 610.351.1633 610.351.1633 610.351.1633 610.351.1633 [email protected] [email protected] [email protected] [email protected] [email protected]

2
Highlights New York has 129 regulated depository institutions, of which 63 are publicly-traded banks and thrifts.
Excluding money center banks, 21 companies have assets greater than $1 billion. The top five banking institutions in the Empire State combine for 66% of the state’s deposit market share. JPMorgan Chase leads with 38% of the total deposit market share.
As we go to press, there were 211 bank and thrift deals announced nationally (only 3 involved New York-based sellers) since January 1, 2017. There were 206 deals announced nationally over the same period, last year and two involved sellers based in New York.
Although the pace of bank consolidation has remained steady, deal prices are significantly higher in 2017 due to the stronger currencies of potential buyers. The median price-to-tangible book value was 164.5% in 2017 compared with 132.7% for all of 2016.
On a national basis, the core deposit premium (at announcement) was 8.4% for the 10 months ending October 31, 2017, vs. 4.4% and 5.6% for the years ending December 31, 2016, and 2105, respectively. Core deposit premiums have increased, but are far below core deposit premiums that acquirers paid 10 years ago (median premiums for 2006 were 19.6% and 16.4% for banks and thrifts, respectively).
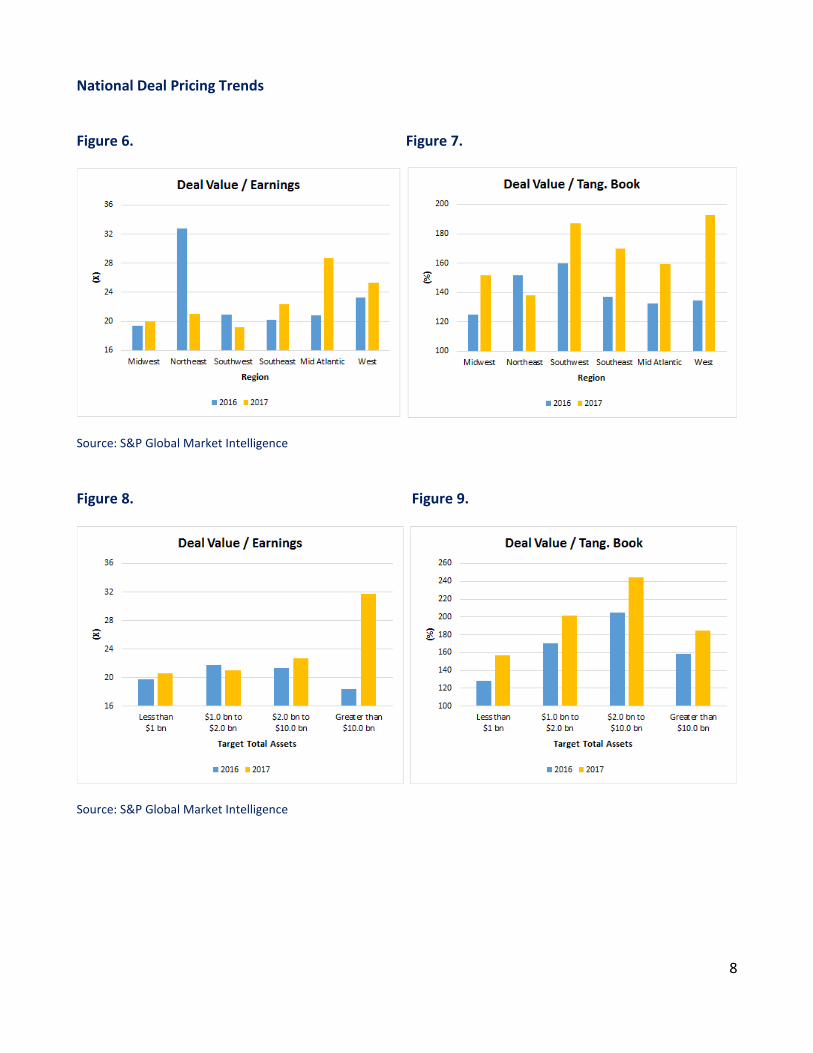
Banks with total assets below $1 billion or so typically receive lower acquisition premiums compared with larger banks. That said, smaller banks with strong core deposits and/or are located in attractive markets can expect to receive outsized deal premiums. Acquisition prices have increased for banks of all sizes in 2017. Please see Figures 6, 7, 8, and 9.
The acquisition of Astoria Financial by Sterling Bancorp (completed October 2) represents the largest deal with a New York seller in 2017.
On the flip side, De Witt-based Community Bank System completed its acquisition of Vermont-based Merchants Bancshares in a cash and stock deal on May 12, 2017. The deal value was about $345 million.
Future deals involving New York State sellers should be smaller in size as many banks have assets less than $2 billion and bigger in-state banks appear to be interested buyers, rather than sellers. Among New York’s publicly-traded banks and thrifts, 10 have total assets between $2 billion and $10 billion; and are generally well-capitalized, profitable, and trade at healthy multiples.
New York’s smaller community banks largely avoided lasting damage from the Great Recession. Many of these banks, moreover, are accustomed to operating in slower-growing markets and have generally satisfied shareholders (primarily retail) via acceptable returns on equity along with steady dividends.
Based on anecdotal evidence, business conditions across Upstate markets are as good as they have been in many years. Economic improvements are due in part to more support by the New York State government.
Companies with stronger currencies are typically the more active acquirers. Among the larger in-state institutions, the more logical buyers of New York State’s community banks appear to be Community Bank System, M&T Bank Corp., NBT Bancorp, Inc.; Sterling Bancorp, and Tompkins Financial Corporation.

3
M&T recently announced a renewed interest in pursuing an acquisition in its existing footprint or in contiguous markets. Given that total assets are approximately $120 billion, it is logical to assume M&T would be more interested in a bigger deal.
Among the larger out-of-state institutions, the more logical buyers of Upstate banks include Berkshire Hills Bancorp and Northwest Bancshares. BankUnited, Inc., Peoples United, Provident Financial Services, and Webster Financial Corp. appear to be more interested buyers of institutions based in the Greater New York City metropolitan area. Investors Bancorp, Inc. appears to be sidelined due to regulatory issues.
Bank and thrift merger premiums should be generous due to the stronger currencies of potential buyers. It remains to be seen if acquirers will be more disciplined than in previous M&A cycles.
Depending upon the deal price, acquiring core deposits may be preferable vs. organic growth. This
becomes even more vital in a rising interest rate environment as core deposits become more valued.
Rightly or wrongly, bank stock investors are paying more attention to tangible book value dilution and earn-
back periods. Analysts and investors generally prefer earn-back periods of five years or less, although market sentiment does vary.
Despite more ability and willingness on the part of buyers to make acquisitions, consolidation activity could be restrained by managements’ desire to remain independent for social and other reasons, rather than strictly adhering to the discipline of maximizing shareholder value. Mergers of equals often make sense financially but rarely occur due to social factors. The difficulty of forming a de novo bank probably restricts deal activity, as sellers have one less career path option.
Institutions with significant commercial real estate loan concentrations face more regulatory scrutiny. We believe this issue has factored into the strategic planning process of a number of institutions.
Improved asset quality continued through the September 2017 quarter, which should increase confidence
among acquirers that they are not buying “problems”. Banks that have superior asset quality or at least exhibit signs of improving credit are more desirable targets.
On an individual basis, banks are sold and not bought; and not necessarily for pure economic reasons. On an aggregate basis, however, it appears that major changes in the overall economy and regulatory environment have a more significant impact on bank merger activity.
4
Table of Contents
Summary ................................................................................................................................................... 1
Highlights .................................................................................................................................................. 2
Recent New York Deals ............................................................................................................................. 5
Valuation Summary .................................................................................................................................. 6
Investment Thesis ..................................................................................................................................... 9
New York Market Demographics ............................................................................................................ 12
Appendix A: New York Bank & Thrift Highlights ..................................................................................... 15
Appendix B: Deposit Market Share by County ........................................................................................ 17

5
Recent New York Deals Figure 1: Recent Bank Deals
Price/ Price/ Core
Deal Tangible LTM Deposit
Completion Value Book Earnings Premium
Buyer/Target Name Status Date* ($MM) (%) (X) (%)
Private investor - Ying Li/ Global Bank Pending 6/13/2017 NA NA NA NA
People's United Financial, Inc./ Suffolk Bancorp Completion 4/1/2017 402.7 198.5 21.4 11.8
Norwood Financial Corp./ Delaware Bancshares, Inc. Completion 7/31/2016 15.2 114.5 25.7 0.7
KeyCorp/ First Niagara Financial Group, Inc. Completion 7/29/2016 4,171.8 173.7 19.3 NA
Preferred Bank/ United International Bank Completion 11/20/2015 22.1 109.3 50.8 2.1
Cathay General Bancorp/ Asia Bancshares, Inc. Completion 7/31/2015 126.0 167.4 23.8 17.1
Sterling Bancorp/ Hudson Valley Holding Corp. Completion 6/30/2015 538.2 188.4 NM 9.4
Bridge Bancorp, Inc./ Community National Bank Completion 6/19/2015 141.3 184.6 31.3 9.5
Bank of the Ozarks, Inc./ Intervest Bancshares Corporation Completion 2/10/2015 228.5 110.6 13.7 2.8
Salisbury Bancorp, Inc./ Riverside Bank Completion 12/5/2014 27.3 108.8 15.1 1.4
Bridge Bancorp, Inc./ FNBNY Bancorp, Inc. Completion 2/14/2014 5.4 40.6 NM -5.3
Provident New York Bancorp/ Sterling Bancorp Completion 10/31/2013 343.1 167.9 17.1 8.1
Hana Financial Group Inc./ BNB Financial Services Corporation Completion 8/30/2013 11.3 53.1 NM -7.9
NBT Bancorp Inc./ Alliance Financial Corporation** Completion 3/8/2013 230.7 212.1 19.1 12.4
Provident New York Bancorp/ Gotham Bank of New York Completion 8/10/2012 40.5 128.5 16.8 4.1
Modern Capital Partners L.P./ Madison National Bancorp Inc. Completion 4/2/2012 33.8 111.3 NM 2.2
BankUnited, Inc./ Herald National Bank Completion 2/29/2012 70.0 183.2 NM 7.9
Valley National Bancorp/ State Bancorp, Inc. Completion 1/1/2012 230.1 189.9 23.7 9.7
Bridge Bancorp, Inc./ Hamptons State Bank Completion 5/27/2011 6.3 136.2 40.6 4.4
Community Bank System, Inc./ Wilber Corporation Completion 4/8/2011 101.8 140.6 13.4 4.6
Chemung Financial Corporation/ Fort Orange Financial Corp. Completion 4/8/2011 28.8 129.7 26.3 3.6
People's United Financial, Inc./ Smithtown Bancorp, Inc. Completion 11/30/2010 60.1 50.8 NM -4.0
Millbrook Bank System, Inc./ SNB Bancorp, Incorporated Completion 10/1/2010 6.0 186.1 NM 8.0
Investor group/ Community Bank of Orange, National Association Completion 10/6/2008 NA NA NM NA
U.S. Bancorp/ Mellon 1st Business Bank, NA Completion 6/2/2008 NA NA NA NA
Deals announced through November 1, 2017 *Announcement date is listed for pending deals **Buyer advised by Ambassador Financial Group Source: S&P Global Market Intelligence
6
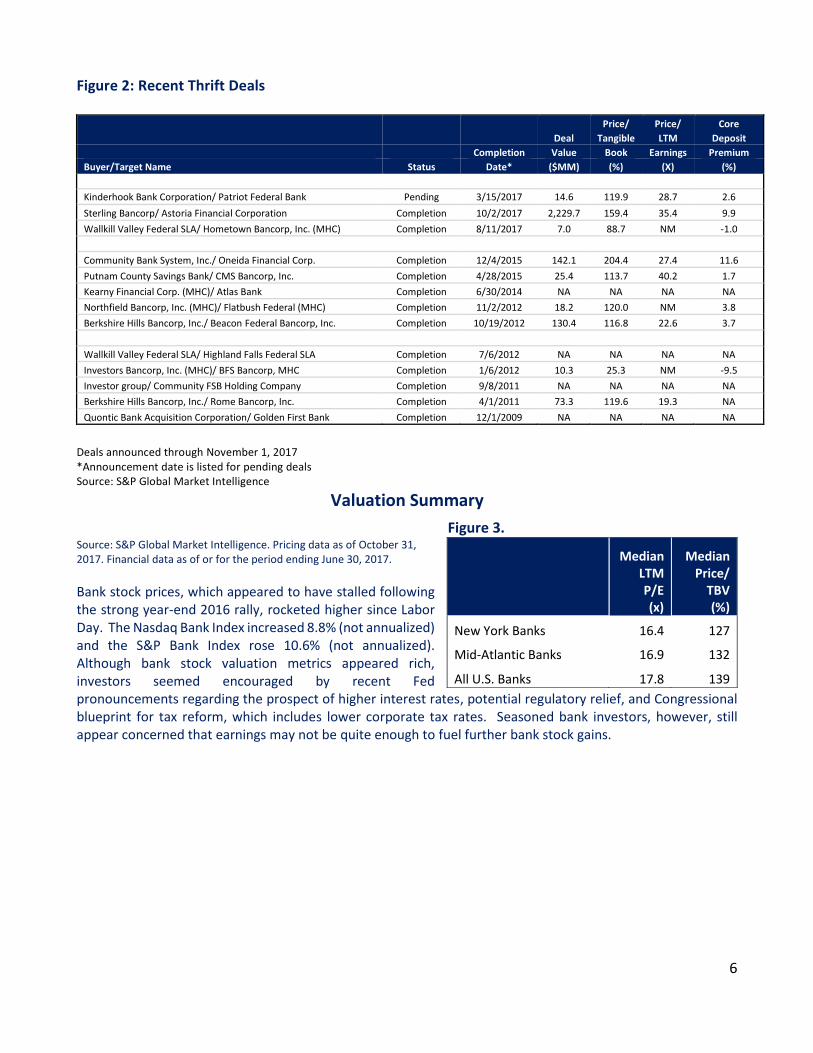
Figure 2: Recent Thrift Deals
Price/ Price/ Core
Deal Tangible LTM Deposit
Completion Value Book Earnings Premium
Buyer/Target Name Status Date* ($MM) (%) (X) (%)
Kinderhook Bank Corporation/ Patriot Federal Bank Pending 3/15/2017 14.6 119.9 28.7 2.6
Sterling Bancorp/ Astoria Financial Corporation Completion 10/2/2017 2,229.7 159.4 35.4 9.9
Wallkill Valley Federal SLA/ Hometown Bancorp, Inc. (MHC) Completion 8/11/2017 7.0 88.7 NM -1.0
Community Bank System, Inc./ Oneida Financial Corp. Completion 12/4/2015 142.1 204.4 27.4 11.6
Putnam County Savings Bank/ CMS Bancorp, Inc. Completion 4/28/2015 25.4 113.7 40.2 1.7
Kearny Financial Corp. (MHC)/ Atlas Bank Completion 6/30/2014 NA NA NA NA
Northfield Bancorp, Inc. (MHC)/ Flatbush Federal (MHC) Completion 11/2/2012 18.2 120.0 NM 3.8
Berkshire Hills Bancorp, Inc./ Beacon Federal Bancorp, Inc. Completion 10/19/2012 130.4 116.8 22.6 3.7
Wallkill Valley Federal SLA/ Highland Falls Federal SLA Completion 7/6/2012 NA NA NA NA
Investors Bancorp, Inc. (MHC)/ BFS Bancorp, MHC Completion 1/6/2012 10.3 25.3 NM -9.5
Investor group/ Community FSB Holding Company Completion 9/8/2011 NA NA NA NA
Berkshire Hills Bancorp, Inc./ Rome Bancorp, Inc. Completion 4/1/2011 73.3 119.6 19.3 NA
Quontic Bank Acquisition Corporation/ Golden First Bank Completion 12/1/2009 NA NA NA NA
Deals announced through November 1, 2017 *Announcement date is listed for pending deals Source: S&P Global Market Intelligence
Valuation Summary
Figure 3. Source: S&P Global Market Intelligence. Pricing data as of October 31, 2017. Financial data as of or for the period ending June 30, 2017.
Bank stock prices, which appeared to have stalled following the strong year-end 2016 rally, rocketed higher since Labor Day. The Nasdaq Bank Index increased 8.8% (not annualized) and the S&P Bank Index rose 10.6% (not annualized). Although bank stock valuation metrics appeared rich, investors seemed encouraged by recent Fed pronouncements regarding the prospect of higher interest rates, potential regulatory relief, and Congressional blueprint for tax reform, which includes lower corporate tax rates. Seasoned bank investors, however, still appear concerned that earnings may not be quite enough to fuel further bank stock gains.
Median
LTM P/E (x)
Median Price/
TBV (%)
New York Banks 16.4 127
Mid-Atlantic Banks 16.9 132
All U.S. Banks 17.8 139

7
Figure 4.
Includes all publicly traded U.S. banks Source: S&P Global Market Intelligence
Figure 5.
Includes all publicly traded U.S. thrifts Source: S&P Global Market Intelligence
0
50
100
150
200
250
300
0
5
10
15
20
25
30
35
20
00
20
01
20
02
20
03
20
04
20
05
20
06
20
07
20
08
20
09
20
10
20
11
20
12
20
13
20
14
20
15
20
16
Q3
20
17
Pri
ce t
o T
angi
ble
Bo
ok
Val
ue
(%
)
Pri
ce t
o L
TM E
PS
(x)
Median Bank Trading Multiples
Price/LTM EPS Deal: Price/LTM EPS
Price/TBV Deal: Price/TBV
0
50
100
150
200
250
300
0
5
10
15
20
25
30
35
20
00
20
01
20
02
20
03
20
04
20
05
20
06
20
07
20
08
20
09
20
10
20
11
20
12
20
13
20
14
20
15
20
16
Q3
20
17
Pri
ce t
o T
angi
ble
Bo
ok
Val
ue
(%
)
Pri
ce t
o L
TM E
PS
(x)
Median Thrift Trading Multiples
Price/LTM EPS Deal: Price/LTM EPS
Price/TBV Deal: Price/TBV
8
National Deal Pricing Trends
Figure 6. Figure 7.
Source: S&P Global Market Intelligence
Figure 8. Figure 9.
Source: S&P Global Market Intelligence

9
Investment Thesis New York Appears Ready for Moderate Bank Consolidation
New York State merger and acquisition activity will probably occur selectively - based upon strategic needs and situational opportunities - rather than in a wave of deals caused by macro operating or regulatory concerns. Recent examples of “one-off” deals include the sale of Suffolk Bancorp to People’s Financial that was due in large part to commercial real estate loan (“CRE”) concentration issues. The sale of Astoria Financial to Sterling Bancorp followed the termination of Astoria’s agreement with New York Community. Astoria was under pressure by its institutional shareholder base. The underlying reason behind First Niagara’s sale to KeyCorp was the poor shareholder returns due to earnings disappointments and ill-advised acquisitions. Merger activity has been steady across the nation, but has lagged in New York State despite several mid-sized community banks with the financial wherewithal and managerial talent to accomplish successful acquisitions. Because banks are sold and not bought, social factors explain why many community banks favor independence even though strict adherence to maximizing shareholder value suggests that selling is the preferable option. Smaller companies, in particular, face earnings issues and ever-increasing regulatory demands, but management and board teams show much resiliency to cope with these challenges. Market expectations geared up in 2017, although we suspect there is still a pricing disparity among sellers’ expectations and buyers’ ability to pay market premiums without incurring significant earnings dilution. In the meantime, bank valuations appear pricey based strictly on fundamentals. Smaller banks, particularly those located in less attractive markets, are less likely to find willing suitors at the “right price” should independence no longer be considered the best strategic option. There have been approximately 8,000 bank mergers (excluding government-assisted) since 1990 – over 4,100 banks were sold between 1990 and 2000. There were also roughly 2,000 bank failures in the United States since 1990. As a result, the number of banks has declined from approximately 15,000 in the mid-1980s to roughly 5,400 today. On a national basis, there were 211 bank and thrift deals thus far in 2017, compared with 246 and 279 deals for the 12 months ending December 31, 2016 and 2015, respectively. New York fits in with our macro-thesis that the banking industry needs consolidation in order to alleviate irrational pricing decisions and achieve economies of scale. We also believe deals will occur mainly in the New York City metropolitan markets where buyers have a better chance of accelerating earnings growth, although franchises located in slower-growing markets can be desirable because of their core deposits. Increased CRE loan concentration has attracted more regulatory scrutiny. Bank regulators, including The Office of the Comptroller of the Currency (“OCC”), the Board of Governors of the Federal Reserve System (“Fed”), and the Federal Deposit Insurance Corporation (“FDIC”) have greater concerns regarding low capitalization rates and fast-appreciating property values. These agencies also noted that CRE loan underwriting standards have eased and certain risk management practices at some institutions that cause concern include a greater number of underwriting policy exceptions and insufficient monitoring of market conditions. The agencies specified supervisory criteria that they intend to focus on to reduce portfolio risk: (1) total construction, land development and other land loans representing 100% or more of total risk-based capital; (2) total CRE loans representing 300% or more of total risk-based capital; and (3) if the outstanding balance of the institution’s CRE and/or construction loan portfolio increased 50% or more during the prior 36 months.
10
Institutions with outsized CRE loan portfolios may expect regulators to require more detailed plans to identify, measure, and monitor CRE concentrations; raise underwriting standards; slow growth; and/or to raise capital. We believe that some management teams will prefer to sell the institution instead. Anecdotal evidence suggests some New York institutions are slowing growth and/or tightening underwriting standards as a result. Despite more widespread shareholder activism, consolidation activity could be restrained by managements’ desire to remain independent for social and other reasons, rather than strictly adhering to the discipline of maximizing shareholder value. Considerations for potential sellers include the flattening yield curve, ongoing technology and cyber-security costs, regulatory demands, succession planning, edgy shareholder activists, and attractive deal premiums. Examples of recent New York deals are shown below.
On October 2, 2017, Sterling Bancorp, an experienced acquirer, completed its acquisition of Astoria
Financial. Astoria, which had total assets of $14 billion and 88 branches, had previously terminated its merger agreement with Westbury-based New York Community Bancorp. At completion, the deal value was $2.2 billion and Astoria shareholders received 0.8750 shares of Sterling common stock for each share of Astoria stock. The transaction was valued at 154% of Astoria’s tangible book value and 37.2 times trailing 12-month earnings. The core deposit premium was 8.7%.
On April 1, 2017, People’s United Financial, which is headquartered in Bridgeport, CT, completed its
acquisition of Long-Island-based Suffolk Bancorp. At completion, the deal was valued at approximately $487 million and the consideration was all-stock. The transaction was valued at approximately 226% of tangible book value and 22.1 times trailing 12-month earnings. The core deposit premium was 16.1%.
On March 15, 2017, Kinderhook, NY-based, Kinderhook Bank Corp. agreed to acquire Canajoharie-based
Patriot Federal Bank in an all-stock deal valued at approximately $14.6 million. Patriot shareholders will receive 0.300 shares of Kinderhook stock for each share of Patriot Federal stock. The pending transaction was valued at 120% and 20.2 times Patriot’s tangible book value and trailing 12-month earnings, respectively. The tangible core deposit premium was 2.0%. The transaction received shareholder approval on August 29, 2017. Patriot has total assets of $145.0 million.
KeyCorp acquired First Niagara Financial Group, Inc. on July 29, 2016, which greatly impacted the Upstate
banking environment. Announced on October 30, 2015, the aggregate deal value was $4.2 billion and the consideration was stock and cash. First Niagara was headquartered in Buffalo, and had total assets of approximately $39.4 billion. First Niagara also had a meaningful presence in Connecticut and Pennsylvania. At completion, the deal was priced at 147% of tangible book value and 20.9x trailing 12-month earnings.
Due to Office of the Comptroller (“OCC”) regulations that preclude a federally-chartered thrift from being acquired for a three year period following its initial mutual to stock conversion, thrifts that converted to stock form in 2014 become eligible to be taken over in 2017. These conversion regulations are generally followed by the FDIC for state-chartered institutions. According to SNL Financial, on a national basis, 42 of the 92 thrifts that completed second-step conversions between 2009 and 2013 have either been acquired or entered into merger agreements. Standard conversion activity in New York has been light in recent years, which is probably another reason for the small number of merger transactions in the Empire State.
Pathfinder Bancorp, Inc. Pathfinder is headquartered in Oswego and has total assets of approximately
$875 million. The company completed its second step offering in October 2014, and generated proceeds

11
around $26 million. Pathfinder has a tangible equity capital ratio around 6.6% and trades at approximately
115% of tangible book value.
Sunnyside Bancorp, Inc. Sunnyside, based in Irvington, is a relatively small institution with total assets of
approximately $97.0 million. The company completed its mutual to stock conversion in July 2013, and
raised approximately $8 million. Sunnyside has a tangible equity capital ratio of approximately 13.2% and
trades around 100% of tangible book value.
Other Recent Conversions: Headquartered in Fairport, FSB Bancorp, Inc., completed its second step in July
2016; and trades around 101% of tangible book value. As of September 30, 2017, total assets were $304.6
million and the tangible equity capital ratio was 10.3%. On April 17, 2017, PCSB Financial Corporation
completed its mutual-to-stock conversion and began trading on the NASDAQ Capital Market under the
symbol “PCSB”. The stock trades at approximately 127% of tangible book value and the tangible equity
capital ratio was 19.6%.

12
New York Market Demographics Figure 10
Source: S&P Global Market Intelligence
New York has the third largest economy in the United States, ranking behind only Texas and California. The
population of the state totals approximately 19.9 million individuals; and approximately 12.7 million people
reside in densely populated New York City and adjacent counties, including Long Island. The median 2017
household income of the state is $66,400, vs. the national median of $61,000. Household incomes across New
York State vary considerably however. As aforementioned, only a few of the larger banks headquartered in
New York operate on a state-wide basis whereas the vast majority of banks conduct business in selected
market/business niches. As of September 30, 2017, the unemployment rate in New York was 4.9%, compared
with the national rate of 4.2%.
74
43
30
21
2 2
11
1612
6
1 00
10
20
30
40
50
60
70
80
PA NY NJ MD DE DC
Mid-Atlantic Publicly Traded Banks & Thrifts by State
Banks Thrifts
13
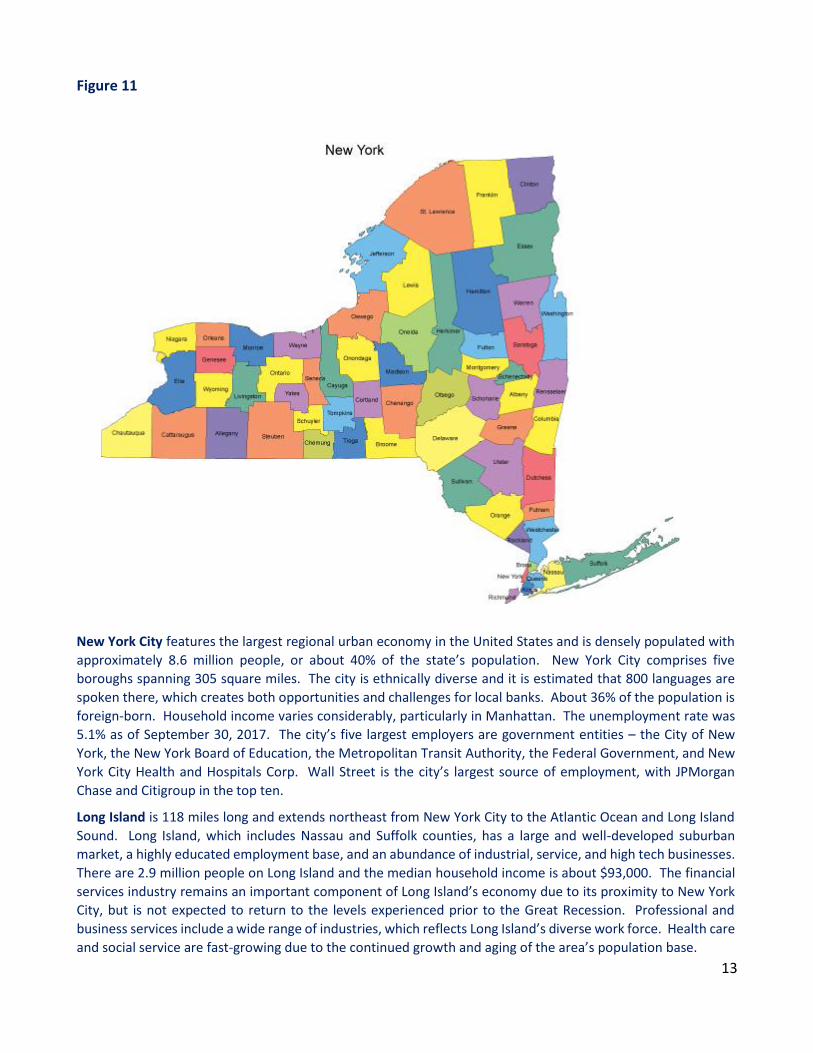
Figure 11
New York City features the largest regional urban economy in the United States and is densely populated with
approximately 8.6 million people, or about 40% of the state’s population. New York City comprises five
boroughs spanning 305 square miles. The city is ethnically diverse and it is estimated that 800 languages are
spoken there, which creates both opportunities and challenges for local banks. About 36% of the population is
foreign-born. Household income varies considerably, particularly in Manhattan. The unemployment rate was
5.1% as of September 30, 2017. The city’s five largest employers are government entities – the City of New
York, the New York Board of Education, the Metropolitan Transit Authority, the Federal Government, and New
York City Health and Hospitals Corp. Wall Street is the city’s largest source of employment, with JPMorgan
Chase and Citigroup in the top ten.
Long Island is 118 miles long and extends northeast from New York City to the Atlantic Ocean and Long Island
Sound. Long Island, which includes Nassau and Suffolk counties, has a large and well-developed suburban
market, a highly educated employment base, and an abundance of industrial, service, and high tech businesses.
There are 2.9 million people on Long Island and the median household income is about $93,000. The financial
services industry remains an important component of Long Island’s economy due to its proximity to New York
City, but is not expected to return to the levels experienced prior to the Great Recession. Professional and
business services include a wide range of industries, which reflects Long Island’s diverse work force. Health care
and social service are fast-growing due to the continued growth and aging of the area’s population base.
14
Buffalo, which borders Canada near Niagara Falls, is New York’s second largest city and the county seat of Erie
County. There are approximately 925,000 people in Erie County and the household income is $53,400. The
larger employers in Erie County are the State of New York, the Federal Government, Kaleida Health, SUNY at
Buffalo, and Catholic Health Services. The top private employers include Employer Services Corp., Tops Markets
LLC, Wegmans Food Markets, Inc., and Geico. The unemployment rate in the Buffalo-Niagara Falls Metropolitan
Statistical Area (“MSA”) was 5.2% in August 2017.
Rochester is located in Monroe County, which home to 750,000 people. The median household income is
approximately $59,000. Monroe County is projected to experience 1.2% population growth and 8.0% median
household income growth over the next five years (not annualized). The area’s major employers include The
University of Rochester, Wegmans Food Markets, Inc., Rochester General Health System, and Xerox. The
unemployment rate in the Rochester MSA was 4.9% in August 2017.
Syracuse is the county sea of Onondaga County, which is located near the center of New York State. Onondaga
County has a population of 465,000 people and the median household income is $62,800. Education and
healthcare are the major sources of employment in the Syracuse region. Included among the area’s colleges
are Syracuse University, LeMoyne College, and the State University of New York’s Upstate Medical University.
The unemployment rate in the Syracuse MSA was 4.8% in August 2017.
Albany, which is the state’s capital, has a population of approximately 310,000 individuals and a median
household income of about $61,500. State and local government account for about 25% of Albany’s total
employment. Due to the proximity to places of higher learning centers and economic initiatives, high tech
industries are replacing manufacturing as a key source of jobs. Major manufacturing is represented by national
companies, including General Electric, with divisions located in Albany County. The unemployment rate in the
Albany-Schenectady area was only 4.2% in August 2017.
Important Disclosure: Ambassador Financial Group does and seeks to do business with companies included in this report. As a result, readers should be aware that the firm may have a conflict of interest that could affect the objectivity of the report. Information contained herein is provided for informational purposes only, is not a solicitation to sell or offer to buy, and is obtained from sources believed to be reliable. We do not guarantee its accuracy or completeness. Opinions expressed reflect that of the author and are subject to change without notice. Ambassador, its officers/directors/shareholders/ employees and affiliates will not be held liable for use of this information other than for informational purposes. Ambassador, its officers/directors/shareholders/employees/affiliates and family members, may make investments in a company/security mentioned herein. Ambassador may perform/seek to perform investment banking or other services for entities mentioned herein. Prices and availability are subject to change. Additional information on securities mentioned herein is available upon request.
15
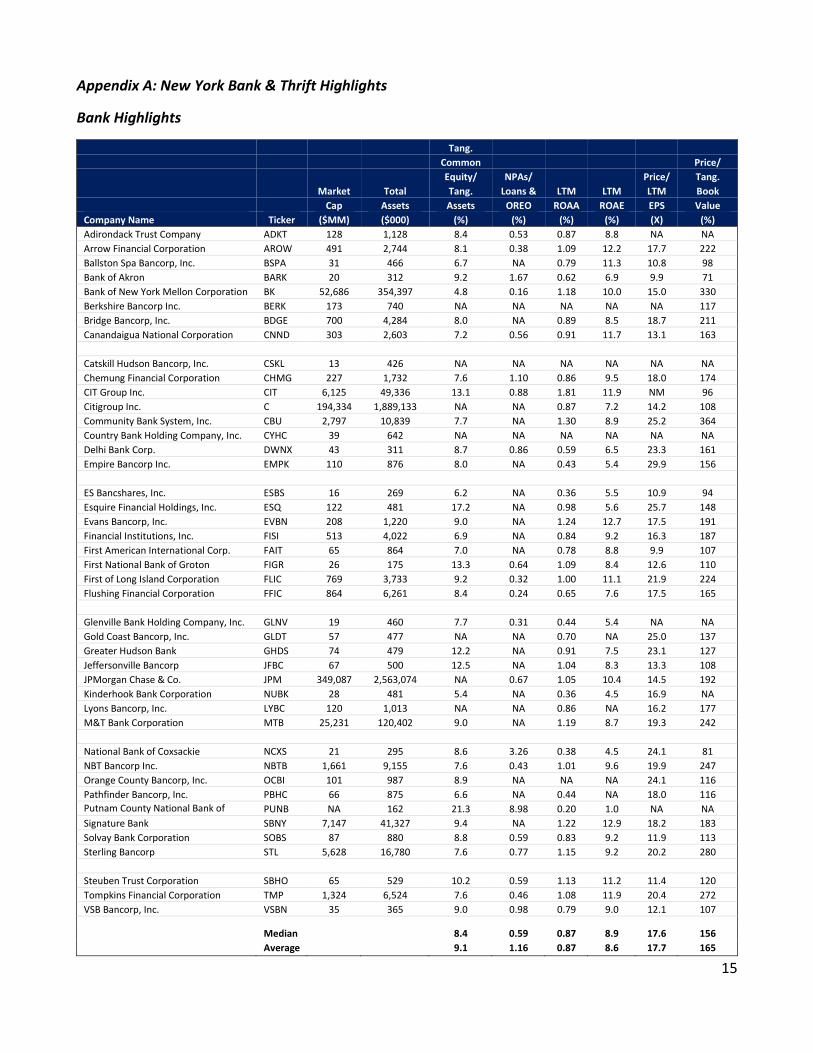
Appendix A: New York Bank & Thrift Highlights
Bank Highlights
Tang.
Common Price/
Equity/ NPAs/ Price/ Tang.
Market Total Tang. Loans & LTM LTM LTM Book
Cap Assets Assets OREO ROAA ROAE EPS Value
Company Name Ticker ($MM) ($000) (%) (%) (%) (%) (X) (%)
Adirondack Trust Company ADKT 128 1,128 8.4 0.53 0.87 8.8 NA NA
Arrow Financial Corporation AROW 491 2,744 8.1 0.38 1.09 12.2 17.7 222
Ballston Spa Bancorp, Inc. BSPA 31 466 6.7 NA 0.79 11.3 10.8 98
Bank of Akron BARK 20 312 9.2 1.67 0.62 6.9 9.9 71
Bank of New York Mellon Corporation BK 52,686 354,397 4.8 0.16 1.18 10.0 15.0 330
Berkshire Bancorp Inc. BERK 173 740 NA NA NA NA NA 117
Bridge Bancorp, Inc. BDGE 700 4,284 8.0 NA 0.89 8.5 18.7 211
Canandaigua National Corporation CNND 303 2,603 7.2 0.56 0.91 11.7 13.1 163
Catskill Hudson Bancorp, Inc. CSKL 13 426 NA NA NA NA NA NA
Chemung Financial Corporation CHMG 227 1,732 7.6 1.10 0.86 9.5 18.0 174
CIT Group Inc. CIT 6,125 49,336 13.1 0.88 1.81 11.9 NM 96
Citigroup Inc. C 194,334 1,889,133 NA NA 0.87 7.2 14.2 108
Community Bank System, Inc. CBU 2,797 10,839 7.7 NA 1.30 8.9 25.2 364
Country Bank Holding Company, Inc. CYHC 39 642 NA NA NA NA NA NA
Delhi Bank Corp. DWNX 43 311 8.7 0.86 0.59 6.5 23.3 161
Empire Bancorp Inc. EMPK 110 876 8.0 NA 0.43 5.4 29.9 156
ES Bancshares, Inc. ESBS 16 269 6.2 NA 0.36 5.5 10.9 94
Esquire Financial Holdings, Inc. ESQ 122 481 17.2 NA 0.98 5.6 25.7 148
Evans Bancorp, Inc. EVBN 208 1,220 9.0 NA 1.24 12.7 17.5 191
Financial Institutions, Inc. FISI 513 4,022 6.9 NA 0.84 9.2 16.3 187
First American International Corp. FAIT 65 864 7.0 NA 0.78 8.8 9.9 107
First National Bank of Groton FIGR 26 175 13.3 0.64 1.09 8.4 12.6 110
First of Long Island Corporation FLIC 769 3,733 9.2 0.32 1.00 11.1 21.9 224
Flushing Financial Corporation FFIC 864 6,261 8.4 0.24 0.65 7.6 17.5 165
Glenville Bank Holding Company, Inc. GLNV 19 460 7.7 0.31 0.44 5.4 NA NA
Gold Coast Bancorp, Inc. GLDT 57 477 NA NA 0.70 NA 25.0 137
Greater Hudson Bank GHDS 74 479 12.2 NA 0.91 7.5 23.1 127
Jeffersonville Bancorp JFBC 67 500 12.5 NA 1.04 8.3 13.3 108
JPMorgan Chase & Co. JPM 349,087 2,563,074 NA 0.67 1.05 10.4 14.5 192
Kinderhook Bank Corporation NUBK 28 481 5.4 NA 0.36 4.5 16.9 NA
Lyons Bancorp, Inc. LYBC 120 1,013 NA NA 0.86 NA 16.2 177
M&T Bank Corporation MTB 25,231 120,402 9.0 NA 1.19 8.7 19.3 242
National Bank of Coxsackie NCXS 21 295 8.6 3.26 0.38 4.5 24.1 81
NBT Bancorp Inc. NBTB 1,661 9,155 7.6 0.43 1.01 9.6 19.9 247
Orange County Bancorp, Inc. OCBI 101 987 8.9 NA NA NA 24.1 116
Pathfinder Bancorp, Inc. PBHC 66 875 6.6 NA 0.44 NA 18.0 116
Putnam County National Bank of Carmel
PUNB NA 162 21.3 8.98 0.20 1.0 NA NA
Signature Bank SBNY 7,147 41,327 9.4 NA 1.22 12.9 18.2 183
Solvay Bank Corporation SOBS 87 880 8.8 0.59 0.83 9.2 11.9 113
Sterling Bancorp STL 5,628 16,780 7.6 0.77 1.15 9.2 20.2 280
Steuben Trust Corporation SBHO 65 529 10.2 0.59 1.13 11.2 11.4 120
Tompkins Financial Corporation TMP 1,324 6,524 7.6 0.46 1.08 11.9 20.4 272
VSB Bancorp, Inc. VSBN 35 365 9.0 0.98 0.79 9.0 12.1 107
Median 8.4 0.59 0.87 8.9 17.6 156
Average 9.1 1.16 0.87 8.6 17.7 165

16
Thrift Highlights
Tang.
Common Price/
Equity/ NPAs/ Price/ Tang.
Market Total Tang. Loans & LTM LTM LTM Book
Cap Assets Assets OREO ROAA ROAE EPS Value
Company Name Ticker ($MM) ($000) (%) (%) (%) (%) (X) (%)
Carver Bancorp, Inc. CARV 9 699 0.9 1.97 -0.67 -8.8 NM 136
Dime Community Bancshares, Inc. DCOM 825 6,444 8.3 0.01 0.85 9.1 22.3 156
Elmira Savings Bank ESBK 69 565 7.9 NA 0.85 7.4 17.4 158
FSB Bancorp, Inc. FSBC 32 305 10.3 NA 0.27 2.5 32.7 101
Gouverneur Bancorp, Inc. (MHC) GOVB 31 138 21.4 2.49 0.78 3.8 25.7 106
Greene County Bancorp, Inc. (MHC) GCBC 254 1,038 8.4 NA 1.38 16.3 20.9 293
Lake Shore Bancorp, Inc. (MHC) LSBK 97 513 15.2 NA 0.74 4.8 33.0 125
New York Community Bancorp, Inc. NYCB 6,143 48,458 8.3 0.23 0.91 6.5 14.4 161
NorthEast Community Bancorp, Inc. (MHC)
NECB 122 759 14.8 NA 1.21 8.1 NA NA
Patriot Federal Bank PFDB 16 145 8.7 0.25 0.24 2.8 34.5 125
PCSB Financial Corporation PCSB 340 1,412 19.6 NA 0.49 2.5 NA 123
PDL Community Bancorp (MHC) PDLB 277 813 11.6 1.03 0.57 4.7 NA NA
Seneca Financial Corp. (MHC) SNNF 19 172 6.7 0.92 0.22 3.4 NA NA
Seneca-Cayuga Bancorp, Inc. (MHC) SCAY 24 285 8.7 1.00 0.28 3.1 NM 97
Sunnyside Bancorp, Inc. SNNY 13 88 13.2 NA 0.13 1.0 NM 116
TrustCo Bank Corp NY TRST 882 4,870 9.3 0.77 1.03 11.1 18.9 194
Median 9.0 0.92 0.65 4.3 22.3 125
Average 10.8 0.96 0.58 4.9 24.4 145
Financial data as of or for the three months ending September 30, 2017, or if not available, as of or for the three months ending June 30, 2017 Pricing data as of October 31, 2017 Source: S&P Global Market Intelligence

17
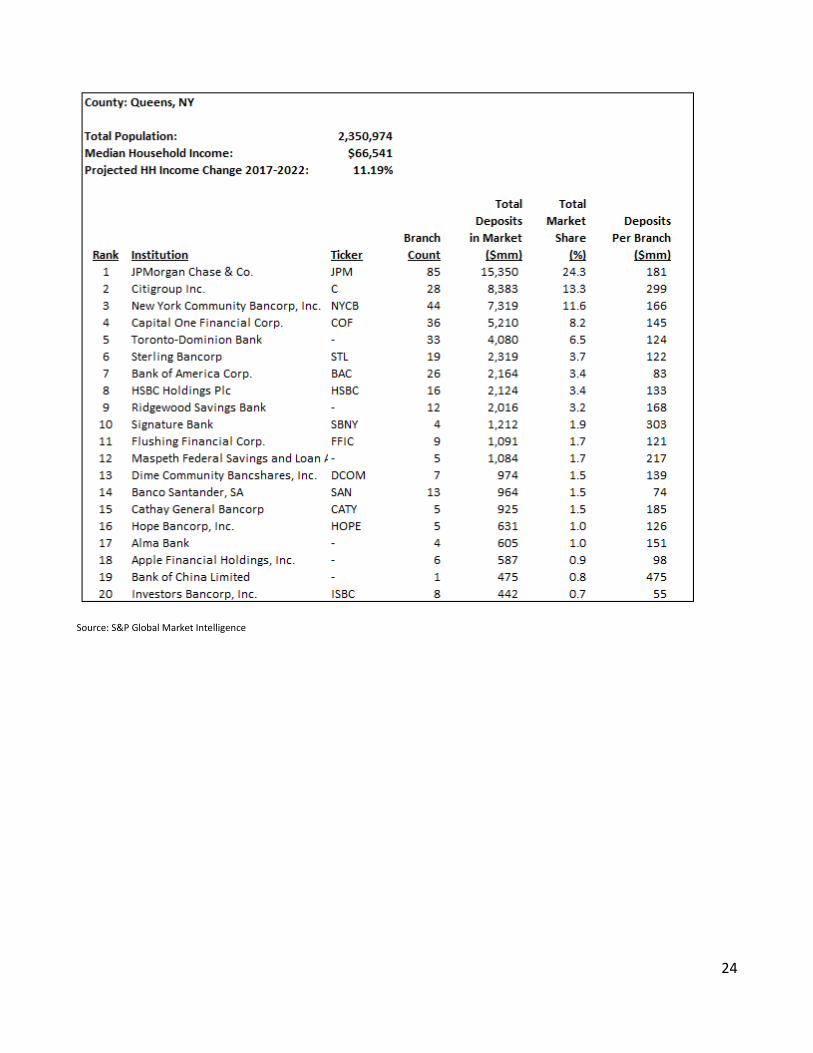
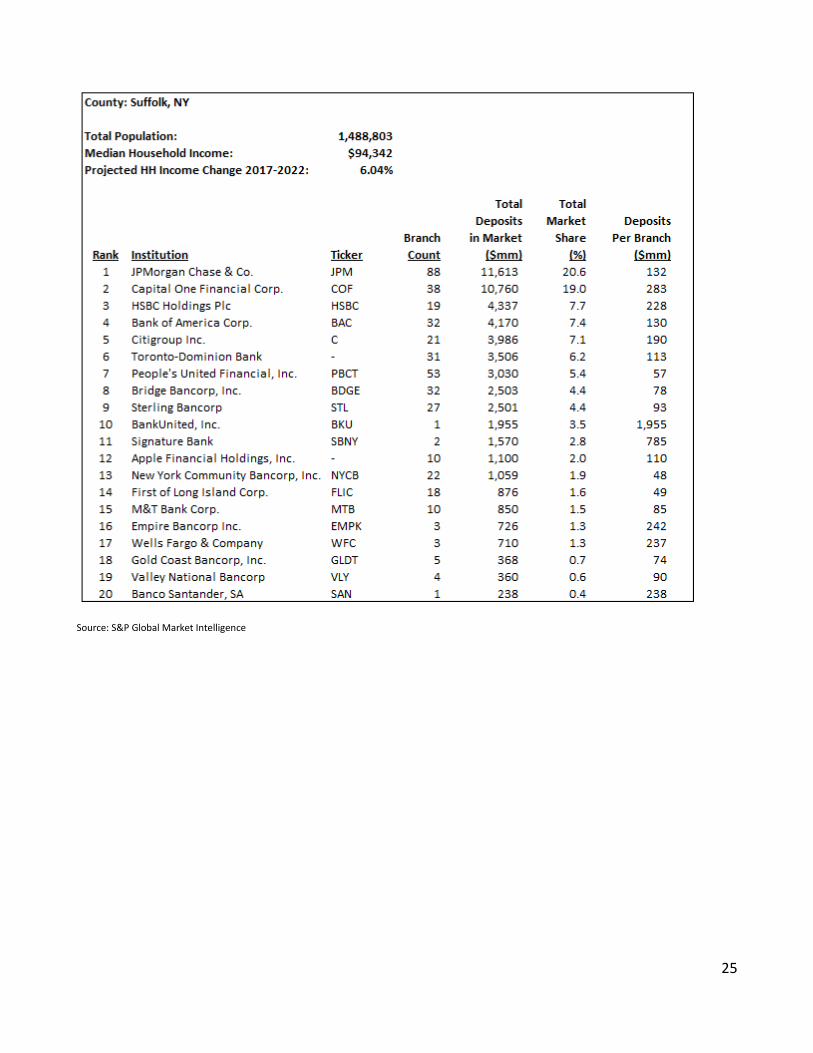
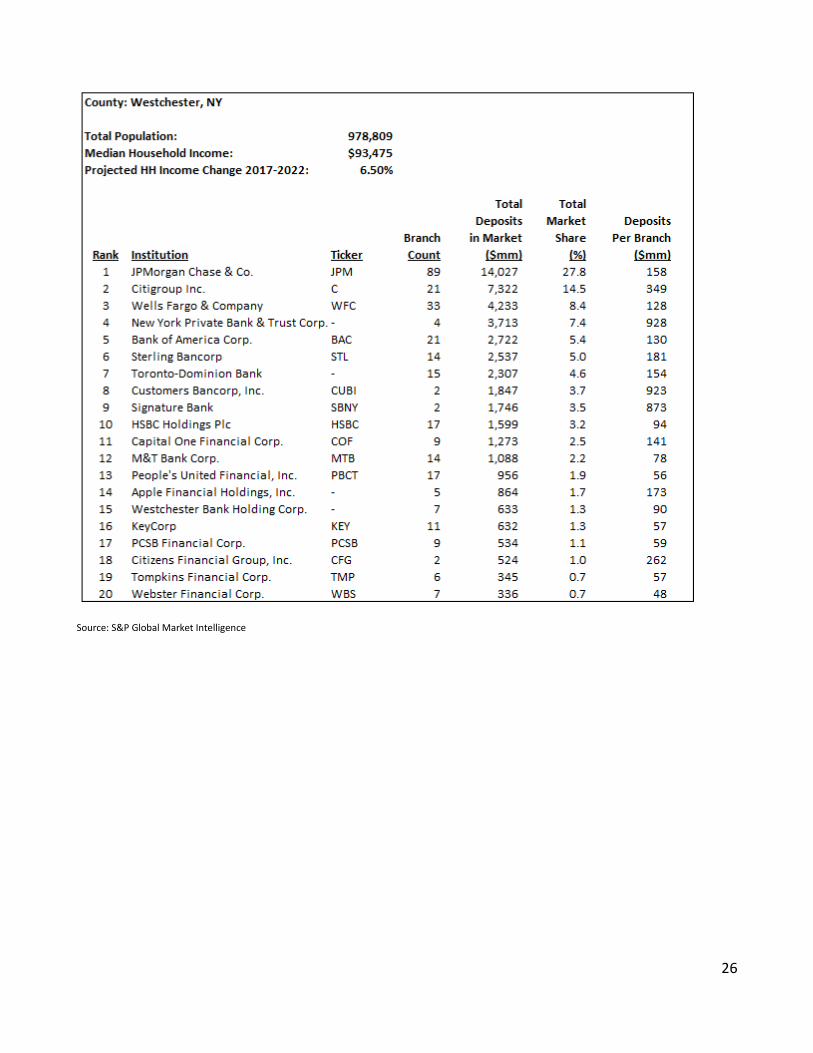
Appendix B: Deposit Market Share by County
Source: S&P Global Market Intelligence

18
Source: S&P Global Market Intelligence

19
Source: S&P Global Market Intelligence

20
Source: S&P Global Market Intelligence

21
Source: S&P Global Market Intelligence

22
Source: S&P Global Market Intelligence

23
Source: S&P Global Market Intelligence
24
Source: S&P Global Market Intelligence
25
Source: S&P Global Market Intelligence
26
Source: S&P Global Market Intelligence