not your grandmother’s coffee...
TRANSCRIPT

Honne Capital
October 9, 2012
Not Your GrandMother’s Coffee Roasters
Derek C. Cheung
Amy Zhao

Table of Contents
Spinoff Situation . . . . . . . . . . . . . . . . . . . . . . . . . . . . . . . . . . 3-6
Background and Business . . . . . . . . . . . . . . . . . . . . 7-15
Bear/Bull Case . . . . . . . . . . . . . . . . . . . . . . . . . . . . . . . . . 16-27
Sarista Rollout . . . . . . . . . . . . . . . . . . . . . . . . . . . . . . . . . 28-33
Patent Issues . . . . . . . . . . . . . . . . . . . . . . . . . . . . . . . . . . . 34-38
Taxes About to Drop . . . . . . . . . . . . . . . . . . . . . . . . . . 39-42
Transformation . . . . . . . . . . . . . . . . . . . . . . . . . . . . . . . . . 43-46
Conclusion . . . . . . . . . . . . . . . . . . . . . . . . . . . . . . . . . . . . . . 47-49
2

Spinoff Situation
3

Spinoff Situation
• D.E Master Blenders 1753 (D.E) was spun out of
Sara Lee (now Hillshire Brands) in June 2012
• Parent company shareholders received one
share of D.E for each share of Sara Lee owned
• Unlike its parent, D.E is not a component of the
S&P 500 Index nor is it listed on a US stock
exchange
• D.E trades on the pink sheets (DEMBF) and on
Euronext Amsterdam (DE)
4 Source: D.E Prospectus

Spinoff Situation
• Management told us they have no plans to list
DEMBF on a US exchange
• As of May 1, 2012, only 0.022% of Sara Lee’s
outstanding shares were held by residents of the
Netherlands
• 97.10% of Sara Lee’s outstanding shares were
held by residents of the United States
• We suspect that over 10 million shares may be
owned by motivated sellers
5 Sources: Honne Capital conversations with management, D.E Prospectus

Spinoff Situation
6
D.E shares have performed surprisingly well since the spinoff.
Management has hosted roadshows with several European banks.

Background and Business
7

Background and Business
• Douwe Egberts Master Blenders 1753 is
headquartered in Amsterdam, Netherlands
• D.E was founded in 1753 as a grocery store
selling coffee, tobacco and tea
• From the 1940s to 1970s D.E acquired leading
coffee makers in Western Europe; as well as the
British tea maker, Hornimans
8 Source: D.E Website

Background and Business
• In 1978 D.E was acquired by Sara Lee and
began to expand outside of Europe, in fast-
growing markets such as Brazil
• The Away from Home business also expanded
rapidly during the 1990s, with the Cafitesse
liquid coffee system becoming popular in offices,
hospitals, hotels, and other public buildings
9 Source: D.E Website

Background and Business
• D.E operates in two main segments
At Home: roast and ground multi-serve
coffee/single serve coffee capsules, instant
coffee and tea
Away from Home: products are sold either
directly to businesses, hotels, hospitals and
restaurants or to foodservice distributors for
distribution to the customer
10 Source: D.E Prospectus

Background and Business
Leading Brands
11 Source: D.E Website

Background and Business
12 Source: D.E Website
Cafitesse:
unique liquid
coffee system,
serving fresh
coffee – quickly
Espresso: Espresso
coffee machines for
restaurants, cafés,
and hotels, who want
to provide their
customers with top
quality espressos
Instant: From
small instant
machines to full
automatic
machines with
Douwe Egberts
quality instant
ingredients
Fresh Brew and filter
coffee: traditional filter
coffee machines and
coffee vending machine
concepts for small,
medium and large
locations with Roast &
Ground Fresh Brew
coffee

Background and Business
• In 2001 D.E formed a 50-50 joint venture with
Philips Electronics to launch the Senseo single
serve coffee system (one year before Keurig’s
brewer)
• In January 2012 D.E purchased the remaining
50% stake in Senseo from Philips for €170
million
• D.E now owns full rights to the global Senseo
trademark; Philips will continue to design,
manufacture and distribute all Senseo machines
until 2020 13 Source: D.E Website

Background and Business
14 Sources: D.E Prospectus, D.E 2012 Form 20-F
Fiscal Year Ending July
in millions of € 2009 2010 2011 2012
Total Revenue 2,234.50 2,315.50 2,601.60 2,795.00
Growth y/y n/a 3.62% 12.36% 7.43%
COGS 1,333.90 1,346.10 1,616.60 1,787.10
Gross Profit 900.60 969.40 985.00 1,007.90
Gross Margin % 40.30% 41.87% 37.86% 36.06%
Total SG&A 554.1 622.7 653.7 898.2
Operating Income 346.50 346.70 331.30 109.70
Operating Margin % 15.51% 14.97% 12.73% 3.92%
Financial Income and Other 119.4 72.7 48.7 149.8
Pre-Tax Profit 465.90 419.40 380.00 259.50
Income Taxes 127.4 179.4 104 127.3
Net Income 338.50 240.00 276.00 132.20

Background and Business
15 Source: D.E Results Fiscal Year 2012 Presentation. Market prices as of September 20, 2012.
Market Valuation
Stock Price
€9.30
Diluted Shares Out. 595M
Market Cap €5,533
Net Debt €337
Enterprise Value €5,870
Valuation Multiples
€
Multiple
Revenue 2012 €2,793.00 1.86x
Revenue 2013E €2,904.72 1.79x
EBIT 2012
€321.00
16.19x
EPS 2012 €0.20 46.50x
Normalized EPS €0.45 20.67x

Bear Case
16

17
Bear Case
• D.E cannot quickly pass increasing commodity costs (green coffee) on to consumers
• Reported revenue growth of 3.6%, 12.4% and 7.4% in 2010, 2011 and 2012, respectively, is substantially lower than COGS growth
• D.E’s gross margins have declined from 42% in 2010 to 36% in 2012
• Two-thirds of D.E’s revenue comes from Western Europe
Source: D.E Prospectus

Bear Case
18
Keurig Vue brews coffee,
lattes and cappuccinos, as
well as tea, hot cocoa and
iced beverages
Brewer price: $299.99
Price per serving: 67-92¢
Starbucks Verismo 580
Brewer uses pods to create
caffè lattes, espresso and
steamed milk
Brewer price: $199.00
Price per serving: 83-162¢
New Competitors in Single Serve Category
Source: Honne Capital price checks on Amazon.com

Bull Case
19
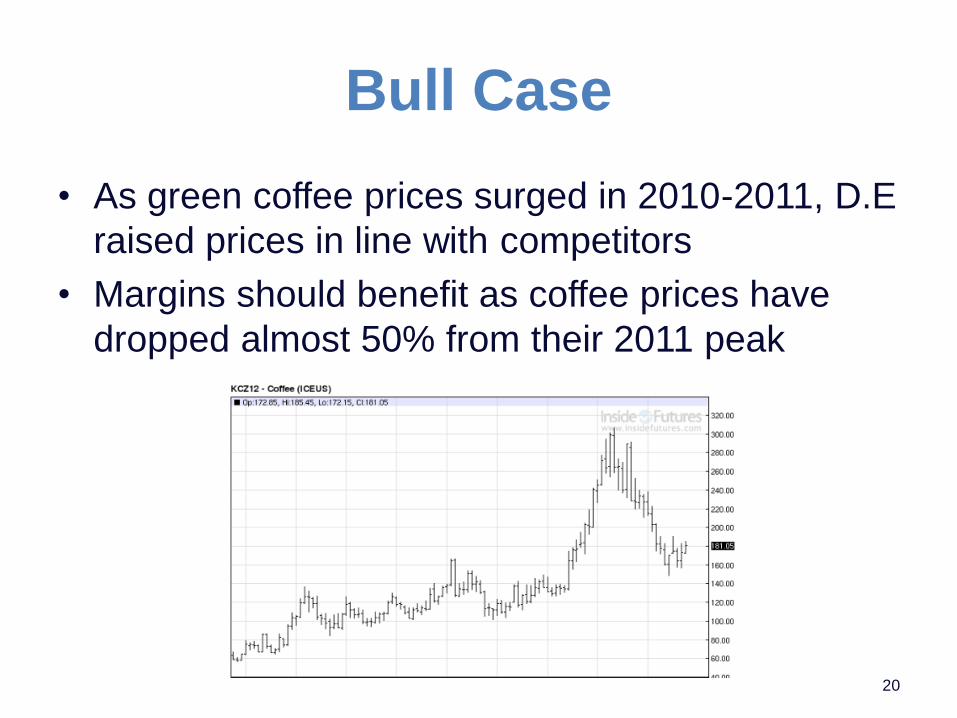
Bull Case
• As green coffee prices surged in 2010-2011, D.E
raised prices in line with competitors
• Margins should benefit as coffee prices have
dropped almost 50% from their 2011 peak
20

21
Bull Case
Source: D.E Key Facts
Country D.E Share D.E Position
Netherlands 60% #1
Belgium 52% #1
Hungary 35% #1
Denmark 31% #1
Brazil 22% #1
Spain 20% #2
France 15% #3
Poland 18% #4
Leader in Roast & Ground Market Share (Excludes Single
Serve)

22
Bull Case
• 72% of D.E’s revenue comes from markets where it has a No. 1 or No. 2 position
• Senseo has share of mind, with over 33 million brewers sold since 2001
• We estimate that global Senseo brewer sales have outpaced Keurig (though GMCR stopped disclosing Keurig brewer sales after fiscal year 2009)
Sources: D.E Key Facts, GMCR 2009 Form 10-K

23
Bull Case
Sources: Euromonitor, Nielsen
Single Serve is the Fastest Growing Segment in Coffee

24
Bull Case
• Unlike its competitors in single serve, D.E does not have a “razor and razor blade” model
• Philips designs, manufactures and distributes all Senseo coffee machines; sells machines above cost instead of at cost
• This sales practice appears to work well in Europe
• We have suggested to management that it tries a “razor and blade” model in the US
Source: Honne Capital conversations with D.E management

Bull Case
• In the Away from Home segment, 58% of
sales are direct to businesses, hotels and
restaurants; 42% of sales are to
foodservice distributors
• Foodservice distributors are well-
established and geographically diverse:
Sodexo, Compass, Metro/Makro, Mahou,
UCC Japan
25 Source: Honne Capital conversation with D.E management

26
Bull Case
Source: D.E Prospectus
€ (000,000 omitted) 2011 2010 2009
Net Income 276.00 240.00 338.50
Operating Working Capital 474.80 386.00 350.90
Acquisitions 24.08 n/a 7.36
Net Fixed Assets 369.90 365.60 372.60
CapEx 77.50 65.70 76.60
Total 946.28 817.30 807.46
Return on Capital Invested 29.2% 29.4% 41.9%
D.E Generates High Returns on Capital

27
Bull Case
Source: D.E Prospectus
€ (000,000 omitted) 2011 2010 2009
Operating Cash Flow 281.70 364.80 194.00
CapEx (77.50) (65.70) (76.60)
Acquisitions (24.08) n/a (7.36)
Free Cash Flow 180.12 299.10 110.04
D.E Generates Significant Free Cash Flow
Sarista Rollout
28

Sarista Rollout
• D.E began selling a new single serve
coffee machine, Sarista, in the
Netherlands this October
• Unlike other brewers, Sarista starts with
unground beans, then grinds them
immediately before brewing
• Sarista creates fresher coffee than other
machines
29 Source: Honne Capital conversation with D.E management

Sarista Rollout
30
Conventional Single
Serve (Ground Beans)
Sarista Funnel
(Full Beans)
K-cups Coffee Pads

Sarista Rollout
• Machine is expensive
at €249 MSRP
• Cost per serving is
€0.24 ($0.31) – half
the price of K-cups and
one-third the price of
Starbucks Verismo
pods
31 Source: Honne Capital conversation with D.E management

Brand Price $ Servings Per Serving
K-cup - Lower End
Folgers : Black Silk Dark Roast 11.28 18 63¢
GMCR : Breakfast Blend 16.28 24 68¢
Tully's (GMCR) : Kona Blend 11.99 18 67¢
K-cup - Higher End
Barista Prima (GMCR) : Coffeehouse Blend 20.49 24 85¢
Café Escapes (GMCR) : Chai Latte 12.99 16 81¢
Dunkin Donuts : Original Blend 11.99 14 86¢
D.E Coffee Pod & Sarista Funnel
Senseo Coffee Pods - Dark Roasted 35.99 108 33¢
Senseo Origin Coffee Pods - Colombia 24.99 64 39¢
Sarista Funnels 6.20 20 31¢
Verismo Coffee Pod – Higher End
Verismo Caffe Latte Pods 12.95 8 $1.62
Verismo Espresso Roast 11.95 12 $1.00
Verismo House Blend Brewed Coffee Pods 11.95 12 $1.00
Sarista Rollout
32 Source: Honne Capital pricing checks on Amazon.com and Starbucks.com

Sarista Rollout
• Despite their low cost per serving, Sarista bean funnels are high-margin for D.E, as they are just canisters of unground beans
• Capex related to Sarista is minimal, as D.E uses existing facilities to fill funnels with roasted beans
• Philips manufactures, distributes and sells all Senseo coffee machines
• Retailers have ordered twice as many Sarista machines as management expected
33 Source: Honne Capital conversation with D.E management

Patent Issues
34

Patent Issues
• In 1998 D.E was granted a patent for Senseo
and started with a monopoly over high-margin
coffee pouches
• Competitors soon entered the market for coffee
pouches and delivered copy-cat products in
shops
• At the end of 2001 Sara Lee began
infringement proceedings against several
competitors in Belgium and in the Netherlands
35 Source: Economic incongruities in the European patent system

Patent Issues
• In 2002 the Court of Appeal in Hague held
that there was no indirect infringement
action
• Dutch competitors were allowed to
continue selling their copy-cat products
• In 2006 the European Patent Office
completely revoked Sara Lee’s patents for
lack of “inventive step”
36 Source: Economic incongruities in the European patent system

Patent Issues
• Learning from experience, D.E has built up an extensive patent portfolio to protect Sarista canisters/funnels as well as the coffee brewer, and their interaction
• D.E has filed 10 patent families for Sarista
• Most of these have already been granted in the Netherlands, France and Germany with expiration in 2031
• A few are still pending at the European Patent Office
37 Source: Honne Capital conversation with D.E management

Patent Issues
• D.E has focused on preventing patent
workarounds
• Patents provide D.E with an exclusive right
to manufacture and sell Sarista
canisters/funnels
• D.E has ensured that its funnels cannot be
refilled
38 Source: Honne Capital conversation with D.E management

Taxes About to Drop
39

Taxes About to Drop
• Tax rate was abnormally high in 2010 and 2012
• In fiscal 2010, D.E recognized €50.8 million of additional tax expense as a result of its decision to repatriate certain income that will result in recapture taxes and an increase in tax reserves of €31.7 million for a tax claim in Belgium
• D.E also recorded additional tax expense associated with a change in tax reserves recorded in prior years of €30.7 million
40 Source: D.E 2012 Form 20-F

Taxes About to Drop
• Q: Clearly, the tax rate is above the norm
for the year. What do you see as the
effective tax rate going forward?
• A: We reported an effective tax rate of
approximately 53%. If you look at what is the
normalized effective tax rate, that is around 32%
for 2012. Going forward to 2013, I expect the
effective tax rate to be around 30% and from
2014, as I also already announced in March, we
expect an effective tax rate of around 25%.
41 Source: D.E Fiscal 2012 Results Interview With Management

Taxes About to Drop
• Applying a 25% effective tax rate, D.E’s
net income in 2010, 2011, and 2012 would
have been higher by 31%, 3.3%, and
58.9%
• Management does not apply the going-
forward tax rate in its calculation of
adjusted earnings
42

Transformation
43

Transformation
• Non-recurring charges amount to €221 million in
fiscal 2012:
Spin-related items
Restructuring
Termination costs related to prior Senseo
contract with Philips
New business model
• Normalized EPS is €0.45 vs. reported EPS of
€0.20
44 Source: D.E Results Fiscal Year 2012 Presentation

Transformation
• In July 2012 D.E began a restructuring program
to become simpler and more commercially
driven
• 7% of workforce eliminated, with annual savings
of €5 million
• 30% of general managers have been given new
positions
• Cost saving programs aim to cut expenses €25-
30 million in 2013; €55-75 million by 2015
45 Source: D.E Results Fiscal Year 2012 Presentation

Transformation
• In 2011 D.E generated approximately 95% of Senseo sales in the Netherlands, Belgium, France and Germany
• D.E plans to expand geographically into Eastern Europe, Asia and Latin America
• As emerging markets grow wealthier, buying will shift away from instant coffee to single serve and roast and ground (where D.E has an advantage)
• Extension of new products and selective acquisitions where appropriate
46 Source: D.E Results Fiscal Year 2012 Presentation

Conclusion
47

Conclusion
• D.E has been under-managed as a division of Sara Lee, with inconsistent sales execution and a lack of urgency
• After the spinoff, D.E is leaner and more profitable
• D.E is a great business with ~30% return on invested capital
• With Sarista, D.E has a second chance to generate large profits in the single serve category
48

Conclusion
• We project that over the next few years D.E will grow the top line in the mid-single digits
• Net income will improve ceteris paribus due to lower tax rates going forward
• P/E multiple of 20x 2012 adjusted earnings is misleading due to 49% tax rate
• Applying going-forward tax rate, P/E drops to ~10
• Given the quality and potential of D.E’s business, 10x earnings is cheap
49

Disclaimer
All information provided in this presentation is for informational purposes only and should not be deemed as investment advice or a recommendation to purchase or sell any specific security. While the information presented herein is believed to be reliable, no representation or warranty is made concerning the accuracy of any data presented. In addition, there can be no guarantee that any projection, forecast or opinion in this presentation will be realized. All trade names, trade marks, service marks, and logos herein are the property of their respective owners who retain all proprietary rights over their use. This presentation is confidential and may not be reproduced without prior written permission from Honne Capital LLC.
50