not all csr reports are created equal: report quality … quality and voluntary third-party...
TRANSCRIPT

Not All CSR Reports are Created Equal: Report Quality and Voluntary Third-Party Assurance
by
Mark Bagnoli
P.J. Hoffman
Susan G. Watts
Krannert Graduate School of Management Purdue University
West Lafayette, IN 47907
January 2016
Abstract: We study two aspects of voluntary corporate social responsibility (CSR) disclosures: how they are provided on corporate websites (standalone versus web-based) and how their content varies with the decision to purchase external assurance. Larger firms and firms with higher capital expenditures (i.e., those with longer horizons or greater current exposure to ESG concerns) are more likely to provide standalone reports that are easily archived, disseminated and assured instead of web-based reports that can be changed at will and are difficult to archive and assure. External assurance is associated with content that indicates less greenwashing: assured reports contain less optimistic and less embellished language and more “hard” information than unassured reports. They also focus less on cultural/societal values and more on measurable environmentally impactful activities.
Acknowledgements: We thank Jon Black, Thomas Godwin, Tom Lyon, KoEun Park, Casey Rowe, Clare Wang and workshop participants at Purdue University for helpful discussions.

1
Introduction.
Increasing concerns with working conditions, natural resource shortages, climate change and supply-
chain disruptions have created demand for disclosure of corporate social and environmental impacts. As a
result, sustainability initiatives and socially responsible programs are now often key components of
corporate strategy, and firms routinely provide formal corporate social responsibility (CSR) reports to the
public.1 The results of a recent EY (2014a) survey suggest that although clients and customers continue to
be major drivers of socially responsible activities and reporting, employees, investors (in particular
institutional investors), communities, activists and boards of directors are increasingly influential in
shaping these policies and disclosures. Interestingly, despite the growing demand for and interest in CSR
reporting, there are no widely accepted, universal standards or rules for their preparation and distribution.2
Further, although some firms have voluntarily sought third-party assurance of all or parts of their CSR
reports, external verification of report contents is not required. Thus, CSR report quality is likely to vary
significantly across firms, even when those firms are large, publicly traded corporations.
The objective of this paper is to examine variation in certain aspects of quality across CSR reports. In
particular, we study differences in the way in which large, publicly traded firms provide reports via their
corporate websites and how the contents of the reports vary depending on whether or not they were
assured by an independent third party.
Prior research has studied the decision to provide a CSR report but not the way in which they are
delivered to the public (e.g., Dhaliwal, Li, Tsang and Yang 2011 and Dhaliwal, Radhakrishnan, Tsang
and Yang 2012). Of the firms that choose to make those disclosures, some provide them as (essentially)
permanent, standalone reports, similar to annual reports, downloadable as a .pdf file on their websites, and
others offer them only as web pages. While .pdf file content is easily retained once the file is downloaded,
reports delivered on web pages or in the form of a digital magazine can be easily updated or changed,
making it more difficult to retain an historical record of, or assure, the content. This difference is one of
the reasons .pdf files are admissible electronic documents in U.S. courts while web pages are not.3 For
1 KPMG (2013) reports that nearly three-fourths of 4,100 firms it surveyed produce CSR reports, up seven percentage points from 2011. 2 As explained in the next section, there are a number of private standards, guidelines and frameworks available to assist corporations in preparing their voluntarily provided CSR reports. 3 An electronic document is “…admissible if it is created in a file format that cannot be altered without leaving an electronic footprint” (http://www.legalscans.com/whypdf.html). .pdf files satisfy this requirement but web pages do

2
these reasons, we view CSR report delivery via a .pdf file as higher quality reporting and examine firm
characteristics that we expect to be associated with this choice of delivery format. Specifically, we
hypothesize and find that larger firms and firms undertaking significant capital expenditures are more
likely to provide their CSR reports as .pdf files. The first result is consistent with prior findings based on
other types of voluntary disclosures: larger firms provide higher quality financial disclosures (see, for
example, Lang and Lundholm 1993). The second is consistent with firms that have a longer term outlook
or that are investing in capital projects with environmental impact making the decision to offer a more
easily retained record of their socially responsible activities. We also hypothesize and find that less risky
firms provide higher quality CSR report delivery, consistent with our argument that firms that adopt low
risk strategies are more likely to benefit from higher quality CSR reporting. Finally, we document
industry effects associated with the report delivery decision. In particular, firms in sectors that attract
greater public scrutiny (i.e., the materials or consumer staples sectors) are more likely to offer higher
quality standalone, .pdf CSR reports than firms in other sectors.
As mentioned earlier, reports that are delivered in a standalone, .pdf format are much more amenable to
third-party assurance than those that are web-based. As a result, we expect aspects of the language used in
the standalone reports in our sample to vary systematically with the decision to have the report externally
assured. In particular, because external assurers monitor the firm’s claims and moderate them if
necessary, we expect the amount of greenwashing in assured CSR reports to be limited relative to that in
unassured CSR reports. Our results are consistent with this expectation. Specifically, we find that the
language in standalone CSR reports accompanied by third-party assurance is less optimistic, is less
embellished and contains less information about activities that are generally easier to exaggerate (i.e., less
discussion of the firm’s adherence to cultural/societal values). That is, assured CSR reports generally
contain less exaggeration of the firm’s socially responsible activities. We further hypothesize and find
that reports contain more certain language, more discussion of the firm’s environmental activities and
more numerical terms when they are assured. That is, assured CSR reports generally contain more
quantifiable or “hard” information on the firm’s socially responsible activities. Taken together, these
results offer the first direct evidence that third-party assurance is associated with a significant difference
in the tone and type of information contained in the CSR report and, more specifically, with a reduction
in greenwashing.
not. See also Bench & Bar of Minnesota (http://mnbenchbar.com/2013/10/admissibility-of-electronic-evidence/) and http://www.esiimaging.com/section2/whypdf.html.

3
We also find that, even after controlling for whether the CSR report is assured, firms that have a longer
history of offering CSR reports on their websites are less likely to use optimistic language and are more
likely to use both certain language and numerical terms in their reports. Further, firms that have adopted
the GRI reporting framework are less likely to use optimistic language, less likely to embellish and more
likely to use certain language in their CSR reports. These results suggest that the firm’s willingness to
provide a history of its socially responsible activities and a willingness to adopt the GRI reporting
framework are both associated with producing higher quality CSR reports. Interestingly, we find that
firms that do not adopt the GRI reporting framework tend to increase numerical content and discussion of
their environmental efforts, perhaps as a way of substituting for the GRI content.
Overall, our results suggest that there are important differences in both the format firms adopt for their
voluntary CSR disclosures and the content of those disclosures. Thus, we contribute to three streams of
literature: the CSR assurance literature (see Casey and Grenier 2015 for a review of the empirical
literature and Bagnoli and Watts 2016 for theoretical analysis); the voluntary disclosure literature (in
particular, the work that builds on Lang and Lundholm 1993), and the linguistic content literature (see Li
2011 for a review and Huang, Teoh and Zhang 2014 for recent empirical analysis). In particular, we
show that report delivery format as well as voluntary assurance of the report are aspects of CSR reporting
that are systematically related to firm characteristics and to the quality of the reports that are issued. These
insights are likely to be useful to regulators, standard setters and business professionals alike as
sustainability reporting continues to evolve.
2. Background, Related Literature and Hypothesis Development.
Incorporating sustainability initiatives into corporate strategy and reporting is now common. In its 2013
Survey of Corporate Responsibility Reporting, KPMG reports that 71% of the 4,100 companies surveyed
produce CSR reports, up from 64% in 2011. Yvo de Boer, KPMG’s Global Chairman, Climate Change
& Sustainability Services, also notes in the same report that CSR reporting appears now to be a global
business practice, and that an increasing number of companies are using it to identify environmental,
societal and governance factors that affect stakeholders and business risks. The results of a survey of
participants at the GRI Global Conference on Sustainability and Reporting in May, 2013, are consistent
with de Boer’s assertions. They indicate that although clients and customers are the main drivers of
corporate sustainability efforts, employees, the board of directors, and investors also influence those
efforts (EY 2014a). Not surprisingly given this broad set of stakeholders, the GRI survey results reveal
4
that business objectives as well as ethical concerns are now the key factors in developing corporate
sustainability strategy (EY 2014a). This has, in turn, moved CSR reporting into the business mainstream
over the past decade (KPMG 2013 and EY 2014a). Despite the growing focus on CSR reporting,
however, there is considerable flexibility in preparing the disclosures, in part because of the diverse
informational needs of the expanding set of parties interested in such reports and in part because there are
no standard, universal requirements for preparing and distributing them (EY 2014a).4 This flexibility
suggests that CSR report quality likely varies significantly across firms, even when those firms are large,
publicly traded corporations.
Our objective in this paper is to begin to examine how certain aspects of quality vary across CSR reports
produced by different firms. Specifically, we begin by examining the format of reports provided by large,
publicly traded firms on their websites and then, for the subset of firms that issue permanent, standalone
reports, we ask whether the content of the report varies with whether or not the report is assured by an
independent third party.
2.1. Report Form and Delivery as a Measure of Quality
Although the voluntary aspects of CSR reporting have been studied before as noted above, an interesting
and previously unexamined nuance of CSR reporting is the form and delivery of the reports. Specifically,
some firms issue standalone CSR reports similar to annual reports, usually in a downloadable (.pdf or
similar) format; other firms provide their CSR reports only via their website (e.g., as a web page or in a
digital magazine format); and others provide no report at all. We refer to the first type of report as
“standalone” reports and the second type as “web-based” reports.
4 According to EY (2014a), there are numerous private standards, guidelines and frameworks that help companies prepare and report sustainability information. For example, the Global Reporting Initiative (GRI, www.globalreporting.org), an international non-profit organization and Collaborating Centre of the United Nations Environment Programme, recently issued its fourth-generation (G4) sustainability reporting guidelines for voluntary use by organizations around the world. In the U.S., the Sustainability Accounting Standards Board (SASB, www.sasb.org), an independent 501c(3) non-profit that incorporated in July 2011, is developing voluntary, industry-specific reporting frameworks that will help corporations “…[understand, interpret and measure] relevant sustainability issues at the industry level in order that they can be measured, managed and disclosed.” One of the SASB’s main stated objectives is to help companies meet the Security and Exchange Commission’s (SEC) requirement to disclose material information, some of which is likely to be related to environmental and other sustainability issues. Interestingly, SEC Commissioner Daniel Gallagher stated in a March, 2014, speech that “…it is important to remember that groups like SASB have no role in the establishment of mandated disclosure requirements” (Allen 2014, emphasis added). Further, the SASB is careful to note on its website that it is not affiliated with FASB, GASB, IASB or any other accounting standards boards.
5
Prior studies on the impact of CSR disclosure have compared firms issuing standalone reports with firms
that do not (Dhaliwal, Li, Tsang and Yang 2011 and Dhaliwal, Radhakrishnan, Tsang and Yang 2012,
among others).5 Although a substantial number of firms now choose web-based CSR reporting (nearly a
quarter of our sample of S&P 500 firms), to our knowledge, we are the first to study these reporters and
compare them to firms that choose to provide standalone reports or no report at all.
Although similar to standalone CSR reports in many ways, web-based CSR reports have important unique
features. Most notably, web-based reports can be updated, amended, or removed by the company at any
time and consequently are virtually never assured by an independent third party. Also, prior years’ reports
are not available as the CSR report web page is simply updated as needed, making comparisons to prior
years more difficult. We believe this distinction is important: choosing a web-based CSR disclosure
regime is certainly different from choosing to not issue CSR reports at all, but it is also not the same as
choosing to provide standalone CSR reports. Because standalone reports are “set in stone” when they are
issued and can be archived, disseminated and independently assured, we view them as higher quality
disclosures than web-based reports.6 The first objective of this study is to examine factors that are likely
to affect the way in which firms make this disclosure quality decision.
Prior studies show that larger firms generally provide higher quality financial disclosures (e.g., Lang and
Lundholm 1993). Studies of CSR reporting provide similar evidence regarding the decision to provide a
CSR report: Simnett et al. (2009) find that larger firms are more likely to issue standalone reports, and
Dhaliwal et al. (2011) find that firm size is positively associated with issuing a standalone report for the
first time. Following our conjecture that standalone reports are of highest quality in terms of report format
because of their permanent nature, web-based reports are of lower quality because of their transitory
nature, and no reports are of lowest quality, we hypothesize that larger firms are more likely to provide
higher quality CSR disclosure. Stated formally:
5 Lys, Naughton and Wang (2015) and Naughton, Wang and Yeung (2015) extend this analysis by examining the importance of CSR expenditures. Lys et al. study the impact of CSR expenditures on inferences about future firm performance and Naughton et al. study the relation between CSR expenditures, investor sentiment and market reactions to CSR announcements. 6 Recall that .pdf files leave an electronic footprint if changed and therefore meet the requirements for an electronic document to be admissible in a court of law while web pages do not.
6
H1a: Larger firms are more likely to provide higher quality CSR disclosure as measured by the existence
and permanence of the report.
In addition to size, we explore firm characteristics that are likely to be associated with the firm’s CSR
report format decision. Capital expenditures represent activities that often inherently have significant
environmental implications.7 We argue that when a firm undertakes major projects such as the
construction or acquisition of a new plant, stakeholders’ demand for environmental information about the
project (and the firm as a whole) is likely to increase. Also, high levels of capital expenditures may
signify projects that decrease environmental impact, such as replacing old machinery or retrofitting
buildings or production facilities. These firms are likely to be more inclined to disclose these “green”
activities to the public, leading to higher quality disclosures. Further, firms with high capital expenditures
tend to be more focused on the long term and thus are more likely to perceive greater benefits (or the
avoidance of costs) of higher quality CSR reporting. For these reasons, we hypothesize that firms with
higher capital expenditures are more likely to provide higher quality CSR disclosure than firms with
lower capital expenditures. Stated formally:
H1b: Firms with higher capital expenditures are more likely to provide higher quality CSR disclosure as
measured by the existence and permanence of the report.
The results of the survey of participants at the GRI Global Conference on Sustainability and Reporting in
May, 2013, (mentioned earlier) highlight identification and mitigation of risks as a principal objective of a
sustainability strategy (EY 2014a). Because firms adopt low-risk strategies when the benefits to reduced
risk—or the costs of increased risk—are high, we expect less risky firms to value CSR reporting more
highly and offer higher quality disclosure than riskier firms.
H1c: Less risky firms are more likely to provide higher quality CSR disclosure as measured by the
existence and permanence of the report.
Prior research has identified firms with low effective tax rates as “tax avoiders” (see Hanlon and
Heitzman 2010). Furthermore, Hoi, Wu and Zhang (2013) find that socially “irresponsible” firms are
more likely to avoid taxes or participate in tax sheltering. They argue that this relation is likely the result
7 We thank KoEun Park for first suggesting that capital expenditures might be related to the assurance decision.
7
of corporate culture or a system of shared beliefs within the firm that produces what they refer to as “a set
of conventions of doing business.” (p. 2028). In a related, complementary article that supports this
argument, Lanis and Richardson (2012) find that more socially “responsible” firms tend to be less tax
aggressive.8 These findings and the arguments underlying Hoi et al.’s (2013) empirical tests suggest that
firms with high effective tax rates might also be more likely to provide higher quality CSR disclosures.
In contrast, Davis, Guenther, Krull and Williams (2016) provide evidence that firms with higher CSR
ratings engage in more tax avoidance. They note that their results are consistent with the idea that legally
avoiding taxes is not a socially irresponsible activity and therefore is not negatively associated with CSR
activity. Further, firms with low effective tax rates are often firms that have more of their profitable
operations in low-tax jurisdictions such as Europe. Because certain CSR disclosures are required in many
of these low-tax jurisdictions, firms operating there are likely to find that the incremental cost of
providing a standalone CSR report is relatively small. If so, then we would expect that firms with low
effective tax rates are more likely to provide higher quality CSR disclosures. Because there are arguments
and empirical results supporting both a positive and negative association, we offer no directional
prediction on the relation between a firm’s tax rate and the quality of its CSR disclosure. Stated formally:
H1d: The firm’s effective tax rate is related to the existence and delivery format of its CSR reports.
Finally, we argue that there are likely to be industry-specific factors that influence the format of a firm’s
CSR reports. For example, firms in certain regulated industries (e.g., utilities) may already collect and
report CSR data to regulators, making the marginal cost of disclosure relatively low. Also, firms in
industries facing greater public scrutiny may be more likely to offer higher quality CSR disclosure
because the benefits from doing so—or the costs of not doing so—are high. These arguments suggest that
there is a predictive relation between industry membership and report quality, with the strength of the
relation varying across industries. Stated formally:
H1e: The firm’s industry membership is related to the existence and delivery format of its CSR reports.
8 See also Desai and Dharmapala (2006) and Avi-Yonah (2008).
8
2.2. Independent Assurance and Report Content
Non-financial disclosures, especially those related to the environmental and social activities of the firm,
are increasingly being used in investment decision-making (EY 2014b). However, the lack of
standardized CSR reporting rules and formats has created significant concern with “greenwashing,” the
public exaggeration, often through the use of vague language, of positive environmental and societal
activities undertaken by the company while downplaying or ignoring negative ones (Lyon and
Montgomery 2013; Mahoney, Thorne, Cecil and LaGore 2013; Lyon and Maxwell 2011; Cho, Roberts
and Patten 2010; Hopwood 2009; Deegan, Rankin and Toobin 2002; Deegan and Rankin 1996). External
(third-party) assurance of CSR reports is one way of mitigating concerns with greenwashing and provides
an indication of disclosure credibility (quality) and commitment to corporate responsibility (Bagnoli and
Watts 2016).
As noted earlier, firms that offer web-based CSR reports have chosen to provide disclosures that are
difficult, if not virtually impossible, to assure because content can be changed or removed at will.
Standalone reports, on the other hand, are permanent in nature and therefore, at least to some extent,
assurable. Firms seeking assurance can now turn to international public accounting firms, boutique or
niche consulting firms, individual experts and engineering firms, all of which offer (usually limited)
assurance or reviews of corporate CSR reports (Casey and Grenier 2015; Eccles, Ioannou and Serafeim
2014; Simnet, Vanstraelan and Chua 2009).9 10 Although there continues to be significant variability in
the extent (level) of assurance provided and in the assurance criteria used by the assurance provider, Mike
Wallace, Director, Focal Point USA, GRI, indicated during his speech at the GRI Conference on May 22,
9 In our final sample of standalone reports, 18.3% are assured but only 27.6% of the assured reports are assured by international accounting firms. Interestingly, of those assured by international accounting firms, in most cases (83.3%) the accounting firm that assures the firm’s financial statements also assures the firm’s CSR report. 10 The Deloitte assurance letter for the UPS 2011 CSR report provides a representative illustration and explanation of the type of assurance provided by an international accounting firm. Deloitte writes “[w] e conducted our review in accordance with attestation standards established by the American Institute of Certified Public Accountants, which includes AT Section 101, Attest Engagements. A review consists principally of applying analytical procedures, considering management assumptions, methods, and findings, and making inquiries of and evaluating responses from persons responsible for corporate social and operational matters. It is substantially less in scope than an examination, the objective of which is the expression of an opinion on the Corporate Sustainability Report. Accordingly, we do not express such an opinion. A review of the Corporate Sustainability Report is not intended to provide assurance on the entity’s compliance with laws or regulations.”
9
2013, that 38% of reports globally have some sort of assurance, with 70% of those reporters purchasing
the assurance from international public accounting firms (EY 2014a).11
To date, empirical research focused on CSR report assurance has studied the determinants of the decision
to acquire third-party assurance and the relation between the presence of assurance and the usefulness of
the report to capital market participants. In particular, Casey and Grenier (2015) and Simnet, Vanstraelan
and Chua (2009) show that both within the U.S. and internationally, larger firms are more likely to seek
assurance for their CSR reports, and that within the U.S., firms with lower leverage are more likely to
seek it. Casey and Grenier (2015) further show that U.S. firms that issue assured CSR reports enjoy a
lower cost of equity capital than U.S. firms that issue unassured reports and that their analysts offer more
accurate earnings forecasts. Also, analyst forecasts for those firms exhibit lower dispersion.
Although the studies discussed above provide indirect evidence of differences in standalone CSR reports
that are assured and those that are not assured, they do not examine differences in the content of the two
types of reports. The second objective of this study is to extend their analysis by examining the content—
in particular, the linguistic tone—of assured and unassured standalone CSR reports.
Analysis of the linguistic content of firms’ financial disclosures has grown into a significant area of
research in recent years (see Li 2010 for a review).12 However, there has been limited research on the
linguistic content of firms’ non-financial disclosures. The work most closely related to ours examines
environmental disclosures made by firms in their 10-K filings (Cho, Roberts, and Patten 2010; Arena,
Bozzolan, and Michelon 2014). Using a sample of 190 environmental disclosures in 10-Ks filed in 2002,
Cho et al. (2010) find that worse environmental performers as measured by environmental concern rating
from KLD Research and Associates, Inc. (now part of MSCI, Inc.) tend to use more optimistic and less
certain language in those disclosures. Arena et al. (2014) study a sample of 288 environmental disclosures
in 10-K filings made by a sample of firms belonging to the oil and gas industry in a more recent time
period (between 2008 and 2010). They find that more optimistic language in those disclosures is
associated with better future environmental performance as measured (again) by the KLD environmental
11 Popular assurance standards include AccountAbility’s AA1000 Assurance Standard 2008 and ISAE 3000 Revised (revised in 2013). See O’Dwyer (2011) for an excellent discussion of the practice of CSR assurance. 12 For example, Li (2008 and 2010) provides textual analyses of quarterly and annual SEC filings, and Larcker and Zakolyukina (2012) and Frankel, Mayew and Sun (2010) study aspects of the qualitative information in earnings conference calls. Davis and Tama-Sweet (2012) compare tone in the MD&A section of 10-Ks and the concurrent earnings press release.
10
concern rating. Thus, while Cho et al. (2010) find evidence that in 2002, poor environmental performers
biased their environmental disclosures by choosing to use more positive, less certain language to give the
impression of good performance, Arena et al. (2014) find that in the case of oil and gas firms in the late
2000s, the decision to use optimistic language may be an indication of improving environmental
performance.
Huang, Teoh and Zhang (2014) examine the tone of earnings press releases, which are similar to the CSR
reports that we examine in that there is flexibility in what information is included and the way in which it
is communicated. However, earnings press releases are not accompanied by assurance from a third
party.13 Consistent with managers using optimistic tone to mislead investors and bias their perceptions of
firm value upward, Huang et al. (2014) find that an abnormally positive tone in the press releases
increases the probability that the firm will meet or beat past earnings or the analyst consensus forecast of
the current period’s earnings.14 They further show that the stock market appears to over-react to this
positive tone: returns are abnormally high at the press release and then tend to reverse over the next one to
two quarters. Huang et al. (2014) conclude that their evidence is consistent with “… managers us[ing]
tone management to mislead investors and other financial statement users.” (p. 1086)
We extend this prior work by examining how assurance affects the linguistic content of voluntarily
provided CSR reports. Prior studies show that high-quality assurance of financial statements mitigates
managerial opportunism and results in higher quality financial reporting (Becker, DeFond, Jiambalvo and
Subramanyam 1998; Balsam, Krishnan and Yang 2003). Although assurance of non-financial
disclosures, and CSR reports in particular, is still evolving (Eccles, Ioannou and Serafeim 2014), we
expect external assurers to still fulfill a monitoring role and curtail managerial greenwashing and
obfuscation, leading to higher quality reports. As a result, we expect CSR reports that are accompanied by
external assurance to be of higher quality and contain less greenwashing than those that are not. More
specifically, we expect assured CSR reports to contain less optimistic and positively biased language and
less embellishment than unassured CSR reports. We also expect assured CSR reports to exhibit less
discussion of cultural/societal values than unassured CSR reports because it is difficult to ascertain
13 However, if the press release contains annual financial statement details, those details have presumably been verified by the firm’s external auditor. 14 Huang et al. (2014) also show the tone in earnings press releases varies in other predictable ways with managers’ incentives to increase perceptions of firm value. For example, abnormally positive tone increases the likelihood of new equity issuances and M&A activities and decreases the likelihood of employee stock option grants.

11
whether the firm is or is not representing their stated values accurately. Finally, we expect assured CSR
reports to contain less vague (more certain) language than unassured reports. Stated formally:
H2a: The language in assured CSR reports exhibits less optimism than the language in unassured CSR
reports.
H2b: The language in assured CSR reports exhibits less embellishment than the language in unassured
CSR reports.
H2c: The language in assured CSR reports exhibits less discussion of cultural/societal values than the
language in unassured CSR reports.
H2d: The language in assured CSR reports exhibits more certainty than the language in unassured CSR
reports.
We also examine two other aspects of the content of CSR reports: discussion of the firm’s environmental
impact and the use of numerical terms. While optimism, embellishment, cultural/societal values and
certainty measure the subjective or unquantifiable information in the report, measuring the firm’s focus
on its environmental impact and its use of numerical terms gives us some insight into how assurance is
related to the “hard” data in the reports. We expect that firms whose CSR reports have a great deal of
numerical data, such as firms whose reports focus on measurable environmental factors (e.g., greenhouse
gas emissions, water usage), may be more likely to seek external assurance in order to add credibility to
their reported data, suggesting a positive relation between assurance and both the amount of discussion of
the firm’s environmental impact and amount of numerical content of the report. However, it is possible
that once an assurance engagement has begun, assurers may force firms to remove unverifiable data from
the report, suggesting a negative relationship with both constructs. While this adds tension, we argue that
the demand for credible quantifiable information will lead to a positive relation between assurance and
environmental impact discussion as well as the numerical content of the report:
H2e: The language in assured CSR reports focuses more on the firm’s environmental impact than the
language in unassured CSR reports.
12
H2f: The language in assured CSR reports exhibits more numerical terms than the language in unassured
CSR reports.
3. Sample and Methodology.
3.1 Sample Description
To form our sample, we hand-collect CSR report data during the reporting period of 2010 to 2012 from
the corporate websites of S&P 500 firms.15 We then match the report data with financial data from
Compustat and CRSP (Appendix B). None of our sample firms change their disclosure method during
the reporting period that we examine which is likely the result of our focus on S&P 500 firms combined
with a relatively short sample period. Thus, our initial analysis of CSR disclosure practices consists of
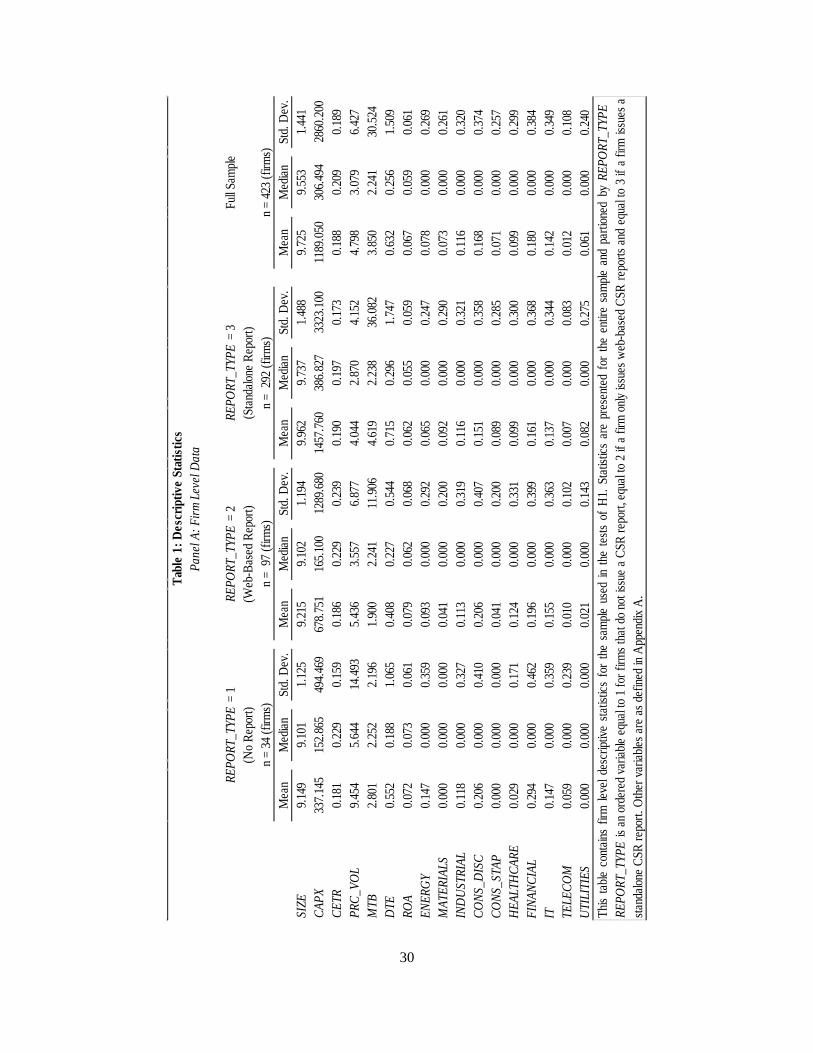
one observation per firm (N = 423). We find significant variation in our sample firms’ disclosure method,
with about 8% providing no CSR disclosure at all.16 Of those that do disclose, 292 or about 69% provide
a standalone report while the remaining 97 or about 23% provide a web-only disclosure. Table 1, Panel A,
contains further descriptive statistics.
For the remainder of our analyses, the sample contains 475 firm-year observations for which all necessary
report-level data is available. We use this sample of firm-year reports when examining report content
(H2). Of the initial 292 firms that issue standalone reports (Table 1, Panel A), we were able to locate a
total of 646 reports (Appendix B) – approximately 2.1 reports per reporting firm during our sample
period, 2010-2012. The number of reports per firm is less than three for a number of reasons. First,
although many firms are moving toward providing annual CSR reports, it is not uncommon for firms to
issue CSR reports biannually. Also, our sample, which was collected in the second quarter of 2013,
contains far fewer 2012 reports than 2010 or 2011 reports.17 This is consistent with our casual
observation during data gathering that many firms do not issue CSR reports until the third or fourth
15 Some studies cited previously have used Corporate Register to collect CSR reports in .pdf format. We chose to hand-gather our sample for two reasons. First, hand-gathering allows us to include web-based CSR disclosures which are not available from Corporate Register. Second, Corporate Register collects only those CSR reports firms voluntarily submit to the site. As a result, hand collection allows us to avoid the additional complications associated with addressing a firm’s incentives to voluntarily submit its CSR reports to the Corporate Register site. 16 We do not include static corporate policies such as a “Code of Conduct” as a CSR disclosure even if they are related to sustainability because they do not include hard data and are not updated frequently. 17 After imposing data restrictions, our final sample includes 192 observations from 2010, 195 from 2011, and 88 from 2012.

13
quarter of the year following the year covered by the report. Table 1, Panel B, contains descriptive
statistics for our sample of reports. As shown in that panel, approximately 18.3% of the reports are
externally assured and nearly 75% appear to be implementing the GRI framework. It is also worth noting
that the average number of CSR reports made available by our sample firms, prior to the start of our
sample period, is approximately 3.5.
3.2 Empirical Models
To examine the determinants of CSR reporting practices, we construct an ordinal variable,
REPORT_TYPE, as a measure of the quality of the firm’s CSR reporting regime. REPORT_TYPE is
coded as one, two, or three if a firm provides no report, a web-only report, or a standalone report,
respectively. We then regress this measure on factors that may affect a firm’s CSR disclosure decision.
Our ordered probit regression is as follows:
REPORT_TYPEi = β0 + β1 + β2SIZEi + β3CAPXi + β4PRC_VOLi + β5CETRi + β6MTBi
+ β7DTEi + β8ROAi + ∑INDi + εi (1)
All variables are described in Appendix A. Consistent with our discussion above, we expect positive
coefficients on our measures of firm size (SIZE) and capital expenditures (CAPX), a negative coefficient
on our measure of firm risk (PRC_VOL) and we make no prediction on the sign of the coefficient on the
firm’s effective tax rate (CETR).18 We measure industry classification using the GICS sector
classification, with IND representing industry indicator variables. To control for growth opportunities, we
include the firm’s market-to-book ratio (MTB). Finally, the firm’s debt ratio (DTE) and financial
performance (ROA) are included to control for financial risk and profitability, respectively.
To examine the relation between the content of standalone CSR reports and the firm’s decision to
voluntarily have the report assured, we construct most of our primary variables of interest using
DICTION, a text-analysis program. Specifically, DICTION uses word lists to create measures of
optimism (the number of optimistic words minus the number of pessimistic words), certainty (the number
18 Our ability to use alternative measures of tax avoidance is severely limited by data availability, even for our S&P 500 firms. Specifically, missing data for foreign taxes paid restricts our ability to identify firms with significant foreign tax expense and our ability to construct a tax shelter score (Lisowsky 2011).

14
of certain words minus the number of uncertain words) and numerical terms. We scale each of these raw
scores by the total number of words in the report to create OPTIMISM, CERTAINTY, and NUMERICAL.
DICTION also uses word lists to create a measure of embellishment (a selective ratio of adjectives to
verbs) and we use this measure to define EMBELLISHMENT which is unscaled because it is computed as
a ratio.19
Finally, we create two additional word lists to better understand the content of the firms’ CSR reports.
The first word list is designed to measure the frequency of the use of words that describe cultural or
societal values and the second is designed to measure the frequency of the use of words that describe the
firm’s environmental impact.20 Again, we scale each of these raw scores by the total number of words in
the report to create CULT_VALUES and ENV_IMPACT. Having constructed these variables, we then
regress our measures on our variable of interest (ASSURED) and controls:
OPTIMISMi,t = β0 + β1ASSUREDi,t + β2HIST_NUM_REPORTSi,t + β3GRIi,t + β4SIZEi,t + β5CAPXit
+ β6CETRi,t + β7PRC_VOLi,t ++ β8MTBi,t + β9DTEi,t + β10ROAi,t + ∑INDi,t + εi,t (2)
EMBELLISHMENTi,t = β0 + β1ASSUREDi,t + β2HIST_NUM_REPORTSi,t + β3GRIi,t + β4SIZEi,t
+ β5CAPXit + β6CETRi,t + β7PRC_VOLi,t ++ β8MTBi,t + β9DTEi,t + β10ROAi,t + ∑INDi,t + εi,t (3)
CULT_VALUESi,t = β0 + β1ASSUREDi,t + β2HIST_NUM_REPORTSi,t + β3GRIi,t + β4SIZEi,t
+ β5CAPXi,t + β6CETRi,t + β7PRC_VOLi,t ++ β8MTBi,t + β9DTEi,t + β10ROAi,t + ∑INDi,t + εi,t (4)
CERTAINTYi,t = β0 + β1ASSUREDi,t + β2HIST_NUM_REPORTSi,t + β3GRIi,t + β4SIZEi,t + β5CAPXi,t
+ β6CETRi,t + β7PRC_VOLi,t ++ β8MTBi,t + β9DTEi,t + β10ROAi,t + ∑INDi,t + εi,t (5)
ENV_IMPACTi,t = β0 + β1ASSUREDi,t + β2HIST_NUM_REPORTSi,t + β3GRIi,t + β4SIZEi,t + β5CAPXi,t
+ β6CETRi,t + β7PRC_VOLi,t ++ β8MTBi,t + β9DTEi,t + β10ROAi,t + ∑INDi,t + εi,t (6)
NUMERICALi,t = β0 + β1ASSUREDi,t + β2HIST_NUM_REPORTSi,t + β3GRIi,t + β4SIZEi,t + β5CAPXi,t
+ β6CETRi,t + β7PRC_VOLi,t ++ β8MTBi,t + β9DTEi,t + β10ROAi,t + ∑INDi,t + εi,t (7)
19 The formal definitions of these DICTION created measures are in Appendix A. 20 Both word lists are provided in Appendix A.
15
ASSURED is an indicator variable equal to 1 if the firm receives any form of external assurance of its
CSR report and zero otherwise. Consistent with hypotheses H2a-H2c, assurance of CSR reports should
be associated with reductions in optimism, embellishment and discussion of cultural values because each
is expected to be greater when the firm engages in greenwashing. Similarly, consistent with hypotheses
H2d-H2f, assurance of CSR reports should be associated with increases in the use of certain language
(less obfuscation), discussion of environmental impacts and the use of numerical terms. As a result, we
expect a negative association of assurance with OPTIMISM, EMBELLISHMENT and CULT_VALUES
and a positive association with CERTAINTY, ENV_IMPACT and NUMERICAL.
In addition to the financial variables discussed above, we also include variables to proxy for CSR
reporting characteristics. HIST_NUM_REPORTS is a hand-collected variable equal to the number of CSR
reports publicly available prior to the start of our sample period. We use this variable to proxy for the
firm’s reporting history. We expect that firms with a longer reporting history will provide higher quality
disclosures (less optimistic bias, more certainty, etc.). We also use DICTION to identify the number of
times each report includes the term “GRI”. While CSR reporting is typically voluntary, many firms
produce (at least part of) their reports in accordance with the Global Reporting Initiative (GRI)
framework. The GRI framework is a set of sustainability reporting standards designed to provide
information on an organization’s “most critical impacts – be they positive or negative – on the
environment, society and the economy” (GRI 2014) and is the most common set of standards used by
firms to guide their CSR reporting. We classify firms mentioning it more than five times as implementing
the GRI framework and expect these firms to provide higher quality disclosures.
4. Results. 4.1. Report Form and Delivery as a Measure of Quality The results of our ordered probit estimation of Equation (1) are presented in Table 2. We find a
statistically significant, positive relation between both firm size (𝑝𝑝 ≤ 0.001) and the level of the firm’s
capital expenditures (𝑝𝑝 ≤ 0.019) and our dependent variable, REPORT_TYPE, consistent with H1a and
H1b, respectively. The results support our arguments that both larger firms and firms undertaking
significant capital projects are more likely to provide higher quality standalone CSR disclosures. We also
find a statistically significant, negative relation between firm risk and CSR disclosure quality (p ≤ 0.000),
consistent with our argument that firms that adopt less risk taking as part of their corporate strategy are
more likely to use higher quality standalone CSR reporting as an additional means to mitigate risk. In

16
contrast, we find no statistically significant relation between effective tax rates and CSR report type (𝑝𝑝 ≤
0.749). We suspect that this may be because we cannot distinguish those firms for which “firm culture”
dominates the report-quality decision from those for which lower costs dominate the decision.
Finally, we find evidence that, to some extent, industry membership is related to CSR reporting quality.
Benchmarked against the consumer discretionary sector, we find that firms in the materials and consumer
staples sectors (sectors that arguably face the greatest public scrutiny) are more likely to provide high
quality CSR disclosure: the coefficients on MATERIALS and CONS_STAP are positive and statistically
significant (𝑝𝑝 ≤ 0.019 and 𝑝𝑝 ≤ 0.043, respectively). We also find that firms in the energy, financial
and telecom sectors are less likely to provide high quality CSR disclosure relative to the consumer
discretionary sector: the coefficients on ENERGY, FINANCIAL and TELECOM are negative and
statistically significant (𝑝𝑝 ≤ 0.009,𝑝𝑝 ≤ 0.009 and 𝑝𝑝 ≤ 0.001 respectively). These results are consistent
with our expectation that firms in these sectors likely face less scrutiny than firms in the consumer
discretionary sector.
Overall, our tests of H1a-H1e indicate that the choice of report delivery format is related to firm-specific
characteristics in ways that suggest that when the benefits of enhancing report quality are high, firms
choose to deliver more “permanent” CSR disclosures that are easier to archive.
4.2. Independent Assurance and Report Content
The results of our regressions testing H2a-f are contained in Tables 3 through 8. In Table 3, we present
the results of our estimation of Equation (2). Consistent with H2a, we find a statistically significant,
negative relation between external assurance and optimism in CSR reports (𝑝𝑝 ≤ 0.021). In Table 4, we
present the results of our estimation of Equation (3). Consistent with H2b, we find a statistically
significant, negative relation between external assurance and embellishment in CSR reports (𝑝𝑝 ≤ 0.002).
These results indicate that assured reports contain more “conservative” language than unassured reports,
and thus are less likely to mislead readers in a manner consistent with greenwashing.
In Table 5, we present the results of our estimation of Equation (4). Consistent with H2c, we find a
statistically significant, negative relation between external assurance and the discussion of
cultural/societal values in CSR reports (𝑝𝑝 ≤ 0.029). This suggests that assured reports contain less
17
discussion of more subjective and hard-to-verify firm policies that could also be used to mislead readers
in a manner consistent with greenwashing
In Table 6, we present our estimation of Equation (5). Consistent with H2d, we find a statistically
significant, positive relation between external assurance and the use of more “certainty” in the language in
the CSR report (𝑝𝑝 ≤ 0.001). In Table 7, we present the estimation of Equation (6). Consistent with H2e,
we find a statistically significant, positive relation between external assurance and the discussion of
environmental impacts in the CSR report (𝑝𝑝 ≤ 0.020). Finally, in Table 8, we present our estimation of
Equation (7). Consistent with H2f, we find a statistically significant, positive relation between external
assurance and the use of numerical terms in the CSR report (𝑝𝑝 ≤ 0.042). Again, we find that external
assurance is associated with content that indicates less greenwashing on the part of the reporting firm:
assured reports tend to contain more concrete language and more “hard” information.
Taken together, the results in Tables 3 through 8 suggest that external assurance is associated with CSR
reports that are more conservative in terms of their language and more focused on providing quantitative
or verifiable information. Thus, we offer the first evidence that external assurers fulfill a monitoring role
and curtail greenwashing in CSR reports.
Before turning to our supplemental analysis, we note that some of the other variables in the regressions in
Tables 3 through 8 offer additional insights into how the contents of standalone CSR reports differ. For
example, we find that the firm’s reporting history (the number of pre-2010 standalone reports available on
the firm’s website) is negatively associated with the use of optimistic words in the current CSR report (p
≤ 0.021) and is positively associated with the use of certain language (p ≤ 0.000) and the use of numerical
terms (p ≤ 0.001) in the current CSR report. These results suggest that firms with a longer history of
providing CSR reports are less likely to engage in greenwashing even after controlling for whether the
report is assured.
Similarly, we find a statistically significant, negative relation between the adoption of the GRI framework
and the number of optimistic words (𝑝𝑝 ≤ 0.001) and embellishment (𝑝𝑝 ≤ 0.009) in the report, but a
statistically significant, positive relation between the adoption of the GRI framework and the use of more
certain words (𝑝𝑝 ≤ 0.001) in CSR reports. These results suggest that firms that adopt the GRI framework
are less likely to engage in greenwashing even after controlling for whether the report is assured.
Interestingly, the adoption of the GRI framework is not associated with the use of numerical terms in the

18
CSR report which suggests that firms that do not adopt the GRI framework substitute numerical terms for
the actual numbers reported in the GRI framework. Adoption of the GRI framework is also not associated
with the discussion of environmental impacts which suggests that firms that do not adopt the GRI
reporting framework substitute discussion of their environmental efforts for the GRI report itself.
Finally, we find limited evidence of industry effects on the content of CSR reports. Specifically, we find
that the HEALTHCARE sector uses more optimistic language in its CSR reports (𝑝𝑝 ≤ 0.027) and the
MATERIALS and UTILITIES sectors use less optimistic language (𝑝𝑝 ≤ 0.044 and 𝑝𝑝 ≤ 0.002,
respectively) when compared to the remaining sectors (ENERGY, INDUSTRIAL, CONS_STAP,
CONS_DISC, FINANCIAL, IT and TELECOM). We also find that all of the sectors discuss
cultural/societal values more than the CONS_DISC and UTILITES sectors. These results offer
preliminary evidence that the form of greenwashing employed may vary across industries.
Overall, the results of our tests of H2a-f provide evidence that external assurance of CSR reports is
positively associated with the quality of these reports as measured by their linguistic content – they
contain less optimistic language, less embellishment, less discussion of cultural/societal values, more
certain language, more discussion of environmental impacts and greater use of numerical terms. Prior
research on the assurance of CSR reports has maintained, but not formally tested, the assumption that
assurance is a “useful control mechanism” and adds to the credibility of the report (Simnett et al.2009,
Casey and Grenier 2015). Our study contributes to the literature by directly testing this assertion and
providing the first evidence of the relationship between external assurance and the quality of CSR reports.
Having found support for the use of external assurance as a reliable proxy for CSR disclosure quality, we
now turn to a further examination of the determinants of the assurance decision.
5. Supplemental Analysis – Drivers of Assurance. Several studies have examined a firm’s decision to purchase independent assurance of its CSR reports and
have attempted to identify firm characteristics associated with the decision. Using an international
sample, Simnett et al. (2009) find that larger firms as well as firms in particular industries and operating
under specific legal regimes are more likely to seek external assurance. Casey and Grenier (2015) conduct
a similar analysis on a sample of U.S. firms, arguing that the U.S. market for CSR assurance is inherently
different than markets in the rest of the world. Although they replicate Simnett et al.’s positive
associations between assurance and both firm size and the mining industry, they do not find an
association with other industry variables and, unlike Simnett et al., they document a negative association

19
between assurance and leverage. In light of these mixed results and based on our examination of
characteristics associated with the firm’s choice of quality for its CSR report, we introduce a number of
additional characteristics that we expect to be associated with the firm’s choice to have its CSR report
assured. Our objective is to shed additional light on this decision.
First, we argue that firms with a longer history of CSR reports archived and available on their websites
will be more likely to have their CSR reports assured. Initiating and developing an effective internal CSR
reporting function is costly and time-consuming. While some aspects of this function may be tangentially
related to other functions within the firm (e.g. financial reporting, marketing, public relations, etc.), the
majority of the necessary skills will be CSR-specific. As such, it is reasonable to expect that firms may
require a few iterations before becoming proficient CSR reporters. Thus, we expect that firms are more
likely to seek external assurance only after they have become comfortable with the proficiency of their
own internal CSR reporting function and are willing to leave an easily accessed history on their websites.
Nike’s 2012 CSR report provides an excellent example:
“We understand the role of external assurance. We have explored third-party assurance and audit systems with leading providers. We continue to review the issue with company management, our internal audit team and other external stakeholders. We still believe we have internal steps to complete before undertaking a robust external review.” [emphasis added]
As such, we hypothesize that firms with a longer history of CSR reports available on their websites will
be more likely to obtain external assurance.
Second, we expect that firms that have adopted the GRI framework will be more likely to seek external
CSR assurance. The GRI framework specifically recommends that reports be externally assured and
rewards those that are with better “grades.” Firms self-report a level of compliance with the GRI
framework and assign themselves a grade – which need not be externally verified. However, firms are
rewarded for obtaining external assurance. The GRI guidance Application Levels and Assurance notes:
“A ‘plus’ (+) is available at each level (ex., C+, B+, A+) if external assurance was utilized for the report”
(GRI, 2011). Further, as with firms with longer histories of CSR reporting, we expect that firms adopting
the GRI framework are likely to face smaller incremental costs to develop an effective internal CSR
reporting infrastructure. As a result, we hypothesize that firms following the GRI reporting framework
are more likely to obtain external assurance.

20
Third, we believe that another possible driver of assurance is the firm’s level of capital expenditures,
which often represents major undertakings that may have significant environmental implications. Also,
unlike some of the other information contained in CSR reports, the firm’s environmental impact is often
quantifiable (e.g., the carbon footprint of a new factory in metric tons). As such, we believe that as firms
undertake these types of projects and report on them, stakeholders will demand assurance of the
quantifiable data in the report. Also, because capital expenditures sometimes represent activities designed
to reduce the firm’s environmental impact, firms engaged in these “green” activities have incentives to
seek external assurance in order to credibly signal that they are socially responsible types (see Bagnoli
and Watts 2016). Finally, as we argued earlier, we expect that firms engaged in higher levels of capital
expenditures take a longer term perspective in their decision-making processes. This longer term
perspective can motivate the firm to not only offer a high quality CSR report but also to enhance its
credibility by having the report assured. For these reasons, we hypothesize that firms with greater capital
expenditures will be more likely to obtain external assurance.
Fourth, insofar as a firm’s effective tax rate proxies for whether it is socially responsible, it should be
related to the decision to purchase CSR assurance. Specifically, if tax-avoiders are socially irresponsible,
it is plausible that the CSR reports produced by these firms are primarily greenwashing and that these
firms will be reluctant to obtain external assurance whereas socially responsible firms use assurance as a
mechanism for signaling their type. Alternatively, if low effective tax rates are associated with significant
business activities in European countries which generally require more CSR disclosure, the incremental
cost to create reports that can be assured is smaller. If so, then we would expect that firms with lower
effective tax rates are more likely to have their CSR reports assured. As a result of this tension between
differences in benefits and costs of external assurance for firms with lower effective tax rates, we do not
make a directional prediction for the relation between a firm’s effective tax rate and the likelihood that it
will obtain external assurance.
To test these hypotheses, we estimate a probit regression of our primary variable of interest, ASSURED,
on our proposed determinants and variables previously found to be associated with the decision to assure
CSR reports:
ASSUREDi,t = β0 + β1HIST_NUM_REPORTSi,t + β2GRIi,t + β3CAPXi,t + β4CETRi,t + β5SIZEi,t
+ β6ROAi,t + β7DTEi,t + β8MTBi,t + β9PRC_VOLi,t + ∑INDi,t + εi,t (8)
21
where ASSURED is an indicator equal to 1 if the firm received any kind of external assurance of its CSR
report during the year and zero otherwise. Other than our proposed determinants, we follow prior research
and include controls for size, profitability (ROA), leverage (DTE) and industry (Simnett et al. 2009; Casey
and Grenier 2015). Finally, we control for growth opportunities (MTB) and firm risk (PRC_VOL).
We present the results of estimating Equation (8) in Table 9. We find statistically significant, positive
coefficients on all four of our proposed drivers of CSR assurance. Specifically, we find that firms with a
longer history of CSR reports archived and available on their websites are more likely to obtain external
assurance (𝑝𝑝 ≤ 0.019), although the marginal effect is relatively small, 1.5%. We also find that firms that
have adopted the GRI framework are much more likely to obtain external assurance (𝑝𝑝 ≤ 0.005). The
marginal effect of GRI in the model is 0.11, suggesting that GRI reporters are 11% more likely to obtain
assurance than non-GRI reporters. Taken together, these results indicate that firms that have experience
producing standalone CSR reports or who have adopted the GRI reporting framework incur lower costs
to, or receive higher benefits from, producing a CSR report of sufficient quality to warrant being assured.
We also find that firms with high levels of capital expenditures are more likely to have their standalone
reports assured (𝑝𝑝 ≤ 0.029). This result suggests that firms with longer planning horizons or that are
more actively investing in socially responsible activities are more likely to choose to have their
standalone CSR reports assured. Finally, we find that firms with higher effective tax rates are more likely
to have their standalone CSR reports assured (𝑝𝑝 ≤ 0.014) and that the marginal effect is quite large,
25.6%. This result is consistent with the idea that firms that either develop a strong culture of social
responsibility or that seek to ``signal’’ that they are socially responsible (Bagnoli and Watts 2016) are
also more likely to have their standalone CSR reports assured.
6. Conclusions. Socially responsible activities and sustainability initiatives are increasingly being included in a firm’s
corporate strategy, and as a result, firms are increasingly motivated to voluntarily provide formal reports
on these activities. However, despite these trends, there remains significant flexibility in corporate social
responsibility (CSR) reporting. Possibly because of the diverse information needs of those demanding
disclosure, no standard, universal requirements for preparing and distributing CSR reports have been

22
widely adopted.21 As a result, CSR report quality likely varies significantly across firms, even when those
firms are large, publicly traded corporations.
In this paper, we study how certain aspects of quality vary across CSR reports produced by different
firms. Specifically, we examine the way in which large, publicly traded firms deliver these reports via
their websites and then, for a subset of the reports, we study how the content of the report varies with
whether or not the report is assured by an independent third party.
Although prior research has examined the decision to provide a CSR report, to our knowledge, this work
has not studied the ways in which the reports are delivered to the public. Firms that provide CSR reports
offer them as either downloadable, standalone files (in a .pdf or similar format) or web pages, sometimes
in the form of a digital magazine. We view the standalone version as essentially permanent, and therefore
higher quality, because it is relatively easy for consumers of the information to retain the content and for a
third party to assure. Web pages or digital magazines, on the other hand, can be updated or changed at
will, making it more difficult to retain an historical record of the content and difficult, as well as risky, to
assure. We hypothesize and find that report delivery varies in systematic ways with firm characteristics.
In particular, larger firms and firms undertaking significant capital expenditures are more likely to
provide standalone CSR reports. This is consistent with prior results on other types of disclosures: larger
firms provide higher quality financial disclosures. It is also consistent with high-capital-expenditure firms
having a longer term outlook and realizing a net benefit from reporting the socially responsible nature of
their capital projects and other activities in a higher quality manner (i.e., through a standalone report).
We further hypothesize and find that less risky firms are more likely to deliver standalone reports,
consistent with our expectation that firms that adopt low risk strategies are more likely to benefit from
higher quality CSR reporting. Finally, we find that there are industry effects associated with the delivery
format choice: firms that are in sectors that face greater public scrutiny (i.e., the materials or consumer
staples sectors) are most likely to offer standalone CSR reports.
For the subset of sample reports that were delivered in the standalone, .pdf format, we expect and find
that the content of the report varies in systematic ways with the presence of third-party assurance of the
21 As mentioned previously, according to EY (2014a), there are numerous private standards, guidelines and frameworks that help companies prepare and report sustainability information. However, as noted in a March 2014 speech by SEC Commissioner Daniel Gallagher, private entities trying to develop standards, guidelines or frameworks “…have no role in the establishment of mandated disclosure requirements” (Allen 2014, emphasis added).

23
report. Specifically, we hypothesize and find that the language in the firm’s CSR report is both less
optimistic (arguably, more conservative), less embellished and more certain when the report is assured.
These results are consistent with the idea that third party assurers verify the firm’s claims and moderate
them, thereby reducing the amount of greenwashing the firm might otherwise engage in. We also
hypothesize and find that cultural/societal values are discussed less frequently in reports that are assured
but that environmental impact is discussed more frequently in those reports when compared to unassured
reports.22 Further, significantly more numerical terms are used in reports that are assured suggesting that
firms opting to have their reports assured are more likely to provide quantifiable content. Taken together,
our results provide the first evidence that third-party assurers fulfill a monitoring role on the content of
CSR reports and curtail greenwashing in them. Interestingly, firms that have a longer history of providing
CSR reports and firms that have adopted the GRI reporting framework are less likely to greenwash even
after controlling for external assurance.
Finally, in supplemental analysis, we offer evidence on the impact of our results on the assurance decision
and extend the prior empirical literature on the decision to assure CSR reports. We hypothesize and find
that firms that have longer standalone CSR report histories available on their web sites, firms that adopt
the GRI reporting framework, and firms that undertake significant capital expenditures are more likely to
have their standalone CSR reports assured. These results are consistent with the idea that firms that
reveal that they have greater experience with CSR reporting or that have adopted the GRI reporting
framework have already incurred more of the costs associated with putting the reporting systems in place
that are required if they wish to seek third party assurance. As a result, these firms face lower incremental
costs of having their CSR reports assured making it more likely that they choose to have the report
assured (consistent with the signaling argument in Bagnoli and Watts 2016).
22 Discussion of cultural/societal values is “soft information” in that it is difficult to accurately assess the firm’s efforts on these dimensions and thus is easier to exaggerate. Environmental impact, on the other hand, is often quantified and therefore easier to verify.
24
References Allen, Ted, 2014. How green are your disclosures, IR update, September: 6-10.
Arena, C., S. Bozzolan, and G. Michelon. 2014. Environmental reporting: transparency to
stakeholders or stakeholders manipulation? An analysis of disclosure tone and the role of the
board of directors. forthcoming, Corporate Social Responsibility and Environmental
Management.
Avi-Yonah, R.S. 2008. Corporate social responsibility and strategic tax behavior. In: Schön, W.
(Ed.), Tax and Corporate Governance. Springer-Verlag, Berlin Heidelberg.
Bagnoli, M., and S. Watts. 2016. Voluntary assurance of voluntary CSR disclosure. Forthcoming, Journal
of Economics & Management Strategy.
Balsam, S., J. Krishnan, and J. Yang. 2003. Auditor industry specialization and earnings quality.
Auditing: A Journal of Practice and Theory 22 (2): 71–97.
Becker, C., M. DeFond, J. Jiambalvo, and K. Subramanyam. 1998. The effect of audit
quality on earnings management. Contemporary Accounting Research 15 (1): 1–24.
Casey, R., and J. Grenier. 2015. Understating and contributing to the enigma of corporate
social responsibility (CSR) assurance in the United States. Auditing: A Journal of
Practice and Theory 34(1): 97–130.
Cho, C., R. Roberts, and D. Patten. 2010. The language of US corporate environmental
disclosure. Accounting, Organizations and Society 35 (4): 431–443.
Davis, A., D. Guenther, L. Krull and B. Williams. 2016. Do socially responsible firms pay more taxes?
forthcoming The Accounting Review.
Davis, A., and I. Tama-Sweet. 2012. Managers’ use of language across alternative disclosure
outlets: Earnings press releases versus MD&A. Contemporary Accounting Research 29 (3):
804–837.
Deegan, C., and M. Rankin. 1996. Do Australian companies report environmental news
objectively? An analysis of environmental disclosures by firms prosecuted successfully
the Environmental Protection Authority. Accounting, Auditing and Accountability
Journal, 9 (2), 50–67.
Deegan, C., M. Rankin, and J. Tobin. 2002. An examination of the corporate social and
environmental disclosures of BHP from 1983–1997. Accounting, Auditing &
Accountability Journal 15 (3): 312–343.
Desai, M. and D. Dharmapala. 2006. Corporate tax avoidance and high-powered incentives.
Journal of Financial Economics 79 (1): 145–79.
25
Dhaliwal, D.S., O.Z. Li, A. Tsang, and Y.G. Yang. 2011. Voluntary nonfinancial disclosure and
the cost of equity capital: The initiation of corporate social responsibility reporting. The
Accounting Review 86 (1): 59–100.
Dhaliwal, D. S., S. Radhakrishnan, A. Tsang, and Y. G. Yang. 2012. Nonfinancial disclosure and
analyst forecast accuracy: International evidence on corporate social responsibility
disclosure. The Accounting Review 87 (3): 723–759.
Eccles, R., Ioannou, I., and G. Serafeim. 2014. The impact of corporate sustainability on
organizational processes and performance. Management Science 60 (11): 2835-2857.
EY. 2014a. Sustainability reporting – the time is now. Ernst and Young Global Limited.
EY, 2014b. Value of sustainability reporting. Ernst and Young Global Limited.
Frankel, R., W. Mayew, and Y. Sun. 2010. Do pennies matter? Investor relations consequences
of small negative earnings surprises. Review of Accounting Studies 15 (1): 220–242.
Gallagher, D. 2014. Remarks at the 26th Annual Corporate Law Institute, Tulane University
Law School: Federal Preemption of State Corporate Governance. New Orleans, LA. 27
March 2014. Available at: http://www.sec.gov/News/Speech/Detail/Speech/1370541315952
GRI. 2014. G4 Sustainability Reporting Guidelines.
https://www.globalreporting.org/standards/g4/Pages/default.aspx
Hanlon, M. and S. Heitzman. 2010. A review of tax research. Journal of Accounting and
Economics 50 (2–3): 127–78.
Hoi, C. K., Q. Wu, and H. Zhang. 2013. Is corporate social responsibility (CSR) associated with
tax avoidance? Evidence from irresponsible CSR activities. The Accounting Review 88 (6): 2025–
2059.
Hopwood, A. 2009. Accounting and the environment. Accounting, Organizations and Society 34
(3-4): 433–439.
Huang, X., S. Teoh S., and Y. Zhang. Tone Management. The Accounting Review 89 (3):
1083–1113
KPMG. 2013. The KPMG Survey of Corporate Social Responsibility Reporting 2013.
KPMG International Cooperative 2013.
Lang, M., and R. Lundholm. 1993. Cross-sectional determinants of analyst ratings of corporate
disclosures. Journal of Accounting Research 31 (2): 246–271.
Lanis, R. and G. Richardson. 2011. The effect of board of director composition on corporate tax
aggressiveness. Journal of Accounting and Public Policy 30 (1): 50–70.

26
Larcker, D., and A. Zakolyukina. 2012. Detecting deceptive discussions in conference calls.
Journal of Accounting Research 50 (2): 495–540.
Li, F. 2008. Annual report readability, current earnings, and earnings persistence. Journal of
Accounting and Economics 45 (2-3): 221–247.
Li, F. 2010. Textual analysis of corporate disclosures: A survey of the literature. Journal of
Accounting Literature 29 (2010): 143-165.
Lisowsky, P. 2011. Seeking shelter: empirically modeling tax shelters using financial statement
information. The Accounting Review 85 (5): 1693-1720.
Lyon, T., and J. Maxwell. 2011. Greenwash: Corporate environmental disclosure under threat of
audit. Journal of Economics & Management Strategy, 20 (1), 3–41.
Lyon, T., and A. Montgomery. 2013. Tweetjacked: the impact of social media on corporate
greenwash. Journal of Business Ethics 118 (4): 747-757.
Lys, T., J. Naughton and C. Wang, 2015. Signaling through corporate accountability reporting.
Journal of Accounting and Economics 60 (1): 56-72.
Mahoney, L., L. Thorne, L. Cecil and W. LaGore, 2013. A research note on standalone
corporate social responsibility reports: signaling or greenwashing? Critical
Perspectives on Accounting 24 (4-5): 350-359.
Naughton, J., C. Wang and I. Yeung. 2015. Are CSR expenditures affected by investor sentiment?
Working paper Northwestern University.
O’Dwyer, B. 2011. The case of sustainability assurance: constructing a new assurance service.
Contemporary Accounting Research 28 (4): 1230–1266.
Simnett, R., A. Vanstraelen, and W. F. Chua. 2009. Assurance on sustainability reports: an
international comparison. The Accounting Review 84 (3): 937–967.

27
Appendix A: Variable Descriptions ASSURED: An indicator variable equal to one if the firm receives external assurance of its CSR report and zero otherwise (Hand-collected) CAPX: Capital Expenditures (CAPX) (from Compustat) CERTAINTY: The number of certain words minus the number of uncertain words, scaled by the total number of words in the report as defined by DICTION. (Collected via DICTION) CETR: Three-year cash effective tax rate. Calculated as the three-year sum of cash taxes paid (TXPD) divided by pretax income (PI) less special items (SPI) over the same period (from Compustat) CULT_VALUES: The number of words that describe cultural or societal values, scaled by the total number of words in the report.23 (Collected via DICTION) DTE: Total debt (DLTT + DLC) divided by book value of equity (CEQ) (from Compustat) EMBELLISHMENT: The ratio of adjectives to verbs as defined by DICTION. (Collected via DICTION) ENV_IMPACT: The number of words that describe environmental or sustainable activities, scaled by the total number of words in the report.24 (Collected via DICTION) GRI: An indicator variable equal to one if the firm’s CSR report includes the term “GRI” more than five times. (Collected via DICTION) HIST_NUM_REPORTS: The number of prior years’ CSR reports publicly available. (Hand-collected) IND: GICS Industry Indicators: ENERGY, MATERIALS, INDUSTRIAL, CONS_DISC, CONS_STAP, HEALTHCARE, FINANCIAL, IT, TELECOM, UTILITIES (from Compustat) MTB: Market value of equity (CSHFD * PRCC_F) divided by book value of equity (CEQ) (from Compustat) NUMERICAL: The number of numerical terms in the report scaled by the total number of words in the report as defined by DICTION. (Collected via DICTION) OPTIMISM: The number of positive words minus the number of negative words, scaled by the total number of words in the report as defined by DICTION. (Collected via DICTION) 23 The word list used is: Assistance, Benefits, Compensation, Discrimination, Diversity, Education, Emotional, Employees, Equality, Ethnic, Flextime, Health, Inclusion, Labor, Labour, LGBT, LGBTQ, Mental, Minorities, Nutrition, OSHA, Racial, Retention, Safety, Telecommute, Training, Wage, Wellness, Whistle-blower, Women and Work-Life. 24 The word list used is: By-product, Carbon, Clean, Climate, CO2, Conflict, Conservation, Conserve, Consumption, Development, Dioxide, EHS, Emissions, Energy, Environment, Footprint, GHG, Green, Greenhouse, LEED, Pollution, Recycle, Recycled, Recycling, Renewable, Reuse, Solar, Stewardship, Sustainability, Sustainable, Waste and Water.

28
PRC_VOL: Standard deviation of share price during the year (from CRSP) ROA: Net income (NI) divided by total assets (AT) (from Compustat) REPORT_TYPE: An ordered variable equal to one if the firm provides no CSR report, two if the firm issues only a web-based report, and three if the firm issues a permanent report. (Hand-collected) SIZE: The natural log of total assets (AT) (from Compustat)

29
Appendix B: Sample Selection
Firm Level Data
Firms with necessary financial data 462 Less: 3-year loss firms (14) Less: Firms missing price volatility data (CRSP) (25) Total number of firm observations 423
Firm-Year Level Data Initial number of collected reports 646 Less: Reports unreadable by Diction (32) Less: Firm-years missing financial data (Compustat) (91) Less: 3-year loss firm-years (28) Less: Firm-years missing price volatility data (CRSP) (20) Total number of firm-year observations 475
30
Mea
nM
edian
Std.
Dev.
Mea
nM
edian
Std.
Dev.
Mea
nM
edian
Std.
Dev.
Mea
nM
edian
Std.
Dev.
SIZE
9.149
9.101
1.125
9.215
9.102
1.194
9.962
9.737
1.488
9.725
9.553
1.441
CAPX
337.1
4515
2.865
494.4
6967
8.751
165.1
0012
89.68
014
57.76
038
6.827
3323
.100
1189
.050
306.4
9428
60.20
0CE
TR0.1
810.2
290.1
590.1
860.2
290.2
390.1
900.1
970.1
730.1
880.2
090.1
89PR
C_VO
L9.4
545.6
4414
.493
5.436
3.557
6.877
4.044
2.870
4.152
4.798
3.079
6.427
MTB
2.801
2.252
2.196
1.900
2.241
11.90
64.6
192.2
3836
.082
3.850
2.241
30.52
4DT
E0.5
520.1
881.0
650.4
080.2
270.5
440.7
150.2
961.7
470.6
320.2
561.5
09RO
A0.0
720.0
730.0
610.0
790.0
620.0
680.0
620.0
550.0
590.0
670.0
590.0
61EN
ERGY
0.147
0.000
0.359
0.093
0.000
0.292
0.065
0.000
0.247
0.078
0.000
0.269
MAT
ERIA
LS0.0
000.0
000.0
000.0
410.0
000.2
000.0
920.0
000.2
900.0
730.0
000.2
61IN
DUST
RIAL
0.118
0.000
0.327
0.113
0.000
0.319
0.116
0.000
0.321
0.116
0.000
0.320
CONS
_DIS
C0.2
060.0
000.4
100.2
060.0
000.4
070.1
510.0
000.3
580.1
680.0
000.3
74CO
NS_S
TAP
0.000
0.000
0.000
0.041
0.000
0.200
0.089
0.000
0.285
0.071
0.000
0.257
HEAL
THCA
RE0.0
290.0
000.1
710.1
240.0
000.3
310.0
990.0
000.3
000.0
990.0
000.2
99FI
NANC
IAL
0.294
0.000
0.462
0.196
0.000
0.399
0.161
0.000
0.368
0.180
0.000
0.384
IT0.1
470.0
000.3
590.1
550.0
000.3
630.1
370.0
000.3
440.1
420.0
000.3
49TE
LECO
M0.0
590.0
000.2
390.0
100.0
000.1
020.0
070.0
000.0
830.0
120.0
000.1
08UT
ILIT
IES
0.000
0.000
0.000
0.021
0.000
0.143
0.082
0.000
0.275
0.061
0.000
0.240
This
table
conta
insfir
mlev
elde
scrip
tive
statis
tics
fort
hesa
mple
used
inthe
tests
ofH1
.Stat
istics
are
pres
ented
fort
heen
tire
samp
lean
dpa
rtion
edby
REPO
RT_T
YPE
RE
PORT
_TYP
Eis
anor
dere
dvar
iable
equa
lto1f
orfir
mstha
tdon
otiss
ueaC
SRre
port,
equa
lto2i
fafir
mon
lyiss
uesw
eb-b
ased
CSR
repo
rtsan
deq
ualto
3ifa
firm
issue
sasta
ndalo
ne C
SR re
port.
Othe
r var
iables
are a
s def
ined i
n App
endix
A.
REPO
RT_T
YPE
= 3
n = 2
92 (f
irms)
Full S
ample
n = 42
3 (fir
ms)
Tabl
e 1:
Des
crip
tive
Stat
istics
n = 34
(firm
s)
REPO
RT_T
YPE
= 1
REPO
RT_T
YPE
= 2
n = 9
7 (fir
ms)
Pane
l A: F
irm L
evel
Data
(No R
epor
t)(W
eb-B
ased
Rep
ort)
(Stan
dalon
e Rep
ort)

31
Table 1: Descriptive Statistics Panel B: Firm-Year Data
(n= 475 firm-years) Mean Median Std. Dev. ASSURED 0.183 0.000 0.387 GRI 0.749 1.000 0.434 HIST_NUM_REPORTS 3.467 3.000 2.468 OPTIMISM 0.012 0.009 0.012 EMBELLISHMENT 0.399 0.380 0.165 CULT_VALUES 0.013 0.013 0.006 CERTAINTY 0.299 0.262 0.221 ENV_IMPACT 0.023 0.020 0.014 NUMERICAL 0.060 0.056 0.026 SIZE 9.965 9.769 1.391 CAPX 1448.260 474.000 3371.000 CETR 0.210 0.207 0.163 PRC_VOL 4.932 3.114 7.257 MTB 4.434 2.293 36.534 DTE 0.579 0.277 1.175 ROA 0.064 0.059 0.059 ENERGY 0.063 0.000 0.244 MATERIALS 0.093 0.000 0.290 INDUSTRIAL 0.139 0.000 0.346 CONS_DISC 0.126 0.000 0.333 CONS_STAP 0.103 0.000 0.304 HEALTHCARE 0.109 0.000 0.313 FINANCIAL 0.133 0.000 0.340 IT 0.128 0.000 0.335 TELECOM 0.008 0.000 0.091 UTILITIES 0.097 0.000 0.296
This table contains firm-year descriptive statistics for the sample of standalone reports used in the tests of H2 (2010-2012). ASSURED is an indicator variable equal to one if a firm receives independent assurance of its CSR report that year and zero otherwise. Other variables are as defined in Appendix A.

32
Table 2: Determinants of Report Type
Results of Ordered Probit Model
Variable Pred. Sign
Estimate Std. Error z Pr>|z| Cutoff 1 0.874 0.657 Cutoff 2 1.979 0.659 SIZE + 0.276 0.071 3.87 <0.001 CAPX + 0.000 0.000 2.09 0.019 PRC_VOL - -0.038 0.011 -3.56 0.000 CETR ? -0.114 0.355 -0.32 0.749 MTB 0.004 0.007 0.55 0.584 DTE 0.000 0.063 0.01 0.995 ROA 0.102 1.253 0.08 0.935 ENERGY -0.745 0.285 -2.61 0.009 MATERIALS 0.781 0.333 2.34 0.019 INDUSTRIAL 0.058 0.241 0.24 0.811 CONS_STAP 0.700 0.346 2.02 0.043 HEALTHCARE 0.121 0.255 0.47 0.636 FINANCIAL -0.642 0.247 -2.6 0.009 IT -0.042 0.225 -0.19 0.850 TELECOM -2.346 0.709 -3.31 0.001 UTILITIES 0.495 0.415 1.19 0.234 n (firms) 423 Pseudo R2 0.1444 This table presents the results of an ordered probit regression of Equation (1). The dependent variable, REPORT_TYPE, is an ordered variable equal to one for firms that do not issue a CSR report, equal to two if a firm only issues web-based CSR reports and equal to three if a firm issues a standalone CSR report. Other variables are defined in Appendix A. One-tailed significance is reported for hypothesized relationships (two-tailed otherwise)

33
Table 3: Determinants of Content - Optimism
Results of OLS Model
Variable Pred. Sign Estimate Std Error t Value Pr > |t|
Intercept 0.0233 0.0051 4.60 <0.001 ASSURED - -0.0028 0.0014 -2.04 0.021 HIST_NUM_REPORTS -0.0005 0.0002 -2.32 0.021 GRI -0.0098 0.0012 -8.21 <0.001 SIZE 0.0002 0.0005 0.37 0.712 CAPX 0.0000 0.0000 -0.66 0.512 CETR 0.0004 0.0032 0.11 0.909 PRC_VOL 0.0000 0.0001 -0.41 0.679 MTB 0.0000 0.0000 -0.19 0.847 DTE -0.0008 0.0005 -1.49 0.138 ROA -0.0244 0.0098 -2.50 0.013 ENERGY 0.0012 0.0027 0.44 0.657 MATERIALS -0.0044 0.0022 -2.02 0.044 INDUSTRIAL -0.0023 0.0020 -1.19 0.235 CONS_STAP -0.0003 0.0021 -0.14 0.891 HEALTHCARE 0.0046 0.0021 2.21 0.027 FINANCIAL -0.0027 0.0024 -1.15 0.251 IT 0.0005 0.0020 0.26 0.793 TELECOM -0.0076 0.0066 -1.16 0.248 UTILITIES -0.0072 0.0023 -3.15 0.002 n (reports) 475 Adj R2 0.2081 This table presents the results of an OLS regression of Equation (2). The dependent variable, OPTIMISM, is defined as the number of positive words in the report minus the number of negative words, scaled by the total number of words in the report. Other variables are as defined in Appendix A. One-tailed significance is reported for hypothesized relationships (two-tailed otherwise).

34
Table 4: Determinants of Content - Embellishment Results of OLS Model
Variable Pred. Sign Estimate Std Error t Value Pr > |t|
Intercept 0.4189 0.0745 5.62 <0.001 ASSURED - -0.0564 0.0199 -2.84 0.002 HIST_NUM_REPORTS -0.0047 0.0033 -1.44 0.151 GRI -0.0457 0.0176 -2.60 0.009 SIZE 0.0052 0.0080 0.66 0.511 CAPX 0.0000 0.0000 -1.33 0.183 CETR 0.0349 0.0472 0.74 0.460 PRC_VOL -0.0011 0.0010 -1.10 0.272 MTB 0.0000 0.0002 0.02 0.983 DTE 0.0013 0.0077 0.17 0.863 ROA -0.1433 0.1437 -1.00 0.319 ENERGY 0.1174 0.0399 2.94 0.003 MATERIALS -0.0551 0.0319 -1.73 0.084 INDUSTRIAL 0.0139 0.0287 0.49 0.628 CONS_STAP 0.0147 0.0308 0.48 0.634 HEALTHCARE -0.0339 0.0304 -1.12 0.265 FINANCIAL 0.0264 0.0348 0.76 0.448 IT 0.0014 0.0295 0.05 0.962 TELECOM 0.0465 0.0972 0.48 0.633 UTILITIES -0.0458 0.0337 -1.36 0.175 n (reports) 475
Adj R2 0.0809 This table presents the results of an OLS regression of Equation (3). The dependent variable, EMBELLISH, is equal to each report's "embellishment" score, as calculated by Diction. Other variables are as defined in Appendix A. One-tailed significance is reported for hypothesized relationships (two-tailed otherwise).
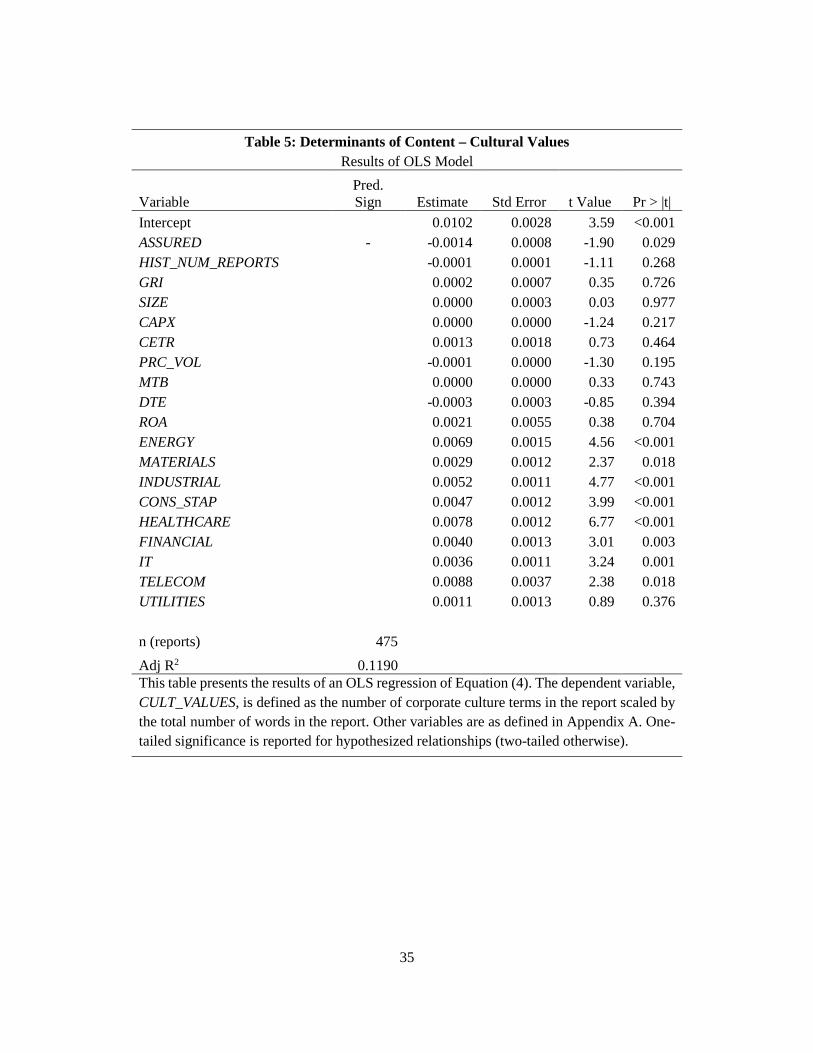
35
Table 5: Determinants of Content – Cultural Values Results of OLS Model
Variable Pred. Sign Estimate Std Error t Value Pr > |t|
Intercept 0.0102 0.0028 3.59 <0.001 ASSURED - -0.0014 0.0008 -1.90 0.029 HIST_NUM_REPORTS -0.0001 0.0001 -1.11 0.268 GRI 0.0002 0.0007 0.35 0.726 SIZE 0.0000 0.0003 0.03 0.977 CAPX 0.0000 0.0000 -1.24 0.217 CETR 0.0013 0.0018 0.73 0.464 PRC_VOL -0.0001 0.0000 -1.30 0.195 MTB 0.0000 0.0000 0.33 0.743 DTE -0.0003 0.0003 -0.85 0.394 ROA 0.0021 0.0055 0.38 0.704 ENERGY 0.0069 0.0015 4.56 <0.001 MATERIALS 0.0029 0.0012 2.37 0.018 INDUSTRIAL 0.0052 0.0011 4.77 <0.001 CONS_STAP 0.0047 0.0012 3.99 <0.001 HEALTHCARE 0.0078 0.0012 6.77 <0.001 FINANCIAL 0.0040 0.0013 3.01 0.003 IT 0.0036 0.0011 3.24 0.001 TELECOM 0.0088 0.0037 2.38 0.018 UTILITIES 0.0011 0.0013 0.89 0.376 n (reports) 475
Adj R2 0.1190 This table presents the results of an OLS regression of Equation (4). The dependent variable, CULT_VALUES, is defined as the number of corporate culture terms in the report scaled by the total number of words in the report. Other variables are as defined in Appendix A. One-tailed significance is reported for hypothesized relationships (two-tailed otherwise).
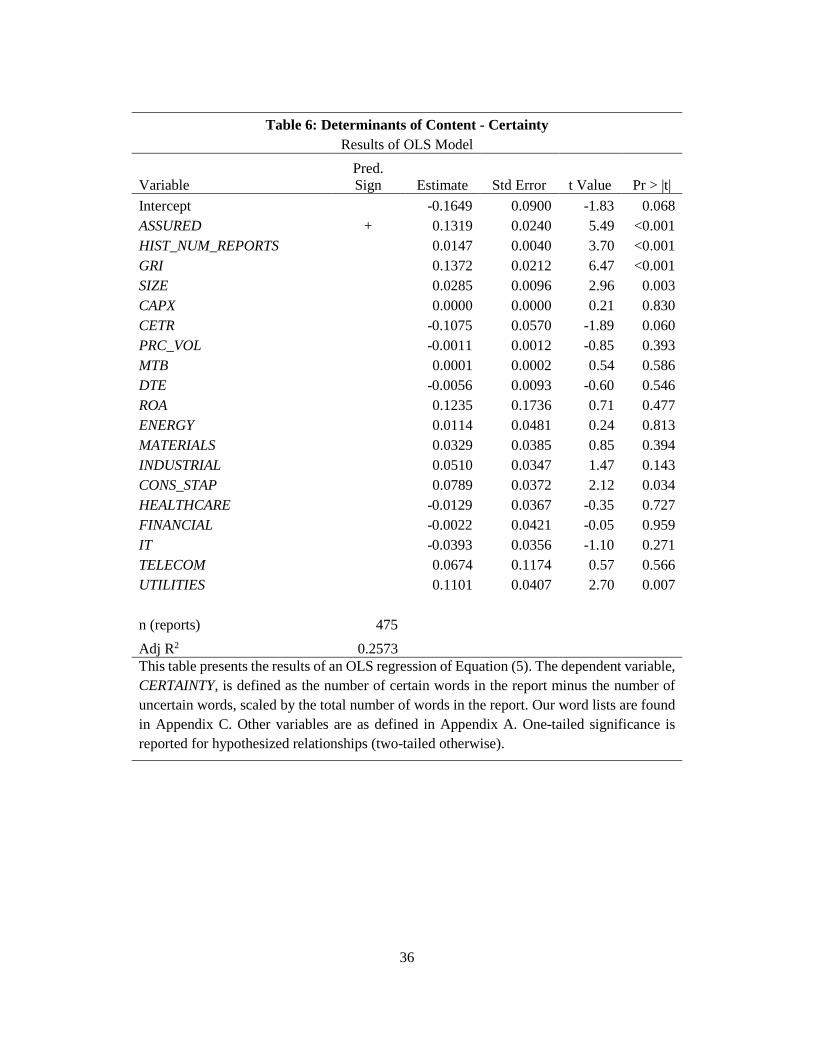
36
Table 6: Determinants of Content - Certainty
Results of OLS Model
Variable Pred. Sign Estimate Std Error t Value Pr > |t|
Intercept -0.1649 0.0900 -1.83 0.068 ASSURED + 0.1319 0.0240 5.49 <0.001 HIST_NUM_REPORTS 0.0147 0.0040 3.70 <0.001 GRI 0.1372 0.0212 6.47 <0.001 SIZE 0.0285 0.0096 2.96 0.003 CAPX 0.0000 0.0000 0.21 0.830 CETR -0.1075 0.0570 -1.89 0.060 PRC_VOL -0.0011 0.0012 -0.85 0.393 MTB 0.0001 0.0002 0.54 0.586 DTE -0.0056 0.0093 -0.60 0.546 ROA 0.1235 0.1736 0.71 0.477 ENERGY 0.0114 0.0481 0.24 0.813 MATERIALS 0.0329 0.0385 0.85 0.394 INDUSTRIAL 0.0510 0.0347 1.47 0.143 CONS_STAP 0.0789 0.0372 2.12 0.034 HEALTHCARE -0.0129 0.0367 -0.35 0.727 FINANCIAL -0.0022 0.0421 -0.05 0.959 IT -0.0393 0.0356 -1.10 0.271 TELECOM 0.0674 0.1174 0.57 0.566 UTILITIES 0.1101 0.0407 2.70 0.007 n (reports) 475
Adj R2 0.2573 This table presents the results of an OLS regression of Equation (5). The dependent variable, CERTAINTY, is defined as the number of certain words in the report minus the number of uncertain words, scaled by the total number of words in the report. Our word lists are found in Appendix C. Other variables are as defined in Appendix A. One-tailed significance is reported for hypothesized relationships (two-tailed otherwise).
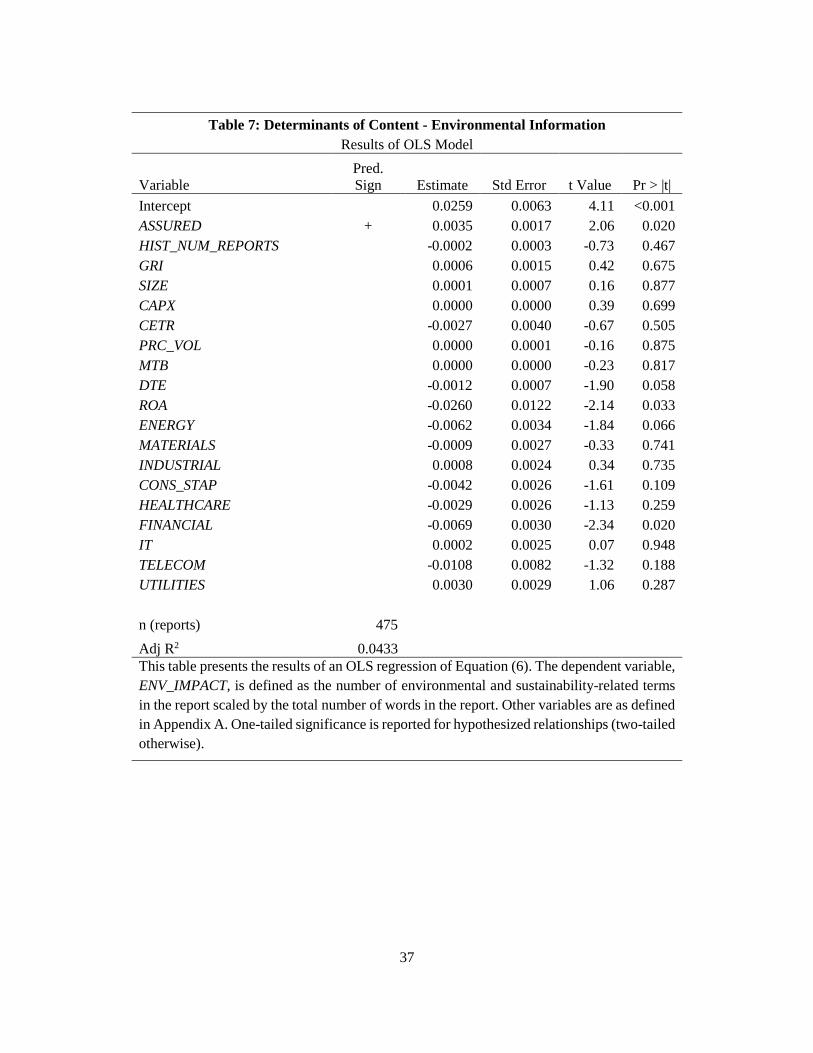
37
Table 7: Determinants of Content - Environmental Information
Results of OLS Model
Variable Pred. Sign Estimate Std Error t Value Pr > |t|
Intercept 0.0259 0.0063 4.11 <0.001 ASSURED + 0.0035 0.0017 2.06 0.020 HIST_NUM_REPORTS -0.0002 0.0003 -0.73 0.467 GRI 0.0006 0.0015 0.42 0.675 SIZE 0.0001 0.0007 0.16 0.877 CAPX 0.0000 0.0000 0.39 0.699 CETR -0.0027 0.0040 -0.67 0.505 PRC_VOL 0.0000 0.0001 -0.16 0.875 MTB 0.0000 0.0000 -0.23 0.817 DTE -0.0012 0.0007 -1.90 0.058 ROA -0.0260 0.0122 -2.14 0.033 ENERGY -0.0062 0.0034 -1.84 0.066 MATERIALS -0.0009 0.0027 -0.33 0.741 INDUSTRIAL 0.0008 0.0024 0.34 0.735 CONS_STAP -0.0042 0.0026 -1.61 0.109 HEALTHCARE -0.0029 0.0026 -1.13 0.259 FINANCIAL -0.0069 0.0030 -2.34 0.020 IT 0.0002 0.0025 0.07 0.948 TELECOM -0.0108 0.0082 -1.32 0.188 UTILITIES 0.0030 0.0029 1.06 0.287 n (reports) 475
Adj R2 0.0433 This table presents the results of an OLS regression of Equation (6). The dependent variable, ENV_IMPACT, is defined as the number of environmental and sustainability-related terms in the report scaled by the total number of words in the report. Other variables are as defined in Appendix A. One-tailed significance is reported for hypothesized relationships (two-tailed otherwise).

38
Table 8: Determinants of Content - Numerical Terms
Results of OLS Model
Variable Pred. Sign Estimate Std Error t Value Pr > |t|
Intercept 0.0307 0.0116 2.65 0.008 ASSURED + 0.0054 0.0031 1.74 0.042 HIST_NUM_REPORTS 0.0017 0.0005 3.30 0.001 GRI -0.0007 0.0027 -0.25 0.802 SIZE 0.0020 0.0012 1.62 0.106 CAPX 0.0000 0.0000 0.34 0.736 CETR -0.0056 0.0073 -0.76 0.449 PRC_VOL 0.0000 0.0002 -0.27 0.789 MTB 0.0000 0.0000 -0.18 0.856 DTE -0.0002 0.0012 -0.20 0.845 ROA 0.0186 0.0223 0.83 0.406 ENERGY 0.0031 0.0062 0.50 0.620 MATERIALS 0.0165 0.0050 3.34 0.001 INDUSTRIAL 0.0025 0.0045 0.56 0.575 CONS_STAP 0.0016 0.0048 0.33 0.742 HEALTHCARE 0.0031 0.0047 0.65 0.518 FINANCIAL -0.0059 0.0054 -1.08 0.279 IT 0.0054 0.0046 1.18 0.240 TELECOM 0.0040 0.0151 0.27 0.791 UTILITIES 0.0103 0.0052 1.97 0.049 n (reports) 475
Adj R2 0.0767 This table presents the results of an OLS regression of Equation (7). The dependent variable, NUMERICAL, is defined as the number of numerical terms in the report scaled by the total number of words in the report. Other variables are as defined in Appendix A. One-tailed significance is reported for hypothesized relationships (two-tailed otherwise).
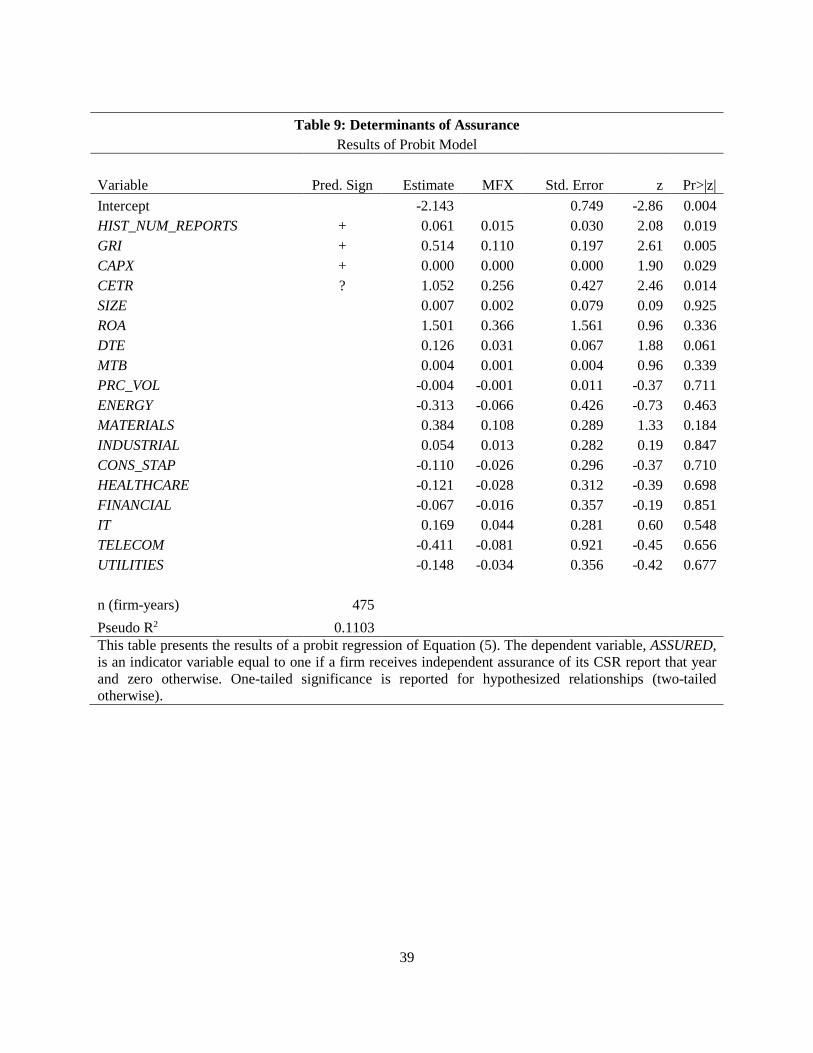
39
Table 9: Determinants of Assurance
Results of Probit Model
Variable Pred. Sign Estimate MFX Std. Error z Pr>|z| Intercept -2.143 0.749 -2.86 0.004 HIST_NUM_REPORTS + 0.061 0.015 0.030 2.08 0.019 GRI + 0.514 0.110 0.197 2.61 0.005 CAPX + 0.000 0.000 0.000 1.90 0.029 CETR ? 1.052 0.256 0.427 2.46 0.014 SIZE 0.007 0.002 0.079 0.09 0.925 ROA 1.501 0.366 1.561 0.96 0.336 DTE 0.126 0.031 0.067 1.88 0.061 MTB 0.004 0.001 0.004 0.96 0.339 PRC_VOL -0.004 -0.001 0.011 -0.37 0.711 ENERGY -0.313 -0.066 0.426 -0.73 0.463 MATERIALS 0.384 0.108 0.289 1.33 0.184 INDUSTRIAL 0.054 0.013 0.282 0.19 0.847 CONS_STAP -0.110 -0.026 0.296 -0.37 0.710 HEALTHCARE -0.121 -0.028 0.312 -0.39 0.698 FINANCIAL -0.067 -0.016 0.357 -0.19 0.851 IT 0.169 0.044 0.281 0.60 0.548 TELECOM -0.411 -0.081 0.921 -0.45 0.656 UTILITIES -0.148 -0.034 0.356 -0.42 0.677 n (firm-years) 475 Pseudo R2 0.1103 This table presents the results of a probit regression of Equation (5). The dependent variable, ASSURED, is an indicator variable equal to one if a firm receives independent assurance of its CSR report that year and zero otherwise. One-tailed significance is reported for hypothesized relationships (two-tailed otherwise).