norwegian economy by per-kristian foss member of the norwegian parliament the conservative party...
TRANSCRIPT

Norwegian economy
By Per-Kristian Foss
Member of the Norwegian Parliament
The Conservative Party Parliamentary Group

GDP growth
100
105
110
115
120
125
130
135
140Q
4-19
99
Q4-
2000
Q4-
2001
Q4-
2002
Q4-
2003
Q4-
2004
Q4-
2005
Q4-
2006
Q4-
2007
Q4-
2008
Q4-
2009
Q4-
2010
Q4-
2011
Mainland Norway
OECD
Norway
EU 27
Sources: OECD and Statistics Norway

Unemployment rates
0
2
4
6
8
10
12Q
4-19
99
Q4-
2000
Q4-
2001
Q4-
2002
Q4-
2003
Q4-
2004
Q4-
2005
Q4-
2006
Q4-
2007
Q4-
2008
Q4-
2009
Q4-
2010
Q4-
2011
OECD - Europe
United States
OECD - Total
Norway
Source: OECD

Government Pension Fund Global
• NOK 3 378 billion (€ 450 billion)• Probably largest SWF in the world since 2011
The fund's market value per quarter at the end of September 2011. Billions of NOK
Source: Norges Bank Investment Management
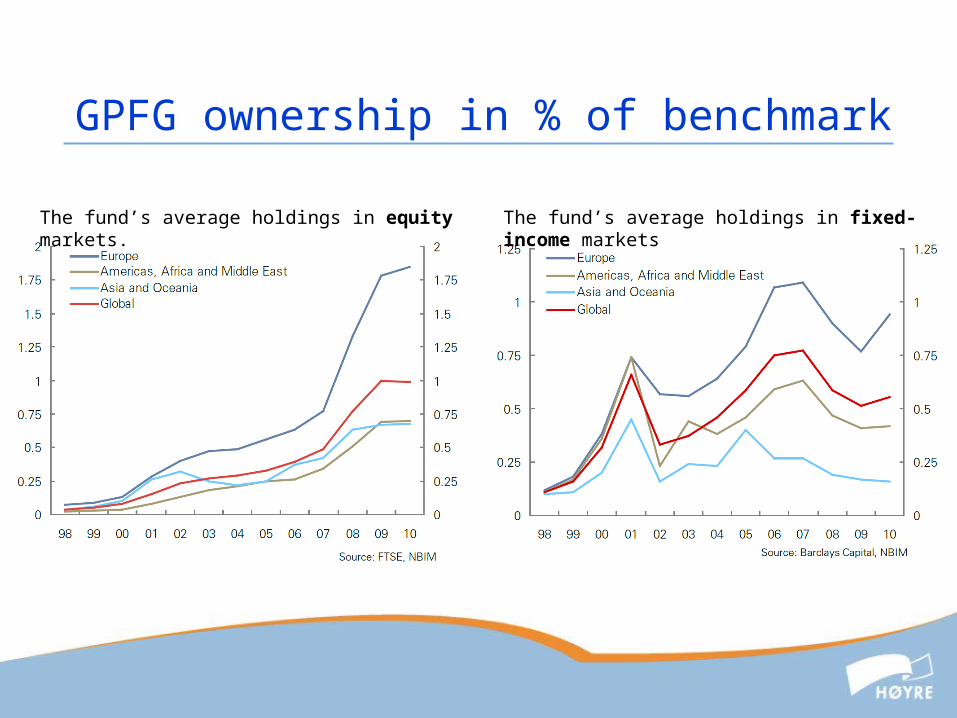
GPFG ownership in % of benchmark
The fund’s average holdings in equity markets. The fund’s average holdings in fixed-income markets

Employment rate
% of population, age 15-64
75.3 %
Source: Eurostat

Female employment rate
% of population, age 15-64
73.3 %
Source: Eurostat

Fertility rate
1.77
1.91
2.08
1.89
1.67
1.73
2.01
1.48
1.41 1.31
1.40
1.47 1.41
1.27
1.511.39
1.44
1.331.27
1.27
1.29
1.30
1.381.41
1.31
1.43
1.65
1.781.77
1.74
Source: CIA World Factbook

Balance in public finances
Source: Eurostat
Net borrowing or lending of consolidated general government sector, % of GDP
-20
-15
-10
-5
0
5
10
EU
-27
Eur
o a
rea
Est
oni
a
Sw
ede
n
Luxe
mbo
urg
Fin
land
Den
mar
k
Bul
gari
a
Mal
ta
Bel
gium
Hun
gary
Ger
ma
ny
Aus
tria
Ital
y
Cze
ch R
epu
blic
Net
herla
nds
Cyp
rus
Slo
ven
ia
Rom
ania
Lith
uani
a
Fra
nce
Slo
vak
ia
Pol
and
Latv
ia
Spa
in
Por
tuga
l
Uni
ted
Kin
gdom
Gre
ece
Irel
and
Nor
way
Cro
atia
Turk
ey
Icel
and
2009 2010
Threshold
-31.3

Relative hourly industry labour cost, Norway vs trading partner countries
• Hourly labour cost of Norwegian industry workers 57 % higher than trading partner countries in EU
1995 = 100
Common currency
National currency
Source: Norwegian Technical Calculation Committee for Wage Settlements

Population of Norway, different scenarios
0
2
4
6
8
10
12
14
2010 2020 2030 2040 2050 2060 2070 2080 2090 2100
Mill
High national growth (HHMH)
Medium national growth (MMMM)
Low national growth (LLML)
No migration (MM00)
Parameters: fertility, life span, internal migration and immigration
Sources: Statistics Norway