northwest independent school district · · 2016-05-10northwest independent school district fort...
TRANSCRIPT

Northwest Independent School District
Fort Worth, Texas
Comprehensive Annual
Financial Report
For the Fiscal Year Ended June 30, 2007
Prepared by the Financial Services Department
Jon Graswich, CPA Chief Financial Officer
DeAnne Hatfield, CTSBO
Director of Business Services
1

THIS PAGE LEFT BLANK INTENTIONALLY
2

…
……
…
…
…
…
……
………
…
NORTHWEST INDEPENDENT SCHOOL DISTRICTCOMPREHENSIVE ANNUAL FINANCIAL REPORT
FISCAL YEAR ENDED JUNE 30, 2007
TABLE OF CONTENTS
Exhibit PageIntroductory Section Number NumberTitle Page…..…………………………………………..………………………………………………… 1 1Table of Contents………………………..…………..……………………….……………………………… 1 3Transmittal Letter………………………………………………….…………….………………………… 1 7GFOA Certificate of Achievement for Excellence in Financial Reporting….….……….……………… 1 19ASBO Certificate of Excellence in Financial Reporting………………………….……………………… 1 20Administrative Organizational Chart………………………………………………………………………. 1 21Board of Trustees………………………………………………………….………………………………… 1 22School Board and Administrators………………………………….……………………………………… 1 23Consultants and Advisors………………………………….………………………………………………… 1 24
Financial Section
Independent Auditor's Report……………………………………………………………………………… 1 26Management's Discussion and Analysis…………………………….……….…………………………… 1 28Basic Financial Statements:
Government Wide Financial Statements: Statement of Net Assets…………………………………………………………………………… A-1 35Statement of Activities………………………………………………………………………… B-1 37
Fund Financial Statements:Balance Sheet - Governmental Funds…………………………………………………………… C-1 38Reconciliation of the Governmental Funds Balance Sheet to the Statement of Net Assets…………………………………………………………………… C-2 41Statement of Revenues, Expenditures, and Changes in Fund Balance - Governmental Funds……………………………………………………… C-3 42Reconciliation of the Governmental Funds Statement of Revenues, Expenditures, and Changes in Fund Balances to the Statement of Activities……………… C-4 44
Statement of Net Assets - Proprietary Funds………...……………………………………………… D-1 45Statement of Revenues, Expenses, and Changes in Fund Net Assets -
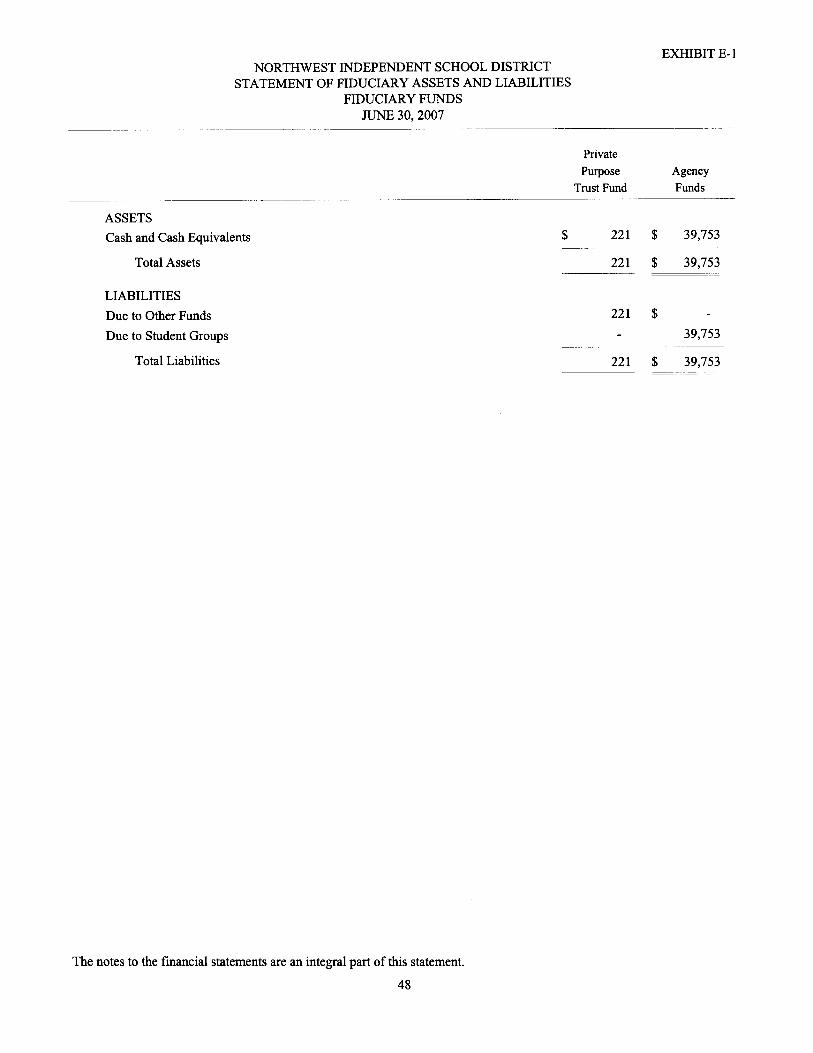
Proprietary Funds……………………………………………………………………………… D-2 46Statement of Cash Flows - Proprietary Funds……………………………………………………… D-3 47Statement of Fiduciary Assets and Liabilities……………………………………………………… E-1 48Statement of Changes in Fiduciary Fund Net Assets…………………………………………………… E-2 49Notes to the Financial Statements…………………………………………………………………… 1 50
3

… …
……
……
…
…
……
NORTHWEST INDEPENDENT SCHOOL DISTRICTCOMPREHENSIVE ANNUAL FINANCIAL REPORT
FISCAL YEAR ENDED JUNE 30, 2007
TABLE OF CONTENTS
Exhibit PageFinancial Section (Continued) Number NumberRequired Supplementary Information:Schedule of Revenues, Expenditures, and Changes in Fund Balance, Budget and
Actual - General Fund………………………………………………………………………………… G-1 65Combining and Individual Fund Statements and Schedules:
Nonmajor Governmental Funds - Special Revenue Funds………...…………………………………… 1 66Combining Balance Sheet - Nonmajor Governmental Funds…..………… ……………………… H-1 68
Combining Statement of Revenues, Expenditures and Changes in Fund Balances - Nonmajor Governmental Funds……………………………………………………… H-2 72Combining Statement of Net Assets - Internal Service Funds……………………………………… H-3 78Combining Statement of Revenues, Expenses and Changes in Fund Net Assets - Internal Service Funds………………..…………………………………………… H-4 79Combining Statement of Cash Flows - Internal Service Funds……………………………..……… H-5 80Combining Statement of Changes in Assets and Liabilities - All Agency Funds……………………… H-9 81Schedule of Revenues, Expenditures, and Changes in Fund Balance - Budget and Actual - Child Nutrition Program………………………………………………………………………… J-4 82Schedule of Revenues, Expenditures, and Changes in Fund Balance - Budget and Actual - Debt Service Fund………………………………………………………………………………… J-5 83
Capital Assets Used in the Operation of Governmental Funds:Schedule by Function and Activity……………….………………………………………………… 1 84Schedule of Changes by Function and Activity………………………………………………………… 1 85Schedule by Location…………………………..……….…………………………………………… 1 86
Compliance Schedules: Schedule of Delinquent Taxes Receivable…………………………………………………………… J-1 88
Schedule of Expenditures for Computations of Indirect Cost for 2008-2009………….…………… J-2 90Fund Balance and Cash Flow Calculation Worksheet……………………………………………… J-3 91
Statistical SectionNet Assets By Component Last Six Fiscal Years…………………………………………………………. Sch. 1 94Expenses, Program Revenues and Net (Expense)/Revenue Last Six Fiscal Years……………………….. Sch. 2 96
General Revenues and Total Change in Net Assets Last Six Fiscal Years……………………………….. Sch. 3 98
4

Sch. 3
NORTHWEST INDEPENDENT SCHOOL DISTRICTCOMPREHENSIVE ANNUAL FINANCIAL REPORT
FISCAL YEAR ENDED JUNE 30, 2007
TABLE OF CONTENTS
Exhibit PageStatistical Section (Continued) Number NumberFund Balances, Governmental Funds Last Six Fiscal Years……………………………………………… Sch. 4 100General Funds Revenues Last Ten Fiscal Years………………………………………………………….. Sch. 5 102Governmental Funds Expenditures and Debt Service Ratio Last Ten Fiscal Years……………………… Sch. 6 104Other Financing Sources and Uses and Net Change in Fund Balances, Governmental Funds
Last Ten Fiscal Years………………………………………………………………………………… Sch. 7 106Assessed Value and Actual Value of Taxable Property Last Ten Fiscal Years………………………….. Sch. 8 108Direct and Overlapping Property Tax Rates Last Ten Fiscal Years……………………………………… Sch. 9 109Principal Property Taxpayers Current Year and Nine Years Ago……………………………………….. Sch. 10 110Property Tax Levies and Collections Last Ten Fiscal Years…………………………………………….. Sch. 11 112Outstanding Debt By Type Last Ten Fiscal Years……………………………………………………….. Sch. 12 113Direct and Overlapping Governmental Activities Debt………………………………………………….. Sch. 13 114Legal Debt Margin Information Last Ten Fiscal Years………………………………………………….. Sch. 14 116Demographic and Economic Statistics Last Ten Fiscal Years…………………………………………… Sch. 15 118Principal Employers Current Year……………………………………………………………………….. Sch. 16 119Full-Time Equivalent District Employees by Type Last Ten Fiscal Years………………………………. Sch. 17 120Expenditures, Enrollment and Per Pupil Cost Last Ten Fiscal Years……………………………………. Sch. 18 121School Building Information Last Ten Fiscal Years…………………………………………………….. Sch. 19 122
Single Audit SectionReport on Compliance and on Internal Control over Financial Reporting based on an Audit of Financial Statements in Accordance with Governmental Auditing Standards…….….….....………….. 1 126Report on Compliance with Requirements Applicable to each Major Program and Internal Control Over Compliance in Accordance with OMB Circular A-133…….….…...……………………………. 1 127Schedule of Findings and Questioned Costs………….…..……..………….…..………..…..…………… 1 129Schedule of Status of Prior Findings………...….…..……..……..…….…….…..………...…………….. 1 130Schedule of Expenditures of Federal Awards……………………………………...……..………………. K-1 131Notes on Accounting Policies for Federal Awards…………………..…….……...…...…………………. 1 132
5

INTRODUCTORY SECTION
6


The independent audit of the financial statements is part of a broader, federally mandated “Single Audit” designed to meet the special need of federal grantor agencies. The standards governing Single Audit engagements require the independent auditor to report not only on the fair presentation of the financial statements, but also on the audited government’s internal controls and compliance with legal requirements, with special emphasis on internal controls and legal requirements involving the administration of federal rewards. These reports are available in the Single Audit Section of this report. GAAP require that management provide a narrative introduction, overview, and analysis to accompany the basic financial statements in the form of Management’s Discussion and Analysis (MD&A). This letter of transmittal is designed to complement MD&A and should be read in conjunction with it. The District’s MD&A can be found immediately following the report of the independent auditors. Profile of the District In the late 1800’s, schools began appearing in the area amid railroads, general stores, and livery stables. Descendants of early settlers recall tales of early schoolhouses and how in 1949 the one-school districts in Justin, Haslet, Rhome, and Roanoke joined hands to form the Northwest Independent School District. Newark was annexed in 1973. Residents of the district elect a seven-member Board of Trustees (the Board), each of which serves for three years. Monthly meetings of the Board are posted and advertised as prescribed under state law so that the Board may fulfill its charge to the students, parents, staff, and taxpayers of the District. Special meetings or study sessions are scheduled as needed. The Board has final control over all school matters except as limited by state law. Serving the communities of Haslet, Justin, Newark, Rhome, Roanoke, Trophy Club, Aurora, Avondale, Drop, New Fairview, Marshall Creek, and Northlake, along with portions of Fort Worth, Southlake, Westlake, and Flower Mound, the District’s boundaries encompass approximately 232 square miles in Denton, Tarrant, and Wise Counties. The District provides a well-rounded program of public education for children from pre-kindergarten through grade twelve. In addition to basic instructional programs, the District offers special education, gifted and talented, bilingual/ESL, remedial, college preparatory, and career and technical programs. The District is fully accredited by the Texas Education Agency (TEA). The District operates ten elementary schools, three middle schools, a high school, an alternative education program campus, and one special campus. Enrollment for the 2006-07 year was 10,334 students, an increase of approximately 18.7% over the previous year. A total of 400 seniors graduated from the District in 2007. The mission of the Northwest Independent School District, in partnership with parents and community, is to provide all students a premier education preparing them to be successful, productive citizens. A high degree of professionalism exists among our employees, and an on-going recognition of student and staff excellence contributes to this environment. The instructional program is geared toward having the student meet or exceed grade level expectations. Emphasis is placed on higher level thinking skills, including research methodologies and independent, complex and critical thinking skills. The District attracts highly qualified personnel because of its commitment to excellence. During the 2006-07 school year, the District employed 1039 employees consisting of 851 professionals, 77 educational aides, and 111 auxiliary staff. Professional employees include 688 classroom teachers with an average of 10.1 years of experience. 21.3 percent of the teaching staff has earned a master’s degree and .8 percent of the teaching staff has earned a doctorate degree. The average student/teacher ratio is 15.02 in the District. Texas law mandates that no more than 22 students can be assigned to one classroom teacher in kindergarten through fourth grade. The annual budget serves as the foundation for the District’s financial planning and control. The District budget process is instructionally driven. District budget planning begins with the senior administrative staff and the Board of Trustees holding goal setting sessions. The Budget Calendar and Five-Year Forecast are
8

reviewed with the Board of Trustees. Also, campuses annually prepare the required Campus Improvement Plans. Budget preparation begins with a training session with principals and program managers. At that time, the Budget Manual and budget worksheets are distributed and budgets are prepared on-line instead of strictly on paper submissions. The District uses site-based budgeting to enhance the ability of principals to serve as effective instructional leaders. Site-based budgeting places the principal at the center of the budget preparation process. The Campus Budget Worksheet reflects the initial campus funding allocations. These allocations address equity issues between campuses. They are designed around three cost drivers: pupils, staff, and buildings. Pupil allocations reflect both the number of students and additional funds for special needs students. Staff allocations provide for campus staff development. Building allocations are based on building size, age, and reflect past usage. The initial allocation represents 80% of the campus funding allocation based on projected enrollment. The remaining amount is distributed in November based on actual enrollment. The allocation may be revised by the Principal per the Campus Improvement Plan subject to review. After the completed campus and program budget packages have been returned, they are reviewed in detail by the Superintendent with the senior staff. The review focuses on the instructional impact. The Board of Trustees regularly receives budget updates that include any revisions to the earlier Five-Year Financial Forecast. The Texas Legislative biannual session met in 2007 and revisions to school finance were reviewed with the Board of Trustees. The Board of Trustees reviewed the budget in June and adopted the Personnel Compensation Plan. The proposed budget must be prepared by June 19th for a July 1 fiscal year start date. The board president must call a board meeting for the purpose of discussing and adopting the budget and the tax rate. A notice of this meeting is required to be published at least 10 days but no more than 30 days before the public meeting. The budget must be adopted prior to June 30th for a July 1 fiscal year start date. Budget Adoption. The Denton Central Appraisal District Projected Estimate of the 2006 Certified Appraisal roll occurred on June 5, 2006, and the Denton County Tax Assessor-Collector calculated the rollback tax rate on June 6, 2006. The required legal notices were published. The Board of Trustees adopted the budget on June 26, 2006. Tax Rate Adoption. The Denton Central Appraisal District Certification of the 2006 Appraisal Records occurred on July 25, 2006, and the Denton County Tax Assessor-Collector calculated the rollback tax rate on July 28, 2006. The required legal notices were published. The Board of Trustees held the required public meeting and adopted the tax rate on August 28, 2006. The District maintains budgetary controls throughout all of its financial systems. The objective of budgetary controls is to ensure compliance with legal provisions embodied in the official budget adopted by the Board. The Board adopts an official budget for the general fund, debt service fund, and child nutrition program (which is included in special revenue funds). In accordance with procedures prescribed by the State Board of Education, budget amendments that affect the total amount in a fund or functional spending category must be approved by the Board prior to the expenditure of funds. The functional level is specified by Board policy as the legal level of encumbrance of estimated purchase amounts prior to the release of purchase orders to vendors. Outstanding encumbrances at the end of the fiscal year are an accounts payable and are treated as expenditures in the prior year upon receipt of the goods and services. Factors Affecting Financial Condition The information presented in the financial statements is perhaps best understood when it is considered within the broader perspective of the specific environment in which the District operates.
9

Introduction. The Northwest Independent School District, uniquely situated northwest of the Fort Worth/Dallas Metroplex, lies within one of the fastest growing areas in Texas. Northwest stretches across 232 square miles and is located in Denton, Tarrant and Wise Counties, Texas. Population. The population of the Northwest Independent School District in 2000 was 35,364 as compared to 68,315 in 2007. Local economy. The commercial, industrial, and residential growth of the District has kept pace with that of the Fort Worth/Dallas area, and has been aided by the District’s close proximity to both the Dallas/Forth Worth International Airport and Fort Worth’s Alliance Airport. Diversified manufacturing is responsible for the local economy with increasing growth in commercial aviation. Agriculture-oriented industries relating to livestock marketing, grain and agri-business related industry and services join with the aerospace products, food and beverage, mobile homes, auto making, and medical industries to offer numerous manufacturing jobs in the Metropolitan Area. Area Developments Alliance Industrial Park. Alliance is a joint effort of Hillwood Development, the City of Fort Worth and neighboring communities, the Federal Aviation Administration and other government and civic leaders in the development and operation of an industrial airport, business community, and international trade center. Alliance is located in the northwest corner of the Dallas/Fort Worth Metroplex, within the northern limits of the City of Fort Worth. Alliance’s access to highway, rail and air transportation offers an excellent opportunity for future commercial and industrial growth. More than 140 companies have located to Alliance, building 25 million square feet, creating 24,000 jobs and generating $26 billion economic impact to North Texas. There are five business parks within Alliance. Alliance Center. At the heart of Alliance Center is the 414 acre Alliance Airport. Over a decade ago, the City of Fort Worth, the FAA and Alliance began work on the first purely industrial airport in the Western Hemisphere. The airport officially opened December 1989, and the Spirit of Alliance took flight. Today, Alliance Airport features the full complement of flight services and is the cornerstone for the nation’s fastest growing industrial complex. Alliance Airport is one of few North Texas airports capable of accommodating heavy transport aircraft such as the DC-10 and 747. This city owned airport is managed by privately held Alliance Air Services and boasts a 9,600 foot runway (with plans to expand to 13,000 feet). Alliance Airport provides state-of-the-art infrastructure and an award winning FAA Control Tower. It is FAR Part 139 certified and operates 24/7/365. American Airlines, a Fortune 500 company, operates a $481 million aircraft maintenance and engineering center from its complex, which houses the largest single cantilever building in the world. Bell Helicopter TEXTRON operates its Customer Center within Alliance Center. The facility offers Bell Helicopter Textron 64,000 square feet of office space, 82,000 square fee of hangar space and 15,000 square feet of warehousing space. As a result of engineering and composite operations associated with the construction of the tilt-rotor vehicle V-22 Osprey, Bell/Agusta Aerospace Company in joint venture with Bell Helicopter operates a 29,225 square foot headquarters for its civilian tilt-rotor operations. At Alliance, the company develops, manufactures, and markets its BA 609, the world’s first civilian certificated tilt-rotor, as well as the AB 139, a medium twin-engine helicopter. The Federal Aviation Administration operates the Alliance Airport Air Traffic Control Tower, A Flight Standards District Office and an Airways Facilities Sector field office in Alliance Center, supervising aircraft, agencies and personnel in 30 Texas counties.
10

Federal Express, a Fortune 500 firm, is the world’s largest express transportation company. The Southwest Regional Hub at Alliance is the company’s only completely automated hub and includes seven buildings, aircraft ramp areas and parking for delivery trucks. The facility handles 175,000 packages daily. Galderma, a leading research based pharmaceutical company dedicated to developing prescription and over the counter dermatological products, established its U.S. headquarters and national distribution center at Alliance. The U.S. Drug Enforcement Agency operates a 140,000 square foot National Airwing Headquarters with 155 employees on the airport grounds. Since this facility is owned by the City, the facility is not subject to ad valorem taxation. Alliance Gateway. Alliance Gateway, with over 2.8 million square feet of distribution and manufacturing space, is home to major corporations, including Nestle Distribution Company (food and candy distribution facility), Nokia Mobile Phones (cellular phone manufacturing and distribution), Southwestern Bell Telephone (customer call center) and Zenith Electronics (consumer electronics distribution facility). The James River Paper Company has built a 375,000 square foot facility for its regional distribution center. In 1999, TD Ameritrade, an online stock brokerage firm began operations of a national call center and customer service center at Alliance Gateway. Alliance Commerce Center. Corporations operating regional and national distribution facilities at Alliance Commerce Center include Andersen Logistics, Caremark, CompuCom Systems, GWS Perlos, Motivating Graphics, Patterson Dental Company, Recaro Aircraft Seating and Valmont Electric. These companies occupy approximately 300,000 square feet and employ over 240 persons. A garden office complex of 300,000 square feet called Heritage Commons is complete and houses Hillwood Development Operations. Westport at Alliance. Burlington Northern/Santa Fe Railway Company (BNSF), a Fortune 500 firm, operates three facilities at Alliance: the BNSF Automotive Facility, the BNSF Alliance Intermodal Facility and the BNSF Rail Yard. Handling over 100,000 vehicles annually, the 55-acre Auto Facility serves as a distribution port for DaimlerChrysler, American Honda, Hyundai and Kia. The 735 acre, $115 million intermodal yard is one of the largest intermodal facilities in the country. The state-of-the-art JC Penney Alliance Logistics Center features one of the largest steel rack-supported systems in the nation. With 17 levels and 105 bays of storage space, the 145,520 load cells can store approximately 72,000 pounds of merchandise. The distribution center annually processes 10,000 to 13,000 shipping containers from international ports, taking advantage of its proximity to the intermodal yard at Alliance. Other distribution centers located in this Alliance Sector include Grainger Industrial Supply, Hyundai, Kraft Foods/AmeriCold Logistics, Michaels Stores, SC Johnson & Son, Inc., and Volkswagen. Alliance Crossing. Alliance Crossing includes corporate office, financial, healthcare, lodging, and restaurant facilities. The U.S. Postal Service operates a full-service retail outlet and the City of Fort Worth Police Department operates a police substation from the Alliance Crossing retail center. Over 100 persons work in this retail-commercial development. Burlington Northern Santa Fe Railroad. Burlington Northern has completed construction of its $100 million Network Operations Center (“NOC”) on the company’s Western Center Boulevard property in north Fort Worth. The NOC comprised of two buildings totaling more than 250,000 square feet, is a high-tech, state-of-the-art facility which serves as the control and tracking center for all of Burlington’s railroads through the United States. Cabela’s. Known as the World’s Foremost Outfitter of hunting, fishing and outdoor gear opened its eleventh retail store in Alliance. A 230,000 square foot mega store, which contains an aquarium, museum,
11

and exhibit space, in addition to the retail, opened in May 2005. Cabela’s invested approximately $50 million in the facility, which employs approximately 500 individuals. Texas Motor Speedway. Located in far north Fort Worth at the intersection of Interstate 35-W and State Highway 114, the $110 million Texas Motor Speedway was completed in the Spring of 1997. The facility includes a 1.5 mile racing oval, grandstand seating for more than 200,000 spectators and approximately 200 luxury suites. An office tower and condominiums have also been constructed on the property. Pursuant to the terms of an agreement between the speedway developer and the Fort Worth Sports Authority, Inc., Texas Motor Speedway is owned by the Authority and leased to the developer, and most of the property comprising the Speedway is exempt from ad valorem taxes. Texas Motor Speedway is the second-largest sports and entertainment facility in the nation where dual-bank turns allow for NASCAR and IRL IndyCar racing, plus every major form of American automobile racing. NASCAR Winston Cup (now known as the Nextel Cup) races have been held at the Texas Motor Speedway as well as sanctioned IRL Indy Car races. NASCAR has sanctioned two Nextel Cup races for the speedway. The facility has hosted several major music concerts and other large events since opening. Historical Employment Data.
Average Annual
2006
Average Annual
2005
Average Annual
2004
Average Annual
2003
Average Annual
2002 Denton County Civilian Labor Force 326,387 309,312 280,271 276,295 278,937 Unemployed 13,821 13,174 11,560 13,042 13,980 Percent of Unemployment 4.23% 4.26% 4.12% 4.72% 5.01% State of Texas Civilian Labor Force 11,487,496 11,225,882 10,963,014 11,004,878 10,750,664 Unemployed 565,823 596,276 651,679 728,459 680,864 Percent of Unemployment 4.93% 5.31% 5.94% 6.62% 6.33%
Health Services. The Metroplex area, including the District, is served by more than 70 hospitals which offer specialized services such as organ transplantation, major trauma care, cancer treatment, kidney dialysis and chemical dependency treatment. Air Transport and Airline Industry. The Dallas/Fort Worth International Airport (the “Airport”) is the fourth busiest airport in the United States in terms of operations and passengers. The Airport is the principal air carrier facility serving the Dallas/Fort Worth metropolitan area, providing service to national and international destinations. The Airport provides nonstop services to Europe, the Far East, Canada, Mexico, Central and South America, the Caribbean and the Bahamas. The September 11, 2001 terrorist attacks, in combination with the general economic downturn in the airline industry, have had a significantly adverse effect on the airline industry. Since the attacks, most major U.S. airlines, including those servicing the Airport, have significantly reduced flight schedules and instituted extensive job cuts in an attempt to stem mounting losses. American Airlines is the predominant airline servicing the Airport, and is among the top ten taxpayers of the County. In January 2005, Delta Airlines, a former top ten taxpayer of the County, eliminated the use of the Airport as a national hub. Meacham International Airport, a Fort Worth municipally owned and operated general aviation airport, located in northern Fort Worth is a fixed based operation for private and commercial services equipped with a 7,500 foot runway. Meacham provides sophisticated instrument approach facilities, lighted
12

runways, terminal facilities and fuel and maintenance services. Fort Worth Spinks Airport, a general aviation airport located in the southwestern portion of the City is equipped with a 6,000 foot runway and two taxiways. Alliance Airport serves the needs of industrial, business, and general aviation users and is currently equipped with a 9,600 foot runway. Surface Transport. Three interstate highways (Interstate 20, Interstate 30 and Interstate 35), five federal and four state highways provide all-weather routes within Fort Worth and to and from the rest of the nation. Interstate 820, which encircles the City, allows quick access to all parts of the Fort Worth area. The Texas Highway Commission has completed a master highway construction plan for Tarrant County to provide for transportation needs through the foreseeable future, including relocation of Interstate 30 from a point just east of downtown to several miles west. This project is underway and will promote redevelopment of the south end of the Central Business District and the Hospital District southwest of downtown. Fort Worth is served by six major railroad systems. Burlington Northern/Santa Fe Railroad has its corporate headquarters in Fort Worth. Rail passenger service is provided through Fort Worth, including AMTRAK service between Houston and Chicago. Fort Worth’s position as a major southwest distribution center is supported by the presence of 75 regular route motor carriers with over 750 schedules. Local transit service is provided by The T, operated by the Fort Worth Transportation Authority. Trinity Railway Express provides service for the Metroplex. Greyhound/Trailways Bus Lines furnish Fort Worth with transcontinental passenger service; intrastate bus service is provided by Transportation Enterprises and Texas Bus Lines. State Funding. Demographic predictions indicate that the District’s enrollment will reach 17,158 by the 2010-11 school year as outlined below. The State of Texas provides funding for public education via a financing formula which weighs student attendance levels, property value per student, the District’s tax effort and regional variations in payroll and other costs. The District is actually considered a “property-rich” school district because the assessed value of property (“wealth”) in the District per student is higher than the statewide recapture of $319,500. The statewide taxable value per student for 2006-07 was $319,500 while the comparable value for the District was approximately $500,000. Enrollment Projections - Methodology Enrollment projections are provided through a contract with Population and Survey Analysts (“PASA”). PASA integrates school district information with its proprietary new home census information and specific neighborhood forecasts to create specific enrollment projections by attendance zone for the District. The projections are updated annually and PASA presents quarterly reports to the Board of Trustees and administration to explain the findings, provide comments on new and potential housing developments and create an understanding of future residential development's impact on the school district. This allows the District to take a proactive stance with regard to new school locations so that sites can be targeted not only where the need is greatest, but also far enough in advance of actual new home construction to minimize acquisition costs. This methodology provides significantly greater accuracy than the traditional cohort survival method employed in past years by the District. The District is rapidly growing and has large areas of undeveloped land. The quarterly reports help the District keep abreast of the area development as the October 1, 2005, voter approved $224.5 million bond issue is implemented over an estimated three year planning horizon.
13

Demographics
Year
Total
Elementary (EC-5th)
Middle (6th-8th)
High School (9th-12th)
Actual: 2002-03 6,177 2,981 1,507 1,689 2003-04 6,870 3,359 1,663 1,848 2004-05 7,563 3,723 1,831 2,009 2005-06 8,705 4,439 2,015 2,251 2006-07 10,334 5,311 2,367 2,656 Budget: 2007-08 11,818 6,110 2,685 3,023 Projections: 2008-09 13,463 7,111 3,101 3,251 2009-10 15,204 8,067 3,595 3,542 2010-11 17,158 9,144 4,105 3,909 2011-12 19,477 10,396 4,737 4,344
Cash Management. Cash available in excess of cash requirements was invested in the Texas Local Government Investment Pool, and government securities throughout the year. The average yield on investments at June 30, 2007 was 5.291 percent. The District’s investment policy is to minimize risk while maintaining a competitive yield on its portfolio. The District’s deposits were entirely covered by Federal Deposit Insurance Corporation (FDIC) insurance, pledged collateral or corporate surety bond for the fiscal year ended June 30, 2007. Risk Management. The District strives to maintain employee benefit programs designed to enhance the quality of life for employees. To achieve this, the District has created a self-funded insurance program that provides, medical, dental, disability, and hospital indemnity coverage to employees along with other insured programs at competitive rates effective September 1, 2002. Prior years coverage was offered through a Health Management Organization (“HMO”). The District also maintains adequate protection from property and casualty risk exposures through insured coverage and fully funded workers’ compensation coverage with a strict emphasis on cost control of claims. The Risk Management Department routinely reviews all insurance programs of the District to assess risk exposure and the appropriate levels of coverage being maintained. Major Initiatives and Accomplishments The Northwest Independent School District has consistently received a rating of “Superior Achievement” under the State of Texas School FIRST – financial accountability rating system. The Superior Achievement rating is the state’s highest, demonstrating the quality of the District’s financial management and reporting system. Northwest Independent School District’s Schools FIRST rating shows that the District is making the most of the taxpayers’ dollars and that Northwest’s schools are accountable not only for student learning, but also for achieving these results cost-effectively and efficiently. This is the fifth year of School FIRST (Financial Integrity Rating System of Texas), a financial accountability system of Texas school districts developed by the Texas Education Agency in response to Senate Bill 875 of the 76th Texas Legislature in 1999. The primary goal of Schools FIRST is to achieve quality performance in the management of school districts’ financial resources, a goal made more significant due to the complexity of accounting associated with Texas’ school finance system.
14

Competency in basic skills such as reading, writing and mathematics formerly has been measured by performance on the Texas Assessment of Academic Skills ("TAAS"). The TAAS and other standardized achievement tests were used to measure the quality of education provided in the district. The primary assessment instrument was the TAAS test, which provided the basis of the Texas Accountability System. Overall, the District individual campus accountability ratings and District TAAS performance steadily improved. Northwest High School received the National Blue Ribbon Award of Excellence, a highly prestigious award given by the U. S. Department of Education in May, 2002. Samuel Beck Elementary received the 2006 Blue Ribbon Lighthouse School Award. The Texas Assessment of Knowledge and Skills (“TAKS”) measures the statewide curriculum of specific subjects at specific grade levels and is a completely reconceived testing program. In comparison to the previous state assessment the Texas Assessment of Academic Skills or TAAS, the TAKS includes a more broad assessment of the Texas Essential Knowledge and Skills (“TEKS”), which is the statewide curriculum. The TAKS is a more rigorous assessment and questions are asked in a more authentic manner to measure student knowledge of the TEKS. The 2002-2003 school year was the first year for the TAKS to be administered and is considered somewhat of a transition year for accountability purposes. The District’s 2002 accountability ratings were carried forward to the 2003 school year. Campus 2002 ratings were not carried forward to 2003, but school performance data has been reported on the annual Academic Excellence Indicator System (“AEIS”) Report and School Report Card. The 2006-2007 accountability ratings were released and the ratings show gains in all areas of student achievement. It is the District goal for the District and all campuses to endeavor to reach exemplary status.
Texas Accountability System Campus Rating
Transition TAKS TAKS TAKS TAAS
DescriptionActual
2002-03Actual
2003-04Actual
2004-05Actual
2005-06Actual
2006-07Exemplary -- 2 3 1 1 Recognized -- 6 7 11 11 Acceptable -- 4 2 2 2 District Rating Recognized Recognized Recognized Acceptable Acceptable
Texas Assessment of Knowledge and Skills (“TAKS”)
DescriptionActual 2002-03
Actual 2003-04
Actual 2004-05
Actual 2005-06
Actual 2006-07
Reading/English Language Arts 82.0% 91.0% 91.0% 93.0% 95.0% Writing 88.0% 94.0% 94.0% 95.0% 94.0% Social Studies 88.0% 96.0% 94.0% 93.0% 94.0% Mathematics 73.0% 82.0% 80.0% 81.0% 86.0% Science 67.0% 84.0% 83.0% 81.0% 82.0% District Rating Recognized Recognized Recognized Acceptable Acceptable
District Student and Staff Accomplishments. Samuel Beck Elementary was named a 2006 Blue Ribbon Lighthouse School Award winner. Beck’s selection was based on the campus being a successful, comprehensive school exhibiting a strong commitment to educational excellence for all students. Blue Ribbon Lighthouse schools commit to sharing expertise and exemplary practices with other schools on a
15

local, regional and national level, as well as providing mentoring and networking opportunities to schools seeking guidance and assistance in school improvement initiatives. Gene Pike and Medlin Middle Schools were named two of the top schools in the state, according to an article in Texas Monthly. The schools were among the best of 574 public schools for academic performance, participation rates and Adequate Yearly Progress status. Northwest ISD Superintendent Karen G. Rue, Ed.D. was one of only six Texas superintendents invited to attend the BellSouth Superintendent Leadership Network Conference in January 2006 in Atlanta, Georgia. The Northwest High School softball team finished the season ranked 21st in the nation, according to the USA Today/National Fastpitch Coaches Association (NFCA) poll. The team was led by pitcher Brittany Barnhill who received a number of honors, including being named the NFCA All-American Team. More than 40 students from Gene Pike Middle School were part of the Polar First Experience in December when two pilots embarked on a world-record journey around the world via two Polar Regions. Gene Pike Middle School was one of 28 schools in the world participating in this education experience. ARAMARK Chef Jack Aspinall, representing Northwest ISD, was the winner of the International Culinary Showcase held at the Pennsylvania Convention Center in October 2006, Aspinall was one of 26 chefs around the world who were a part of ARAMARK’s 12th Annual International Guest Chef Exchange, the highest honor awarded to the company’s culinarians. Aspinall also spent more than a week in Ireland as part of the guest chef program. The Northwest High School Band welcomed home more than 30 marines from a tour in Iraq. The band played several patriotic songs to welcome the marines who were transported on the plane of Mavericks owner Mark Cuban to the Fort Worth Alliance Airport. Also, the Northwest High School UIL Marching Band advanced to state. Recent Northwest High School graduates, Whitney Norris and Kristy Young received the American FFA Degree at the 79th National FFA Convention in Indianapolis, Indiana on October 28. The American FFA is the highest degree awarded by the National FFA Organization, and recognizes these students’ demonstrated leadership abilities and outstanding achievements in agricultural business, production, processing, and service programs. Awards GFOA Certificate of Achievement. The Government Finance Officers Association of the United States and Canada (GFOA) awarded a Certificate of Achievement for Excellence in Financial Reporting to Northwest Independent School District for its comprehensive annual financial report for the ten months ended June 30, 2002 and for fiscal year ended June 30, 2003, June 30, 2004, June 30, 2005 and June 30, 2006. In order to be awarded a Certificate of Achievement, a government must publish an easily readable and efficiently organized comprehensive annual financial report. This report satisfied both generally accepted accounting principles and applicable legal requirements. ASBO Certificate of Excellence. The Association of School Business Officials International (ASBO) awarded a Certificate of Excellence in Financial Reporting to Northwest Independent School District for its comprehensive annual financial report for fiscal year ended June 30, 2003, June 30, 2004, June 30, 2005 and June 30, 2006. This award is for school districts whose comprehensive annual financial reports substantially conform to the recommended principles and standards of financial reporting adopted by that organization. The award is granted only after an intensive review of financial reports by an expert panel of certified public accountants and practicing school business officials.
16


THIS PAGE LEFT BLANK INTENTIONALLY
18

19

20

NORTHWEST INDEPENDENT SCHOOL DISTRICT
Administrative Organizational Chart
Outsourced Operations• Print Shop • Food Service
SUPERINTENDENT OF
SCHOOLS
Executive Assistant to the Superintendent & Records Management
Officer
Chief FinancialOfficer
Ex. Director for Business Services • Accounts Payable • Payroll • Elections
Asst. Superintendent forFacilities, Planning &
Construction
Purchasing
Warehouse Manager• Shipping • Receiving
Director for Maintenance • • Electrical • Mechanical • Plumbing • Custodial • Groundskeeping
Asst. Superintendent for Curriculum & Instruction
Principals • 11 Elementary • 6 Secondary
Ex. Director for Student Services
• Federal/State Programs • Testing Administration • Family Outreach/Parent Partners • DEIC/CIP • Nurses
Ex. Director for Curriculum and Staff Dev. • Curriculum Coordinators (7) • Staff Development • Research/Development
Ex. Director for Instruction and
Campus Support • CATE • Advanced Academics • Textbooks • Instructional Technology • Fine Arts • Counselors
Athletic Director
Sp. Assistant to the Superintendent • Community/Government Relations • Governance/Legal
Director forCommunications
• Media Relations • Public Information • Communications
Webmaster/Graphic Designer Events Coordinator
• Construction Management • Construction Supervisor (2)
Asst. Superintendent forAdministrative Services
Director forHuman Resources
• H.R. Specialist • Substitutes
Director forPersonnel Services
• Benefits • Risk Management
Director forSafety and Security
• Emergency Op. Plans (EOP) (District/Campus) • School Resource Officers
Director forTechnology
• Network Systems • Instruction Infrastructure • Construction Infrastructure • Telephones
Data Management• Pentamation
Coordinators (2) • Pentamation Specialist
Director for Corporate & Community
Development • NEF • Partners in Education • Volunteers • Alumni Relations
Outsourced Operations• Transportation
21

NORTHWEST INDEPENDENT SCHOOL DISTRICT Board of Trustees
Mark Schluter Place 2
Elected in May 2006 Term expires in 2009
Davis Palmer President Place 6
Elected in May 1998 Term expires in 2008
Jeannette Leong Place 4
Elected in May 2001 Term expires in 2007
Lynn Gamron Vice President
Place 5 Elected in May 1999 Term expires in 2008
Stephanie Trietsch Secretary Place 7
Elected in May 2002 Term expires in 2008
Debbie Thomas Place 1
Elected in May 1997 Term expires in 2009
Dr. Daryl Laney Place 3
Elected in May 1998 Term expires in 2007
Karen G. Rue, Ed.D. Superintendent of
Schools
Board Meetings: All Northwest ISD board meetings are open to the public. Regular meetings will be held at 7 p.m. on the second and fourth Monday of each month in the board room located at the NISD Administration Building at 2001 Texan Drive. With public notice, trustees will also hold special meetings and work sessions as needed. Within the limits of the Texas Open Meetings Act, parts of the board meetings may be closed to the public for topics including, but not limited to, these: real estate transactions, personnel matters, student hearings, and legal matters.
If You Wish to Address the Board: The public may address the board during the public participation portion of the board meeting. Remarks may be related to any topic, whether agenda items or non-agenda items, and are usually limited to three minutes. Those wishing to speak during public participation may sign the roster in the room within the hour preceding the meeting.
www.nisdtx.org
22

NORTHWEST INDEPENDENT SCHOOL DISTRICT School Board and Administrators
Board of Trustees Davis Palmer................................................................................................................................................................... President Lynn Gamron..........................................................................................................................................................Vice President Stephanie Trietsch ..........................................................................................................................................................Secretary Jeannette Leong ............................................................................................................................................................... Member Dr. Daryl Laney ............................................................................................................................................................... Member Mark Schluter .................................................................................................................................................................. Member Debbie Thomas................................................................................................................................................................ Member
Administration Karen G. Rue, Ed.D............................................................................................................................. Superintendent of Schools Lowell H. Strike, Ph.D............................................................................ Assistant Superintendent for Curriculum & Instruction Mona Benotti. ............................................................................................Assistant Superintendent for Administrative Services Dennis McCreary.....................................................................Assistant Superintendent for Facilities, Planning & Construction Jon Graswich, CPA...................................................................................................................................Chief Financial Officer Jerhea Nail .......................................................................................................................Special Assistant to the Superintendent
Principals Gene Suttle .............................................................................................................................................. Northwest High School Monty Brown...........................................................................................................................................................Denton Creek Paula Sanders............................................................................................................................... Alternative Education Program Robin Ellis .................................................................................................................................................Medlin Middle School Damon Edwards.................................................................................................................................... Gene Pike Middle School Dr. Philo Waters ........................................................................................................................... Chisholm Trail Middle School Julie Nerby........................................................................................................................................................Haslet Elementary Anita Chaney .................................................................................................................................................... Justin Elementary Vicki Hardy ................................................................................................................................................ Lakeview Elementary Debbie Merki ................................................................................................................................................Roanoke Elementary Mary Dunlevy.......................................................................................................................................... Seven Hills Elementary Deborah McCune...................................................................................................................................Samuel Beck Elementary Cathy Sager.......................................................................................................................................... W.R. Hatfield Elementary Fran Brown .............................................................................................................................................Prairie View Elementary Suzie McNeese ...............................................................................................................................J. Lyndal Hughes Elementary Connie Finley ...................................................................................................................... Sonny & Allegra Nance Elementary It’s Fast, Free, and Designed to Keep You Informed: If you have an email address, NISD is offering an easy and free way to get the latest district information. Subscribe to the electronic mail list and stay informed about district activities and urgent news such as school closings. Join today by completing the NISD News registration form on the District’s homepage at
www.nisdtx.org
23

NORTHWEST INDEPENDENT SCHOOL DISTRICT Consultants and Advisors
ARCHITECTS OFFICIAL DEPOSITORY Corgan Associates, Inc Woodhaven National Bank - Rhome 501 Elm Street, Suite 500 800 Highway 287, Suite A Dallas, Texas 75202 Rhome, Texas 76078 VLK Architects 1161 Corporate Drive, West, Suite 300 TAX COLLECTION COUNSEL Arlington, Texas 76006 Linebarger Goggan Blair & Sampson, LLP 309 W. 7th Street SHW Group, Inc. Fort Worth, Texas 76102-5113 P.O. Box 650155 Dallas, Texas 75265 BOND FISCAL AGENTS ACCOUNTANTS SERIES 1990 Haynes and Associates, P.C. The Bank of New York Trust Company, N.A. 405 North Oak Street Highwoods Center, 3rd Floor Roanoke, Texas 76262 10161 Centurion Parkway Jacksonville, Florida 32256 BOND COUNSEL SERIES 1997, 2001 and 2002 McCall, Parkhurst & Horton, LLP JP Morgan Trust Company, N.A. 717 North Harwood Institutional Trust Services Dallas, Texas 75201 P.O. Box 2320 2001 Bryan Street, Floor 10 Dallas, Texas 75221 FINANCIAL ADVISORS First Southwest Company SERIES 2004 AND 2005 777 Main Street, Suite 1200 Wachovia Bank, N.A. Fort Worth, Texas 76102 Corporate Trust Operations 1525 West W.T. Harris Blvd., 3C3 Charlotte, North Carolina 28262-8522 GENERAL COUNSEL Abernathy, Roeder, Boyd & Joplin U. S. Bank Corporate Trust Services P.O. Box 1210 683 West Fifth Street, Floor 24 1700 Redbud Boulevard, Suite 300 Los Angeles, California 90071 McKinney, Texas 75069 U.S. Bank Corporate Trust Services Henslee, Fowler, Hepworth & Schwartz LLP P. O. Box 86 816 Congress Avenue, Suite 800 Minneapolis, Minnesota 55486 Austin, Texas 78701-2443 SERIES 2006 Buechler & Associates, P.C Regions Bank Corporate Trust 3660 Stoneridge Road, Suite D-101 1717 St. James Place, Suite 500 Austin, Texas 78746 Houston, Texas 77056
24

FINANCIAL SECTION
25


NORTHWEST INDEPENDENT SCHOOL DISTRICT MANAGEMENT’S DISCUSSION AND ANALYSIS FOR THE FISCAL YEAR ENDED JUNE 30, 2007
In this section of the Annual Financial and Compliance Report, we, the managers of Northwest Independent School District, discuss and analyze the District’s financial performance for the fiscal year ended June 30, 2007. Please read it in conjunction with our independent auditors’ report on pages 26 and 27, and the District’s Basic Financial Statements which begin on page 35. FINANCIAL HIGHLIGHTS • During the fiscal year, the District had expenses that were $3,245,260 more than the $165,314,207
million generated in tax and other revenues for governmental programs (before special items). These expenditures include $25,794,215 of construction expenses for capital projects, as shown on page 42-43. After considering this $25,794,215 of construction expense the total revenues exceeded total expenses by $22,548,955. The previous year expenses exceeded revenues by $9,761,111.
• Total cost of all of the District’s federal programs increased during the period, with two old programs
deleted in this fiscal year and one new program being added. • The District is defined by Chapter 41 of the Texas Education Code (TEC) as a high wealth district;
therefore, during 2007 the District paid $35,630,381 in contracted instructional services between schools as part of the state wealth equalization requirements.
• The general fund ended the fiscal year with a fund balance of $51,278,806 million. USING THIS ANNUAL REPORT This fiscal year report consists of a series of financial statements. The government-wide financial statements include the Statement of Net Assets and the Statement of Activities (on pages 35 and 37). These provide information about the activities of the District as a whole and present a longer-term view of the District’s property and debt obligations and other financial matters. They reflect the flow of total economic resources in a manner similar to the financial reports of a business enterprise. Fund financial statements (starting on page 38) report the District’s operations in more detail than the government-wide statements by providing information about the District’s most significant funds. For governmental activities, these statements tell how services were financed in the short term as well as what resources remain for future spending. They reflect the flow of current financial resources, and supply the basis for tax levies and the appropriations budget. The Statement of Fiduciary Assets and Liabilities (shown on page 48), provide financial information about activities for which the District acts solely as an agent for the benefit of certain student groups of the district. The notes to the financial statements (starting on page 50) provide narrative explanations or additional data needed for full disclosure in the government-wide statements or the fund financial statements. The combining statements for non-major funds contain even more information about the District’s individual funds. These are not required by TEA. The sections labeled TEA Required Schedules and Federal Awards Section contain data used by monitoring or regulatory agencies for assurance that the District is using funds supplied in compliance with the terms of grants.
28

Reporting the District as a Whole The Statement of Net Assets and the Statement of Activities The analysis of the District’s overall financial condition and operations begins of page 35. Its primary purpose is to show whether the District is better off or worse off as a result of the fiscal year period’s activities. The Statement of Net Assets includes all the District’s assets and liabilities at the end of the fiscal year while the Statement of Activities includes all the revenues and expenses generated by the District’s operations during the fiscal year. These apply the accrual basis of accounting, which is the basis used by private sector companies. All of the current year’s revenues and expenses are taken into account regardless of when cash is received or paid. The District’s revenues are divided into those provided by outside parties who share the costs of some programs, such as tuition received from students from outside the district and grants provided by the U.S. Department of Education to assist children with disabilities from disadvantaged backgrounds (program revenues), and revenues provided by the taxpayers or by TEA in equalization funding processes (general revenues). All the District’s assets are reported whether they serve the current year or future years. Liabilities are considered regardless of whether they must be paid in the current or future years. These two statements report the District’s net assets and changes in them. The District’s net assets (the difference between assets and liabilities) provide one measure of the District’s financial health, or financial position. Over time, increases or decreases in the District’s net assets are one indicator of whether its financial health is improving or deteriorating. To fully assess the overall health of the District, however, you should consider nonfinancial factors as well, such as changes in the District’s average daily attendance or its property tax base and the condition of the District’s facilities. In the Statement of Net Assets and the Statement of Activities, we reflect the District in one kind of activity: • Governmental Activities - All of the District’s basic services are reported here, including the
instruction, counseling, co-curricular activities, child nutrition, transportation, maintenance, community services, and general administration. Property taxes, tuition, fees and state and federal grants finance most of these activities.
• Proprietary Funds - The District’s Internal Service Funds which include Print Shop, Facilities
Rental/Usage and Self-Insurance are reported within this fund. Reporting the District’s Most Significant Funds Fund Financial Statements The fund financial statements begin on page 38 and provide detailed information about the most significant funds - not the District as a whole. Laws and contracts require the District to establish some funds, such as grants received under the No Child Left Behind Act from the U.S. Department of Education. The District’s administration establishes many other funds to help it control and manage money for particular purposes (like campus activities). The District’s governmental fund uses the following accounting approach.
• Governmental Funds - Most of the District’s basic services are reported in governmental funds. These use modified accrual accounting (a method that measures the receipt and disbursement of cash and all other financial assets that can be readily converted to cash) and report balances that are available for future spending. The governmental fund statements provide a detailed short-term view of the District’s general operations and the basic services it provides. We describe the differences between governmental activities (reported in the Statement of Net Assets and the Statement of Activities) and governmental funds in reconciliation schedule following each of the fund financial statements.
29

The District as Fiduciary Reporting the District’s Fiduciary Responsibilities The District is the fiduciary for money raised by student activities. All of the District’s fiduciary activities are reported in a separate Statement of Fiduciary Assets and Liabilities on page 48 and the Statement of Changes in Fiduciary Fund Net Assets on page 49. These resources are excluded from the District’s other financial statements because the District cannot use these assets to finance its operations. The District is only responsible for ensuring that the assets reported in these funds are used for their intended purposes. GOVERNMENT-WIDE FINANCIAL ANALYSIS We will present both current and prior year data and discuss significant changes in the accounts. The analysis focuses on the net assets (Table I) and changes in net assets (Table II) of the District’s governmental activities. Net assets of the District’s governmental activities are $63,427,163. Unrestricted net assets-the part of net assets that can be used to finance day-to-day operations without constraints established by debt covenants, enabling legislation, or other legal requirements was $(138,834,103) at June 30, 2007. The District’s net assets increased in the amount of $17,069,350. This increase in governmental net assets was the result of the following factors, general revenues increased approximately $30,000,000, with operating grants also increasing approximately $5,000,000, total expenses increased by $17,328,182. Although expenses did increase, the increase in revenues far exceeded the expense increase. The District expended $25,794,215 on construction of capital projects.
Table I Northwest Independent School District
NET ASSETS In thousands
Governmental Activities
2007
Governmental Activities
2006 Current and other assets $261,325 $158,922Capital assets 245,934 237,615 Total Assets 507,259 396,537 Other liabilities
443,832 28,142
Total Liabilities 443,832 350,179 Net assets:
Invested in capital assets net of related debt 29,232 (86,171)Restricted 173,029 90,266Unrestricted (138,834) 42,263 Total Net Assets $63,427 $46,358
30

Table II
Northwest Independent School District CHANGES IN NET ASSETS
In thousands
Governmental Activities
2007
Governmental Activities
2006 Revenues:
Program Revenues: Charges for Services $5,311 $ 4,475 Operating grants and contributions 11,654 6,797 General Revenues: Maintenance and operations taxes 109,214 93,845 Debt service taxes 28,391 20,016 Grants and contributions not restricted To specific functions 12,400 3,704 Investment Earnings 9,868 4,011 Miscellaneous - 7,654 Total Revenue 176,838 140,502 Expenses:
Instruction, Curriculum and media services
52,263 44,775
Instruction and school leadership 3,979 3,653 Student support services 7,083 6,533 Child nutrition 3,995 3,378 Co curricular activities 3,740 3,452 General administration 8,660 7,654 Plant maintenance, security & data 23,784 18,191 Processing Community services 239 197 Debt services 19,194 17,555 Facilities acquisition and Construction Other business-type activities
0
36,832
0
37,053 Total Expenses 159,769 142,441
Increase (decrease) in net assets before transfers and special items
17,069 (1,939)
Special Items -Net Assets at 6/30/06 46,358 48,297Net Assets at 6/30/07 $63,427 $46,358 The District’s total revenues increased by 25.86 percent ($36.3 million). The total cost of many programs and services was substantially higher than last year, with total expenses increasing by $17.328 million. The change in net assets for the current fiscal year was $17,069,350. Also, general fund balance increased in the current fiscal year by $14.447 million with an ending balance of $51,278,806 million. The District took actions this year to compensate for some increases in cost and avoid the loss of state revenue due to changes in the provisions related to accelerated, intensive, compensatory education (State Comp Ed) and student attendance accounting (Leavers).
31

The cost of all governmental activities this year was $159.7 million compared to $142.4 million last year. However, as shown in the Statement of Activities on pages 37, the amount that the taxpayers ultimately financed for these activities through District taxes was only $137.606 million because some of the costs were paid by those who directly benefited from the programs ($16.96 million). THE DISTRICT’S FUNDS As the District completed the year, its governmental funds (as presented in the balance sheet on pages 38-39) reported a combined fund balance of $223.9 million, which is greater than last year’s total of $126.7 million. Over the course of the fiscal year, the Board of Trustees revised the District’s budget several times. These budget amendments fall into three categories. The first category includes amendments and supplemental appropriations that were approved shortly after the beginning of the year and reflect the actual beginning balances (versus the amounts we estimated in June 2006). The second category includes changes that the Board made during the third quarter to take into account the mid-year hiring and overtime freeze and some of the District’s staff restructuring efforts. The principal amendment in this case was to eliminate the original budget contingency appropriation used in the past to cover employee overtime and charges associated with staff turnover. The third category involved amendments moving funds from programs that did not need all the resources originally appropriated to them to programs with resource needs. The District’s General Fund balance of $51.3 million reported on page 38 differs from the General Fund’s budgetary fund balance of $43.6 million reported in the budgetary comparison schedule on page 65. This is principally due to cost savings and added revenues described above. Capital Assets At the end of 2007, the District had $281.8 million invested in a broad range of capital assets, including facilities and equipment for instruction, transportation, athletics, administration, and maintenance. This amount represents a net addition of just over $12.8 million, or 4.76 percent, above last year. This year’s major additions included:
Land $ 1,304,629 Building Improvements 15,179,862 Construction in Progress (4,220,069) Furniture and Equipment 542,950
Total $12,807,372
More detailed information about the District’s capital assets is presented in Note II C – Capital Assets to the financial statements. Debt At June 30, 2007, the District had over $404 million in bonds outstanding. In addition, the District has $8.9 million in accreted interest related to the bonds outstanding. In May 2007, the Board of Trustees authorized issuing $95.02 million in School Building Bonds. The District had two bond refundings during the fiscal year in the amount of $107,659,954. This provided financing for the construction of new school facilities within the District. More detailed information about the District’s long-term liabilities is presented in Note II E – Long-term debt. Other obligations include accrued vacation pay and sick leave. More detailed information about the District’s long-term liabilities is presented in Note I D4 – Compensated Absences to the financial statements.
32

ECONOMIC FACTORS AND NEXT YEAR’S BUDGETS AND RATES The District’s elected officials considered many factors when setting the fiscal year 2008 budget and tax rates. One of those factors is the economy. The District’s population growth during 2000-2007 averaged annual gains of 13.18 percent. Unemployment has lowered slightly and now stands at 4.23 percent. This compares with the State’s unemployment rate of 4.93 percent and the national rate of 4.7 percent. These indicators were taken into account when adopting the General Fund budget for 2008. Amounts available for appropriation in the General Fund budget are $115,545,186, an increase of 0.35 percent over the final 2007 budget of $115.1 million. The District will use its revenues to finance programs currently offered. Budgeted expenditures are expected to rise nearly 4.95 percent to $115.5 million from $110.06 million in 2008. Increased Chapter 41 and Tax Increment Fund expenditures cause virtually all of the increase. The District has added no major new programs or initiatives to the 2008 budget. If these estimates are realized, the District’s budgetary General Fund balance is expected to stay the same at the close of 2008. CONTACTING THE DISTRICT’S FINANCIAL MANAGEMENT This financial report is designed to provide the citizens, taxpayers, customers, investors and creditors with a general overview of the District’s finances and to show the District’s accountability for the money it receives. If you have questions about this report or need additional financial information, contact the District’s Business Office, at Northwest Independent School District, P.O. Box 77070, Fort Worth, TX, 76177-0070.
33

THIS PAGE LEFT BLANK INTENTIONALLY
34


THIS PAGE LEFT BLANK INTENTIONALLY
36


THIS PAGE LEFT BLANK INTENTIONALLY
40


NORTHWEST INDEPENDENT SCHOOL DISTRICT NOTES TO THE FINANCIAL STATEMENTS
JUNE 30, 2007
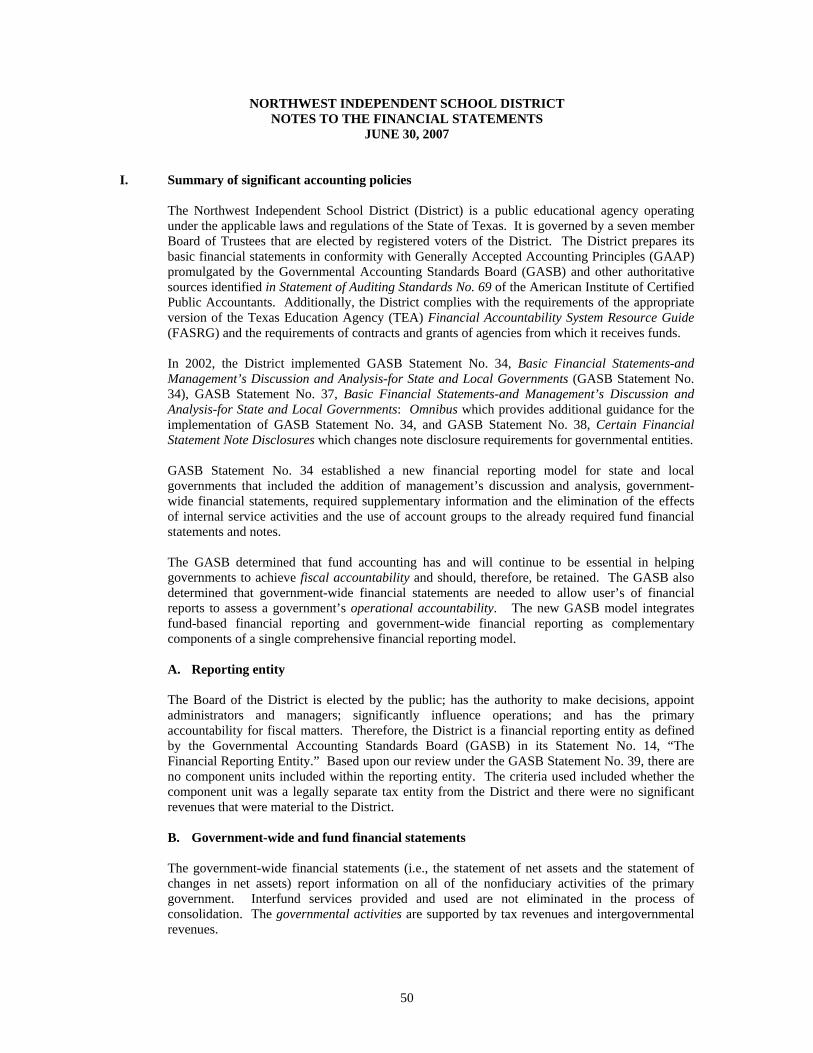
I. Summary of significant accounting policies The Northwest Independent School District (District) is a public educational agency operating under the applicable laws and regulations of the State of Texas. It is governed by a seven member Board of Trustees that are elected by registered voters of the District. The District prepares its basic financial statements in conformity with Generally Accepted Accounting Principles (GAAP) promulgated by the Governmental Accounting Standards Board (GASB) and other authoritative sources identified in Statement of Auditing Standards No. 69 of the American Institute of Certified Public Accountants. Additionally, the District complies with the requirements of the appropriate version of the Texas Education Agency (TEA) Financial Accountability System Resource Guide (FASRG) and the requirements of contracts and grants of agencies from which it receives funds. In 2002, the District implemented GASB Statement No. 34, Basic Financial Statements-and Management’s Discussion and Analysis-for State and Local Governments (GASB Statement No. 34), GASB Statement No. 37, Basic Financial Statements-and Management’s Discussion and Analysis-for State and Local Governments: Omnibus which provides additional guidance for the implementation of GASB Statement No. 34, and GASB Statement No. 38, Certain Financial Statement Note Disclosures which changes note disclosure requirements for governmental entities. GASB Statement No. 34 established a new financial reporting model for state and local governments that included the addition of management’s discussion and analysis, government-wide financial statements, required supplementary information and the elimination of the effects of internal service activities and the use of account groups to the already required fund financial statements and notes. The GASB determined that fund accounting has and will continue to be essential in helping governments to achieve fiscal accountability and should, therefore, be retained. The GASB also determined that government-wide financial statements are needed to allow user’s of financial reports to assess a government’s operational accountability. The new GASB model integrates fund-based financial reporting and government-wide financial reporting as complementary components of a single comprehensive financial reporting model. A. Reporting entity The Board of the District is elected by the public; has the authority to make decisions, appoint administrators and managers; significantly influence operations; and has the primary accountability for fiscal matters. Therefore, the District is a financial reporting entity as defined by the Governmental Accounting Standards Board (GASB) in its Statement No. 14, “The Financial Reporting Entity.” Based upon our review under the GASB Statement No. 39, there are no component units included within the reporting entity. The criteria used included whether the component unit was a legally separate tax entity from the District and there were no significant revenues that were material to the District. B. Government-wide and fund financial statements The government-wide financial statements (i.e., the statement of net assets and the statement of changes in net assets) report information on all of the nonfiduciary activities of the primary government. Interfund services provided and used are not eliminated in the process of consolidation. The governmental activities are supported by tax revenues and intergovernmental revenues.
50

The statement of activities demonstrates the degree to which the direct expenses of a given function are offset by program revenues. Direct expenses are those that are clearly identifiable with a specific function. Program revenues include 1) charges to customers or applicants who purchase, use or directly benefit from goods, services, or privileges provided by a given function and 2) grants and contributions that are restricted to meeting operational or capital requirements of a particular function. Taxes and other items not properly included among program revenues are reported instead as general revenues. Separate financial statements are provided for governmental funds and fiduciary funds, even though the latter are excluded from the government-wide financial statements. Major individual governmental funds are reported as separate columns in the fund financial statements. C. Measurement focus, basis of accounting, and financial statement presentation The government-wide financial statements are reported using the economic resources measurement focus and the accrual basis of accounting, the agency funds have no measurement focus. Revenues are recorded, when earned and expenses are recorded when a liability is incurred, regardless of the timing of related cash flows. Property taxes are recognized as revenues in the year for which they are levied. Grants and similar items are recognized as revenue as soon as all eligibility requirements imposed by the provider have been met. Governmental fund financial statements are reported using the current financial resources measurement focus and the modified accrual basis of accounting. Revenues are recognized as soon as they are both measurable and available. Revenues are considered to be available when they are collectible within the current period or soon enough thereafter to pay liabilities of the current period. For this purpose, the government considers revenues to be available if they are collected within 60 days of the end of the current fiscal period. Expenditures generally are recorded when a liability is incurred, as under accrual accounting. However, debt service expenditures, as well as expenditures related to compensated absences and claims and judgments, are recorded only when payment is due. Revenues from local sources consist primarily of property taxes. Property tax revenues and revenues received from the State of Texas are recognized under the susceptible-to-accrual concept. Miscellaneous revenues are recorded as revenue when received in cash because they are generally not measurable until actually received. Investment earnings are recorded as earned, since they are both measurable and available. Grant funds are considered earned to the extent of the expenditures made under the provisions of the grant. Accordingly, when such funds are received, they are recorded as deferred revenues until the related and authorized expenditures have been made. If balances have not been expended by the end of the project period, grantors sometimes require the District to refund all or part of the unused amount. The District reports the following major governmental funds:
The general fund is the government’s primary operating fund. It accounts for all financial resources of the District, except those required to be accounted for in another fund. Major revenue sources include local property taxes, state funding under the Available School Fund and interest earnings. Expenditures include all costs associated with the daily operations of the District except for specific programs funded by the federal or state government, child nutrition, debt service, and capital projects. This is a budgeted fund. The debt service fund accounts for the resources accumulated and payments made for principal and interest on long-term general obligation debt of governmental funds. This is a budgeted fund.
51

The capital projects fund accounts for proceeds from long-term debt financing (including the sale of bonds) and revenues and expenditures related to authorized construction and other capital asset acquisitions.
The District reports the following non-major governmental fund:
The special revenue funds account for resources restricted to, or designated for, specific purposes by a grantor. Federal and state financial assistance generally is accounted for in a special revenue fund. Child Nutrition Program adopts an annual budget.
The District reports the following proprietary funds:
The internal service funds account for revenues and expenses related to services provided to organizations inside the District on a cost reimbursement basis. The District’s Internal Service Funds are Self Insurance, Facility Rental/Usage and Print Shop.
Additionally, the District reports the following fiduciary funds:
The agency fund accounts for resources held in a custodial capacity by the District, and consists of funds that are the property of students or others. The District’s Agency Funds are the Student Activity Account and the High School Student Activity Account. The private-purpose trust fund accounts for resources held and administered by the District, acting in a fiduciary capacity for private organizations, or governments.
Legal requirements for school district budgets are formulated by the state, TEA, and the local district. The Board adopts an “appropriated budget” on a basis consistent with GAAP for the general fund, debt service fund and child nutrition program (which is included in special revenue funds). At a minimum, the District is required to present the original and the final amended budgets for revenues and expenditures compared to actual revenues and expenditures for these three funds.
The following procedures are followed in establishing the budgetary data reflected in the general purpose financial statements: • Prior to June 19th, the District prepares a budget based on the planning-programming
budgeting method for the next succeeding fiscal year. The operating budget includes proposed expenditures and the means of financing them.
• After one or more budget workshops with the Board, a meeting is called for the purpose of
adopting the proposed budget. At least ten days but not more than 30 days public notice of the meeting is required.
• Prior to June 30th the Board of Trustees legally adopts the budget for the general fund, debt
service fund and child nutrition program.
• After the budget for the above listed funds is approved, any amendment that causes an increase or decrease in a fund or functional spending category or total revenue or other resources object category requires Board approval prior to the fact. These amendments are presented to the Board at its regular monthly meeting and are reflected in the official minutes. Because the District has a policy of careful budgetary control, several budgetary amendments were necessary throughout the year. Budget amendments throughout the year were not significant.
• Expenditure budgets are controlled at the expenditure functional and object level by the
appropriate budget manager (principal, department director or divisional administrator).
52

Budget managers may authorize transfers within functional and organizational categories that do not affect the total functional and organizational appropriation. All budget appropriations lapse at year end.
Encumbrance accounting, under which purchase orders, contracts and other commitments are recorded in order to reserve that portion of the applicable appropriation, is used in all governmental funds. Encumbrances outstanding at year-end are commitments that do not constitute expenditures or liabilities, but are reported as reservations of fund balances. Since appropriations lapse at the end of each year, outstanding encumbrances are appropriately provided for in the subsequent fiscal year’s budget to provide for the liquidation of the prior commitments. The budgetary basis of accounting shall be consistently applied in budgeting, recording and reporting foundation school program (FSP) revenues in PEIMS information. Under the budgetary basis, earned and material FSP revenues that are collectible beyond 60 days are to be treated consistently for budgeting, recording, and reporting through PEIMS and for tax rollback rate calculation purposes. D. Assets, liabilities, and net assets or equity 1. Deposits and investments The District’s cash and cash equivalents are considered to be cash on hand, demand deposits, and short-term investments with original maturities of three months or less from date of acquisition. Investments for the District are reported at fair value.
The funds of the District must be deposited and invested under the terms of a depository contract, contents of which are set out in the Depository Contract Law. The depository bank may either place approved pledged securities for safekeeping and trust with the District’s agent bank or file a corporate surety bond in an amount sufficient to protect District funds on a day-to-day basis during the period of the contract. The pledge of approved securities is waived only to the extent of the depository bank’s dollar amount of FDIC insurance.
2. Receivables and payables
Activity between funds that are representative of lending/borrowing arrangements outstanding at the end of the fiscal year are referred to as either “due to/from other funds”. The District had no advances between funds. Property taxes are levied by October 1 on the assessed value listed as of the prior January 1 for all real and business personal property located in the District in conformity with Subtitle E, Texas Property Code. Taxes are due upon receipt of the tax bill and are delinquent if not paid before February 1 of the year following the year in which imposed. On January 31 of each year, a tax lien attaches to property to secure the payment of all taxes, penalties, and interest ultimately imposed. The appraisal and recording of all property within the District is the responsibility of the Denton Central Appraisal District (DCAD), an independent governmental unit with a board of directors appointed by the taxing jurisdictions within the county and funded from assessments against those taxing jurisdictions. DCAD is required by law to assess property at 100% of its appraised value. Real property must be reappraised at least every two years. Under certain circumstances taxpayers and taxing units, including the District, may challenge orders of the DCAD Review Board through various appeals and, if necessary, legal action. Tax collections are prorated between the general fund and debt service fund based on the tax rate approved by the Board. For the fiscal year ended June 30, 2007, the rates were $1.3300 and $.3350, respectively, per $100 of assessed value.
53

Delinquent taxes are prorated between maintenance and debt service based on rates adopted for the year of the levy. Allowances for uncollectible tax receivables within the general and debt service funds are based on historical experience in collecting property taxes. Uncollectible personal property taxes are periodically reviewed and written off, but the District is prohibited from writing off real property taxes without specific statutory authority from the Texas Legislature. The property tax receivable allowance is equal to 7.5 percent of outstanding property taxes at June 30, 2007. 3. Capital assets
Capital assets, which include land, buildings, furniture, equipment, vehicles and construction in progress are reported in the applicable governmental activities columns in the government-wide financial statements. Capital assets are defined by the government as assets with an initial, individual cost of more than $5,000 and an estimated useful life in excess of two years. Such assets are recorded at historical cost or estimated historical cost if purchased or constructed. Donated capital assets are recorded at estimated fair market value at the date of donation. The costs of normal maintenance and repairs that do not add to the value of the asset or materially extend assets lives are not capitalized. When assets are retired or otherwise disposed of, the related costs or other recorded amounts are removed. Buildings, furniture and equipment of the District are depreciated using the straight line method over the following estimated useful lives: Assets Years Land N/A Buildings 50 Building improvements 1-20 Furniture and equipment 7 Computer equipment 3 Vehicles 7
4. Compensated absences The District requires overtime compensation to be paid or taken in the form of compensatory time off. The District generally does not allow hourly employees to carry forward unused vacation time. Effective July 1, 2000, the District’s full-time employees in positions that require twelve months of service shall be eligible for two weeks vacation with pay annually. This vacation is accrued at the rate of five-sixths of a day for each month of employment, for a maximum of forty days. As of June 30, 2007, the amount accrued and vested was $420,348 which is due within one year. Typically, the general fund is used to liquidate the liability for compensated absences.
Beginning Balance June 30, 2006
Increases
Decreases
Ending Balance June 30, 2007
$384,369 $174,416 $138,437 $420,348
The District allows employees to carry forward unused sick leave to subsequent years. As of June 30, 2007 the contingent liability to the District for sick leave carried forward totaled approximately $2,053,693. The amount of compensated absences due within one year is
54

$246,443. This amount is not paid to employees upon retirement or termination, therefore the District has not recorded a liability for accumulated sick leave. 5. Arbitrage payable The Federal Tax Reform Act of 1986 requires issuers of tax-exempt debt to make payments to the United States Treasury for investment income received at yields that exceed the issuer’s tax exempt borrowing rates. The Treasury requires payment for each issue every five years. The estimated liability is updated annually for all tax-exempt issuances or changes in yields until such time payment of the calculated liability is due. The District had no arbitrage liability as of June 30, 2007. 6. Long-term obligations
In the government-wide financial statements, long-term debt and other long-term obligations are reported as liabilities in the applicable governmental activities statement of net assets. Bond premiums and discounts, as well as issuance costs, are deferred and amortized over the life of the bonds using the effective interest method. Bonds payable are reported net of the applicable bond premium or discount. Bond issuance costs are reported as deferred charges and amortized over the term of the related debt. In the fund financial statements, governmental fund types recognize bond premiums and discounts, as well as bond issuance costs, during the current period. The face amount of debt issued is reported as other financing sources. Premiums received on debt issuances are reported as other financing sources while discounts on debt issuances are reported as other financing uses. Issuance costs, whether or not withheld from the actual debt proceeds received, are reported as debt service expenditures. 7. Fund equity
In the fund financial statements, governmental funds report reservations of fund balance for amounts that are not available for appropriation or are legally restricted by outside parties for use for a specific purpose. Designations of fund balance represent tentative management plans that are subject to change.
Claims and Judgments $ 420,309 Capital Projects 18,877,924 Tax Increment Financing (TIF) Zone(s) 4,515,745 Technology 1,916,322 Vehicles (Bus Replacement) 1,400,000 Total Designations $27,130,300
8. Comparative data/reclassifications
Comparative data for the prior year has not been presented in the GASB Statement No. 34 financial statements. 9. Data control codes
The data control codes refer to the account code structure prescribed by TEA in the Financial Accountability System Resource Guide. The TEA requires school districts to display these codes
55

in the financial statements filed with the Agency in order to ensure accuracy in building a statewide database for policy development and funding plans.
II. Detailed notes on all funds
A. Deposits and investments
At June 30, 2007, the carrying amount of the District’s deposits (cash, certificates of deposit, and investment accounts included in temporary investments) was $251,949,243 and the bank balance was $1,540,139. The District’s cash deposits at June 30, 2007, and during the fiscal year ended June 30, 2007, were entirely covered by FDIC insurance, pledged collateral and/or corporate surety bond. In addition, the following is disclosed regarding coverage of combined balances on the date of highest deposit:
Bank
Highest Deposit
Pledged Securites/ Corporate Surety Bond
FDIC Coverage
Month
Woodhaven $15,962,102 $15,780,721 $300,000 October 2006
The State Public Funds Investment Act (Government Code Chapter 2256) contains specific provisions in the areas of investment practices, management reports and establishment of appropriate policies. Among other things, it requires the District to adopt, implement, and publicize an investment policy. The investment policy must address the following areas: (1) safety of principal and liquidity, (2) portfolio diversification, (3) allowable investments, (4) acceptable risk levels, (5) expected rates of return, (6) maximum allowable stated maturity of portfolio investments, (7) maximum average dollar-weighted maturity allowed based on the stated maturity date for the portfolio, (8) investment staff quality and capabilities, and (9) bid solicitation preferences for certificates of deposit. Statutes authorize the District to invest in (1) obligations of the U.S. Treasury, certain U.S. agencies, and the State of Texas, (2) certificates of deposit, (3) certain municipal securities, (4) money market savings accounts, (5) repurchase agreements, (6) bankers acceptances, (7) mutual funds, (8) investment pools, (9) guaranteed investment contracts, and (10) common trust funds. Management of the District believes it is in compliance with the requirements of the Act and with local policies. In compliance with the Public Funds Investment Act, the District has adopted a deposit and investment policy. That policy does address the following risks: Custodial Credit Risk – Deposits: In the case of deposits, this is the risk that in the event of a bank failure, the government’s deposits may not be returned to it. The District’s policy regarding types of deposits allowed and collateral requirements is all deposits are covered by FDIC insurance, pledged collateral and/or corporate surety bond is their entirety. Custodial Credit Risk – Investments: For an investment, this is the risk that, in the event of the failure of the counterparty, the government will not be able to recover the value of its investments or collateral securities that are in the possession of an outside party. The District has no investments exposed to Custodial Credit Risk. Interest-rate Risk – The District has a policy that states Investments shall be made in a manner that ensures the preservation of capital in the overall portfolio, and offsets during a 12-month period
56

any market price losses resulting from interest-rate fluctuations by income received from the balance of the portfolio. Concentration Risk – The District policy states that the investment portfolio shall be diversified in terms of investment instruments, maturity scheduling, and financial institutions to reduce risk of loss resulting from overconcentration of assets in a specific class of investments, specific maturity, or specific issuer. The District’s investments at June 30, 2007, are shown below:
Investment Type Credit Rating Fair ValueTEXPOOL AAAm $221,431,616
FHLMC Discount Note AAA 6,325,000 FNMA Discount Note AA 6,000,000
FHLB Discount Note AAA 6,985,000 Woodhaven National Bank Certificates of Deposit 11,207,627
Total Investments $251,949,243
TexPool is a public funds investment pool created by the Texas Treasury Safekeeping Trust Company (Trust Company) to provide a safe environment for the placement of local government funds in authorized short-term, fully-collateralized investments, including direct obligations of, or obligations guaranteed by, the United States or State of Texas or their agencies; federally insured certificates of deposit issued by Texas banks or savings and loans; and fully collateralized direct repurchase agreements secured by U.S. Government agency securities and placed through a primary government securities dealer. The Trust Company was incorporated by the State Treasurer upon authority of the Texas Legislature as a special purpose trust company with direct access to the services of the Federal Reserve Bank to manage, disburse, transfer, safekeep and invest public funds and securities more efficiently and economically. The State Comptroller of Public Accounts exercises oversight responsibility over TexPool. Oversight includes the ability to significantly influence operations, designation of management, and accountability for fiscal matters. TexPool operates in a manner consistent with the Security and Exchange Commission’s Rule 2a7 of the Investment Company Act of 1940. TexPool uses amortized cost rather than market value to report net assets to compute share prices. The fair value of the position in TexPool is the same as the value of TexPool shares. Accordingly, the District’s investments in TexPool are stated at cost, which approximates fair value. Investments have been recorded at fair value based upon quoted market prices as of June 30, 2007, with the difference between the purchase price and market price being recorded as interest income. None of the District’s investments have been reported at amortized cost. Both cash deposits and investments held at a financial institution can be categorized according to three levels of risk: Category 1 Cash or Investments that are insured or registered or for which the securities are held
by the District or its agent in the District’s name. Category 2 Cash or Investments that are uninsured and unregistered for which the securities are
held by the counterparty’s trust department or agent in the District’s name.
57

Category 3 Cash or Investments that are uninsured and unregistered for which the securities are held by the counterparty or held by the trust department or its agent, but not in the District’s name.
Based on these levels of risk, all of the District’s cash deposits and investments are classified as Category 1 at year end. B. Receivables Receivables as of June 30, 2007, for the government’s individual major funds, nonmajor and fiduciary funds in the aggregate, including the applicable allowances for uncollectible accounts, are as follows:
General
Debt Service
Other Funds
Total
Taxes $5,690,172 $1,433,228 $ 0 $7,123,400 Due from other Governments 1,237,797 0 993,743 2,231,540 Other Receivables 40,324 31,236 64,561 136,121 Gross Receivables 6,968,293 1,464,464 1,058,304 9,491,061 Less: allowance for uncollectible (426,763) (107,492) 0 (534,255) Net Total Receivables $6,541,530
$ 1,356,972
$ 1,058,304
$8,956,806
Governmental funds report deferred revenue in connection with receivables for revenues that are not considered to be available to liquidate liabilities of the current period. Governmental funds also defer revenue recognition in connection with resources that have been received, but not yet earned. At the end of the current fiscal year, the various components of deferred revenue and unearned revenue reported in the governmental funds were as follows:
Unavailable Unearned Delinquent property taxes receivable (General) $5,690,172 $ 0 Delinquent property taxes receivable (Debt Service) 1,433,228 558,494 Advance funding Total deferred/unearned revenue for Governmental funds
$7,123,400
$ 558,494
C. Capital assets
Prior to GASB State No. 34 the District was not required to calculate depreciation expense for reporting capital assets. In accordance with the implementation of GASB Statement No. 34, capital assets have been adjusted to reflect historical cost for the purpose of calculating depreciation. The adjustments are shown below. Capital asset activity for the governmental activities for the fiscal year ended June 30, 2007 was as follows:
58

Beginning Balance
Increases
Decreases
Ending Balance
Capital assets, not depreciated
Land $ 14,068,819 $1,366,532 $61,903 $ 15,373,448 Construction in progress 11,763,778 8,064,803 12,284,872 7,543,709 Total capital assets, not depreciated
25,832,597
9,431,335
12,346,775
22,917,157
Capital assets, being depreciated:
Buildings and Improvements 238,686,405 15,179,862 253,866,267 Furniture & Equipment 4,191,722 511,275 4,702,997 Machinery 321,195 31,675 352,870 Total capital assets, being depreciated
243,199,322
15,722,812
258,922,134
Less accumulated depreciation for:
Buildings and Improvements (28,510,868) (4,207,494) (32,718,362) Furniture & Equipment (2,567,503) ( 245,536) ( 2,813,039) Machinery ( 338,678) ( 34,661) ( 373,339) Total accumulated depreciation
(31,417,049)
(4,487,691)
(35,904,740)
Governmental activities capital assets, net
$237,614,870
$20,666,456
$12,346,775
$245,934,551
Depreciation expense of the governmental activities was charged to functions/programs as follows:
Instruction $3,105,571 Instructional Resources and Media Services 96,111 Curriculum & Instructional Staff Development 44 School Leadership 162,944 Guidance, Counseling and Evaluation Services 10,520 Health Services 94,134 Student (Pupil) Transportation 3,800 Child Nutrition 178,361 Cocurricular/Extracurricular Activities 562,479 General Administration 44,018 Plant Maintenance and Operations 139,875 Security and Monitoring Services 9,880 Data Processing Services 24,487 Facilities Acquisition and Construction 55,467 Total Depreciation Expense $4,487,691
59
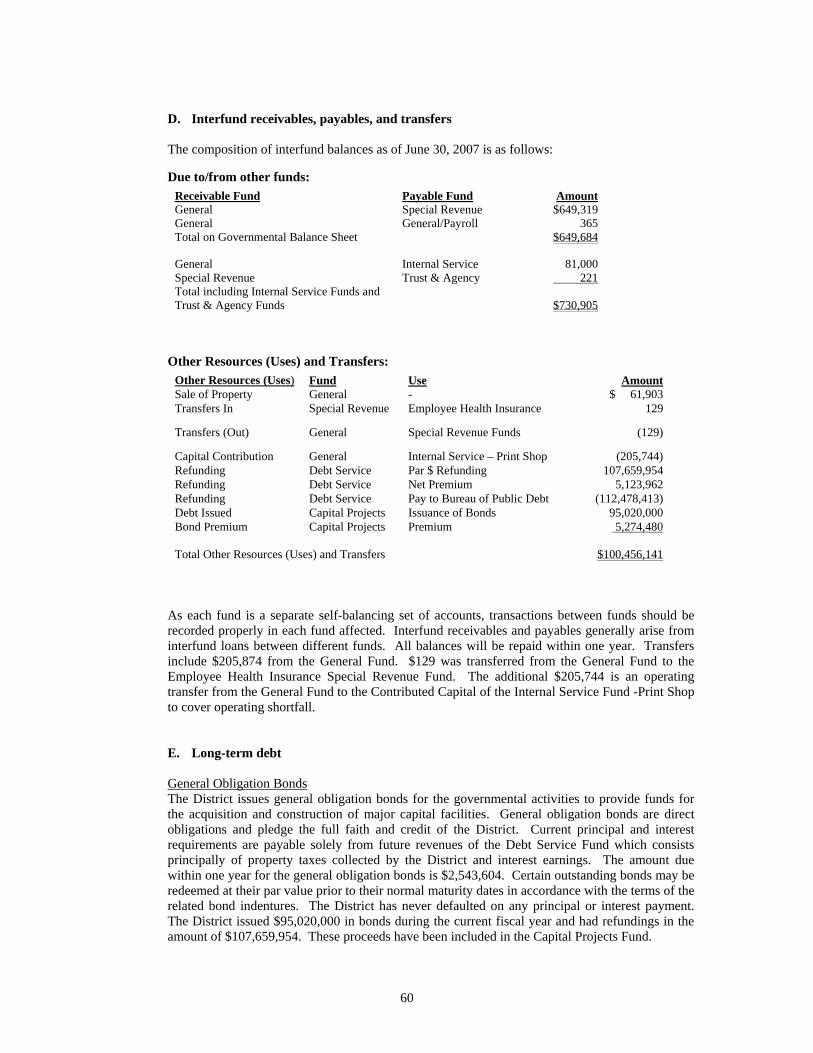
D. Interfund receivables, payables, and transfers
The composition of interfund balances as of June 30, 2007 is as follows: Due to/from other funds:
Receivable Fund Payable Fund Amount General Special Revenue $649,319 General General/Payroll 365 Total on Governmental Balance Sheet $649,684
General Internal Service 81,000 Special Revenue Trust & Agency 221 Total including Internal Service Funds and Trust & Agency Funds
$730,905
Other Resources (Uses) and Transfers:
Other Resources (Uses) Fund Use Amount Sale of Property General - $ 61,903 Transfers In Special Revenue Employee Health Insurance 129
Transfers (Out) General Special Revenue Funds (129)
Capital Contribution General Internal Service – Print Shop (205,744) Refunding Debt Service Par $ Refunding 107,659,954 Refunding Debt Service Net Premium 5,123,962 Refunding Debt Service Pay to Bureau of Public Debt (112,478,413) Debt Issued Capital Projects Issuance of Bonds 95,020,000 Bond Premium Capital Projects Premium 5,274,480 Total Other Resources (Uses) and Transfers $100,456,141
As each fund is a separate self-balancing set of accounts, transactions between funds should be recorded properly in each fund affected. Interfund receivables and payables generally arise from interfund loans between different funds. All balances will be repaid within one year. Transfers include $205,874 from the General Fund. $129 was transferred from the General Fund to the Employee Health Insurance Special Revenue Fund. The additional $205,744 is an operating transfer from the General Fund to the Contributed Capital of the Internal Service Fund -Print Shop to cover operating shortfall. E. Long-term debt
General Obligation Bonds The District issues general obligation bonds for the governmental activities to provide funds for the acquisition and construction of major capital facilities. General obligation bonds are direct obligations and pledge the full faith and credit of the District. Current principal and interest requirements are payable solely from future revenues of the Debt Service Fund which consists principally of property taxes collected by the District and interest earnings. The amount due within one year for the general obligation bonds is $2,543,604. Certain outstanding bonds may be redeemed at their par value prior to their normal maturity dates in accordance with the terms of the related bond indentures. The District has never defaulted on any principal or interest payment. The District issued $95,020,000 in bonds during the current fiscal year and had refundings in the amount of $107,659,954. These proceeds have been included in the Capital Projects Fund.
60

There are a number of limitations and restrictions contained in the general obligation bond indenture. Management of the District has indicated that the District is in compliance with all significant limitations and restrictions at June 30, 2007. General obligation bonds payable at June 30, 2007 are summarized as follows:
Date Of
Issue
Original Issue
Final Maturity
% Rate
Outstanding Balance 6/30/06
Issued
Current Year
Current Year
Principal Payments/ Refundings
Accum.
Accreted Interest
Outstanding
Balance 6/30/07
1990 $14,319,316 2015 7.05% - 7.25% $ 13,912,114 $1,489,836 $3,233,750 $ 12,569,787 1997 $24,803,423 2032 4.00% - 6.38% 7,216,572 58,869 5,470,724 7,175,173 2001 $75,000,000 2026 2.65% - 5.00% 71,740,000 67,860,000 0 3,880,000 2002 $47,539,984 2028 4.80% - 5.21% 47,826,864 40,000,000 292,648 7,832,632 2004 $60,115,000 2029 2.75% - 5.00% 60,115,000 0 0 60,115,000 2005 $54,475,000 2032 4.37% - 5.00% 54,475,000 0 0 54,475,000 2006 $68,500,000 2031 3.75% - 5.50% 68,500,000 107,659,954 3,922,656 0 172,237,298 2006 $95,020,000 2032 3.63% - 5.00% 0 95,020,000 0 0 95,020,000
Total $323,785,550 $202,679,954 $113,331,361 $8,997,122 $413,304,890
Governmental Activities
Beginning Balance
Increases
Decreases
Ending Balance
General Obligation Bonds $314,959,175 $202,679,954 $113,331,361 $404,307,768 Accreted Interest Payable 8,826,375 170,747 0 8,997,122 Total $323,785,550 $202,850,701 $113,331,361 $413,304,890
Annual debt service requirements to maturity for general obligation bonds are as follows:
Year Ended June 30,
Principal
Interest
Total
Requirements 2008 2,543,604 20,421,602 22,965,206 2009 3,159,327 24,351,807 27,511,134 2010 4,114,082 23,140,871 27,254,953 2011 4,732,259 23,460,956 28,193,215 2012 5,602,186 23,521,004 29,123,190 2013-2017 32,968,871 112,743,257 145,712,128 2018-2022 82,595,852 78,172,119 160,767,971 2023-2027 120,958,891 54,183,921 175,142,812 2028-2032 130,464,239 22,378,457 152,842,696 2033-2033 17,168,457 1,008,429 18,176,886 $404,307,768 $383,382,423 $787,690,191
61

III. Other Information
A. Risk management
General The District is exposed to various risks of loss related to torts; theft of, damage to, and destruction of assets; errors and omissions; injuries to employees and natural disasters for which the District carries commercial insurance. The District purchases replacement value commercial property insurance. Such insurance is consistent with the prior year, and no losses were sustained in excess of the coverage over the past three fiscal years. Health Care The District sponsors a self-insurance plan to provide health care benefits to staff members and their dependents. Transactions related to the plan are accounted for in the Self-Insurance Fund (the “Fund”), an internal service fund of the District. The District contributed $270,000 to establish the plan. During fiscal year 2007, the District contributed $260 per month, per employee to the plan. The total contribution was $2,190,583. The employees at their option, authorized payroll withholdings to pay contributions or premiums for dependent’s health insurance. If the employee chose not to accept the health insurance, the District contributed $50 per month, which provided an addition to the life insurance policy in the amount of $50,000 and a hospitalization indemnity plan. All contributions are retained by the District. Health claim payments were processed by a third party administrator acting on behalf of the District. The District’s present insurer is United HealthCare, whose latest financial statements are available for the fiscal year ended, December 31, 2006, and filed with the Texas State Board of Insurance, Austin, Texas and are public record. Workers’ Compensation Effective June 1, 2001, The District entered into a fully insured arrangement with Deep East Texas Insurance Company. The District is not at risk for claims in excess of premiums paid; however, the District remains liable for claims incurred prior to June 1, 2001. The claims liability recorded in the general fund includes an estimate for claims incurred but not reported, based on the District’s historical claims experience. Changes in the balances of claims liabilities for the workers compensation insurance fund during the fiscal year are as follows:
Fiscal Year Ended June 30, 2006
Fiscal Year Ended June 30, 2007
Unpaid Claims, beginning $ 51,842 $ 74,874 Incurred Claims (including IBNR’s) 406,788 33,813 Claim Payments (383,756) (16,221) Unpaid Claims, ending $ 74,874 $ 92,466
B. Employee retirement systems and pension plans
Plan description – The District and its employees contribute to the Teacher Retirement System of Texas (TRS), a cost sharing multiple employer defined benefit pension plan. TRS administers retirement and disability annuities, and death and survivor benefits to employees and beneficiaries
62

of employees of the public school systems of Texas. TRS operates primarily under the provisions of the Texas Constitution, Article XVI, Section 67, and Texas Government Code, Title 8, Subtitle C. TRS also administers proportional retirement benefits and service credit transfers under Texas Government Code, Title 8, Chapters 803 and 805, respectively. Funding Policy - State law provides for fiscal years 2007, 2006 and 2005 a state contribution rate of 6.5% and a member contribution rate of 6.4%. In certain instances the reporting district (I.S.D., college, university, or state agency) is required to make all or a portion of the state’s 6.5% contribution. Contribution requirements are not actuarially determined but are legally established each biennium pursuant to the following state funding policy: (1) The state constitution requires the legislature to establish a member contribution rate of not less than 6.0% of the member’s annual compensation and a state contribution rate of not less than 6.0% and not more than 10.0% of the aggregate annual compensation of all members of the system during that fiscal year; (2) A state statute prohibits benefit improvements or contribution reductions if, as a result of a particular action, the time required to amortize TRS’s unfunded actuarial liabilities would be increased to a period that exceeds 31 years, or, if the amortization period already exceeds 31 years, the period would be increased by such action. Types of staff members covered - All staff members who are employed for one-half or more of the standard work load and who are not exempted from membership under Texas Government Code, Title 8, Subtitle C, Section 822.002 are covered. Service retirement is as follows: Normal • Any combination of age plus years of service which equals 80 • Age 65 with 5 years of service
Reduced • Age 55 with at least 5 years of service • Any age below 55 with 30 years of service
A member is fully vested after 5 years of creditable service and entitled to any benefit for which eligibility requirements have been met. Contribution made by the State on behalf of the District are recorded in the financial statements as both revenue and expense. Total on behalf payments for the fiscal year were $2,592,431. The District’s employees’ contributions to the TRS system for the fiscal year ended June 30, 2007, June 30, 2006 and June 30, 2005 were $3,060,340, $2,626,168 and $2,233,160 respectively, equal to the required contributions for each year. TRS issues a publicly available financial report that includes financial statements and required supplementary information for the defined benefit pension plan. That report may be obtained by writing to the TRS Communications Department, 1000 Red River Street, Austin, Texas 78701, by calling the TRS Communications Department at 1-800-223-8778, or by downloading the report from the TRS Internet Website, www.trs.state.tx.us, under the TRS Publications heading. C. Budgetary compliance
There were no instances of the District’s Budgetary Comparisons having any negative variances.
D. Construction and other significant commitments and contingencies
Federal Programs – The District participates in numerous state and federal grant programs, which are governed by various rules and regulations of the grantor agencies. Costs charged to the
63

respective grant programs are subject to audit and adjustment to the grantor agencies; therefore, to the extent that the District has not complied with the rules and regulations governing the grants, refunds of any money received may be required and the collectibility of any related receivable at June 30, 2007, may be impaired. In the opinion of the District administration, there are no significant contingent liabilities relating to compliance with the rules and regulations governing the respective grants; therefore, no provisions have been recorded in the accompanying financial statements for such contingencies. Construction – The District was obligated at June 30, 2007, under contracts for various construction projects. Total outstanding contracts associated with projects were approximately $224.48 million of which approximately $25,794,215 had been incurred as of June 30, 2007.
E. Jointly governed organization
The District is not a member of a Shared Services Arrangement (“SSA”) at this time. F. Litigation There are no claims or pending actions incident to normal operations of the District which require disclosure. In the opinion of the District administration, the District’s potential liability in these matters will not have a material impact on the financial statements.
64


NONMAJOR GOVERNMENTAL FUNDS SPECIAL REVENUE FUNDS
Special revenue funds are used to account for the proceeds of specific revenue sources that are legally restricted to expenditure for particular purposes. Most, but not all, of these funds must be applied for through the Standard Application System (SAS). ESEA, Title IV Safe & Drug-Free Schools – Develop age-appropriate comprehensive violence and drug/alcohol education prevention programs. ESEA, Title I, Part A, Improving Basic Program – Provide opportunities for children served to acquire knowledge and skills to meet the challenging state performance standards developed for all children. IDEA – Part B, Formula & Capacity Building & Improvements – Operate educational programs for handicapped children with disabilities. IDEA – Part B, Preschool – Support programs for preschool children with disabilities. National School Breakfast and Lunch Program – Support programs using federal reimbursement revenues from the United States Department of Agriculture (USDA). Vocational Education – Basic Grant – Provide career and technology education to develop new and/or improved marketable skills for paid and unpaid employment. ESEA II, A Training and Recruiting – Provide programs for improvement for school principals and recruiting of teachers. Title II, D Enhancing Education Through Technology – Funds granted for the implementation and support of a comprehensive system that effectively uses technology in elementary and secondary schools to improve student academic achievement. Title III, Part A - English Language Acquisition - Funds used for programs to teach English. Title V, Part A – Innovative Programs – Funds granted to implement or expand innovative assistance programs to improve student, teacher, and school performance through a variety of local reform and improvement activities. Other Federal Special Revenue Funds – This fund classification is to be used to account, on a project basis, for federally funded special revenue funds that have not been specified. Pregnancy Education & Parenting Program – Provide pregnant and parenting students the services needed to keep them in school until completion. Advance Placement Incentives – Support professional development of teachers teaching advanced classes. Student Success Initiative – Support students who take the advanced classes.
66

NONMAJOR GOVERNMENTAL FUNDS SPECIAL REVENUE FUNDS
Technology Allotment – To purchase technological software or equipment that contributes to student learning or training for educational personnel involved in the use of such materials. Kindergarten and Pre-K Grants – Funds granted to implement or expand Kindergarten PreKindergarten programs. Employee Health Insurance – Local Fund set up for employee health insurance contributions. High School Allotment – Foundation School Fund which provides additional state aid to Districts’ for the purpose of improving graduation and college readiness. Other State Special Revenue Fund – State funded special revenue funds not listed above are to be accounted for in this fund. Campus Activity – To account for transactions related to a principal’s activity fund. Foundation – Funds granted through the Northwest Education Foundation. Other Local Special Revenue Funds – These fund classifications are used, at the option of the school district to classify locally funded special revenue funds such as grants by corporations to specific campuses not defined elsewhere.
67

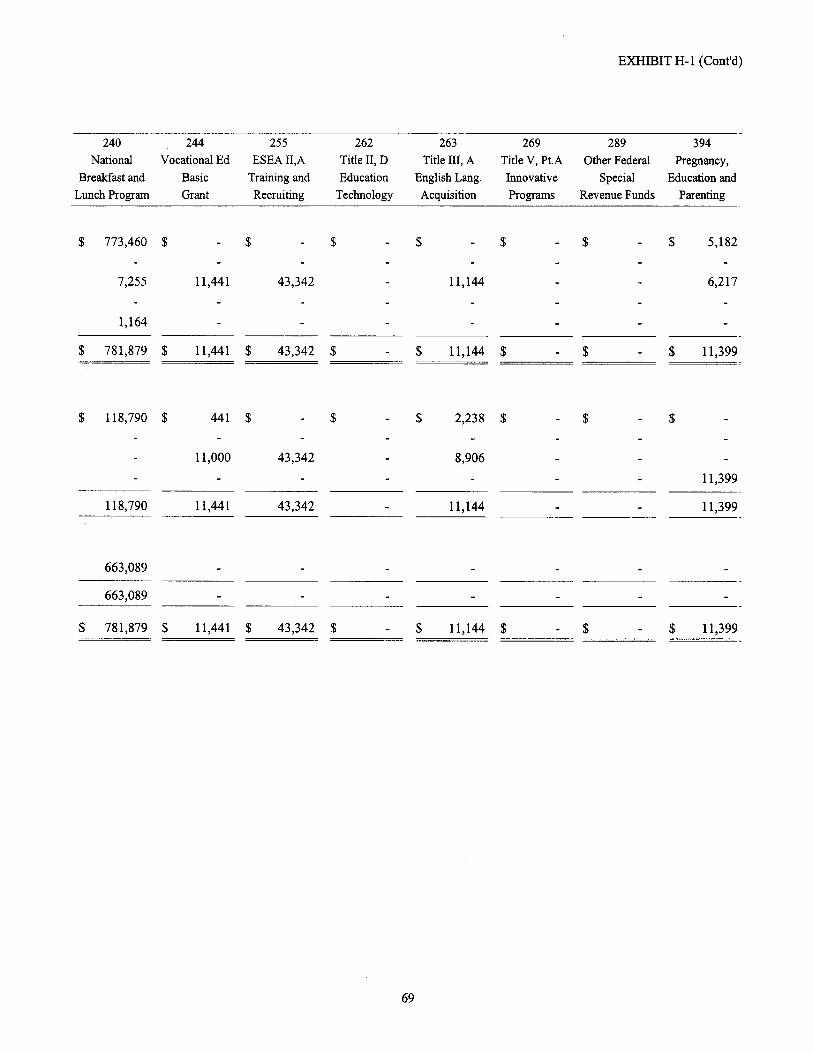


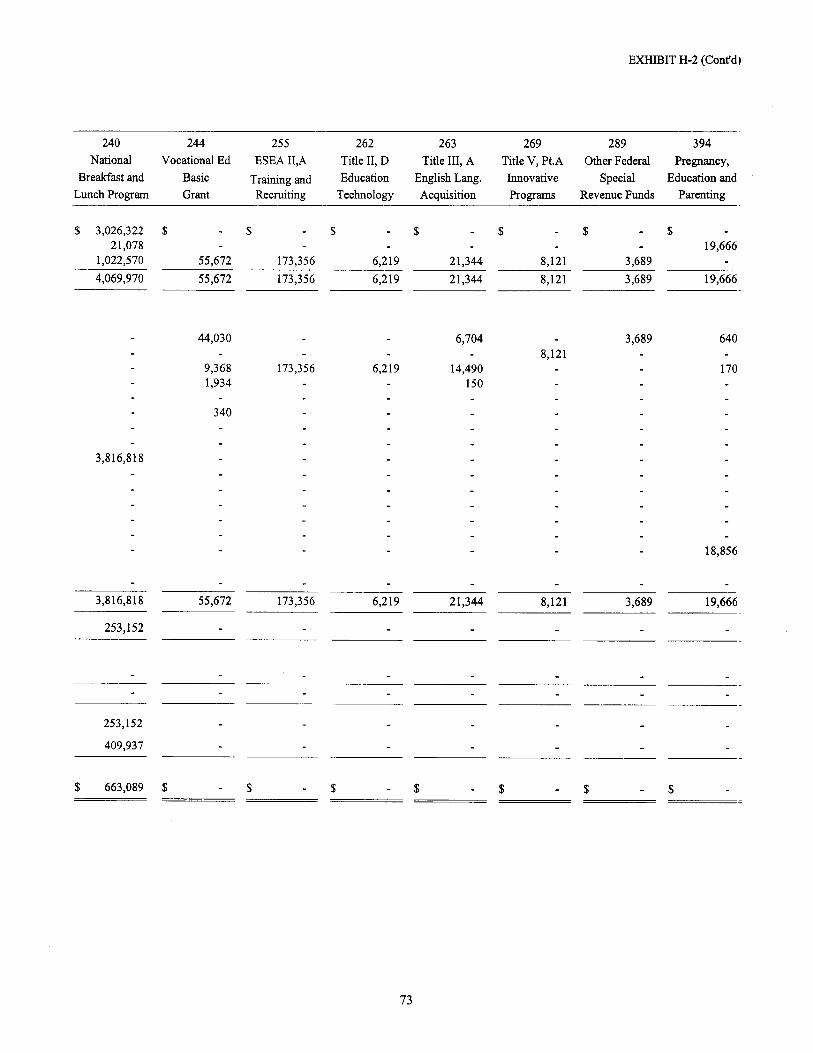


THIS PAGE LEFT BLANK INTENTIONALLY
76

INTERNAL SERVICE FUNDS
77


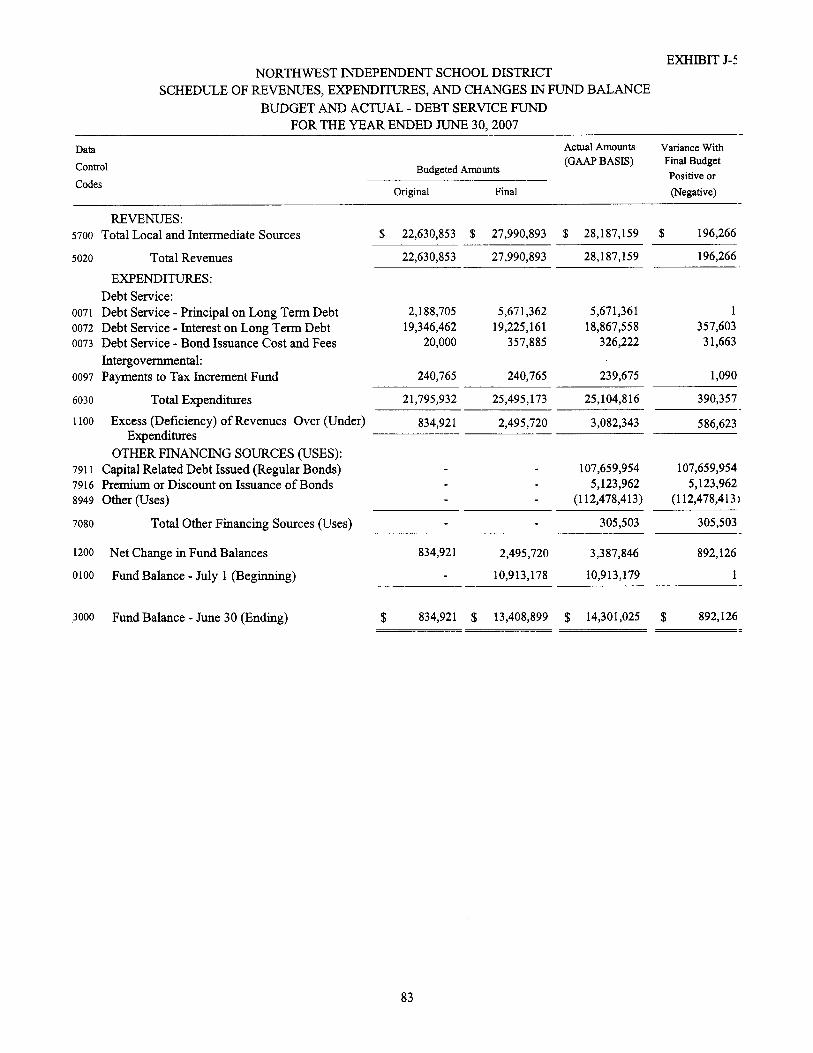

Buildings Furniture Constructionand and in
Land Improvements Fixtures Progress Total
Senior High School: 9,009,041$ 97,178,329$ 2,182,526$ -$ 108,369,896$
Middle Schools: 2,061,307 49,752,853 382,961 - 52,197,121
Elementary Schools: 3,840,081 88,559,046 1,079,505 7,543,709 101,022,341
Administration and Services: 463,019 18,376,039 1,410,875 - 20,249,933
Total Capital Assets 15,373,448$ 253,866,267$ 5,055,867$ 7,543,709$ 281,839,291$
Activity
NORTHWEST INDEPENDENT SCHOOL DISTRICTCAPITAL ASSETS USED IN THE OPERATION OF GOVERNMENTAL FUNDS
SCHEDULE BY FUNCTION AND ACTIVITYJUNE 30, 2007
84

General GeneralFixed Assets Fixed Assets
7/1/2006 Increases Decreases 6/30/2007
Senior High School:Land 9,009,041$ -$ -$ 9,009,041$ Building & Improvements 96,730,981 447,348 - 97,178,329 Furniture & Equipment 2,171,502 11,024 - 2,182,526 Construction-in-progress - - - - Total 107,911,524 458,372 - 108,369,896
Middle Schools:Land 1,326,780 734,527 - 2,061,307 Building & Improvements 47,407,587 2,345,266 - 49,752,853 Furniture & Equipment 314,576 68,385 - 382,961 Construction-in-progress - - - - Total 49,048,943 3,148,178 - 52,197,121
Elementary Schools:Land 3,208,076 632,005 - 3,840,081 Building & Improvements 76,194,518 12,364,528 - 88,559,046 Furniture & Equipment 762,633 316,872 - 1,079,505 Construction-in-progress 11,763,778 8,064,803 12,284,872 7,543,709 Total 91,929,005 21,378,208 12,284,872 101,022,341
Administration and Services:Land 524,922 - 61,903 463,019 Building & Improvements 18,353,319 22,720 - 18,376,039 Furniture & Equipment 1,264,206 146,669 - 1,410,875 Construction-in-progress - - - - Total 20,142,447 169,389 61,903 20,249,933
Total for All Functions/Activities: 269,031,919$ 25,154,147$ 12,346,775$ 281,839,291$
Function/Activity
NORTHWEST INDEPENDENT SCHOOL DISTRICTCAPITAL ASSETS USED IN THE OPERATION OF GOVERNMENTAL FUNDS
SCHEDULE OF CHANGES BY FUNCTION AND ACTIVITYFOR THE FISCAL YEAR ENDED, JUNE 30, 2007
85

Buildings Furniture Construction and and In
Land Improvements Equipment Progress Total
Senior High School: 9,009,041$ 97,178,329$ 2,182,526$ -$ 108,369,896$
Total 9,009,041 97,178,329 2,182,526 - 108,369,896
Middle Schools: 2,061,307 49,752,853 382,961 - 52,197,121
Total 2,061,307 49,752,853 382,961 - 52,197,121
Elementary Schools: 3,840,081 88,559,046 1,079,505 7,543,709 101,022,341
Total 3,840,081 88,559,046 1,079,505 7,543,709 101,022,341
Administration and Services: 463,019 18,376,039 1,410,875 - 20,249,933
Total 463,019 18,376,039 1,410,875 - 20,249,933
Total for all Locations 15,373,448$ 253,866,267$ 5,055,867$ -$ 281,839,291$
Location
NORTHWEST INDEPENDENT SCHOOL DISTRICTCAPITAL ASSETS USED IN THE OPERATION OF GOVERNMENTAL FUNDS
SCHEDULE BY LOCATIONFOR THE FISCAL YEAR ENDED, JUNE 30, 2007
86

OTHER COMPLIANCE SCHEDULES
Other Financial Information includes various schedules required by the Texas Education Agency that are not required disclosures in the Comprehensive Annual Financial Report.
87


THIS PAGE LEFT BLANK INTENTIONALLY
92

STATISTICAL SECTION This part of the District’s statistical comprehensive annual financial report presents detailed information as a context for understanding the information in the financial statements, note disclosures, and required supplementary information. The statistical section includes nineteen schedules. These schedules fall within the following categories: Financial Trend Data
These schedules contain trend information on how the District’s financial performance and well-being have changed over time.
Revenue Capacity Data These schedules contain information on the District’s most significant local revenue source, the property tax.
Debt Capacity Data
These schedules present information to help assess the affordability of the District’s current levels of outstanding debt and the District’s ability to issue additional debt in the future.
Demographic and Economic Information
These schedules offer demographic and economic indicators to help understand the environment within which the District’s financial activities take place.
Operating Information
These schedules contain service and infrastructure data to help the reader understand how the information in the District’s financial report relates to the service the District provides and the activities it performs.
93

NORTHWEST INDEPENDENT SCHOOL DISTRICTNET ASSETS BY COMPONENT
LAST SIX FISCAL YEARS(accrual basis of accounting)
SCHEDULE 1
Fiscal Year2007 2006 2005 2004
Governmental activities
Invested in capital assets, net of related debt 29,231,862$ (86,170,680)$ (13,360,751)$ (53,068,705)$ Restricted 173,029,404 90,265,107 32,656,365 79,296,964 Unrestricted (138,834,103) 42,263,386 29,001,690 29,463,998
Total primary government net assets 63,427,163$ 46,357,813$ 48,297,304$ 55,692,257$
Note:The District began to report accrual information when it implemented GASB Statement No. 34 in 2002.
94

2003 2002
(43,922,421)$ 29,882,682$ 11,801,326 9,532,093 76,363,184 2,437,093
44,242,089$ 41,851,868$
95

NORTHWEST INDEPENDENT SCHOOL DISTRICTEXPENSES, PROGRAM REVENUES AND NET (EXPENSE)/REVENUE
LAST SIX FISCAL YEARS(accrual basis of accounting)
SCHEDULE 2
Fiscal Year2007 2006 2005 2004
ExpensesGovernmental activities:
Instruction 47,921,489$ 41,395,951$ 34,553,311$ 19,667,137$ Instruction Resources & Media Services 1,266,133 1,182,446 1,029,578 1,067,791 Curriculum and Staff Development 3,075,564 2,196,842 1,983,711 1,819,718 Instructional Leadership 544,094 483,573 506,417 486,579 School Leadership 3,434,469 3,169,379 2,754,980 2,427,122 Guidance, Counseling & Evaluation Services 2,710,088 2,368,871 2,019,657 1,905,205 Social Work Services 90,841 85,213 72,783 198,966 Health Services 741,643 700,700 595,521 511,383 Student (Pupil) Transportation 3,540,291 3,378,362 2,913,160 2,840,679 Food Services 3,995,179 3,377,610 2,815,891 2,385,175 Cocurricular/Extracurricular Activities 3,740,547 3,452,380 2,662,022 2,477,589 General Administration 8,660,505 7,654,224 7,511,061 5,939,135 Plant Maintenance and Operations 22,055,209 7,892,761 14,989,756 379,547 Security and Monitoring Services 269,466 269,979 223,713 241,099 Data Processing Services 1,459,456 1,351,874 1,222,014 1,326,806 Community Services 238,940 196,960 154,066 94,557 Debt Service - Principal on Long-Term Debt - - - - Debt Service - Interest on Long-Term Debt 18,867,558 17,549,564 14,641,195 16,349,287 Debt Service - Bond Issuance Cost & Fees 326,222 5,123 11,373 9,155 Facilities Acquisition and Construction - 8,676,166 - 1,660 Contracted Instructional Services 35,630,381 35,836,145 26,455,924 17,991,477 Payments to Juvenile Justice Alternative Education Program 10,191 8,295 790 13,898 Payments to Tax Increment Fund 1,191,213 1,208,879 1,089,958 1,248,963
Total primary government expenses 159,769,479 142,441,297 118,206,881 79,382,928
Program RevenuesGovernmental activities:
Charges for services Instruction 2,285,066 1,996,317 1,710,814 1,316,235 Food services 3,026,322 2,478,733 2,010,733 1,629,094 Operating grants and contributions 11,653,548 6,797,186 6,991,772 5,785,638
Total primary government program revenues 16,964,936 11,272,236 10,713,319 8,730,967
Net (Expense)RevenueTotal primary government net expense (142,804,543)$ (131,169,061)$ (107,493,562)$ (70,651,961)$
Note:The district began to report accrual information when it implemented GASB Statement 34 in 2002.
96

2003 2002
28,944,266$ 24,111,072$ 1,002,933 988,258 1,947,131 1,786,123
538,744 470,353 2,376,256 2,221,538 1,656,222 1,660,129
190,396 174,906 494,468 519,189
2,721,313 2,317,187 1,896,138 1,635,540 2,412,340 1,983,605 2,070,338 2,363,125 4,466,727 4,298,973
203,319 252,073 1,323,790 789,247
26,359 25,067 - -
6,750,160 5,823,153 4,316 -
22,385 33,190,777 14,778,140 9,380,045
13,510 4,104 1,129,989 1,622,715
74,969,240 95,617,179
1,198,531 1,135,904 1,267,106 1,005,537 7,462,700 5,678,778 9,928,337 7,820,219
(65,040,903)$ (87,796,960)$
97

NORTHWEST INDEPENDENT SCHOOL DISTRICTGENERAL REVENUES AND TOTAL CHANGE IN NET ASSETS
LAST SIX FISCAL YEARS(accrual basis of accounting)
SCHEDULE 3
Fiscal Year2007 2006 2005 2004
Net (Expense)/RevenueTotal primary government net expense (142,804,543)$ (131,169,061)$ (107,493,562)$ (70,651,958)$
General Revenues and Other Changes inNet Assets
Governmental activities:Taxes Property taxes levied for general purposes 109,213,582 93,844,438 80,966,403 60,744,325 Property taxes levied for capital projects 28,392,542 20,016,389 17,187,641 13,334,120 Sales tax - - - - Unrestricted grants and contributions - 238,948 112,006 2,459,168 State aid - formula grants 12,399,899 3,465,070 3,679,769 - Miscellaneous - 7,653,769 4,759,248 4,907,010 Special items 7,534,668 Investment earnings 9,867,870 4,010,956 1,826,832 1,137,400
Total primary government 159,873,893 129,229,570 108,531,899 90,116,691
Change in Net AssetsTotal primary government 17,069,350$ (1,939,491)$ 1,038,337$ 19,464,733$
Note:The district began to report accrual information when it implemented GASB Statement 34 in 2002.
98

2003 2002
(65,040,903)$ (87,796,960)$
54,206,789 52,995,342 12,411,055 3,988,897
- - - 1,015,025
2,138,866 - 156,897 416,311
(2,877,698) - 1,395,215 2,276,974
67,431,124 60,692,549
2,390,221$ (27,104,411)$
99

NORTHWEST INDEPENDENT SCHOOL DISTRICTFUND BALANCES, GOVERNMENTAL FUNDS
LAST SIX FISCAL YEARS(modified accrual basis of accounting)
SCHEDULE 4
Fiscal Year2007 2006 2005 2004
General FundReserved 420,309$ 420,309$ -$ 1,321,237$ Unreserved, designated 26,709,991 9,567,387 9,323,221 8,541,663 Unreserved 24,148,506 26,844,527 24,788,815 15,849,762
Total general fund 51,278,806$ 36,832,223$ 34,112,036$ 25,712,662$
All Other Governmental FundsReserved 2,543,604$ 1,315,514$ 1,315,514$ 1,315,514$ Unreserved, reported in: Capital projects funds 156,923,378 77,985,308 22,129,586 70,871,504 Debt service funds 11,757,421 9,597,665 8,086,931 6,344,241 Special revenue funds 1,384,692 946,311 704,025 563,368
Total all other governmental funds 172,609,095$ 89,844,798$ 32,236,056$ 79,094,627$
Note:The District began to report accrual information when it implemented GASB Statement 34 in 2002.Unreserved general fund balance and reserved capital projects fund balance have grown over the last two years as the district has accumulated resources to build new schools and expand existing facilities.
100

2003 2002
1,321,237$ 1,321,237$ 8,541,663 6,895,341
14,102,811 16,035,012 23,965,711$ 24,251,590$
10,703,628$ 7,055,865$
42,590,416 39,044,441 - -
446,538 146,660 53,740,582$ 46,246,966$
101
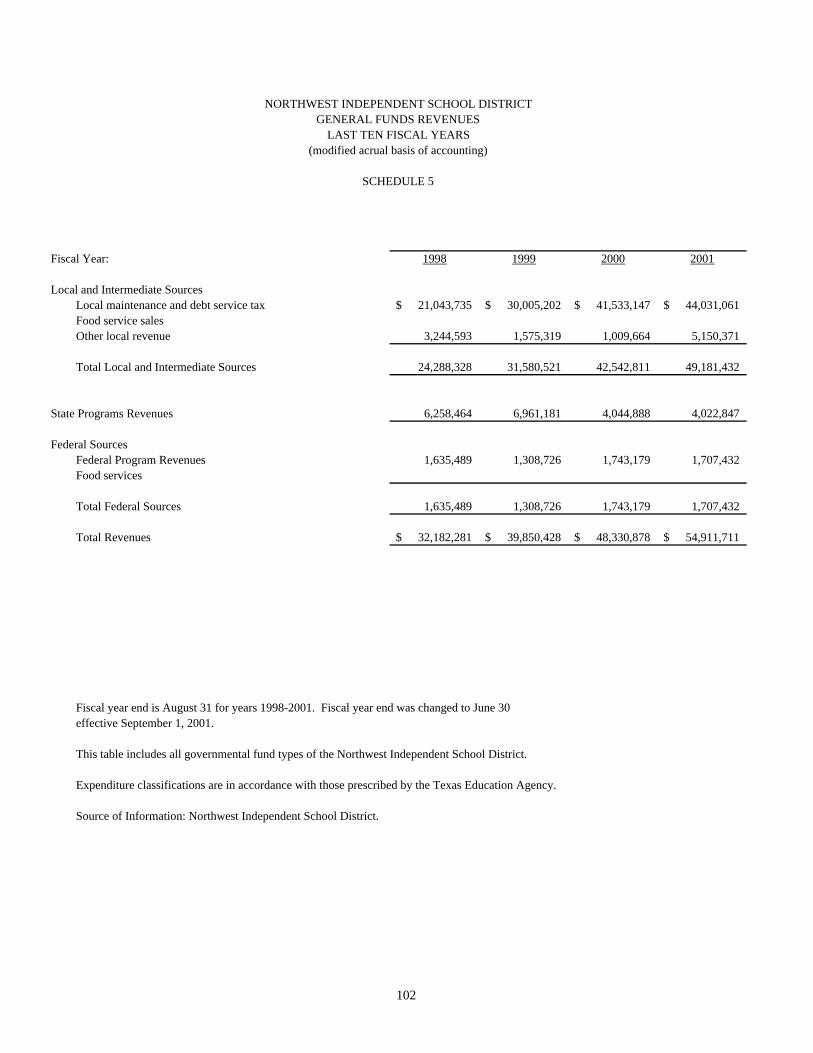
Fiscal Year: 1998 1999 2000 2001
Local and Intermediate SourcesLocal maintenance and debt service tax 21,043,735$ 30,005,202$ 41,533,147$ 44,031,061$ Food service salesOther local revenue 3,244,593 1,575,319 1,009,664 5,150,371
Total Local and Intermediate Sources 24,288,328 31,580,521 42,542,811 49,181,432
State Programs Revenues 6,258,464 6,961,181 4,044,888 4,022,847
Federal SourcesFederal Program Revenues 1,635,489 1,308,726 1,743,179 1,707,432 Food services
Total Federal Sources 1,635,489 1,308,726 1,743,179 1,707,432
Total Revenues 32,182,281$ 39,850,428$ 48,330,878$ 54,911,711$
Fiscal year end is August 31 for years 1998-2001. Fiscal year end was changed to June 30effective September 1, 2001.
This table includes all governmental fund types of the Northwest Independent School District.
Expenditure classifications are in accordance with those prescribed by the Texas Education Agency.
Source of Information: Northwest Independent School District.
SCHEDULE 5
NORTHWEST INDEPENDENT SCHOOL DISTRICTGENERAL FUNDS REVENUES
LAST TEN FISCAL YEARS(modified acrual basis of accounting)
102

2002 2003 2004 2005 2006 2007
56,772,395$ 69,903,877$ 75,642,407$ 98,154,044$ 113,860,827$ 141,025,245$ 1,005,537 1,267,106 1,629,094 2,010,733 2,478,733 3,026,322 5,176,637 2,459,374 6,782,294 5,746,859 5,803,672 1,904,986
62,954,569 73,630,357 84,053,795 105,911,636 122,143,232 145,956,553
2,972,651 5,298,599 5,137,415 6,470,147 6,622,667 15,498,815
1,296,066 1,311,912 1,755,250 2,853,149 2,765,128 2,836,269 437,884 567,412 629,900 745,599 913,624 1,022,570
1,733,950 1,879,324 2,385,150 3,598,748 3,678,752 3,858,839
67,223,286$ 80,240,868$ 90,946,460$ 115,234,932$ 132,444,651$ 165,314,207$
103

NORTHWEST INDEPENDENT SCHOOL DISTRICTGOVERNMENTAL FUNDS EXPENDITURES AND DEBT SERVICE RATIO
LAST TEN FISCAL YEARS(modified accrual basis of accounting)
SCHEDULE 6
Fiscal Year: 1998 1999 2000 2001Expenditures by Function
Instruction 14,857,305$ 16,498,887$ 19,588,201$ 23,640,750$ Instruction Resources & Media Services 512,529 1,051,292 985,802 920,567 Curriculum and Staff Development 256,495 470,280 479,987 1,068,982 Instructional Leadership 355,794 428,590 745,048 887,983 School Leadership 1,227,721 1,677,490 2,165,174 2,624,427 Communication and Dissemination - - - - Guidance, Counseling & Evaluation Services 1,053,199 1,267,457 1,627,614 1,772,847 Social Work Services - 10,442 23,518 25,377 Health Services 230,129 342,804 456,846 442,563 Student (Pupil) Transportation 1,363,335 1,721,047 1,910,314 2,153,764 Food Services 1,173,007 1,321,910 1,376,708 1,444,336 Cocurricular/Extracurricular Activities 685,303 766,571 930,878 2,217,537 General Administration 1,344,886 2,060,121 2,089,942 2,344,771 Plant Maintenance and Operations 2,305,521 3,047,971 3,597,411 4,424,190 Security and Monitoring Services - 103,470 90,252 96,398 Data Processing Services 299,270 1,198,301 545,131 740,206 Community Services - 20,907 46,448 31,391 Debt Service - Principal on Long-Term Debt 605,877 786,287 1,127,297 1,029,693 Debt Service - Interest on Long-Term Debt 1,450,639 1,881,886 3,428,433 4,047,027 Debt Service - Bond Issuance Cost & Fees - - - - Facilities Acquisition and Construction 35,928,401 7,270,610 1,689,785 4,473,403 Contracted Instructional Services - - - 2,910,816 Payments to Juvenile Justice Alternative Education Program - 4,366 10,795 2,651 Payments to Tax Increment Fund - - - 698,731
Total Expenses 63,649,411$ 41,930,689$ 42,915,584$ 57,998,408$
Debt service as a percentage of noncapital expenditures 7.42% 7.70% 11.05% 9.48%
Fiscal year end is August 31 for years 1998-2001. Fiscal year end was changed to June 30effective September 1, 2001.
This table includes all governmental fund types of the Northwest Independent School District.
Expenditure classifications are in accordance with those prescribed by the Texas Education Agency.
Source of Information: Northwest Independent School District.
104

2002 2003 2004 2005 2006 2007
23,093,704$ 27,503,487$ 29,024,505$ 32,052,099$ 38,225,344$ 44,534,680$ 947,338 948,186 999,082 950,652 1,091,151 1,170,022
1,786,122 1,947,131 1,819,718 1,983,711 2,196,842 3,075,519 470,353 538,744 486,579 506,417 483,573 544,094
2,175,551 2,318,902 2,362,403 2,644,477 3,022,267 3,271,525 - - - -
1,654,053 1,648,296 1,895,078 2,009,530 2,358,390 2,699,568 174,906 190,396 198,966 72,783 85,213 90,841 502,784 475,895 494,212 537,089 621,020 647,509
2,314,020 2,717,513 2,836,879 2,909,360 3,374,562 3,536,491 1,953,148 1,781,190 2,246,256 2,667,774 3,203,401 3,816,818 1,548,749 2,253,036 2,309,958 2,489,747 2,922,123 3,178,068 2,363,125 2,832,524 3,013,317 3,502,124 3,513,448 3,793,512 4,271,097 4,849,976 6,268,897 6,816,638 7,751,118 8,797,614
246,020 195,056 231,836 214,450 260,716 259,586 879,360 1,258,246 1,260,740 1,179,827 1,339,650 1,434,969
25,067 26,359 94,557 154,066 196,960 217,510 - 2,444,205 1,733,688 1,406,010 1,242,760 5,671,361
5,823,153 6,750,160 15,930,561 14,432,480 17,549,564 18,867,558 - 4,316 9,155 11,373 5,123 326,222
34,202,577 43,526,229 32,794,502 49,628,086 15,709,218 25,794,215 9,380,045 14,778,140 17,991,477 26,455,924 35,836,145 35,630,381
4,104 13,509 13,898 790 8,295 10,191 1,622,715 1,129,989 1,248,963 1,089,958 1,208,879 1,191,213
95,437,991$ 120,131,485$ 125,265,227$ 153,715,365$ 142,205,762$ 168,559,467$
9.51% 12.01% 19.11% 15.23% 15.23% 17.42%
105

NORTHWEST INDEPENDENT SCHOOL DISTRICTOTHER FINANCING SOURCES AND USES AND NET CHANGE IN FUND BALANCES,
GOVERNMENTAL FUNDSLAST TEN FISCAL YEARS
(modified accrual basis of accounting)
SCHEDULE 7
Fiscal Year 1998 1999 2000 2001
Other Financing Sources (Uses)
General long-term debt issued - - - 1,400,000 Sale of capital assets - - - - Transfers in - - - - Premium or Discount on Issuance of BondsTransfers out - - - - Other (Uses)
Total other financing sources (uses) - - - 1,400,000
Net change in fund balances (30,621,017)$ (2,023,241)$ 4,475,600$ (1,686,697)$
106

2002 2003 2004 2005 2006 2007
75,000,000 46,258,482 60,918,464 244,303 70,310,160 202,679,954 - - 21,400 1,200 3,000 61,903 - 159,867 5,407 5,767 6,993 129
10,398,442 - (159,867) (155,407) (230,054) (230,113) (205,874)
(112,478,413)
75,000,000 46,258,482 60,789,864 21,216 70,090,040 100,456,141
47,223,179$ 6,935,277$ 27,100,997$ (38,459,217)$ 60,328,929$ 97,210,881$
107

Total TotalFiscal Actual Less: Taxable Direct Year Value Exemptions Value Rate
1998 1,756,438,574$ 551,763,173$ 1,204,675,401$ 1.6758$
1999 2,143,204,806 578,587,834 1,564,616,972 1.6625
2000 2,593,170,716 754,838,154 1,838,332,563 1.7047
2001 3,641,376,973 1,144,209,513 2,497,167,460 1.6914
2002 4,478,769,962 1,493,722,916 2,985,047,046 1.8348
2003 4,627,937,049 1,102,131,081 3,525,805,968 1.8348
2004 5,397,835,173 1,183,625,225 4,214,209,948 1.8348
2005 6,207,510,449 783,288,166 5,424,222,283 1.8193
2006 6,906,836,229 740,018,167 6,166,818,062 1.8193
2007 8,702,156,223$ 932,373,881$ 7,769,782,342$ 1.6650$
Fiscal year end is August 31 for years 1998-2001. Fiscal year end was changed to June 30effective September 1, 2001.
Source of Information: Denton Central Appraisal District.
NORTHWEST INDEPENDENT SCHOOL DISTRICTASSESSED VALUE AND ACTUAL VALUE OF TAXABLE PROPERTY
LAST TEN FISCAL YEARS
SCHEDULE 8
108

NORTHWEST INDEPENDENT SCHOOL DISTRICTDIRECT AND OVERLAPPING PROPERTY TAX RATES
LAST TEN FISCAL YEARS(UNAUDITED)
SCHEDULE 9
District Direct Rates Overlapping RatesCity Trophy
City of Club City CityFiscal General Capital Denton of Tarrant Trophy MUD Wise of ofYear Purposes Purposes Total County Fort Worth County Club 1 & 2 County Roanoke Haslet
1998 1.49891 0.17690 1.67581 0.2488 0.8975 0.5560 0.4658 0.6792 0.5730 0.3751 0.3100
1999 1.49891 0.16362 1.66253 0.2350 0.8850 0.6053 0.4605 0.6054 0.5730 0.3751 0.3200
2000 1.49891 0.20581 1.70472 0.2319 0.0875 0.6153 0.4605 0.6054 0.5830 0.3751 0.3500
2001 1.48555 0.20581 1.69136 0.2519 0.8650 0.2748 0.4405 0.6054 0.5830 0.3751 0.3500
2002 1.50000 0.33481 1.83481 0.2490 0.8650 0.2725 0.4405 0.6400 0.5830 0.3751 0.3500
2003 1.50000 0.33481 1.83481 0.2472 0.8650 0.2725 0.4305 0.6190 0.5154 0.3751 0.3450
2004 1.50000 0.33481 1.83481 0.2548 0.8650 0.2725 0.4305 0.6290 0.4415 0.3751 0.3450
2005 1.50000 0.31930 1.81930 0.2465 0.8650 0.2725 0.4305 0.6290 0.4347 0.3751 0.3033
2006 1.50000 0.31930 1.81930 0.2319 0.8600 0.2715 0.4305 0.5490 0.3907 0.3751 0.2903
2007 1.33000 0.33500 1.66500 0.2359 0.8550 0.2665 0.4305 0.5092 0.4119 0.3751 0.2903
* - Per $100 of assessed valuation.
Fiscal year end is August 31 for years 1998-2001. Fiscal year end was changed to June 30effective September 1, 2001.
Source of Information: Denton Central Appraisal District and other assessors.
109

NORTHWEST INDEPENDENT SCHOOL DISTRICTPRINCIPAL PROPERTY TAX PAYERS
CURRENT YEAR AND NINE YEARS AGO
SCHEDULE 10
2007Percent
Total Total ofNature Market Taxable Total Taxable
of Assessed Assessed AssessedName of Taxpayer Property Valuation Valuation Valuation
Devon Energy Operating Co. LP Mineral 1,038,770,770$ 1,038,770,770$ 12.75%XTO Energy Mineral 219,771,230 219,771,230 2.70%Honeywell International Inc. Commercial & Industrial 135,456,258 135,456,258 1.66%Alliance NO 1 Building Partners LP Real Estate 131,280,936 131,280,936 1.61%Devon Energy Prod Co. (Chief) Mineral 102,077,110 102,077,110 1.25%Encana Oil & Gas (USA) Mineral 95,838,510 95,838,510 1.18%Citicorp Technology Inc. Commercial & Industrial 95,665,966 95,665,966 1.17%Cardinal Health 301 Inc. Healthcare 92,921,152 87,070,246 1.07%Amerisource Bergen Commercial & Industrial 123,736,956 84,575,741 1.04%Alliance NO 3 Building Partners LP Real Estate 73,090,505 73,090,505 0.90%Alliance NO 2 Building Partners LP Real Estate 71,621,072 71,621,072 0.88%TXU Electric Delivery Company Utility 52,085,400 52,085,400 0.64%J.C. Penny Company Inc. Commercial & Industrial 51,770,115 51,770,115 0.64%Bell Helicopter Textron Commercial & Industrial 67,185,962 43,604,861 0.54%J.C. Penny Company Inc. Commercial & Industrial 79,531,244 40,844,605 0.50%Chief Operating LLC Mineral 37,776,710 37,776,710 0.46%Randall's Beverage Company Inc. Commercial & Industrial 36,010,915 36,010,915 0.44%W.W. Grainger Inc. Commercial & Industrial 46,564,993 35,518,237 0.44%AIG Technologies Inc. Commercial & Industrial 34,137,284 34,137,284 0.42%AT&T Mobility LLC Commercial & Industrial 217,027,893 32,923,132 0.40%
Total 2,802,320,981$ 2,499,889,603$ 30.69%
Total Assessed Taxable Valuation 8,147,472,710$ 100.00%
Source: County Property Appraiser.
110

1998Percent
Total Total ofNature Market Taxable Total Taxable
of Assessed Assessed AssessedName of Taxpayer Property Valuation Valuation Valuation
Nokia Mobile Phones Amer. Inc. Commercial & Industrial 153,291,130$ 94,044,621$ 20.71%Tech Data Corporation Commercial & Industrial 127,156,381 50,178,481 11.05%Texas Instruments Inc. Commercial & Industrial 104,883,844 69,408,501 15.28%American Airlines Inc. Commercial & Industrial 85,876,678 - 0.00%Zenith Electronics Corporation Commercial & Industrial 49,446,933 4,270,333 0.94%Mitchell Energy Corporation Mineral 46,485,410 46,485,410 10.24%Texas Utilities Electric Company Utility 28,133,500 28,133,500 6.20%Michael's Stores Inc. Commercial & Industrial 21,140,972 7,523,273 1.66%Nestle USA Inc. Commercial & Industrial 19,896,771 15,148,688 3.34%USAA Real Estate Company Real Estate 18,901,058 18,901,058 4.16%Southwestern Bell Telephone Co. Utility 182,098,230 18,209,820 4.01%Charlotte Motor Speedway Inc. Commercial & Industrial 17,309,314 17,309,314 3.81%Food San Ltd. P/S Commercial & Industrial 16,032,502 16,032,502 3.53%The At&SF Railway Company Commercial & Industrial 15,713,404 15,713,404 3.46%Mitsubishi Motor Sales - America Commercial & Industrial 15,013,201 15,013,201 3.31%PC Service Source Commercial & Industrial 14,846,701 1,987,021 0.44%PCS Mail Service Inc. Commercial & Industrial 14,016,233 3,764,535 0.83%Alliance Gateway #1 Ltd. Commercial & Industrial 13,621,623 13,621,623 3.00%Tecnol Inc. Commercial & Industrial 13,248,840 5,465,017 1.20%Jacksonville Funding Ent LLC Commercial & Industrial 12,896,228 12,896,228 2.84%
Total 970,008,953$ 454,106,530$ 100.00%
Total Assessed Taxable Valuation 2,791,526,433$ 100.00%
111

NORTHWEST INDEPENDENT SCHOOL DISTRICTPROPERTY TAX LEVIES AND COLLECTIONS
LAST TEN FISCAL YEARS
SCHEDULE 11
Total Total OutstandingTax Revenues Tax Revenues Delinquent
Percent of Current and As Percent of Outstanding TaxesFiscal Tax Current Tax Levy and Current Delinquent As Percent ofYear Levy Collections Collected Delinquent Tax Levy Taxes Tax Levy
1998 21,102,449$ 20,609,128$ 97.66% 20,609,128$ 97.66% 493,321$ 2.34%
1999 27,535,950 26,921,312 97.77% 26,921,312 97.77% 614,638 2.23%
2000 35,510,020 34,397,499 96.87% 34,397,499 96.87% 1,112,521 3.13%
2001 44,486,584 43,020,060 96.70% 43,020,060 96.70% 2,622,882 5.90%
2002 57,774,189 56,620,145 98.00% 56,620,145 98.00% 3,746,499 6.48%
2003 68,186,564 64,447,690 94.52% 67,337,978 98.76% 4,744,375 6.96%
2004 77,322,746 74,998,197 96.99% 77,271,501 99.93% 4,851,074 6.27%
2005 98,682,876 96,017,338 97.30% 98,024,400 99.33% 5,163,973 5.23%
2006 112,192,921 109,092,869 97.24% 111,434,918 99.32% 5,838,774 5.20%
2007 129,366,876$ 125,140,445$ 97.24% 127,164,728$ 99.32% 7,123,400$ 5.20%
Fiscal year end is August 31 for years 1998-2001. Fiscal year end was changed to June 30effective September 1, 2001.
Source of Information: Denton Central Appraisal District and Denton County Tax Assessor-Collector.
112
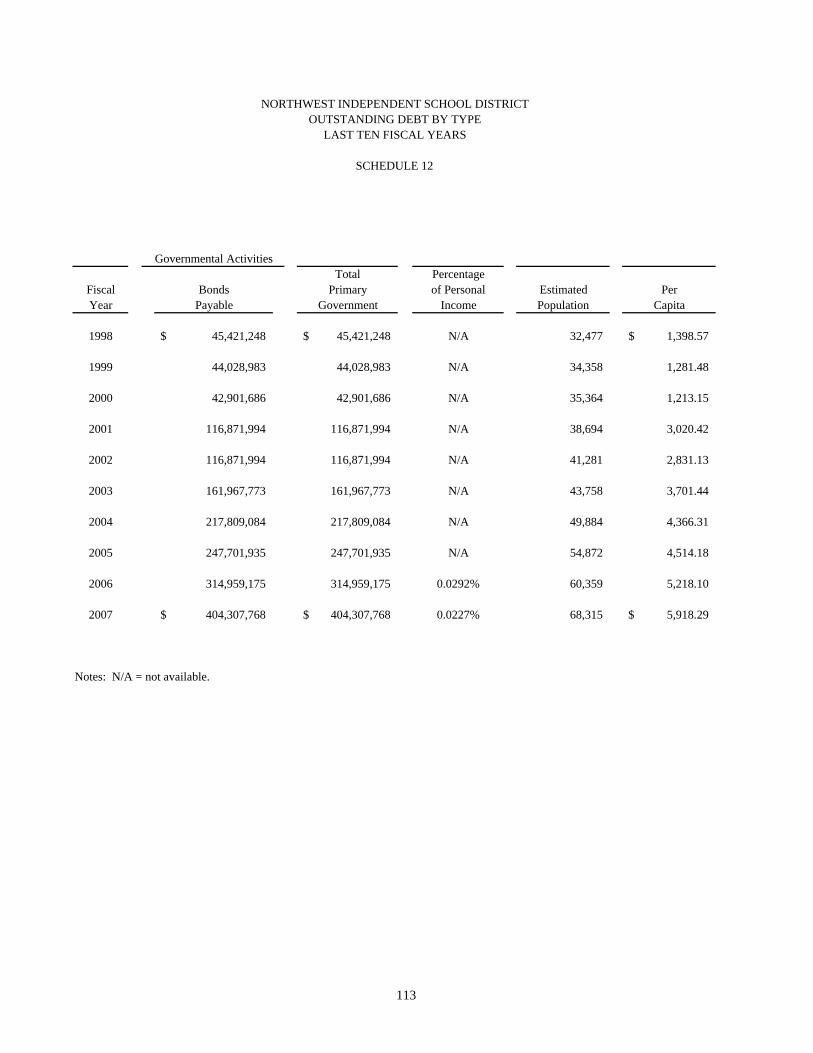
NORTHWEST INDEPENDENT SCHOOL DISTRICTOUTSTANDING DEBT BY TYPE
LAST TEN FISCAL YEARS
SCHEDULE 12
Governmental ActivitiesTotal Percentage
Fiscal Bonds Primary of Personal Estimated PerYear Payable Government Income Population Capita
1998 45,421,248$ 45,421,248$ N/A 32,477 1,398.57$
1999 44,028,983 44,028,983 N/A 34,358 1,281.48
2000 42,901,686 42,901,686 N/A 35,364 1,213.15
2001 116,871,994 116,871,994 N/A 38,694 3,020.42
2002 116,871,994 116,871,994 N/A 41,281 2,831.13
2003 161,967,773 161,967,773 N/A 43,758 3,701.44
2004 217,809,084 217,809,084 N/A 49,884 4,366.31
2005 247,701,935 247,701,935 N/A 54,872 4,514.18
2006 314,959,175 314,959,175 0.0292% 60,359 5,218.10
2007 404,307,768$ 404,307,768$ 0.0227% 68,315 5,918.29$
Notes: N/A = not available.
113

NORTHWEST INDEPENDENT SCHOOL DISTRICTDIRECT AND OVERLAPPING GOVERNMENTAL ACTIVITIES DEBT
AS OF JUNE 30, 2007
SCHEDULE 13
2006/2007 Total TaxTaxable Supported Estimated AmountAssessed Debt As Of % Over
Taxing Jurisdiction Value 03/16/2006 Applicable Lapping
Northwest ISD 6,924,274,341 408,230,425 100.00% 408,230,425$ Denton County 42,164,388,021 167,604,740 4.50% 7,542,213 Flower Mound, Town of 5,616,249,465 83,880,000 1.07% 897,516 Fort Worth, City of 32,253,876,189 369,180,000 0.11% 406,098 Haslet, City of 432,336,876 1,925,000 100.00% 1,925,000 Justin, City of 156,460,323 5,290,000 100.00% 5,290,000 Newark, City of 33,462,420 31,000 100.00% 31,000 Northlake Town of 120,000,328 1,880,000 63.95% 1,202,260 Rhome, City of 128,408,144 3,360,000 100.00% 3,360,000 Roanoke, City of 759,190,374 23,015,000 100.00% 23,015,000 Southlake, City of 4,129,037,018 125,885,813 0.16% 201,417 Tarrant County 100,671,554,866 240,522,503 0.20% 481,045 Tarrant County Hospital District 100,671,554,866 30,330,000 0.20% 60,660 Tarrant County College District 101,119,527,297 54,995,000 0.20% 109,990 Trophy Club MUD #1 447,030,715 2,360,000 46.48% 1,096,928 Trophy Club MUD #2 359,182,963 6,930,000 100.00% 6,930,000 Trophy Club, Town of 602,365,443 5,435,000 100.00% 5,435,000 Wise County 4,457,999,922 8,870,000 7.14% 633,318
Total Direct and Overlapping Tax Supported Debt 466,847,870$
Total Direct and Overlapping Tax Supported Debt to Taxable Assessed Valuation 6.74%
Per Capita Direct and Overlapping Tax Supported Debt 6,789$
Source: Northwest Independent School District OFFICIAL STATEMENT dated May 15, 2007.
114

THIS PAGE LEFT BLANK INTENTIONALLY
115

NORTHWEST INDEPENDENT SCHOOL DISTRICTLEGAL DEBT MARGIN INFORMATION
LAST TEN FISCAL YEARS
SCHEDULE 14
Fiscal Year1998 1999 2000 2001
Debt Limit 175,643,857$ 214,320,481$ 259,317,072$ 364,137,697$
Total net debt applicable to limit 45,421,248 44,028,983 42,901,686 116,871,994
Legal debt margin 130,222,609$ 170,291,498$ 216,415,386$ 247,265,703$
Total net debt applicable to the limit as a percentage of debt limit 25.86% 20.54% 16.54% 32.10%
Debt Limit represents 10% of assessed value.
116
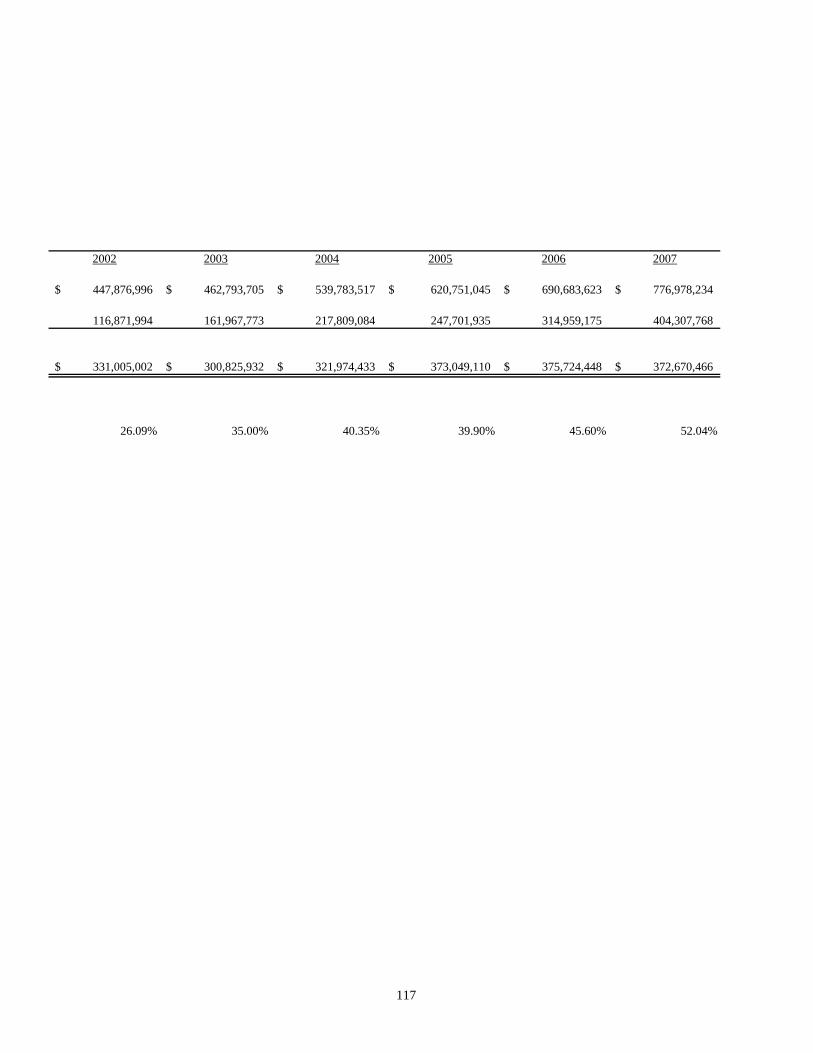
2002 2003 2004 2005 2006 2007
447,876,996$ 462,793,705$ 539,783,517$ 620,751,045$ 690,683,623$ 776,978,234$
116,871,994 161,967,773 217,809,084 247,701,935 314,959,175 404,307,768
331,005,002$ 300,825,932$ 321,974,433$ 373,049,110$ 375,724,448$ 372,670,466$
26.09% 35.00% 40.35% 39.90% 45.60% 52.04%
117

NORTHWEST INDEPENDENT SCHOOL DISTRICTDEMOGRAPHIC AND ECONOMIC STATISTICS
LAST TEN FISCAL YEARS
SCHEDULE 15
Per CapitaFiscal Personal Personal UnemploymentYear Population Income Income Rate
1998 32,477 -$ -$ 2.00%
1999 34,358 - - 1.90%
2000 35,364 - - 2.03%
2001 38,694 - - 1.99%
2002 41,281 - - 2.94%
2003 43,758 - - 5.01%
2004 49,884 - - 4.72%
2005 54,872 - - 4.12%
2006 60,359 6,217,123,256 103,002 4.26%
2007 68,315 10,827,817,000$ 158,498$ 4.23%
Source: Northwest Metroport Chamber of Commerce, Dallas Business Journal, September 2007
118

NORTHWEST INDEPENDENT SCHOOL DISTRICTPRINCIPAL EMPLOYERS
CURRENT YEAR
SCHEDULE 16
2007Percentage
of TotalEmployer Employees Employment
Sabre Holdings 3,300 15.24%
Motorola Fulfillment Center 3,200 14.78%
Fidelity Investments 3,100 14.32%
First American Real Estate Information Services 2,400 11.09%
American Airlines Alliance 2,100 9.70%
ATC Logistics & Electronics 1,550 7.16%
United Parcel Service 1,200 5.54%
Baylor Medical Center 1,000 4.62%
Daimler Chrysler 850 3.93%
Nokia Inc. Corp 700 3.23%
Bell Helicopter 650 3.00%
GameStop 600 2.77%
J.C. Penney Retail D.C. 500 2.31%
TD Ameritrade 500 2.31%
21,650 100.00%
Source: Northwest Metroport Chamber of Commerce, data same as 2006, census information not updated.
Note: Information regarding principal employers within the District was not available for nine years ago.
119
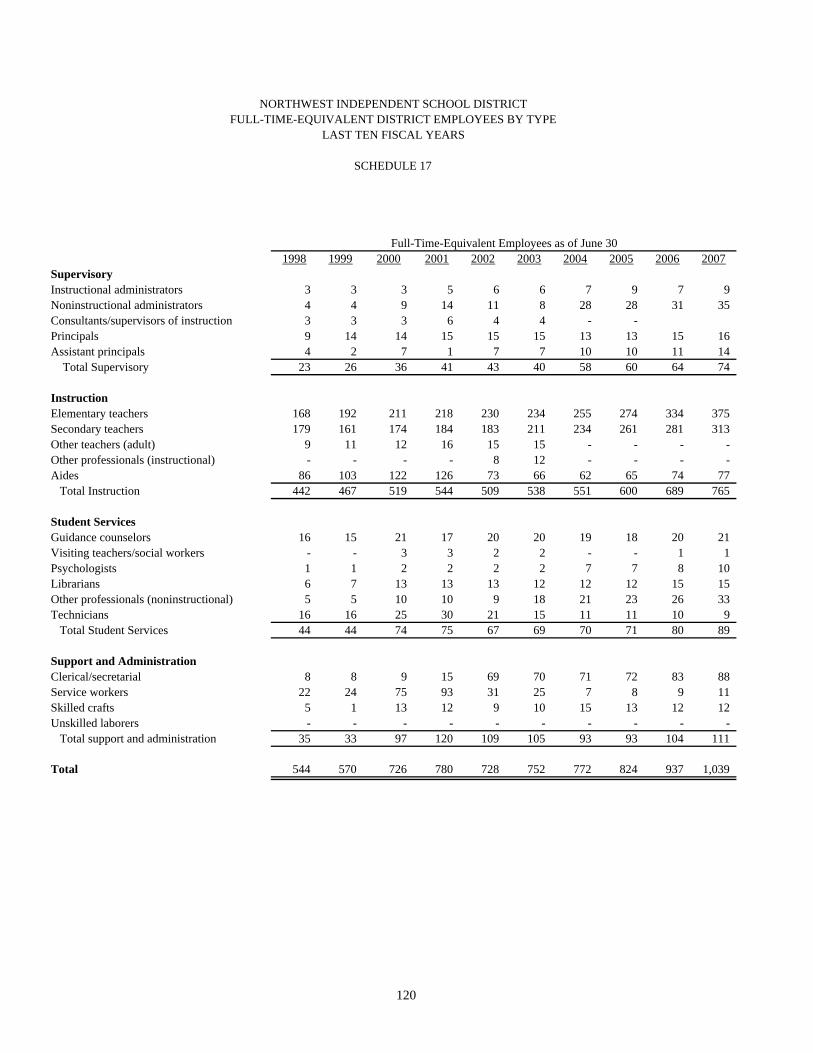
NORTHWEST INDEPENDENT SCHOOL DISTRICTFULL-TIME-EQUIVALENT DISTRICT EMPLOYEES BY TYPE
LAST TEN FISCAL YEARS
SCHEDULE 17
Full-Time-Equivalent Employees as of June 301998 1999 2000 2001 2002 2003 2004 2005 2006 2007
SupervisoryInstructional administrators 3 3 3 5 6 6 7 9 7 9 Noninstructional administrators 4 4 9 14 11 8 28 28 31 35 Consultants/supervisors of instruction 3 3 3 6 4 4 - - Principals 9 14 14 15 15 15 13 13 15 16 Assistant principals 4 2 7 1 7 7 10 10 11 14 Total Supervisory 23 26 36 41 43 40 58 60 64 74
InstructionElementary teachers 168 192 211 218 230 234 255 274 334 375 Secondary teachers 179 161 174 184 183 211 234 261 281 313 Other teachers (adult) 9 11 12 16 15 15 - - - - Other professionals (instructional) - - - - 8 12 - - - - Aides 86 103 122 126 73 66 62 65 74 77 Total Instruction 442 467 519 544 509 538 551 600 689 765
Student ServicesGuidance counselors 16 15 21 17 20 20 19 18 20 21 Visiting teachers/social workers - - 3 3 2 2 - - 1 1 Psychologists 1 1 2 2 2 2 7 7 8 10 Librarians 6 7 13 13 13 12 12 12 15 15 Other professionals (noninstructional) 5 5 10 10 9 18 21 23 26 33 Technicians 16 16 25 30 21 15 11 11 10 9 Total Student Services 44 44 74 75 67 69 70 71 80 89
Support and AdministrationClerical/secretarial 8 8 9 15 69 70 71 72 83 88 Service workers 22 24 75 93 31 25 7 8 9 11 Skilled crafts 5 1 13 12 9 10 15 13 12 12 Unskilled laborers - - - - - - - - - - Total support and administration 35 33 97 120 109 105 93 93 104 111
Total 544 570 726 780 728 752 772 824 937 1,039
120

NORTHWEST INDEPENDENT SCHOOL DISTRICTEXPENDITURES, ENROLLMENT AND PER PUPIL COST
LAST TEN FISCAL YEARS
SCHEDULE 18
Percentageof StudentsReceiving
Free orFiscal Operating Cost Cost Teaching Pupil- Reduced-PriceYear Enrollment Expenditures Per Pupil Expenses Per Pupil Staff Teacher Ratio Meals
1998 4,668 25,664,494$ 5,498$ $ N/A $ N/A 347 13.45 22.60%
1999 4,925 32,194,208 6,537 N/A N/A 353 13.95 22.20%
2000 5,181 36,670,069 7,078 N/A N/A 385 13.46 19.10%
2001 5,356 44,919,706 8,387 N/A N/A 402 13.32 19.10%
2002 5,665 44,430,684 7,843 95,617,179 16,879 413 13.72 19.40%
2003 6,177 51,484,937 8,335 74,969,240 12,137 445 13.88 19.40%
2004 6,870 55,544,041 8,085 79,382,925 11,555 489 14.05 19.10%
2005 7,563 60,691,930 8,025 118,206,881 15,630 535 14.14 19.40%
2006 8,705 70,647,048 8,116 142,441,297 16,363 615 14.15 21.00%
2007 10,334 81,068,454$ 7,845$ 159,769,479$ 15,461$ 688 15.02 20.10%
Fiscal year end is August 31 for years 1998-2001. Fiscal year end was changed to June 30effective September 1, 2001.
Expenditures for computing per pupil cost are a total of actual expenditures asprescribed by the Texas Education Agency's Financial Accountability SystemResource Guide. These include the General and Special Revenue Funds,excluding objects of Debt Service, Capital Outlay and Intergovernmental Charges.
Source of Information: Northwest Independent School District.
121

NORTHWEST INDEPENDENT SCHOOL DISTRICTSCHOOL BUILDING INFORMATION
LAST TEN FISCAL YEARS
SCHEDULE 19
Fiscal Year1998 1999 2000 2001 2002 2003 2004 2005 2006 2007
School
Elementary SchoolsBeck
Square feet 55,567 55,567 55,567 55,567 55,567 55,567 55,567 55,567 55,567 61,652 Capacity 450 450 450 450 450 450 450 450 450 450 Enrollment 407 461 468 472 417 429 406 450 447 447
HasletSquare feet 55,567 55,567 55,567 55,567 55,567 55,567 78,420 78,420 78,420 78,420 Capacity 650 650 650 650 650 650 650 650 650 650 Enrollment 354 190 209 317 446 487 576 686 468 523
HatfieldSquare feet N/A 55,567 55,567 55,567 55,567 58,367 63,967 63,967 63,967 69,332 Capacity N/A 450 450 450 450 650 750 750 750 750 Enrollment N/A 438 484 439 397 392 568 708 483 692
HughesSquare feet N/A N/A N/A N/A N/A N/A N/A 80,125 80,124 80,124 Capacity N/A N/A N/A N/A N/A N/A N/A 650 650 650 Enrollment N/A N/A N/A N/A N/A N/A N/A 550 536 728
JustinSquare feet 55,567 55,567 55,567 55,567 55,567 55,567 55,567 80,260 80,260 80,260 Capacity 450 450 450 450 450 450 450 650 650 650 Enrollment 459 382 386 390 402 416 411 471 573 667
LakeviewSquare feet 54,774 54,774 54,774 54,774 54,774 54,774 54,774 54,774 54,774 54,774 Capacity 450 450 450 450 450 450 450 450 450 450 Enrollment 507 368 378 428 441 328 349 316 289 316
NanceSquare feet N/A N/A N/A N/A N/A N/A N/A 80,124 80,124 80,124 Capacity N/A N/A N/A N/A N/A N/A N/A 650 650 650 Enrollment N/A N/A N/A N/A N/A N/A N/A 350 356 643
122

NORTHWEST INDEPENDENT SCHOOL DISTRICTSCHOOL BUILDING INFORMATION,
LAST TEN FISCAL YEARS
SCHEDULE 19 (Continued)
Fiscal Year1998 1999 2000 2001 2002 2003 2004 2005 2006 2007
School
Elementary Schools (Continued)Prairie View
Square feet N/A 55,567 55,567 55,567 55,567 55,567 55,567 55,567 61,167 92,042 Capacity N/A 450 450 450 450 450 450 450 650 900 Enrollment N/A 319 305 357 334 173 241 274 422 660
RoanokeSquare feet 55,567 55,567 55,567 55,567 55,567 55,567 55,567 55,567 55,567 55,567 Capacity 450 450 450 450 450 450 450 450 450 450 Enrollment 434 229 242 264 372 357 406 465 446 497
Seven HillsSquare feet 54,389 54,389 54,389 54,389 54,389 54,389 54,389 54,389 54,389 75,968 Capacity 450 450 450 450 450 450 450 450 450 650 Enrollment 487 371 423 363 365 411 379 397 419 442
Middle SchoolsChisholm
Square feet N/A 66,308 66,308 66,308 66,308 142,448 142,448 142,448 142,448 142,448 Capacity N/A 425 425 425 425 850 850 850 850 850 Enrollment N/A 205 241 240 244 326 349 311 439 702
PikeSquare feet 100,000 100,000 100,000 100,000 100,000 100,000 100,000 100,000 146,267 156,267 Capacity 850 850 850 850 850 850 850 850 1,100 1,100 Enrollment 1,042 315 330 331 339 666 764 916 802 833
MedlinSquare feet N/A 66,308 66,308 66,308 66,308 142,448 142,448 142,448 142,448 158,584 Capacity N/A 425 425 425 425 850 850 850 850 1,100 Enrollment N/A 241 247 286 314 515 550 604 773 907
High SchoolNorthwest
Square feet 180,000 180,000 180,000 180,000 350,000 400,000 457,230 457,230 457,230 457,230 Capacity 1,500 1,500 1,500 1,500 2,000 2,000 2,700 2,700 2,700 2,700 Enrollment 1,311 1,368 1,371 1,373 1,441 1,613 1,805 1,972 2,212 2,618
123

THIS PAGE LEFT BLANK INTENTIONALLY
124

SINGLE AUDIT SECTION
125


