northumbria research link - core
TRANSCRIPT

Northumbria Research Link
Citation: Neuhauss, Stephan CF., Hilgen, Gerrit, Huebner, Antje K., Tanimoto, Naoyuki, Sothilingam, Vithiyanjali, Seide, Christina, Garrido, Marina Garcia, Schmidt, Karl-Friedrich, Seeliger, Mathias W., Löwel, Siegrid, Weiler, Reto, Hübner, Christian A. and Dedek, Karin (2012) Lack of the Sodium-Driven Chloride Bicarbonate Exchanger NCBE Impairs Visual Function in the Mouse Retina. PLoS ONE, 7 (10). e46155. ISSN 1932-6203
Published by: Public Library of Science
URL: https://doi.org/10.1371/journal.pone.0046155 <https://doi.org/10.1371/journal.pone.0046155>
This version was downloaded from Northumbria Research Link: http://nrl.northumbria.ac.uk/43144/
Northumbria University has developed Northumbria Research Link (NRL) to enable users to access the University’s research output. Copyright © and moral rights for items on NRL are retained by the individual author(s) and/or other copyright owners. Single copies of full items can be reproduced, displayed or performed, and given to third parties in any format or medium for personal research or study, educational, or not-for-profit purposes without prior permission or charge, provided the authors, title and full bibliographic details are given, as well as a hyperlink and/or URL to the original metadata page. The content must not be changed in any way. Full items must not be sold commercially in any format or medium without formal permission of the copyright holder. The full policy is available online: http://nrl.northumbria.ac.uk/pol i cies.html
This document may differ from the final, published version of the research and has been made available online in accordance with publisher policies. To read and/or cite from the published version of the research, please visit the publisher’s website (a subscription may be required.)
brought to you by COREView metadata, citation and similar papers at core.ac.uk
provided by Northumbria Research Link


Lack of the Sodium-Driven Chloride BicarbonateExchanger NCBE Impairs Visual Function in the MouseRetinaGerrit Hilgen1, Antje K. Huebner2, Naoyuki Tanimoto3, Vithiyanjali Sothilingam3, Christina Seide3,
Marina Garcia Garrido3, Karl-Friedrich Schmidt4, Mathias W. Seeliger3, Siegrid Lowel4¤, Reto Weiler1,
Christian A. Hubner2*., Karin Dedek1*.
1Department of Neurobiology, University Oldenburg, Oldenburg, Germany, 2 Institute of Human Genetics, University Hospital Jena, Jena, Germany, 3Division of Ocular
Neurodegeneration, Centre for Ophthalmology, Institute for Ophthalmic Research, University of Tubingen, Tubingen, Germany, 4 Institut fur Allgemeine Zoologie und
Tierphysiologie, Friedrich-Schiller-Universitat Jena, Jena, Germany
Abstract
Regulation of ion and pH homeostasis is essential for normal neuronal function. The sodium-driven chloride bicarbonateexchanger NCBE (Slc4a10), a member of the SLC4 family of bicarbonate transporters, uses the transmembrane gradient ofsodium to drive cellular net uptake of bicarbonate and to extrude chloride, thereby modulating both intracellular pH (pHi)and chloride concentration ([Cl2]i) in neurons. Here we show that NCBE is strongly expressed in the retina. As GABAA
receptors conduct both chloride and bicarbonate, we hypothesized that NCBE may be relevant for GABAergic transmissionin the retina. Importantly, we found a differential expression of NCBE in bipolar cells: whereas NCBE was expressed on ONand OFF bipolar cell axon terminals, it only localized to dendrites of OFF bipolar cells. On these compartments, NCBEcolocalized with the main neuronal chloride extruder KCC2, which renders GABA hyperpolarizing. NCBE was also expressedin starburst amacrine cells, but was absent from neurons known to depolarize in response to GABA, like horizontal cells.Mice lacking NCBE showed decreased visual acuity and contrast sensitivity in behavioral experiments and smaller b-waveamplitudes and longer latencies in electroretinograms. Ganglion cells from NCBE-deficient mice also showed alteredtemporal response properties. In summary, our data suggest that NCBE may serve to maintain intracellular chloride andbicarbonate concentration in retinal neurons. Consequently, lack of NCBE in the retina may result in changes in pHi
regulation and chloride-dependent inhibition, leading to altered signal transmission and impaired visual function.
Citation: Hilgen G, Huebner AK, Tanimoto N, Sothilingam V, Seide C, et al. (2012) Lack of the Sodium-Driven Chloride Bicarbonate Exchanger NCBE Impairs VisualFunction in the Mouse Retina. PLoS ONE 7(10): e46155. doi:10.1371/journal.pone.0046155
Editor: Stephan C.F. Neuhauss, University Zurich, Switzerland
Received July 6, 2012; Accepted August 27, 2012; Published October 9, 2012
Copyright: � 2012 Hilgen et al. This is an open-access article distributed under the terms of the Creative Commons Attribution License, which permitsunrestricted use, distribution, and reproduction in any medium, provided the original author and source are credited.
Funding: This work was supported by grants from the Deutsche Forschungsgemeinschaft (www.dfg.de; We849/16-1/2 to KD and RW, Se837/5-2 and 6-1/2 toMWS, and Hu800/4-1 and 5-1 to CAH). The funders had no role in study design, data collection and analysis, decision to publish, or preparation of the manuscript.
Competing Interests: The authors have declared that no competing interests exist.
* E-mail: [email protected] (KD); [email protected] (CAH)
¤ Current address: Systems Neuroscience, Bernstein Fokus Neurotechnologie and Johann-Friedrich-Blumenbach Institut fur Zoologie und Anthropologie, Georg-August-Universitat Gottingen, Gottingen, Germany
. These authors contributed equally to this work.
Introduction
The vertebrate retina represents a neuronal tissue with a high
metabolic rate. Thus, regulation of intracellular pH (pHi) is of vital
importance because energy metabolism is a proton-producing
process [1]. Although light-evoked retinal activity leads to changes
in pH large enough to influence retinal circuits, e.g. by modulating
gap junctional networks [2] or voltage- and ligand-gated ion
channels [3], pH regulation in the retina is only partially
characterized. The sodium bicarbonate co-transporter NBCn1
contributes to pH regulation in photoreceptors and lack thereof
causes blindness [4] as does a lack of the chloride bicarbonate
anion exchanger AE3 which was shown to be expressed in Muller
cells and horizontal cells [5,6]. However, the role of NCBE in the
retina has never been studied. The sodium-driven chloride
bicarbonate exchanger NCBE (Slc4a10) uses the sodium trans-
membrane gradient to intrude bicarbonate and extrude chloride
[7,8]; though some studies suggest a role as an electroneutral
sodium bicarbonate co-transporter (NBCn2) [9]. There exist
different splice variants of NCBE/NBCn2 with different sites of
expression [8,10,11]. In the mouse, NCBE is broadly expressed in
the brain [7,12,13] and disruption of Slc4a10 leads to impaired pHi
regulation in hippocampal neurons and increased seizure thresh-
olds [12].
As a potential chloride extruder, NCBE may also contribute to
the regulation of the intracellular chloride concentration ([Cl2]i)
[7,8] in retinal neurons. The sodium-potassium-chloride co-
transporter NKCC1 was shown to maintain a high [Cl2]i in
retinal ON bipolar cell dendrites and horizontal cells so that
GABA induces a depolarization in these compartments [14]. In
contrast, the electroneutral potassium chloride co-transporter
KCC2 represents the major active chloride extruder in neurons.
It was shown to be expressed in OFF bipolar cells and in ON
bipolar cell axon terminals, keeping [Cl2]i low so that GABA or
PLOS ONE | www.plosone.org 1 October 2012 | Volume 7 | Issue 10 | e46155

glycine induce an inhibitory current [14,15]. Thus, in bipolar cell
dendrites, differential expression of KCC2 and NKCC1 chloride
transporters serves to generate GABA-evoked responses of
different polarity [16]. As NCBE expression precedes KCC2
expression in other brain areas [13], NCBE may also contribute to
neuronal chloride extrusion in the retina.
Using immunostaining and confocal microscopy we show that
NCBE is strongly expressed in the retina, namely in bipolar cells
and amacrine cells. With markers for individual bipolar and
amacrine cell types, we reveal a differential expression in ON and
OFF bipolar cell compartments and starburst amacrine cells in
which NCBE is colocalized with KCC2. To analyze the functional
importance of NCBE, we used a NCBE-deficient mouse line [12]
and show that lack of NCBE leads to altered retinal responses and
impaired visual performance. Whether these effects are caused by
an altered pHi regulation of retinal neurons, by changes in the
driving force for inhibitory currents or by a combination of both,
remains to be seen.
Results
Expression of NCBE in the Mouse RetinaThe sodium-driven chloride bicarbonate exchanger NCBE is
broadly expressed in the brain, including choroid plexus, cortex,
olfactory bulb, cerebellum, brainstem, spinal cord, and the retina
[12,13]. We first examined if the retina of NCBE-deficient mice
shows gross morphological changes. However, H/E stainings of
NCBE WT (Fig. 1A) and NCBE KO retina (Fig. 1B) revealed no
obvious morphological changes in the NCBE KO retina. Somata
sizes of retinal neurons and widths of the plexiform layers
appeared normal (Fig. 1B).
To further characterize NCBE expression in the retina, we
stained retina sections of NCBE KO and WT mice with
a polyclonal antibody against NCBE [12]. NCBE was pre-
dominantly present in both plexiform layers of the retina (Fig. 1C).
Photoreceptors and their terminals were devoid of label (Fig. S1)
whereas some cell membranes in the distal and proximal inner
nuclear layer (INL) were stained for NCBE, presumably
representing bipolar (Fig. 1C, arrows) and amacrine cell somata
(Fig. 1C, arrowheads). No NCBE staining was found in NCBE
KO retina sections, indicating that the NCBE antibody was
specific for the mouse retina (Fig. 1D). However, as the antibody
used in our study is expected to detect all different splice variants,
it remains unclear which variants are expressed in the retina.
NCBE is Differentially Expressed in Bipolar CellCompartmentsDouble stainings for NCBE and the vesicular glutamate
transporter 1 (VGluT1), a marker for bipolar cell terminals [17],
showed that all axon terminals of ON and OFF bipolar cells in the
IPL were stained for NCBE (not shown). As murine bipolar cells
comprise five different OFF and seven different ON bipolar cell
types [18], we double-labeled NCBE WT retina sections with
NCBE and specific bipolar cell markers to analyze the NCBE
expression in individual subtypes.
Type 1 and 2 OFF bipolar cells can be labeled by antibodies
against NK3R [18]. Double staining with NCBE showed strong
NCBE expression on dendrites and axon terminals of NK3R-
positive OFF bipolar cells (Fig. 2A). OFF type 2 cells can also be
stained by antibodies against synaptotagmin II (ZNP-1) [18,19]
and double labeling revealed that somata and axon terminals of
ZNP-1-positive type 2 cells intensely expressed NCBE (not shown).
OFF bipolar cell types 3A and 3B can be distinguished based on
their immunoreactivity to antibodies against the ion channel
HCN4 and the protein kinase A regulatory subunit IIb(PKARIIb), respectively [18,20]. Double stainings for HCN4
and NCBE showed that NCBE was expressed predominantly in
dendrites (Fig. 2B, arrow) and axon terminals (Fig. 2B, arrowhead)
of OFF bipolar cell type 3A. However, NCBE was not expressed
in PKARIIb-labeled dendrites (Fig. 2C, arrows) and somata
(Fig. 2C, arrowheads) of OFF bipolar cell type 3B, confirming
existing evidence that type 3A and 3B cells differ in membrane
protein composition [20].
Type 4 OFF bipolar cells are immunoreactive to calsenilin
(CSEN), a calcium-binding protein [18]. Double-labeling revealed
that NCBE was expressed in dendrites (Fig. 2D, arrows) but not in
somata (Fig. 2D, arrowheads) of type 4 OFF bipolar cells. As
antibodies against CSEN and PKARIIb also label amacrine cells,
NCBE expression on axon terminals of OFF bipolar cell types 3B
and 4 could not be determined with these markers alone.
However, VGluT1- and NCBE-labeled retina sections showed
full colocalization in layer 2 of the IPL (not shown), in which the
terminals of type 3B and 4 OFF bipolar cells stratify, confirming
that all OFF bipolar cells expressed NCBE in their terminals.
To analyze NCBE expression on ON bipolar cells, we double-
stained the retina with antibodies against NCBE and the G-
protein subunit Gao, which is a marker for rod and cone ON
bipolar cells [21]. However, dendrites (Fig. 2E, arrows) and somata
(Fig. 2E, arrowheads) of ON bipolar cells were devoid of label.
This was confirmed by double stainings for NCBE and PKCa,a marker for rod bipolar cells [18]. Again, no NCBE immuno-
reactivity was found on dendrites of rod bipolar cells (Fig. 2F,
arrows).
In contrast, PKCa-labeled axon terminals of rod bipolar cells
were intensely labeled with NCBE (Fig. 2G, arrows). This was
confirmed using antibodies against CaB5, a marker for type 3, 5
and rod bipolar cells [22]. CaB5/NCBE double staining also
revealed NCBE on axon terminals of type 5 ON bipolar cells (data
not shown). Additionally, NCBE localized to type 6 ON bipolar
cell axon terminals (Fig. 2H, arrows) as shown by double staining
with antibodies against ZNP-1 [18,19].
Taken together, we show that a deletion of NCBE did not alter
the morphology of the retina and that NCBE was expressed in
OFF bipolar cell dendrites and in ON and OFF bipolar cell axon
terminals.
NCBE is Expressed in Starburst Amacrine CellsBeside the expression of NCBE in bipolar cells, we also found
NCBE-labeled cells in the proximal INL (Fig. 1C), presumably on
amacrine cells. To examine NCBE expression in these interneur-
ons, we tested colocalization of NCBE with specific amacrine cell
markers.
Choline acetyltransferase (ChAT) is predominantly expressed
by starburst amacrine cells in the mouse retina. These cells are
mirror-symmetrically organized with somata in the INL and the
ganglion cell layer (GCL) and are involved in direction selectivity
of ganglion cells [23]. Double labeling revealed that somata of
ChAT-labeled starburst cells in the INL and GCL express NCBE
(Fig. 2I, J, arrows). Also the dendrites in the cholinergic layers 2
and 4 of the IPL were occasionally labeled for NCBE (Fig. 2I, J,
arrowheads).
In the mouse retina, antibodies against calretinin label amacrine
and ganglion cells [21]. NCBE immunoreactivity was found on
calretinin-labeled dendrites in the cholinergic layers 2 and 4 of the
IPL (Fig. 2K, L, arrowheads) and on calretinin-labeled somata in
the proximal INL (Fig. 2K, L, arrows). These cells may again
represent starburst cells as these cells are also calretinin-positive
Lack of NCBE Impairs Visual Function
PLOS ONE | www.plosone.org 2 October 2012 | Volume 7 | Issue 10 | e46155

[21]. We found no NCBE immunoreactivity on calretinin-labeled
ganglion cell somata or on dendrites in layer 3 of the IPL.
To test for NCBE expression in horizontal cells, we used
antibodies directed against calbindin, which also label amacrine
and ganglion cells [21]. Double staining revealed that horizontal
cells (Fig. 2M, N, arrow) and ganglion cell somata do not express
NCBE, whereas calbindin-labeled amacrine and displaced ama-
crine cells do (Fig. 2M, N, arrowheads).
NCBE is Coexpressed with KCC2Because NCBE may function as a pHi regulator and chloride
extruder [7,12] in the retina, we compared the immunoreactivity
pattern of NCBE with immunoreactivity pattern of KCC2,
another neuronal chloride extruder [15]. KCC2 is involved in
the generation of an axo-dendritic chloride gradient in retinal ON
cone bipolar cells [14,16] and plays a role in the direction
selectivity of starburst amacrine cells [24,25]. Maximum (Fig. 3A–
C) and single scan projections (Fig. 3D, E) of double stainings for
KCC2 and NCBE showed that both transporters are fully
colocalized on the same bipolar cell compartments: OFF bipolar
cell dendrites and ON and OFF bipolar cell axon terminals.
The expression of NCBE in the mouse retina is summarized in
Figure 4. Our results revealed that NCBE was differentially
expressed in bipolar cell compartments and is also expressed in
starburst amacrine cells. NCBE was not expressed in horizontal
cells (Fig. 4) and photoreceptors (not shown). Whether NCBE was
expressed in ganglion cell dendrites could not be determined
unequivocally. Interestingly, NCBE was expressed in the same
retinal cell compartments as KCC2. Thus, NCBE may play
a similar role in maintaining a low [Cl2]i and contribute to
Figure 1. NCBE is strongly expressed in the mouse retina. A, B, H/E stainings of NCBE WT (A) and KO (B) retinal sections. Gross morphology ofthe retina did not differ between both genotypes. C, D, Projections (5 mm) of NCBE WT (C) and KO (D) retinal sections stained for NCBE (green).Bipolar (arrows) and amacrine (arrowheads) cells express NCBE, with a strong expression in both plexiform layers (C). No NCBE expression was foundin the retina of NCBE KO mice (D), confirming the specificity of the antibody. Numbers 1–5 are labeling the IPL strata, scale bars = 10 mm.doi:10.1371/journal.pone.0046155.g001
Lack of NCBE Impairs Visual Function
PLOS ONE | www.plosone.org 3 October 2012 | Volume 7 | Issue 10 | e46155

Lack of NCBE Impairs Visual Function
PLOS ONE | www.plosone.org 4 October 2012 | Volume 7 | Issue 10 | e46155

direction selectivity in the retina. As NCBE may also regulate pHi
in retinal neurons, these findings prompted us to analyze the
physiological consequences of NCBE deletion.
Electroretinography in NCBE-deficient Mice Indicates ONBipolar Cell DysfunctionThe functional status of the retina in health and disease may be
examined via electroretinography (ERG). Although the ERG is
a mass response, several protocols varying stimulus intensity and
frequency as well as the light environment (background) allow to
obtain detailed insights in the functionality of rod and cone
photoreceptors and their downstream neurons as long as transient
and not spiking signals are generated [26,27]. Here, we compared
ERGs of NCBE KO and WT mice at ages of 12 months (PM12) to
avoid potential confounding by the differences in birth weight
mentioned below. Figure 5A shows the scotopic single flash ERG
responses from dark-adapted NCBE KO (red) and WT (black)
mice stimulated with increasing light intensities (24.0 to
1.5 log cd*s/m2). We observed no difference in the scotopic single
flash ERG a-wave, an initial negative deflection after light
stimulation, between NCBE KO and WT mice (quantification
Fig. 5B, lower part). Since the a-wave, when reaching saturation
before the onset of the b-wave, reflects rod photoreceptor function
in mice, this finding indicates that lack of NCBE had no
measurable effect on the maximal output of rod photoreceptors,
which is in agreement with a lack of NCBE expression in
photoreceptors of WT mice.
Scotopic b-wave amplitudes of NCBE KO mice were smaller
than those in NCBE WT mice at rod-specific intensities (below
22.0 log cd*s/m2) and at higher stimulus intensities, at which
both rod and cone photoreceptors are activated (Fig. 5A, B, upper
part). Also, the b-wave latencies of NCBE KO mice were
increased for all intensities under scotopic conditions and the
waveforms were prolonged (Fig. 5C, inset). Together with the
unchanged a-wave (Fig. 5B, lower part), this indicates either an
impaired synaptic transmission to bipolar cells or a problem in the
ON bipolar cells themselves, for instance a reduced excitability.
The slight amplitude reduction plus waveform prolongation was
also observed in the scotopic flicker ERGs (0.5 to 30 Hz) at
a constant intensity of22 log cd*s/m2 (Fig. 5G). In particular, the
waveform prolongation led to a reduced flicker fusion frequency,
i.e. NCBE KO flicker amplitudes were only mildly decreased at
low stimulus frequencies (0.5 to 3 Hz) compared to WT, but
rapidly declined at higher frequencies (5–10 Hz), and were
practically zero at frequencies above 10 Hz (Fig. 5G, H).
The cone system responses were assessed with the photopic
single flash ERG (Fig. 5D). Similar to scotopic conditions, NCBE
KO b-wave amplitudes were considerably decreased at high
stimulus intensities (1 and 1.5 log cd*s/m2) and b-wave latencies
were increased compared to WT mice (Fig. 5E, F).
Finally, we also obtained some information about cone ON and
OFF systems via scotopic (dark-adapted) flicker ERGs (0.5 to
30 Hz) at a constant intensity of 0.5 log cd*s/m2 (Fig. 5I, J). In this
paradigm, the responses are dominated by the rod system below
about 3–5 Hz, by the cone ON system from about 5–15 Hz, and
Figure 2. NCBE is expressed in bipolar cells and amacrine cells. A, NCBE (green) is expressed in axon terminals (arrowheads) and somata(arrows) of type 1 and/or 2 OFF bipolar cells, labeled with NK3R (magenta). B, HCN4-labeled type 3A OFF bipolar cells (magenta) showed NCBE(green) distributed on dendrites (arrows) and axon terminals (arrowheads). C, D, PKARIIb-labeled type 3B OFF bipolar cells (C, magenta) and CSEN-labeled type 4 OFF bipolar cells (D, magenta) with NCBE (green). Only proximal (arrows) but not distal dendrites (arrowheads) of type 3B OFF bipolarcells showed NCBE expression (C). Dendrites (arrows) and somata (arrowheads) of CSEN-labeled type 4 OFF bipolar cells were also positive for NCBE(D). E, Ga0-labeled dendrites (magenta, arrows) of ON bipolar cells did not show NCBE expression (green). However, some ON bipolar cell somata(arrowheads) were NCBE-positive. F, G, PKCa-labeled rod bipolar cells dendrites (magenta) showed no NCBE expression (F, green, arrows), whereasaxon terminals strongly express NCBE (G, arrows). H, ZNP-1-labeled axon terminals (magenta) of type 6 ON bipolar cells showed NCBE expression(green, arrows). I, J, Retinal sections of NCBE WT mice were stained for NCBE (I, J, green) and ChAT (J, magenta). Merging the NCBE channel (I) withthe ChAT channel (J) revealed that somata (arrows) and dendrites (arrowheads) of ChAT-labeled starburst amacrine cells express NCBE. K, L, NCBE- (K,L, green) and calretinin-labeled retinal sections (L, magenta). NCBE expression was found on calretinin-labeled dendrites (arrowheads) and somata(arrows) of amacrine cells in the retina. M, N, Calbindin-labeled horizontal cells (arrows) do not express NCBE, but calbindin-labeled somata(arrowheads) of amacrine cells do. All images represent projections (3 mm) of confocal stacks. Numbers 1–5 are labeling the IPL strata, scale bars (A–H) = 5 mm; (I–M) = 10 mm.doi:10.1371/journal.pone.0046155.g002
Figure 3. NCBE is colocalized with KCC2. A–C, Projections (3 mm) of NCBE WT retinal sections stained for NCBE (A, C, green) and the chlorideextruder KCC2 (B, C, magenta). Higher magnification of single scans (0.5 mm) of NCBE WT retinal sections double-stained for NCBE (D, F, green) andKCC2 (E, F, magenta) revealed that KCC2 and NCBE are expressed on the same cellular compartments in the retina (arrows). Scale bar = 10 mm.doi:10.1371/journal.pone.0046155.g003
Lack of NCBE Impairs Visual Function
PLOS ONE | www.plosone.org 5 October 2012 | Volume 7 | Issue 10 | e46155

by the cone OFF system at higher frequencies. We found small,
but consistent amplitude reductions in the frequency ranges
attributed to the rod and cone ON system, respectively, but not in
the range attributed to the cone OFF system (Fig. 5I, J). This is
surprising given the strong NCBE expression in OFF bipolar cells.
In addition to ERG recordings of PM12 mice, we also recorded
ERGs of NCBE KO and WT mice at the age of 4 weeks (PW4).
The results (Fig. S2) were similar to that of NCBE KO PM12 mice
shown here. Furthermore, we morphologically evaluated the PW4
mice in vivo, immediately after ERG recordings, and confirmed
that the gross organization of the retina was not altered due to
a genetic deletion of NCBE (Fig. S3). Yet, the weight of NCBE
KO mice was significantly reduced compared to the WT at PW4
(not shown). Thus, we decided not to use this data here, as the
observed differences in ERG amplitudes and latencies may have
resulted from a developmental delay in NCBE KO mice in this
group. However, as we could reproduce the results in the PM12
mouse group and such adult NCBE KO have a normal weight,
lifespan [12] and eye size, impairments in PM12 ERGs most likely
originate from altered retinal signal transmission rather than
developmental defects.
Ganglion Cell Responses of NCBE-deficient Mice ShowTemporal ChangesThe intense expression of NCBE on bipolar and amacrine cells
together with the impaired ERGs indicated that a deletion of
NCBE may alter retinal signal processing, especially in the ON
pathway. To test this, we recorded extracellular ganglion cell light
responses and compared them between genotypes.
First, we compared the light responses of ON-transient ganglion
cells. For all ganglion cells measured, different response param-
eters were extracted from peri-stimulus time histograms (PSTHs;
see Methods; Fig. 6): response amplitude (A1), response duration
(A1t2), and time to peak (L1). Figure 6 shows single PSTHs of
representative ON-transient ganglion cells from NCBE KO (red)
and WT mice (black) responding to stimuli with a constant light
intensity (6.9 cd*s/m2) and increasing spot size (75–1,700 mm;
Fig. 6A), a constant spot size (300 mm) and increasing light
intensity (24 to 2 log cd*s/m2; Fig. 6B), and a constant spot size
(300 mm) and light intensity (6.9 cd*s/m2) with increasing
temporal frequencies (1–15 Hz; Fig. 6C), respectively.
At a constant light intensity (6.9 cd*s/m2), response duration of
NCBE KO ON-transient ganglion cells was increased for spot
sizes above 175 mm (A1t2; Fig. 6D, n= 30) and differed
significantly from the NCBE WT (n= 31; for ANOVA values,
please refer to the legend of Fig. 6), pointing to more sustained
responses in KO cells. The time to peak of NCBE KO ON-
transient ganglion cells was significantly decreased for stimuli with
increasing spot sizes (L1; Fig. 6E). Also, in the NCBE KO,
response amplitudes were larger for stimuli.300 mm (A1, Fig. 6F).
Thus, spatial tuning is altered in NCBE KO mice. However, the
average spot size eliciting the maximum firing rate was 300 mm for
both genotypes and was in line with the suggested receptive field
center size of ganglion cells [28,29].
This spot size (300 mm) was used for stimulations with
increasing light intensity. Under these conditions, response
amplitudes were not significantly different (not shown) but NCBE
KO ON-transient ganglion cells responded significantly longer
(A1t2; Fig. 6G) and faster (L1, Fig. 6H). As the impaired ERG b-
wave rather suggested a slowing of responses, we stimulated
ganglion cells with a flicker series (1–15 Hz; Fig. 6C). The PSTH
parameter A1 was taken as a measure for the cells’ response.
However, response amplitudes did not differ between NCBE WT
and KO mice (Fig. 6I). These data suggest that ON-transient
ganglion cells respond stronger, longer and faster in NCBE-
deficient mice despite the profound changes found in ON bipolar
cell responses by ERGs.
Next, we compared the light responses of ON-OFF ganglion
cells in both genotypes. Single PSTHs of representative cells are
shown in Figure 7A–C. ON response components were charac-
terized by the same PSTH parameters as described before. To
characterize the OFF response component, response duration
(A2t2), time to peak (L2) and response amplitude (A2) were
extracted from PSTHs.
ON (A1t2) and OFF (A2t2) response durations were not
significantly changed between NCBE KO (n=15) and WT ON-
OFF ganglion cells (n = 16) when the spot size was increased
(Fig. 7D; for ANOVA values, please refer to the legend of Fig. 7).
Interestingly, while response amplitudes did not differ between
genotypes (A1, A2; Fig. 7F), the ON response component was
slower in NCBE KO mice whereas the OFF response components
was not (L1, L2; Fig. 7E).
Again, we used a spot size of 300 mm to stimulate ganglion cell
receptive field centers and varied light intensity. Under these
conditions, ON and OFF response durations of NCBE KO ON-
OFF ganglion cells were significantly increased (A1t2, A2t2;Fig. 7G). As NCBE KO cells showed slower ON responses to light
stimuli (L1; Fig. 7H, top), while OFF responses did not differ from
NCBE WT (L2, Fig. 7H, bottom), we also analyzed the responses
of NCBE KO ON-OFF ganglion cells to flicker stimuli (Fig. 7I)
and used the maximal response amplitude (A1) as a measure.
NCBE KO ON-OFF ganglion cells were able to follow temporal
frequencies ,5 Hz comparably to WT cells. However, ON-OFF
ganglion cells from NCBE KO showed decreased responses to
temporal frequencies between 5–10 Hz (Fig. 7I) and did not
respond to stimuli above 10 Hz while WT cells followed flicker
Figure 4. Summary of the NCBE expression in the mouseretina. NCBE is expressed (grey) on the axon terminals of rod ON, coneON and OFF bipolar cells and on the dendrites of OFF bipolar cells.NCBE is not expressed in dendrites of ON bipolar cells and OFF bipolarcell type 3B. NCBE is also expressed in starburst amacrine cells (SAC),but not in dendrites of ganglion cells (GC). NCBE is also not expressed inphotoreceptors (not shown) and horizontal cells (HC).doi:10.1371/journal.pone.0046155.g004
Lack of NCBE Impairs Visual Function
PLOS ONE | www.plosone.org 6 October 2012 | Volume 7 | Issue 10 | e46155

Lack of NCBE Impairs Visual Function
PLOS ONE | www.plosone.org 7 October 2012 | Volume 7 | Issue 10 | e46155

Figure 5. Electroretinography in NCBE-deficient mice indicates ON bipolar cell dysfunction. A, D, Representative single flash ERGrecordings from NCBE WT (black) and KO (red) mice (age 12 months) for increasing intensities under dark-adapted (A, scotopic) and light-adapted (D,photopic) conditions. B, C, E, F, Box-and-whisker plots of single flash ERG b-wave amplitudes (B, E) and latencies (C, F), plotted against flash intensity.Scotopic b-wave but not a-wave amplitudes in NCBE KO mice were reduced (A, B), and b-wave latencies (C) were increased compared to NCBE WTmice. Inset in C: Overlay of scotopic single flash ERG response traces of NCBE WT (black) and NCBE KO (red) mice at22.0 log cd*s/m2 intensity (arrowhead). Scale bar: horizontal 50 ms, vertical 100 mV. Under photopic conditions, b-wave amplitudes (D, E) and b-wave latencies (F) of NCBE KO micewere similarly affected. G, I, Representative ERG recordings of a flicker frequency series (flash intensity G: 22 log cd*s/m2; I: 0.5 log cd*s/m2) underscotopic conditions. Flicker amplitudes (H, J) of NCBE KO mice decreased at much lower flash frequencies than that of WT controls. Vertical lines an A,D, G, I represent stimulus onset. In all quantitative plots (B, C, E, F, H, J), boxes indicate the 25% and 75% quantile range, whiskers indicate the 5%and 95% quantiles, and solid lines connect the medians of the data. NCBE WT (n= 2), NCBE KO (n= 3).doi:10.1371/journal.pone.0046155.g005
Figure 6. Light responses of ON-transient ganglion cells are longer and faster in NCBE-deficient mice. A–C, Representative single PSTHlight responses of representative NCBE KO (red) and WT (black) ON-transient ganglion cells responding to stimuli with increasing spot sizes (A),increasing light intensities (B) and increasing frequencies (C). D, G, The response durations (A1t2) of NCBE KO ON-transient ganglion cells comparedto NCBE WT ON-transient ganglion cells were increased when either the spot size (D; RM two-way ANOVA: F (1, 59) = 6.68; p = 0.0123) or the intensity(G; RM two-way ANOVA: F (1, 59) = 7.05; p = 0.0102) was increased. E, H, The time to peak (L1) of NCBE KO ON-transient ganglion cells was decreasedcompared to NCBE WT ON-transient ganglion cells for both stimuli (E; RM two-way ANOVA: F (1, 59) = 7.67; p = 0.0075; H; RM two-way ANOVA: F (1,59) = 4.83; p = 0.0319). F, NCBE KO and WT ON-transient ganglion cell responses (A1) of a spot size series were normalized and KO responseamplitudes were larger for stimuli .300 (F; RM two-way ANOVA: F (1, 59) = 2.81; p = 0.1449). I, Normalized cell responses (A1) of a flicker seriesshowed no significant differences (I; RM two-way ANOVA: F (1, 59) = 0.02; p = 0.8866). Vertical lines an A and B represent stimulus onset and offset,respectively. Values are presented as mean 6 standard error of the mean (SEM). NCBE WT (n= 31), NCBE KO (n = 30).doi:10.1371/journal.pone.0046155.g006
Lack of NCBE Impairs Visual Function
PLOS ONE | www.plosone.org 8 October 2012 | Volume 7 | Issue 10 | e46155

Figure 7. Light responses of ON-OFF ganglion cells are slower in NCBE-deficient mice. A–C, Single PSTH of representative NCBE KO (red)and WT (black) ON-OFF ganglion cell light responses, evoked with increasing spot sizes (A), light intensities (B) and stimulus frequencies (C). D, G, Nosignificant differences were found between the ON (A1t2) and OFF(A2t2) response durations of WT and KO cells when spot size was increased [D; top(ON): F(1, 29) = 0.06; p = 0.8141; bottom (OFF): F(1, 29) = 0.01; p = 0.9425]. However, when light intensity was increased, response durations werelonger in NCBE KO mice [G; top (ON): F(1, 29) = 5.98; p = 0.0207; bottom (OFF): F(1, 29) = 4.50; p = 0.0426]. E, H, Time to peak of the ON response (L1)but not of the OFF response (L2) was significantly increased in NCBE KO when either the spot size [E; Top (ON): F(1, 29) = 6.13; p = 0.0194; bottom(OFF): F(1, 29) = 1.94; p = 0.1741] or the intensity were increased [H; top (ON): F(1, 29) = 12.56; p = 0.0014; bottom (OFF): F(1, 29) = 0.53; p = 0.4736]. F,No significant differences were found between the normalized ON (A1) and OFF response amplitudes (A2) with increasing spot size (F; top (ON): F(1,29) = 0.03; p = 0.8565; bottom (OFF): F(1, 29) = 0.28; p = 0.5978). I, Normalized cell responses (A1) of a flicker series. NCBE KO cells showed decreasedresponses and were not able to follow higher frequencies comparably to NCBE WT cells (I; F(1, 29) = 2.94; p = 0.0969). Vertical lines an A and Brepresent stimulus onset and offset, respectively. Values are presented as mean6 SEM. Statistical values were obtained from repeated measurementANOVA. NCBE WT (n= 16), NCBE KO (n= 15).doi:10.1371/journal.pone.0046155.g007
Lack of NCBE Impairs Visual Function
PLOS ONE | www.plosone.org 9 October 2012 | Volume 7 | Issue 10 | e46155
stimuli up to 15 Hz (Fig. 7I). These results are consistent with the
ERG recordings, which showed similar frequency differences
between genotypes (Fig. 5H).
In summary, PSTH analyses of ganglion cell light responses
revealed that NCBE KO ON-OFF ganglion cells were slower than
WT cells. In contrast, NCBE KO ON-transient ganglion cells
were faster and showed more sustained responses than NCBE WT
ganglion cells.
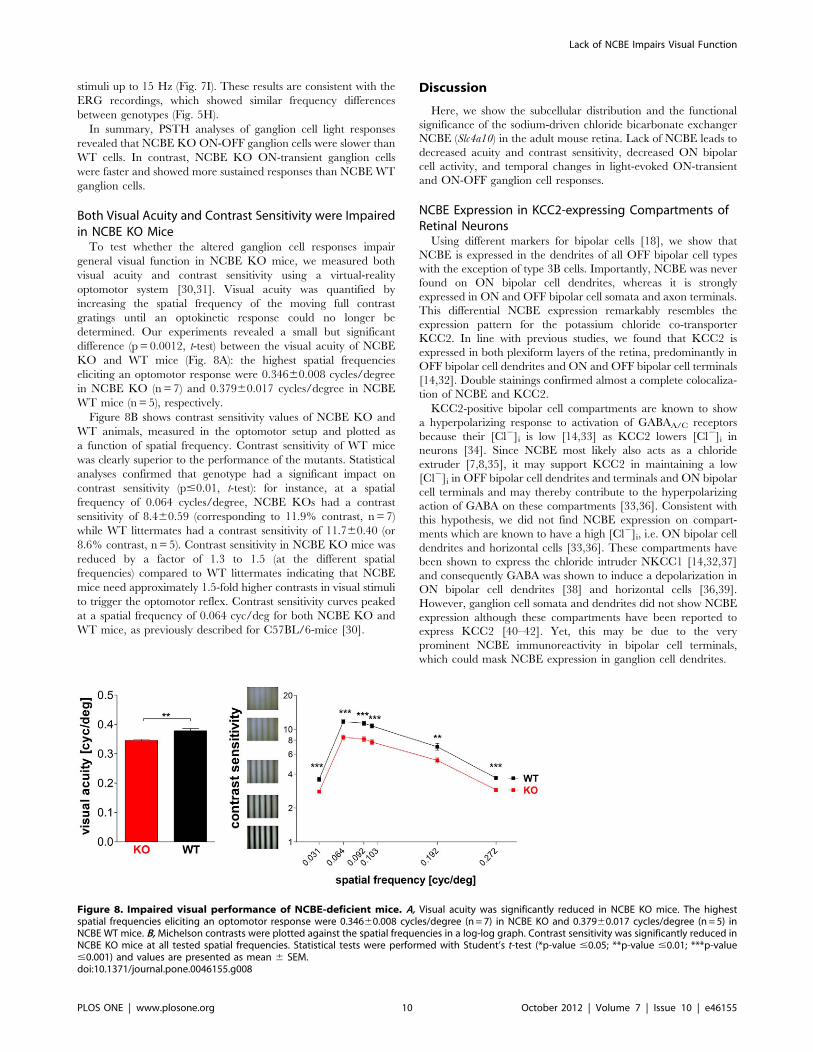
Both Visual Acuity and Contrast Sensitivity were Impairedin NCBE KO MiceTo test whether the altered ganglion cell responses impair
general visual function in NCBE KO mice, we measured both
visual acuity and contrast sensitivity using a virtual-reality
optomotor system [30,31]. Visual acuity was quantified by
increasing the spatial frequency of the moving full contrast
gratings until an optokinetic response could no longer be
determined. Our experiments revealed a small but significant
difference (p = 0.0012, t-test) between the visual acuity of NCBE
KO and WT mice (Fig. 8A): the highest spatial frequencies
eliciting an optomotor response were 0.34660.008 cycles/degree
in NCBE KO (n=7) and 0.37960.017 cycles/degree in NCBE
WT mice (n = 5), respectively.
Figure 8B shows contrast sensitivity values of NCBE KO and
WT animals, measured in the optomotor setup and plotted as
a function of spatial frequency. Contrast sensitivity of WT mice
was clearly superior to the performance of the mutants. Statistical
analyses confirmed that genotype had a significant impact on
contrast sensitivity (p#0.01, t-test): for instance, at a spatial
frequency of 0.064 cycles/degree, NCBE KOs had a contrast
sensitivity of 8.460.59 (corresponding to 11.9% contrast, n = 7)
while WT littermates had a contrast sensitivity of 11.760.40 (or
8.6% contrast, n = 5). Contrast sensitivity in NCBE KO mice was
reduced by a factor of 1.3 to 1.5 (at the different spatial
frequencies) compared to WT littermates indicating that NCBE
mice need approximately 1.5-fold higher contrasts in visual stimuli
to trigger the optomotor reflex. Contrast sensitivity curves peaked
at a spatial frequency of 0.064 cyc/deg for both NCBE KO and
WT mice, as previously described for C57BL/6-mice [30].
Discussion
Here, we show the subcellular distribution and the functional
significance of the sodium-driven chloride bicarbonate exchanger
NCBE (Slc4a10) in the adult mouse retina. Lack of NCBE leads to
decreased acuity and contrast sensitivity, decreased ON bipolar
cell activity, and temporal changes in light-evoked ON-transient
and ON-OFF ganglion cell responses.
NCBE Expression in KCC2-expressing Compartments ofRetinal NeuronsUsing different markers for bipolar cells [18], we show that
NCBE is expressed in the dendrites of all OFF bipolar cell types
with the exception of type 3B cells. Importantly, NCBE was never
found on ON bipolar cell dendrites, whereas it is strongly
expressed in ON and OFF bipolar cell somata and axon terminals.
This differential NCBE expression remarkably resembles the
expression pattern for the potassium chloride co-transporter
KCC2. In line with previous studies, we found that KCC2 is
expressed in both plexiform layers of the retina, predominantly in
OFF bipolar cell dendrites and ON and OFF bipolar cell terminals
[14,32]. Double stainings confirmed almost a complete colocaliza-
tion of NCBE and KCC2.
KCC2-positive bipolar cell compartments are known to show
a hyperpolarizing response to activation of GABAA/C receptors
because their [Cl2]i is low [14,33] as KCC2 lowers [Cl2]i in
neurons [34]. Since NCBE most likely also acts as a chloride
extruder [7,8,35], it may support KCC2 in maintaining a low
[Cl2]i in OFF bipolar cell dendrites and terminals and ON bipolar
cell terminals and may thereby contribute to the hyperpolarizing
action of GABA on these compartments [33,36]. Consistent with
this hypothesis, we did not find NCBE expression on compart-
ments which are known to have a high [Cl2]i, i.e. ON bipolar cell
dendrites and horizontal cells [33,36]. These compartments have
been shown to express the chloride intruder NKCC1 [14,32,37]
and consequently GABA was shown to induce a depolarization in
ON bipolar cell dendrites [38] and horizontal cells [36,39].
However, ganglion cell somata and dendrites did not show NCBE
expression although these compartments have been reported to
express KCC2 [40–42]. Yet, this may be due to the very
prominent NCBE immunoreactivity in bipolar cell terminals,
which could mask NCBE expression in ganglion cell dendrites.
Figure 8. Impaired visual performance of NCBE-deficient mice. A, Visual acuity was significantly reduced in NCBE KO mice. The highestspatial frequencies eliciting an optomotor response were 0.34660.008 cycles/degree (n = 7) in NCBE KO and 0.37960.017 cycles/degree (n = 5) inNCBE WT mice. B, Michelson contrasts were plotted against the spatial frequencies in a log-log graph. Contrast sensitivity was significantly reduced inNCBE KO mice at all tested spatial frequencies. Statistical tests were performed with Student’s t-test (*p-value #0.05; **p-value #0.01; ***p-value#0.001) and values are presented as mean 6 SEM.doi:10.1371/journal.pone.0046155.g008
Lack of NCBE Impairs Visual Function
PLOS ONE | www.plosone.org 10 October 2012 | Volume 7 | Issue 10 | e46155

In addition, some calretinin- and calbindin-positive amacrine
cells expressed NCBE. Among them are the starburst amacrine
cells, which are involved in generating direction selectivity in
certain ganglion cell types [23]. Gavrikov et al. [25] showed that
KCC2 is expressed in the distal and NKCC2 in the proximal
dendrites of rabbit starburst amacrine cells. Thus, similar to ON
bipolar cells expressing NKCC1 in their dendrites and KCC2 in
their terminals, starburst amacrine cells possess an inherent
asymmetry in the distribution of chloride co-transporters along
their dendrites, thereby establishing a [Cl2]i gradient, which may
underlie direction selectivity [25]. Though we could not test this
directly, it is tempting to speculate that the expression of NCBE
coincides with KCC2 expression also in distal dendrites of
starburst amacrine cells.
As the involvement of chloride in the transport process of
NCBE is a matter of debate [9,35], it is possible that the
transporter acts as an electroneutral sodium bicarbonate co-
transporter (NBCn2) contributing only to pHi regulation. If this is
the case, its expression in the mouse retina suggests that it may
complement the function of the electroneutral sodium bicarbonate
co-transporter NBCn1 as NBCn1 is expressed in photoreceptors
[4] which lack NCBE/NBCn2 (Fig. S1).
Lack of NCBE Leads to Visual ImpairmentsLack of NCBE caused a decrease in visual acuity and contrast
sensitivity, impaired ON bipolar cell function and temporal
changes in ganglion cell responses. However, as effects are diverse
and different for different ganglion cell types, we can only
speculate on the mechanisms that lead to visual impairments in
mice lacking NCBE. In general, changes in retinal signal
processing may result 1) from defects in pHi regulation, potentially
leading to reduced neuronal excitability [12] and 2) from changes
in GABA-mediated inhibition as NCBE may not only act as a pHi
regulator [9] but may also extrude chloride (see above).
The observed changes in retinal signal processing may be
caused by a defect in pH regulation, potentially leading to
a reduced excitability of retinal neurons because neuronal activity
leads to changes in pH: bicarbonate flux through ionotropic
GABA and glycine receptors lowers pHi and raises extracellular
pH, thereby linking synaptic inhibition and pH regulation [6].
Since bicarbonate uptake is decreased in NCBE-deficient neurons,
intracellular pH is decreased [12]. This may lead to a reduced
excitability by a number of mechanisms [43], for instance by
decreasing glutamate-induced responses [44]. Also, a decrease in
pHi may lead to reduced glutamate release: Sinning et al. [45]
showed that the sodium-dependent chloride bicarbonate exchang-
er NDCBE (Slc12a8) is presynaptically expressed in glutamatergic
synapses and lack of NDCBE leads to impaired release of
glutamate in neurons. Thus, NCBE may play a similar role in
bipolar cell somata and terminals. As a consequence, NCBE-
deficient ON bipolar cells may have a reduced excitability or
a reduced glutamatergic signal transmission, which may represent
an explanation for the changes in ERGs. This is supported by
previous studies showing that intracellular acidosis attenuates
ERG b-wave amplitudes [46,47]. The appearance of the ERG,
particularly the flicker ERG (Fig. 5I, J), is very different if changes
are induced by primary effects on photoreceptors [26], reinforcing
the hypothesis of a synaptic or generic sensitivity loss in ON
bipolar cells. As we found no NCBE expression in ON bipolar cell
dendrites, a generic sensitivity loss appears more likely. In-
terestingly, the behavior of the ON-OFF ganglion cells (Fig. 7C, I)
best correlated with the rod ERG b-wave changes observed
(Fig. 5G, H) in comparison to the ON ganglion cells (Fig. 6C, I).
This suggests that NCBE has differential effects on specific types of
ON bipolar cells each of which selectively connects to transient
ON or ON-OFF ganglion cells.
These effects are consistent with a role for NCBE as a pHi
regulator [9]. If NCBE also acts as a chloride extruder [7,8,35]
changes in retinal signal processing may also result from changes
in GABA-mediated inhibition. The activation of GABAA/C
receptors in KCC2-expressing neuronal compartments leads to
chloride influx and bicarbonate efflux [43,48], and down-
regulation of KCC2 lowers the driving force for GABA-induced
currents [34]. If NCBE contributes to chloride extrusion and
bicarbonate intrusion in retinal neurons, lack of NCBE may
similarly decrease the driving force for GABA, thereby altering
GABA-mediated inhibition. This may have caused the following:
a) in the outer and inner retina, GABAergic inhibition is thought
to be responsible for the antagonistic center/surround organiza-
tion of ganglion cell receptive fields [49–51]. Thus, loss of NCBE
may cause alterations in receptive field organization. Indeed, we
found changes in the spatial organization of receptive fields from
ON-transient cells: NCBE KO showed slightly higher responses to
large stimuli, suggesting that surround responses were weaker in
these cells (Fig. 6F). Consistently, contrast sensitivity in NCBE KO
mice was reduced, also pointing to a change in the spatial
organization of ganglion cell receptive fields [52]. b) In addition,
we found that the temporal structure of ganglion cell responses
from NCBE KO mice was altered (Fig. 6, 7). The prolonged ON
response duration in ganglion cells is consistent with impaired
GABA-mediated inhibition because GABAergic signals from
amacrine cells are thought to make bipolar cell and ganglion cell
responses more transient [53,54]. If NCBE was missing in ON
bipolar cell axon terminals and potentially in ganglion cell
dendrites, GABA-mediated inhibition would decrease and re-
sponses would become more sustained [53,55]. This effect may
also account for the failure of NCBE KO mice to follow stimulus
frequencies above 10 Hz (Fig. 5).
However, GABA-mediated inhibition plays a minor role in OFF
bipolar cells, in which glycine-mediated inhibition dominates [56].
As glycine-mediated inhibition may be similarly affected because
glycine receptors are also permeable for both chloride and
bicarbonate [36,57], it seems surprising that we did not find any
significant differences between the OFF responses of NCBE WT
and KO ON-OFF ganglion cells (Fig. 7) or in the high frequency
range of the dark-adapted flicker ERG. Yet, differences in
ganglion cell responses may have been obscured by cell-to-cell
variation. Moreover, physiological effects of NCBE loss are
difficult to interpret given the broad retinal expression of NCBE
and the complexity of retinal inhibitory circuits [56]. Also, we
cannot exclude compensatory mechanisms leading to altered ion
transporter kinetics or expression levels in NCBE-deficient mice.
For example, increased KCC2 levels could have compensated the
loss of NBCE, resulting in smaller changes in chloride homeostasis.
Indeed, we found no alterations in KCC2 immunoreactivity in
NCBE KO mice but subtle changes in expression levels may have
been missed.
Most likely, the changes in retinal processing also led to the
observed changes in visual behavior although we cannot exclude
that reduced neuronal excitability in higher brain areas [12]
contributes to the reduced contrast sensitivity in NCBE-deficient
mice. However, the strong NCBE expression in starburst amacrine
cells, which are indispensible for the optomotor response [58],
together with the altered temporal structures of ON and ON-OFF
ganglion cell light responses strongly suggest that NCBE deficiency
impairs the processing of moving stimuli. Indeed, our behavioral
measurements show that the spatial frequency sensitivity of the
Lack of NCBE Impairs Visual Function
PLOS ONE | www.plosone.org 11 October 2012 | Volume 7 | Issue 10 | e46155

optokinetic response is significantly lower in NCBE KO mice
compared to WT animals.
In conclusion, we show that the NCBE is differentially
expressed in bipolar and amacrine cells of the mouse retina and
that lack of NCBE leads to changes in retinal signal processing and
impaired visual performance. These data suggest that NCBE
contributes to pHi regulation in retinal neurons and make a role
for NCBE in the regulation of chloride-dependent inhibition very
likely.
Materials and Methods
All chemicals were obtained from Carl Roth GmbH (Karlsruhe,
Germany) unless stated otherwise.
Ethics StatementAll experiments were carried out in accordance with the
institutional guidelines for animal welfare of the Universities of
Oldenburg, Jena and Tubingen, following the standards described
by the German animal protection law (Tierschutzgesetz). Killing of
mice for tissue analysis and procedures of animal experimentation
were approved by the animal welfare officer of the respective
facility (University of Oldenburg, Jena and Tubingen) and the
local authorities (University of Oldenburg: Niedersachsisches
Landesamt fur Verbraucherschutz und Lebensmittelsicherheit;
Tubingen: Regierungsprasidium Tubingen).
Animal PreparationFor experiments, we used NCBE (Slc4a10) knockout (KO) and
NCBE wild-type (WT) mice [12]. Briefly, deletion of exon 12 of
the Slc4a10 gene, which encodes the first of the predicted 11–13
transmembrane spans of Slc4a10, leads to a frameshift and
a premature termination codon in exon 13. Mice were kept under
a 12 h light/dark cycle and were used at ages between 3–12
months for experiments. Mice were anesthetized with CO2 and
killed by cervical dislocation. For extracellular recordings, mice
were dark-adapted for three hours before sacrifice. Eyes were
enucleated, cornea, lens and vitreous body removed, and the
retina was prepared for further use. Dissections were performed
either in 0.1 M phosphate buffer (PB; pH 7.4) for immunhis-
tochemistry or in Ringer’s solution (110 mM NaCl, 2.5 mM KCl,
1 mM CaCl2, 1.6 mM MgCl2, 10 mM D-glucose,
22 mM NaHCO3, pH was maintained at 7.4 by aerating with
95% O2/5% CO2 mixed gas) for extracellular recordings.
Immunohistochemistry and Fluorescent ImageAcquisitionFor vertical cryosections, mouse eyecups were fixed in 2%
paraformaldehyde (PFA; Riedel de Haen, Seelze, Germany) in PB
for 2615 min at room temperature and washed with PB several
times. Eyecups were then cryoprotected in 30% sucrose in PB
overnight at 4uC and embedded in Cryoblock (Medite GmbH,
Burgdorf, Germany) at 220uC. Vertical sections (,25 mm) were
cut on a cryostat (Bright, Huntingdon, UK) and collected on slides.
Vertical sections were blocked with CTA (5% ChemiBLOCKER,
Millipore, Billerica, MA, 0.5% Triton X-100 and 0.05% NaN3)
for at least 60 min at room temperature. After the blocking
procedure, vertical sections were incubated with primary anti-
bodies in CTA overnight at 4uC. Incubation with secondary
antibodies in CTA was carried out for 2 hours at room
temperature. After washing several times with PB, sections were
mounted in Vectashield (Vector Laboratories, Burlingame, CA).
All incubations and washing procedures were performed in the
dark. Primary antibodies used for immunohistochemistry are listed
and described in Table 1. Secondary antibodies were conjugated
to Alexa Fluor 488, 568, 647 (Invitrogen, Karlsruhe, Germany),
Cy3, or Cy5 (Jackson ImmunoResearch Laboratory, West Grove,
PA), respectively. Experiments, in which the primary antibodies
were omitted, were performed to control for unspecific binding of
the secondary antibody.
For hematoxylin/eosin (H/E) stainings eyecups were fixed in
4% PFA in PB overnight. Then the tissue was dehydrated, paraffin
embedded and cut into 7 mm sections that were H/E stained
following standard procedures as described previously [59].
Confocal micrographs of fluorescent specimen were taken with
a Leica TCS SL confocal microscope (Leica, Wetzlar, Germany).
Scanning was performed with a 636/1.32 Plan-Apochromat
objective at a resolution of 1,02461,024 pixels. Scans of different
wavelengths were done sequentially to rule out spill-over between
red, green, and blue channels. Images are presented either as
single scan sections or projections of 10–15 sections (,5–7 mm).
Images were superimposed and adjusted in brightness and contrast
using Photoshop CS4 (Adobe, San Jose, CA). Colocalization
analyses were performed as described earlier [60]. Briefly, we used
the public domain Java image processing program ImageJ (NIH)
and performed fluorescence intensity correlations to assess
colocalization of NCBE with other markers.
ElectroretinographyElectroretinography was performed as described previously
[27]. Mice were measured at PW4 (NCBE WT and KO, n= 4)
and PW12 (NCBE WT, n= 2; NCBE KO, n=3). Prior to
experiments, mice were dark-adapted overnight. Anesthesia was
induced by subcutaneous injection of ketamine (66.7 mg/kg body
weight) and xylazine (11.7 mg/kg body weight). Short needle
electrodes served as reference (forehead) and ground (tail)
electrodes, and gold-wire ring electrodes as active electrodes.
The ERG equipment consisted of a Ganzfeld bowl, a direct
current amplifier, and a PC-based control and recording unit
(Multiliner Vision; VIASYS Healthcare GmbH, Hochberg,
Germany). Band-pass filter cutoff frequencies were 0.3 and
300 Hz, respectively. We obtained single-ash ERG responses
both under dark-adapted (scotopic) and light-adapted (photopic)
conditions. Light adaptation was accomplished with a background
illumination of 30 cd/m2 starting 10 min before photopic
recording session. Stimuli were presented with increasing in-
tensities, reaching from 24.0 to 1.5 log cd*s/m2 under scotopic
and from 22.0 to 1.5 log cd*s/m2 under photopic conditions,
divided into 10 and 8 steps, respectively. We also obtained
responses to trains of ashes (icker) using two fixed intensities
(22.0 and 0.5 log cd*s/m2) and 12 flash frequencies (0.5, 1, 2, 3,
5, 7, 10, 12, 15, 18, 20, and 30 Hz). The amplitude of the b-
wave, which represents the activity of ON bipolar cells, was
measured from the trough of the respective a-wave to the
following peak of the b-wave [27]. The b-wave latency was
defined as the time from flash onset to the peak of the b-wave.
In vivo ImagingConfocal scanning laser ophthalmoscopy (cSLO) images were
obtained from anesthetized mice immediately after ERG record-
ings using a Heidelberg Retina Angiograph (HRA I) as reported
previously [61,62]. Spectral domain optical coherence tomogra-
phy (SD-OCT) imaging was done in the same session as SLO, i.e.
animals remained anaesthetized. Mouse eyes were subjected to
OCT using a SpectralisTM HRA + OCT device from Heidelberg
Engineering [62,63]. Optical depth resolution is ca. 7 mm with
digital resolution reaching 3.5 mm [62]. Imaging was performed
Lack of NCBE Impairs Visual Function
PLOS ONE | www.plosone.org 12 October 2012 | Volume 7 | Issue 10 | e46155

using the proprietary software package Eye Explorer (version
3.2.1.0, Heidelberg Engineering).
Extracellular Ganglion Cell RecordingsFor these measurements, mice older than PW12 were used.
Dissections were performed in the dark under dim red light [64].
Small incisions were made into the rim of the dissected eyecup to
facilitate inversion. The eyecup was then inverted onto a balsa
wood dome, stabilized with tissue paper, and transferred to the
recording chamber. Ringer’s solution, warmed to 32uC using
a heated cannula (MultiChannel Systems, Reutlingen, Germany),
flowed continuously over the preparation from a small needle
positioned at the apex of the inverted eyecup. After dissection,
retinas were left to recover and dark-adapt for 1 h. 20 min before
recordings, full-field flashes were presented (duration 300 ms,
1 Hz, 6.9 cd*s/m2) to assure identical light conditions for all
retinas. Glass electrodes (Hilgenberg, Malsfeld, Germany) had
resistances of 2–3 MV and were filled with Ringer’s solution.
During the search for a cell, the retina was stimulated with light
flashes (300 ms duration, 0.3 Hz, 6.9 cd*s/m2) while the light
stimulus was centered on the electrode tip.
Light StimulationLight stimuli were generated by a 100 W tungsten halogen lamp
and intensity was controlled by a set of neutral density filters (Zeiss,
Gottingen, Germany). We used stimuli with an increasing spot size
(75–1,700 mm) and constant light intensity (6.9 cd*s/m2) and
increasing intensities (24.0 to 2.0 log cd*s/m2) with a constant
spot size (300 mm). We recorded blocks of 2 s for each stimulus
and repeated each block 5 times with an interval of 6 s between
stimuli. Stimulus duration was 300 ms with a delay of 100 ms. For
flicker stimuli (1–15 Hz) we used a constant spot size (300 mm) at
a constant intensity (6.9 cd*s/m2). Stimulus duration and intervals
between were aligned evenly with respect to the increasing
frequency. We recorded blocks of 10 s for each flicker stimulus
and repeated each block 5 times.
Data AcquisitionLight-evoked signals were amplified (DAM-50, World Precision
Instruments, Sarasota, FL), bandpass-filtered (10–10,000 Hz) and
digitized with a sampling rate of 20 kHz by PowerLab/4SP
(ADInstruments, Spechbach, Germany). Signals were recorded
with Chart 5.5 (ADInstruments), digitally bandpass-filtered (300–
5,000 Hz) and exported for spike sorting (Offline sorter 2.8.8,
Plexon, Dallas, TX). Spikes were detected by threshold crossing
using 2.8 sigmas of the standard deviation from the mean peak
histogram. Cluster contours of the principle components were
derived from the expectation maximization algorithm, in which
the distribution of waveforms from each unit is modeled as
a multivariate student’s t-distribution. Timestamps were exported
to Neuroexplorer 3.266 (Nex, Littleton, MA) and a PSTH (bin
width 1 ms) was calculated from the recorded 5 blocks for each
stimulus. The PSTH was smoothed with a 25 ms Gaussian
function to minimize alterations of the firing rate and to enhance
signal-to-noise ratio.
PSTH Parameters and Classification of Ganglion CellsFrom the PSTH we extracted several parameters to describe the
light responses of NCBE KO and WT ganglion cells [65]. For ON
responses: the peak response after stimulus onset, corrected by the
average baseline spike firing rate for the first 100 ms before
stimulus onset, was taken to be the cell’s response amplitude (A1).
Time to peak (L1) was defined as the time from stimulus onset to
A1. The parameter A1t2 estimates the cell’s firing time (response
duration) from A1 to a defined criterion response (A1/e). For OFF
responses, we similarly calculated the parameters A2, L2 and A2t2in relation to stimulus offset.
To classify cells into physiological response types, we followed
the response classification after [65]. Briefly, PSTH parameters A1
and A2 were transformed to a bias index: BI = (A12A2)/(A1+A2).If BI tended to +1, cells were classified as ON ganglion cells; if BI
tended to21, cells were classified as OFF ganglion cells. A BI near
0 classified the cells as ON-OFF ganglion cells. To distinguish
between ON-transient and ON-sustained ganglion cells, the
Table 1. Primary antibodies used in this study.
Antibody Immunogen Species, type, dilution Source (Cat. No.)
Calbindin D-28K Chicken calbindin D-28K, full-length amino acidsequence
Mouse, monoclonal, 1:5,000 Swant, Marly, Switzerland (300)
Calretinin Guinea-pig calretinin, full-length amino acidsequence
Goat, polyclonal, 1:1,000 Millipore, Billerica, MA (AB1550)
ChAT Human placental enzyme Goat, polyclonal, 1:250 Millipore, Billerica, MA (AB144P)
CSEN Recombinant human calsenilin Mouse, monoclonal, 1:2,000 W. Wasco, Harvard Medical School, Charlestown, MA
Ga0 Bovine brain Ga0 Mouse, monoclonal,1:250
Millipore, Billerica, MA (MAB3073; clone 2A)
HCN4c Mouse HCN4,amino acids 1,116–1,201 Guinea pig, polyclonal, 1:1,000 F. Muller, Forschungszentrum Julich, Germany
KCC2 Rat KCC2 (Slc12a5), amino acids 8–22 Rabbit, polyclonal, 1:500 C. Hubner, University Hospital Jena, Germany
NCBE Mouse NCBE (Slc4a10), amino acids 71–85 Rabbit, polyclonal, 1:500 C. Hubner, University Hospital Jena, Germany
NCBE Mouse NCBE (Slc4a10),amino acids 71–85 Guinea pig, polyclonal, 1:500 C. Hubner, University Hospital Jena, Germany
NK3R Rat neurokinin 3 receptor,amino acids 410–417 Rabbit polyclonal, 1:500 A. Hirano, Geffen School of Medicine at UCLA, CA
PKARIIb Human protein kinase A regulatory subunit IIb,amino acids 1–418
Mouse, monoclonal, 1:2,000 BD Biosciences, San Jose, CA (610625)
PKCa Purified bovine brain protein kinase C Mouse, monoclonal, 1:1,000 Sigma Aldrich, Munchen, Germany (P 5704; Clone MC5)
ZNP-1 Synaptotagmin II, 1–5 day zebrafish embryo Mouse, monoclonal,1:500
Zebrafish International Resource Center (081002-25)
doi:10.1371/journal.pone.0046155.t001
Lack of NCBE Impairs Visual Function
PLOS ONE | www.plosone.org 13 October 2012 | Volume 7 | Issue 10 | e46155

response duration (A1t2) was transformed to a histogram and two
groups separated. ON ganglion cells with A1t2,200 ms were
classified as ON-transient ganglion cells and with A1t2.200 ms as
ON-sustained ganglion cells.
Values are presented as mean 6 standard error of the mean
(SEM). Individual parameters of WT and KO ganglion cells were
compared with a repeated measure (RM) two-way ANOVA.
Behavioral Determination of Visual Acuity and ContrastSensitivityVisual acuity and contrast sensitivity were determined using the
virtual-reality optomotor system developed by Prusky et al. [30].
Briey, freely moving animals were exposed to moving vertical sine
wave gratings of various spatial frequencies and contrasts and will
reexively track the gratings by head movements as long as they can
see the gratings. Spatial frequency at full contrast and contrast at
six different spatial frequencies were varied by the experimenter
until the threshold of tracking was determined [31]. The threshold
for grating acuity and contrast thresholds were measured at the
following six spatial frequencies: 0.031, 0.064, 0.092, 0.103, 0.192,
0.272 cycles/degree (cyc/deg). Contrast sensitivity was calculated
at each spatial frequency as a Michelson contrast from the screen
luminance (max 2 min)/(max + min) and the reciprocal of the
threshold (black mean, 0.22 cd/m2; white mean, 152.13 cd/m2).
Statistical tests were performed with Student’s t-test and values are
presented as mean 6 SEM.
Supporting Information
Figure S1 NCBE is not expressed in photoreceptors. A,Projection (2 mm) of a NCBE WT retinal section stained for
NCBE (green) and PSD95 (magenta). B–D, PSD95-labeled
photoreceptor bases (C) showed no colocalization (D) with NCBE
(B) in single scans (0.5 mm) of NCBE WT retinal sections. Scale
bars = 10 mm.
(TIF)
Figure S2 Electroretinography in NCBE-deficient mice (age 4
weeks). A, D, Representative single flash ERG recordings from
NCBE WT (black) and KO (red) mice for increasing intensities
under dark-adapted (A, scotopic) and light-adapted (D, photopic)
conditions. B, C, E, F, Box-and-whisker plots of single flash ERG
b-wave amplitudes (B, E) and latencies (C, F), plotted against flash
intensity. Scotopic b-wave but not a-wave amplitudes in NCBE
KO mice were reduced (A, B), and b-wave latencies (C) wereincreased compared to NCBE WT mice. Inset in C: Overlay of
scotopic single flash ERG response traces of NCBE WT (black)
and NCBE KO (red) mice at 22.0 log cd*s/m2 intensity (arrow
head). Scale bar: horizontal 50 ms, vertical 200 mV. Under
photopic conditions, b-wave amplitudes (D, E) and b-wave
latencies (F) of NCBE KO mice were similarly affected. G, I,Representative ERG recordings of a flicker frequency series (flash
intensity G: 22 log cd*s/m2; I: 0.5 log cd*s/m2) under scotopic
conditions. Flicker amplitudes (H, J) of NCBE KO mice decreased
at much lower flash frequencies than that of WT controls. In all
quantitative plots (B, C, E, F, H, J), boxes indicate the 25% and
75% quantile range, whiskers indicate the 5% and 95% quantiles,
and solid lines connect the medians of the data. NCBE WT (n= 4),
NCBE KO (n= 4).
(TIF)
Figure S3 In vivo retinal morphology in NCBE WT and KO
mice. Fundus images of NCBE WT (A) and KO (C) mice obtained
with 514 nm wavelength. Solid lines indicate the origin of the
OCT scans in NCBE WT (B) and KO (D) mice. On the right side
of the panels, blow ups of the retinal layering are also shown. No
morphological differences between the two mouse genotypes were
observed. Abbreviations: GC: ganglion cell layer; IPL: inner
plexiform layer; INL: inner nuclear layer; OPL: outer plexiform
layer; ONL: outer nuclear layer; IS/OS: inner segment outer
segment boarder; RPE: retinal pigment epithelium.
(TIF)
Acknowledgments
We thank Bettina Kewitz for excellent technical assistance. We thank
Francoise Haeseleer (University of Washington, Seattle, WA) for the
generous gifts of the anti-CaB5 antibody, Frank Muller (FZ Julich, Julich,
Germany) for the anti-HCN4 antibody, and Arlene Hirano (UCLA, Los
Angeles, CA) for the NK3R antibody, respectively.
Author Contributions
Conceived and designed the experiments: KD CAH RW SL MWS GH.
Performed the experiments: GH AKH NT VS CS MGG KFS KD.
Analyzed the data: GH AKH NT VS CS MGG KFS KD. Wrote the
paper: KD GH CAH SL MWS KFS NT.
References
1. Dmitriev AV, Mangel SC (2004) Retinal pH reflects retinal energy metabolism
in the day and night. J Neurophysiol 91: 2404–2412.
2. deVries S, Schwartz E (1989) Modulation of an electrical synapse between
solitary pairs of catfish horizontal cells by dopamine and 2nd messengers.
Journal of Physiology-London 414: 351–375.
3. McAlear S, Bevensee M (2004) pH regulation in non-neuronal brain cellsand
interstitial fluid. Advances in Molecular and Cell Biology 31: 707–745.
4. Bok D, Galbraith G, Lopez I, Woodruff M, Nusinowitz S, et al. (2003) Blindness
and auditory impairment caused by loss of the sodium bicarbonate cotransporter
NBC3. Nat Genet. United States. 313–319.
5. Alvarez B, Gilmour G, Mema S, Martin B, Shull G, et al. (2007) Blindness
Caused by Deficiency in AE3 Chloride/Bicarbonate Exchanger. Plos One 2: –.
6. Kobayashi S, Morgans C, Casey J, Kopito R (1994) AE3 anion-exchanger
isoforms in the vertebrate retina - developmental regulation and differential
expression in neurons and glia. Journal of Neuroscience 14: 6266–6279.
7. Wang C, Yano H, Nagashima K, Seino S (2000) The Na+-driven Cl2/HCO3-
exchanger - Cloning, tissue distribution, and functional characterization. Journal
of Biological Chemistry 275: 35486–35490.
8. Giffard RG, Lee YS, Ouyang YB, Murphy SL, Monyer H (2003) Two variants
of the rat brain sodium-driven chloride bicarbonate exchanger (NCBE):
developmental expression and addition of a PDZ motif. Eur J Neurosci 18:
2935–2945.
9. Parker MD, Musa-Aziz R, Rojas JD, Choi I, Daly CM, et al. (2008)
Characterization of human SLC4A10 as an electroneutral Na/HCO3
cotransporter (NBCn2) with Cl- self-exchange activity. J Biol Chem 283:
12777–12788.
10. Liu Y, Xu K, Chen LM, Sun X, Parker MD, et al. (2010) Distribution of NBCn2
(SLC4A10) splice variants in mouse brain. Neuroscience. United States: 2010
IBRO. Published by Elsevier Ltd. 951–964.
11. Liu Y, Xu JY, Wang DK, Boron WF, Chen LM (2011) Expression and
distribution of NBCn2 (Slc4a10) splice variants in mouse brain: cloning of novel
variant NBCn2-D. Brain Res. Netherlands: 2011 Elsevier B.V. 33–40.
12. Jacobs S, Ruusuvuori E, Sipila S, Haapanen A, Damkier H, et al. (2008) Mice
with targeted Slc4a10 gene disruption have small brain ventricles and show
reduced neuronal excitability. Proceedings of the National Academy of Sciences
of the United States of America 105: 311–316.
13. Hubner C, Hentschke M, Jacobs S, Hermans-Borgmeyer I (2004) Expression of
the sodium-driven chloride bicarbonate exchanger NCBE during prenatal
mouse development. Gene Expression Patterns 5: 219–223.
14. Vardi N, Zhang L, Payne J, Sterling P (2000) Evidence that different cation
chloride cotransporters in retinal neurons allow opposite responses to GABA.
Journal of Neuroscience 20: 7657–7663.
15. Russell J (2000) Sodium-potassium-chloride cotransport. Physiological Reviews
80: 211–276.
16. Duebel J, Haverkamp S, Schleich W, Feng G, Augustine G, et al. (2006) Two-
photon imaging reveals somatodendritic chloride gradient in retinal ON-type
bipolar cells expressing the biosensor clomeleon. Neuron 49: 81–94.
Lack of NCBE Impairs Visual Function
PLOS ONE | www.plosone.org 14 October 2012 | Volume 7 | Issue 10 | e46155

17. Haverkamp S, Ghosh K, Hirano A, Wassle H (2003) Immunocytochemical
description of five bipolar cell types of the mouse retina. Journal of ComparativeNeurology 455: 463–476.
18. Wassle H, Puller C, Muller F, Haverkamp S (2009) Cone contacts, mosaics, and
territories of bipolar cells in the mouse retina. J Neurosci 29: 106–117.19. Fox MA, Sanes JR (2007) Synaptotagmin I and II are present in distinct subsets
of central synapses. J Comp Neurol 503: 280–296.20. Mataruga A, Kremmer E, Muller F (2007) Type 3a and type 3b OFF cone
bipolar cells provide for the alternative rod pathway in the mouse retina. J Comp
Neurol 502: 1123–1137.21. Haverkamp S, Wassle H (2000) Immunocytochemical analysis of the mouse
retina. J Comp Neurol 424: 1–23.22. Haeseleer F, Sokal I, Verlinde C, Erdjument-Bromage H, Tempst P, et al.
(2000) Five members of a novel Ca2+-binding protein (CABP) subfamily withsimilarity to calmodulin. Journal of Biological Chemistry 275: 1247–1260.
23. Masland R (2005) The many roles of starburst amacrine cells. Trends in
Neurosciences 28: 395–396.24. Gavrikov K, Dmitriev A, Keyser K, Mangel S (2003) Cation-chloride
cotransporters mediate neural computation in the retina. Proceedings of theNational Academy of Sciences of the United States of America 100: 16047–
16052.
25. Gavrikov K, Nilson J, Dmitriev A, Zucker C, Mangel S (2006) Dendriticcompartmentalization of chloride cotransporters underlies directional responses
of starburst amacrine cells in retina. Proceedings of the National Academy ofSciences of the United States of America 103: 18793–18798.
26. Seeliger MW, Brombas A, Weiler R, Humphries P, Knop G, et al. (2011)Modulation of rod photoreceptor output by HCN1 channels is essential for
regular mesopic cone vision. Nat Commun 2: 532.
27. Tanimoto N, Muehlfriedel R, Fischer M, Fahl E, Humphries P, et al. (2009)Vision tests in the mouse: Functional phenotyping with electroretinography.
Frontiers in Bioscience 14: 2730–2737.28. Stone C, Pinto LH (1993) Response properties of ganglion cells in the isolated
mouse retina. Vis Neurosci 10: 31–39.
29. Sagdullaev BT, McCall MA (2005) Stimulus size and intensity alter fundamentalreceptive-field properties of mouse retinal ganglion cells in vivo. Vis Neurosci 22:
649–659.30. Prusky G, Alam N, Beekman S, Douglas R (2004) Rapid quantification of adult
and developing mouse spatial vision using a virtual optomotor system.Investigative Ophthalmology & Visual Science 45: 4611–4616.
31. Lehmann K, Lowel S (2008) Age-dependent ocular dominance plasticity in adult
mice. PLoS One 3: e3120.32. Li B, McKernan K, Shen W (2008) Spatial and temporal distribution patterns of
Na-K-2Cl cotransporter in adult and developing mouse retinas. Vis Neurosci 25:109–123.
33. Vardi N, Dhingra A, Zhang L, Lyubarsky A, Wang TL, et al. (2002)
Neurochemical organization of the first visual synapse. Keio J Med 51: 154–164.34. Rivera C, Voipio J, Payne JA, Ruusuvuori E, Lahtinen H, et al. (1999) The K+/
Cl- co-transporter KCC2 renders GABA hyperpolarizing during neuronalmaturation. Nature 397: 251–255.
35. Damkier HH, Aalkjaer C, Praetorius J (2010) Na+-dependent HCO3- import bythe slc4a10 gene product involves Cl- export. J Biol Chem 285: 26998–27007.
36. Miller RF, Dacheux RF (1983) Intracellular chloride in retinal neurons:
measurement and meaning. Vision Res 23: 399–411.37. Dmitriev AV, Dmitrieva NA, Keyser KT, Mangel SC (2007) Multiple functions
of cation-chloride cotransporters in the fish retina. Vis Neurosci 24: 635–645.38. Varela C, Blanco R, De la Villa P (2005) Depolarizing effect of GABA in rod
bipolar cells of the mouse retina. Vision Res 45: 2659–2667.
39. Blanco R, Vaquero CF, de la Villa P (1996) The effects of GABA and glycine onhorizontal cells of the rabbit retina. Vision Res 36: 3987–3995.
40. Zhang LL, Fina ME, Vardi N (2006) Regulation of KCC2 and NKCC duringdevelopment: membrane insertion and differences between cell types. J Comp
Neurol 499: 132–143.
41. Zhang RW, Wei HP, Xia YM, Du JL (2010) Development of light response andGABAergic excitation-to-inhibition switch in zebrafish retinal ganglion cells.
J Physiol 588: 2557–2569.
42. Vu TQ, Payne JA, Copenhagen DR (2000) Localization and developmental
expression patterns of the neuronal K-Cl cotransporter (KCC2) in the rat retina.J Neurosci 20: 1414–1423.
43. Chesler M, Kaila K (1992) Modulation of pH by neuronal activity. Trends
Neurosci 15: 396–402.44. Lee J, Taira T, Pihlaja P, Ransom BR, Kaila K (1996) Effects of CO2 on
excitatory transmission apparently caused by changes in intracellular pH in therat hippocampal slice. Brain Res 706: 210–216.
45. Sinning A, Liebmann L, Kougioumtzes A, Westermann M, Bruehl C, et al.
(2011) Synaptic glutamate release is modulated by the Na+ -driven Cl2/HCOexchanger Slc4a8. J Neurosci 31: 7300–7311.
46. Dawis S, Hofmann H, Niemeyer G (1985) The electroretinogram, standingpotential, and light peak of the perfused cat eye during acid-base changes. Vision
Res 25: 1163–1177.47. Niemeyer G (1986) Acid-base balance affects electroretinogram b- and c-wave
differentially in the perfused cat eye. Doc Ophthalmol 63: 113–120.
48. Kaila K, Voipio J (1987) Postsynaptic fall in intracellular pH induced by GABA-activated bicarbonate conductance. Nature 330: 163–165.
49. Wu SM, Yang XL (1991) Functional characterization of amino acidneurotransmitters in the outer retina. Neurosci Res Suppl 15: S117–130.
50. Ichinose T, Lukasiewicz PD (2005) Inner and outer retinal pathways both
contribute to surround inhibition of salamander ganglion cells. J Physiol 565:517–535.
51. Chen X, Hsueh HA, Greenberg K, Werblin FS (2010) Three forms of spatialtemporal feedforward inhibition are common to different ganglion cell types in
rabbit retina. J Neurophysiol 103: 2618–2632.52. Dedek K, Pandarinath C, Alam NM, Wellershaus K, Schubert T, et al. (2008)
Ganglion cell adaptability: does the coupling of horizontal cells play a role? PLoS
One 3: e1714.53. Dong CJ, Werblin FS (1998) Temporal contrast enhancement via GABAC
feedback at bipolar terminals in the tiger salamander retina. J Neurophysiol 79:2171–2180.
54. Molnar A, Werblin F (2007) Inhibitory feedback shapes bipolar cell responses in
the rabbit retina. J Neurophysiol 98: 3423–3435.55. Sagdullaev BT, McCall MA, Lukasiewicz PD (2006) Presynaptic inhibition
modulates spillover, creating distinct dynamic response ranges of sensory output.Neuron 50: 923–935.
56. Eggers ED, Lukasiewicz PD (2011) Multiple pathways of inhibition shapebipolar cell responses in the retina. Vis Neurosci 28: 95–108.
57. Bormann J, Hamill OP, Sakmann B (1987) Mechanism of anion permeation
through channels gated by glycine and gamma-aminobutyric acid in mousecultured spinal neurones. J Physiol 385: 243–286.
58. Yoshida K, Watanabe D, Ishikane H, Tachibana M, Pastan I, et al. (2001) A keyrole of starburst amacrine cells in originating retinal directional selectivity and
optokinetic eye movement. Neuron 30: 771–780.
59. Hubner CA, Stein V, Hermans-Borgmeyer I, Meyer T, Ballanyi K, et al. (2001)Disruption of KCC2 reveals an essential role of K-Cl cotransport already in
early synaptic inhibition. Neuron 30: 515–524.60. Hilgen G, von Maltzahn J, Willecke K, Weiler R, Dedek K (2011) Subcellular
Distribution of Connexin45 in OFF Bipolar Cells of the Mouse Retina. Journalof Comparative Neurology 519: 433–450.
61. Seeliger MW, Beck SC, Pereyra-Munoz N, Dangel S, Tsai JY, et al. (2005) In
vivo confocal imaging of the retina in animal models using scanning laserophthalmoscopy. Vision Res 45: 3512–3519.
62. Huber G, Beck SC, Grimm C, Sahaboglu-Tekgoz A, Paquet-Durand F, et al.(2009) Spectral domain optical coherence tomography in mouse models of
retinal degeneration. Invest Ophthalmol Vis Sci 50: 5888–5895.
63. Fischer MD, Huber G, Beck SC, Tanimoto N, Muehlfriedel R, et al. (2009)Noninvasive, in vivo assessment of mouse retinal structure using optical
coherence tomography. PLoS One 4: e7507.64. Trumpler J, Dedek K, Schubert T, Muller L, Seeliger M, et al. (2008) Rod and
cone contributions to horizontal cell light responses in the mouse retina. Journal
of Neuroscience 28: 6818–6825.65. Carcieri S, Jacobs A, Nirenberg S (2003) Classification of retinal ganglion cells:
A statistical approach. Journal of Neurophysiology 90: 1704–1713.
Lack of NCBE Impairs Visual Function
PLOS ONE | www.plosone.org 15 October 2012 | Volume 7 | Issue 10 | e46155