northeast syria: area-based assessment of deir-ez-zor ... · ha jin de ir-e z-zor ab u k amal tab...
TRANSCRIPT

MethodologyOverall, 139 communities and IDP sites in Deir-ez-Zor governorate were assessed between 24 September and 1 October 2018 through remote Key Informant (KI) interviews, with one to five KIs per assessed community depending on availability. Different tools were used to assess communities and informal sites to identify population estimates and multi-sectoral needs. Identified IDP sites were only assessed separately if they were located outside the boundaries of permanent communities. The data were triangulated against secondary sources and initial findings were presented at a workshop with enumerators involved in the data collection to get input on context and potential interpretations.
While efforts were made to cover as many locations as possible, the list of assessed sites and communities was compiled on the basis of accessibility, and should therefore not be considered to be fully comprehensive. Information should only be considered as relevant to the time of data collection, given the dynamic situation in the governorate. Findings are not statistically representative and should be regarded as indicative only, particularly as they are aggregated across communities and sites within which humanitarian conditions may vary widely between areas or households.
IntroductionSince mid-2017, ongoing conflict has led to displacement from and within Deir-ez-Zor governorate. Throughout 2018, de-escalation of conflict in some parts of the governorate has allowed limited humanitarian access for the first time since 2014. However, there are still significant access and security limitations in all areas of the governorate, and actors face substantial information gaps in terms of the location and priority needs of non-displaced residents, returnees, and internally displaced persons (IDPs).In order to address these gaps, REACH has conducted a fourth round of the Deir-ez-Zor Situation Overview, which aims to provide information on the locations and humanitarian needs of the different population groups in the governorate. This follows previous rounds of the assessment in February, April, and June 2018.
Key Findings• Displacement: Significant displacement has occurred across Deir-ez-Zor, with high numbers of
spontaneous returnees reported to be living in all areas and particularly high numbers of IDPs in the West Line and the East Line (see map 1).
• WASH: Water quality issues (including bad smell, taste, and colour) were reported in all assessed areas. Water shortages were reported in the North Line and in the East Line. The high cost of water trucking services was reportedly an issue in the North Line and the East Line.
• Health: Healthcare was among the most commonly reported priority needs across all assessed areas. Transportation was the most commonly reported barrier to accessing care, especially in areas away from the Euphrates, such as Sur and northern Kisreh, which are far from the nearest hospital. In all assessed areas, women reportedly faced specific barriers to accessing healthcare, with the most commonly reported barriers being related to traveling and the lack of female medical professionals.
• Shelter and NFIs: Rental prices were reported to be rising across the governorate, especially in the West Line. KIs reported that access to electricity was limited, especially in the East Line, the North West, and the South West. Reliance on expensive private generators may also limit access for low-income households. Of the most commonly reported top NFI needs, a majority were winterisation items. Sources of light and disposable diapers were also commonly reported needs in some areas.
• Livelihoods: Agricultural activities were the most commonly reported source of income, followed by remittances and trade. Common agricultural activities included growing wheat, cotton, and vegetables, as well as raising sheep, cattle, and chickens. Agricultural producers in the governorate have faced significant challenges, which has led to a drop in productivity. Commonly reported challenges included the price and availability of agricultural inputs as well as irrigation issues, which were found to be particularly common in the North Line and the East Line.
• Education: Primary education was reportedly available in most communities except in the East Line. Intermediary, and secondary education were reportedly much less common. Reported IDP attendance rates were low, including in areas where host community children had good access to education.
• Protection: Protection risks and barriers to movement were most commonly reported in the East Line, where active conflict is ongoing. Additionally, barriers to movement were reported in the North West and South West, largely in relation to safety/security concerns.
⛳⚑
⛳⚑
⛳⚑
⛳⚑
⛳⚑
⛳⚑
N O R T H L I N E
W E S T L I N E
N O R T H W E S T
E A S T L I N E
S O U T HW E S TH O M S
A L - H A S A K E H
A R - R A Q Q A
Deir-ez-Zor208,725
Kisreh106,931
Basira61,050
Muhasan10,475
Tabni29,530
Khasham28,003
Sur59,770
AbuKamal13,100
Hajin84,733
Jalaa2,700 Susat
14,085
AlMayadin17,135
Thiban67,628
Ashara16,700
² 0 20 40 60Kms
Syrian Democratic Forces
ISIL
Government of Syria
Contested Areas
⛳⚑
⛳⚑
Unassessed community
50,001 - 155,000
15,001 - 50,000
5,001 - 15,000
1,001 - 5,000
1 - 1,000
PopulationCommunity Informal Site
Area of Influence (September 2018)
I R A Q
J O R D A N
T U R K E Y
Map 1: Assessment coverage
Northeast Syria: Area-Based Assessment of Deir-ez-Zor GovernorateNovember 2018

2
Map 2: Estimated total population (host community and IDPs) with % who are returnees or IDPs
Population, Returns and Access• 720,000 individuals were estimated to be living in the assessed areas of Deir-ez-Zor governorate.• Around 107,000 individuals were estimated to be currently displaced within the governorate,
often in vulnerable shelter types such as tents, collective centres, and unfinished buildings. The highest proportions of IDPs were recorded in Hajin and Kisreh sub-districts, followed by Deir-ez-Zor and Thiban.
• An estimated 374,000 people in assessed communities in Deir-ez-Zor were spontaneous returnees, meaning they were displaced from their community of origin at some point during the conflict and have since returned.1
• In 92% of communities, KIs reported that more than 75% of spontaneous returnees had returned to the same properties they lived in prior to being displaced. For those spontaneous returnees that had not returned, the most commonly reported reasons for this were damage to shelters, followed by shelters being rented out to others and properties being squatted by others.
1) The definition of a spontaneous returnee includes a broad range of circumstances and does not distinguish between those who have returned to their pre-displacement home and those who now live in different homes or shelter types in their community of origin. It also does not take into account whether those who have returned are enjoying the same rights as they did prior to being displaced.
• Those spontaneous returnees who did not return to their property of origin were most frequently reported to be living in houses and apartments. In a small proportion of communities KIs reported that some returnees lived in collective centers and unfinished buildings, raising protection concerns.
S U R
K I S REH
H A J IN
D E I R - E Z-ZOR
A B U K A MAL
TA B NI
T H I BAN
M U H A SAN
A L M AYADIN
B A S IRA
A S H ARA
J A L AA
S U S AT
K H A S HAM
AL-HASAKEHAR-RAQQA
IRAQ
Estimated total IDPpopulation in individuals
MARKER SIZEEstimated % IDPs in the community wholive in vulnerable shelter types
0% - 24%
25% - 49%50% - 74%75% - 100%
MARKER COLOUR
25 - 500
501 - 5,000
5,001 - 14,000
Map 3: Estimated IDP numbers and percentage of IDPs in shelters of last resort
Figure 1: Total estimated population for IDPs and host community (HC) members
S U R
K I S REH
H A J IN
D E I R - E Z-ZOR
A B U K A MAL
TA B NI
T H I BAN
M U H A SAN
A L M AYADIN
B A S IRA
A S H ARA
J A L AA
S U S AT
K H A S HAM
AL-HASAKEHAR-RAQQA
IRAQ
(7% IDPs, 63% returnees)
(19% IDPs, 9% returnees)
(6% IDPs, 77% returnees)
(0% IDPs, 70% returnees)
(8% IDPs, 49% returnees)
(4% IDPs,69% returnees)
(3% IDPs, 75% returnees)
(8% IDPs, 13% returnees)
(20% IDPs, 68% returnees)
(12% IDPs, 48% returnees)
(21% IDPs, 50% returnees)
(21% IDPs, 36% returnees)
(33% IDPs, 36% returnees)
(12% IDPs, 76% returnees)
Estimated population in individuals,including IDPs and HC members
MARKER SIZEEstimated % of the population whoare IDPs or spontaneous returnees
0% - 24%
25% - 49%50% - 74%75% - 100%
MARKER COLOUR
175 - 5,000
5,001 - 25,000
25,001 - 153,500
38,795 14,395 44,266 7,545 2,235
128,473106,425
122,180 208,850
47,400
West line North line East line North West South West
HC population(Individuals)
IDP population(Individuals)
Line Line Line

3
24%
67%48% 36%
61%51%
30%
12% 25%
17%
West line North line East line North West South West
Moderate increase Significant increase
Shelter
2) Examples of moderate damage include broken windows/doors and minor holes in walls. Examples of severe damage include holes in roofs, damage to walls and complete structural collapse.3) No quantitative data was captured about rental prices, but KIs were asked to qualify if the increase had been “moderate” or “significant”.4) None of the IDPs in assessed areas in the North West and South West were reported to be living in vulnerable shelter types.
Map 4: Reported rates of moderate to severe shelter damage2
S U R
K I S REH
H A J IN
D E I R - E Z-ZOR
A B U K A MAL
TA B NI
T H I BAN
M U H A SAN
A L M AYADIN
B A S IRA
A S H ARA
J A L AA
S U S AT
K H A S HAM
AL-HASAKEHAR-RAQQA
IRAQ
Estimated population in individuals,including IDPs and HC members
MARKER SIZEEstimated % of shelters in the communitywith moderate or severe damage
0% - 24%
25% - 49%50% - 74%75% - 100%
MARKER COLOUR
175 - 5,000
5,001 - 25,000
25,001 - 153,500
• Overall, the highest reported rates of shelter damage were found in the North West, South West and East Line areas. In the North West, KIs in 18% of communities reported that over half of all shelters were at least moderately damaged. Examples of moderate damage included broken windows/doors or minor holes in walls. This was followed by 11% of communities in the South West.
• The highest rates of severe shelter damage were also found in the North West, where over a quarter of shelters in 18% of communities had sustained damage that included holes in roofs, damage to walls, or complete structural collapse. In the East Line, this was reportedly the case in 12% of communities.
• The inability to afford repair materials was the most frequently listed barrier to shelter repair, reported by KIs in more than 84% of communities in all areas and in all assessed communities in the North West and South West. Additionally, a lack of availability of shelter repair materials in markets was most commonly reported in the in the West Line (44%), the North West (32%) and the South West (28%).
• KIs in a majority of communities across all areas reported that there had been an increase in rental prices in the last 3 months. In the North Line, KIs in 97% of assessed communities reported that there had been an increase, followed by more than three quarters of communities in the West Line and the South West. In the West Line, the increase in rent prices was reported to be especially significant in just over half of assessed communities, which may be connected with the numbers of IDPs in the area.
• High numbers of IDPs were reported to be living in vulnerable shelter types in the West Line and the East Line. The highest overall number of IDPs in tents was reported in the West Line, while the highest numbers in collective centres and unfinished buildings were in the East Line. In the North Line, a significant number of IDPs were also reported to be living in collective centres.
• According to KIs, the majority of collective centres were originally school buildings, although reported shelters also included a number of religious buildings, government facilities, warehouses and agricultural buildings.
Figure 2: Reported increases in rental prices in the 3 months prior to data collection, by % of communities3
8,037 5,648
2,655 7,390
2,580
2,601
5,197
West line North line East line North West South West
Tents Unfinished buildings Collective centres
8,037 5,648
2,655 7,390
2,580
2,601
5,197
West line North line East line North West South West
Tents Unfinished buildings Collective centres
Line Line Line
Line Line Line
Figure 3: Estimated number of IDPs living in vulnerable shelter types, by type4

4
2% 28% 32% 22%22%
67%28%
50%50%
73%
33% 44%14% 28%
2% 4%
West line North line East line North West South West
2 - 4 hours 4 - 6 hours 6 - 8 hours More than 8 hours
• Private generators were the most commonly reported source of electricity. In the North Line and the East Line community generators were reported in around one third of communities. In the East Line, car batteries (charged by running cars) were reportedly also a primary electricity source in a number of communities.
Map 5: Reported average daily hours of electricity
Electricity• Having access to fewer than four hours of electricity per day was most commonly reported
in the North West, the South West and in the East Line. Having more than six hours per day was most commonly reported in the West Line, although KIs in a majority of communities still estimated that electricity was available for fewer than 8 hours per day on average.
5) KIs were allowed to select up to three options
Non-food Items (NFIs)
S U R
K I S REH
H A J IN
D E I R - E Z-ZOR
A B U K A MAL
TA B NI
T H I BAN
M U H A SAN
A L M AYADIN
B A S IRA
A S H ARA
J A L AA
S U S AT
K H A S HAM
AL-HASAKEHAR-RAQQA
IRAQ
Estimated population in individuals,including IDPs and HC members
MARKER SIZEEstimated average daily hours ofelectricity available in the community
More than 8 hours
6 - 8 hours4 - 6 hours2 - 4 hours
MARKER COLOUR
175 - 5,000
5,001 - 25,000
25,001 - 153,500
Table 6: Most commonly reported top NFI needs in the community, by % of communities5
Figure 4: Reported primary sources of electricity for the community, by % of communities
• Sources of light were the most commonly reported priority NFI need across the governorate, especially in the West Line, the North West and the South West.
• Winterisation items were consistently among the top reported NFI needs, especially in the North Line and East Line. Winter clothes and shoes were reported as a top NFI need in nearly half of communities in both the North Line and the East Line. Heaters were a commonly reported need in the North Line, East Line and South West. Sources of heating fuel were most commonly reported as an NFI need in the West Line and South West.
• Disposable diapers were commonly listed as a top NFI need in all assessed areas except in the North Line. They were a particularly common need in the West Line where they were listed by 80% of KIs.
94%
63%52%
82% 78%
2%
33% 36%14% 17%12%
West line North line East line North West South West
Private generatorCommunity generatorsCar batteries
Figure 5: Estimated average daily hours of electricity available in the community, by % of KIs reporting)
Line Line Line
Line Line Line
Line Line Line

5
• Health was among the most commonly reported top priority needs across the governorate. In the West Line, KIs in 83% of communities reported that health was a top-three priority need, followed by 74% in North Line, and 64% in the East Line.
• The main healthcare needs varied between assessed areas. Chronic disease treatment was the most frequently reported health need in the West Line (88%) and the North Line (80%). The need for first aid emergency care was also reported by KIs in 80% of communities in the West Line. In the East Line, KIs in almost all communities (96%) reported that surgery was a priority healthcare need.
• All reported functional hospitals were located on the banks of the Euphrates river. As such there was a lack of hospitals in proximity to some major population centres, such as Sur.
• Challenges related to transportation were the most commonly reported barriers to accessing healthcare. The cost of transportation was most frequently reported as a barrier in the North Line, the
South West and the North West. The amount of time required to reach healthcare facilities was reported at similar rates across the governorate. The inability to afford healthcare services was reportedly most prevalent in North Line. Restrictions on movement were most frequently reported to be a barrier in the South West, the North West and the East Line.
Health
6) Source: SyriaLiveUAMap, 5 September 20187) KIs were allowed to select up to three options8) KIs were allowed to select up to three options
Map 6: Reported locations of functional hospitals• In the West Line and North Line KIs in less than 20% of communities reported that most or all
pregnant or lactating women were seeing medical professionals on a regular basis. In other areas, the majority of KIs reported that most or all pregnant or lactating women were seeing medical professionals, though KIs in between 33% and 40% of communities in these areas reported that only some were.
• The most commonly reported barrier to accessing healthcare for pregnant and lactating women was the lack of female medical professionals at facilities. The cost of services and the time required to reach facilities were also reported, especially in the North Line.
Figure 8: Most commonly reported barriers to accessing healthcare services for women, by % of communities8
Figure 7: Most commonly reported barriers to accessing healthcare services, by % of communities7
Cost of transportation
Time required to reach facilities
Cost of services
Restrictions on freedom of
movement
Lack of skilled medical
professionals
Lack of equipement or medication at
facilitiesNone
West line 44% 44% 17% 7% 76% 12% 2%North line 78% 52% 93% 11% 0% 0% 0%East line 40% 52% 56% 40% 40% 28% 4%
North West 75% 50% 43% 61% 11% 4% 7%South West 78% 50% 28% 72% 22% 6% 6%
Lack of female medical
professionals
Cost of transportation
Cost of services
Time required to reach facilities
Lack of skilled medical
professionals
Restrictions on freedom of movement
West line 95% 34% 10% 39% 61% 0%North line 22% 74% 96% 63% 0% 0%East line 100% 16% 60% 24% 28% 28%
North West 68% 68% 54% 43% 7% 21%South West 78% 67% 33% 50% 0% 28%
S U R
K I S REH
H A J IN
D E I R - E Z-ZOR
A B U K A MAL
TA B NI
T H I BAN
M U H A SAN
A L M AYADIN
B A S IRA
A S H ARA
J A L AA
S U S AT
K H A S HAM
AL-HASAKEHAR-RAQQA
IRAQ
Shiheil
Gharanij
Mhemideh
Abu Kamal
Abu Hamam
Al Mayadin
Deir-ez-Zor
Jdidet Bikara
Kisreh
Thiban
Basira
Jazaret Elbuhmeid
Reported locations of hospitals
Estimated population in individuals,including IDPs and HC members
175 - 5,000
5,001 - 25,000
25,001 - 153,500
Community name
Areas of influenceSeptember 2018
Government of Syria
Syrian Democratic Forces
ISIL
Contested Areas
56
West LineNorth LineEast Line
West LineNorth LineEast Line

6
24%
100%
52%
86% 89%
6%19%
68% 63%
70% 9%
14% 11%
17%
48%
48%
14% 31%
5%
72%7%
9%
9%6%
39%
6%26%
43%
9%
Westline
Northline
Eastline
NorthWest
SouthWest
Westline
Northline
Eastline
NorthWest
SouthWest
Host community IDPs
76% - 100% 51% - 75% 26% - 50% 0% - 25%
Education• Primary education was widely available across most assessed communities, with functioning
primary schools reported to be present in almost all communities in all areas except the East Line. In the East Line, only just over half of communities reported primary education being available.
• In both the North Line and East Line, KIs reported low rates of availability of intermediary education, compared to the South West, the North West and the West Line. Secondary education was rarely available across assessed communities, with reported facilities concentrated around larger cities.
Map 7: Highest level of education reported to be available in the community
S U R
K I S REH
H A J IN
D E I R - E Z-ZOR
A B U K A MAL
TA B NI
T H I BAN
M U H A SAN
A L M AYADIN
B A S IRA
A S H ARA
J A L AA
S U S AT
K H A S HAM
AL-HASAKEHAR-RAQQA
IRAQ
Estimated population in individuals,including IDPs and HC members
MARKER SIZEHighest level of education reported tobe available in the community
Secondary (16 - 18 years)
Intermediary (13 - 15 years)Primary (6 - 12 years)No education available
MARKER COLOUR
175 - 5,000
5,001 - 25,000
25,001 - 153,500
• The reported barriers to education varied between assessed areas. Children having to work was the most commonly reported barrier in the West Line, the South West, and the North West. The poor condition of facilities, as well as lack of availability of education suitable for students of a certain age were frequently reported as barriers in the North Line, and the East Line.
• Damage to school buildings was frequently reported across all assessed areas, but especially in the North Line, where 52% of KIs reported that at least one school in their community was closed due to building damage. In the East Line, KIs in 44% of communities reported that at least one school was closed because the buildings were used to host IDPs.
Figure 11: Most commonly reported barriers to accessing education, by % of communities9
Figure 10: Estimated primary school attendance rates for IDPs and host community children, by % of communities
• Estimated attendance rates were significantly lower for IDP children than for host community children across all areas. This applies most visibly to primary education in the West Line and the North Line, but a similar trend was observed across assessed areas at all levels of education.
Figure 9: Education services reported to be available in the community by % of communitiesPrimary (ages 6 - 12) Intermediary (ages 13 - 15) Secondary (ages 16 - 18)
West line 95% 68% 0%North line 100% 22% 7%East line 56% 12% 0%
North west 100% 93% 25%South west 100% 94% 17%
West line North line East line North west South west
1Children have to work
(82%)
Poor condition of facilities(78%)
No education for students of a certain age
(74% )
Children have to (61%)
Children have to work(67%)
2Lack of trained
teachers(62%)
No education for students of a certain age
(67% )
Poor condition of facilities(68%)
Poor condition of facilities(29%)
Customs (for example early marriage)
(50% )
3Poor condition of
facilities(41%)
Lack of trained teachers
(30%)
Children have to work(16%)
Customs (for example early marriage)
(29% )
Poor condition of facilities(22%)
9) KIs were allowed to select up to three options
West LineNorth LineEast Line
West Line North Line East Line North West South West
North WestEast Line
South West
Line Line Line Line Line Line
7
WASH
10) KIs were asked to select all that applied11) KIs were allowed to choose multiple options, as multiple sanitation situations may exist within a single ommunity. For example, a community may have a some IDPs who have access to private latrines inside their homes, while other IDPs in the same community use communal latrines.
S U R
K I S REH
H A J IN
D E I R - E Z-ZOR
A B U K A MAL
TA B NI
T H I BAN
M U H A SAN
A L M AYADIN
B A S IRA
A S H ARA
J A L AA
S U S AT
K H A S HAM
AL-HASAKEHAR-RAQQA
IRAQ
Estimated population in individuals,including IDPs and HC members
MARKER SIZEProportion of population estimated to haveenough water to cover their basic needs
Everyone or nearly everyone
More than half, but not everyoneAround half the populationOnly a few
MARKER COLOUR
175 - 5,000
5,001 - 25,000
25,001 - 153,500
54%
11% 4%
93% 100%
46%
89% 92%
7%4%
West line North line East line North West South West
Main water networkWater truckingBottled water
Bad taste Bad colour Bad smallCost of water
too highConsidered
unsafe to drinkWest line 98% 46% 59% 0% 0%North line 85% 100% 22% 41% 4%East line 92% 80% 52% 36% 4%
North West 96% 93% 71% 0% 0%South West 100% 94% 78% 0% 0%
Latrines: Showers:
Private inside home
Communal shared toilets
Outside in the open
Private inside home
Communal bathing
areas
Private space outside home
No showers available
West line 94% 19% 28% 94% 17% 3% 6%North line 100% 52% 0% 96% 33% 11% 0%East line 91% 70% 22% 91% 57% 4% 9%
North West 100% 0% 0% 100% 0% 0% 0%South West 100% 0% 0% 100% 0% 0% 0%
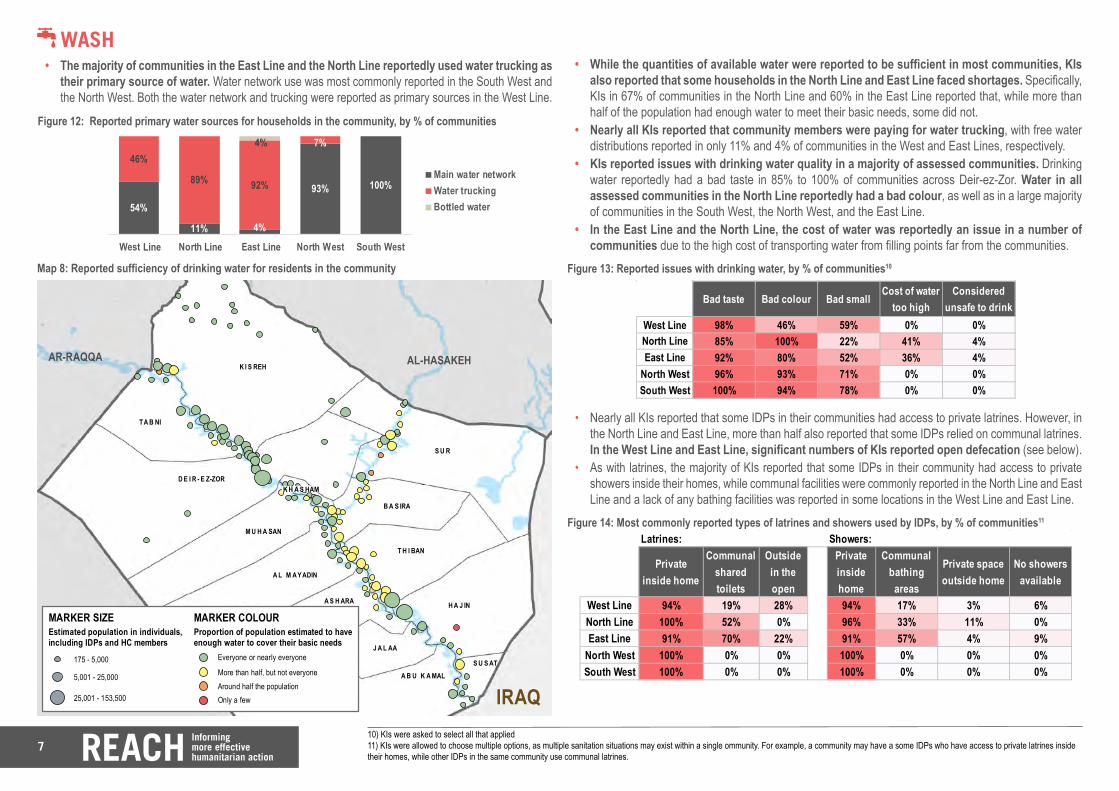
• The majority of communities in the East Line and the North Line reportedly used water trucking as their primary source of water. Water network use was most commonly reported in the South West and the North West. Both the water network and trucking were reported as primary sources in the West Line.
Map 8: Reported sufficiency of drinking water for residents in the community
• While the quantities of available water were reported to be sufficient in most communities, KIs also reported that some households in the North Line and East Line faced shortages. Specifically, KIs in 67% of communities in the North Line and 60% in the East Line reported that, while more than half of the population had enough water to meet their basic needs, some did not.
• Nearly all KIs reported that community members were paying for water trucking, with free water distributions reported in only 11% and 4% of communities in the West and East Lines, respectively.
• KIs reported issues with drinking water quality in a majority of assessed communities. Drinking water reportedly had a bad taste in 85% to 100% of communities across Deir-ez-Zor. Water in all assessed communities in the North Line reportedly had a bad colour, as well as in a large majority of communities in the South West, the North West, and the East Line.
• In the East Line and the North Line, the cost of water was reportedly an issue in a number of communities due to the high cost of transporting water from filling points far from the communities.
Figure 12: Reported primary water sources for households in the community, by % of communities
• Nearly all KIs reported that some IDPs in their communities had access to private latrines. However, in the North Line and East Line, more than half also reported that some IDPs relied on communal latrines. In the West Line and East Line, significant numbers of KIs reported open defecation (see below).
• As with latrines, the majority of KIs reported that some IDPs in their community had access to private showers inside their homes, while communal facilities were commonly reported in the North Line and East Line and a lack of any bathing facilities was reported in some locations in the West Line and East Line.
Figure 13: Reported issues with drinking water, by % of communities10
Figure 14: Most commonly reported types of latrines and showers used by IDPs, by % of communities11
West LineNorth LineEast Line
West LineNorth LineEast Line
LineLineLine

8
Confiscation of documents
Sniper fire or gunfire
Armed groups
AirstrikesMines or
unexploded ordnance
Domestic violence
Disputes between
residents
IEDs SVBIEDS BBIEDs
West line 3% 0% 0% 0% 0% 6% 6% 0%North line 0% 4% 0% 0% 0% 0% 0% 0%East line 9% 57% 48% 26% 22% 4% 0% 4%
North West 27% 0% 0% 9% 0% 0% 0% 0%South West 50% 0% 0% 6% 0% 0% 0% 0%
12) KIs were asked to select all that applied13) KIs were asked to select all that applied14) To save space, only the most commonly mentioned needs were listed in the table.15) KIs were asked to rank the top-three priority needs. The table shows the most commonly listed ones, regardless of ranking.
Protection Reported Priority Needs
NoneInsufficient
transportation
Transportation available but too expensive
Restrictions on movement
Lack of required
documentation
Safety security situation
West line 90% 0% 10% 7% 0% 0%North line 56% 4% 37% 0% 0% 4%East line 20% 4% 0% 40% 4% 64%
North West 43% 4% 57% 46% 0% 0%South West 33% 0% 67% 61% 0% 6%
West line North line East line North West South WestJobs and income
88% 89% 40% 68% 72%
Electricity 32% 52% 72% 86% 100%
Shelter rehabilitation
2% 0% 0% 4% 0%
Water 17% 74% 76% 61% 67%
Healthcare 83% 74% 64% 50% 50%
Education 78% 7% 32% 29% 6%
Clothing 0% 0% 8% 0% 0%
♗• Barriers to movement were most frequently reported in the East Line, by KIs in 81% of assessed
communities. This was followed by 67% of communities in the South West, 67% in the North West and 44% in the North Line. The lack of available transportation was most commonly reported in the South West, the North West, and the North Line. Restrictions of movements, usually due to the presence of checkpoints, were reported in the South West, the North West, and the East Line. Finally, safety and security risks were reported to be a common barrier to movement in the East Line.
• IDPs were most frequently reported to face protection risks in the East Line, where KIs in 93% of communities with IDPs reported the presence of one or more security or safety risks such as sniper fire, armed groups, and mines. IDPs were reportedly at risk of having their documentation confiscated in the South West, the North West and to a lesser extent in the East Line.
• KIs in 40% of communities in the East Line reported that women and girls were facing specific barriers to accessing services in their communities. The majority of these listed fear at checkpoints as the main barrier and specified that this particularly affected the ability of women and girls to access health care services.
Figure 16: Most commonly reported protection risks faced by IDPs, by % of communities13
Figure 15: Most commonly reported barriers to movement, by % of communities12
Figure 17: Most commonly reported top needs in the community, by % of communities14,15
• Overall, the most commonly reported top needs were income sources, healthcare, water, electricity and education. Other needs that were reported in some locations but not in others included shelter rehabilitation, food, civil documentation, and clothing.
• It should be noted figures on most commonly reported needs by KIs can only help provide an image of perceived priorities. The percentages listed below should not be interpreted as an indication of comparative severity of needs.
West LineNorth LineEast Line
North WestSouth West
West LineNorth LineEast Line
North WestSouth West
West Line North Line East Line North West South West

9
Livelihoods
S U R
K I S REH
H A J IN
D E I R - E Z-ZOR
A B U K A MAL
TA B NI
T H I BAN
M U H A SAN
A L M AYADIN
B A S IRA
A S H ARA
J A L AA
S U S AT
K H A S HAM
AL-HASAKEHAR-RAQQA
IRAQ
Employment with local authorities
Remittances Raising livestock Growing crops Trade and shops
West line 5% 80% 85% 88% 22%North line 30% 59% 44% 33% 96%East line 0% 88% 52% 84% 52%
North West 36% 29% 64% 82% 61%South West 11% 11% 67% 89% 72%
Need for irrigationLow profitability
of selling outputsPrice/availability
of equiptmentPrice/availability
of fertilizerPrice availability
of seedsWest line 15% 7% 54% 93% 61%North line 78% 22% 7% 48% 33%East line 44% 56% 28% 76% 32%
North West 14% 7% 54% 75% 54%South West 17% 11% 67% 94% 78%
16) Source: GIMMS MODIS NDVI Glocal Agricultural Monitoring System, NASA17) “NDVI [is a] value that, over time, can be averaged to establish the normal growing conditions for the vegetation in a given region for a given time of the year. Comparing this month’s or this year’s NDVI data with the 20-year average reveals whether the productivity in a given region is typical, or whether the plant growth is significantly more or less productive.” NASA Earth Observatory18) KIs were asked to rank the three primary sources of income for households in the community. The table shows the most commonly listed ones, regardless of ranking.19) FAO/WFP Crop and Food Security Assessment Mission to the Syrian Arab Republic, October 201820) KIs were allowed to select up to three options
• Growing crops was the most commonly reported source of income across all assessed areas of the governorate. KIs in between 82% and 89% of communities in the West Line, the East Line, the South West and the North West reported that this was a main income source. In these areas, the majority of crops grown were wheat and barley (86%), vegetables (75%), and cotton (68%). Farmers reportedy used to grow these same crops prior to the start of the conflict.
• In the North Line, KIs in only a third of communities reported that growing crops was a main income source, despite the area being highly dependent on agriculture historically. Households in 96% of communities reportedly relied on trading and shops. Remittances were reported in 59% of communities.
• Raising livestock, trading in shops, and remittances were overall commonly reported across all assessed areas. In the majority of communities where raising livestock was a top income source, the most commonly owned types were sheep, cattle, and chickens.
Map 9: Normalized Difference Vegetation Index (NDVI) values at the start of October, compared to the average of the same period in recent years16,17
• Overall, the most commonly reported barrier to crop cultivation was the affordability and availability of fertilisers. However, in the North Line, the most commonly reported barrier was the need for irrigation. This was reportedly related to water shortages in 81% of North Line communities where the need for irrigation was reported. However, in the East Line, damage to irrigation structures was the most commonly reported issue, followed by water shortages.
Figure 18: Primary sources of income in the community, by % of communties18
• Almost all KIs also reported that markets were functional with few or no shortages of key food items and that households were buying food in the markets. In all areas, more than 80% of KIs reported that households’ own production was also a common source of food.
Figure 20: Barriers to growing crops, by % of KIs reporting20
• Farmers in Deir-ez-Zor have experienced significant challenges during the past wheat and barley season (September 2017 to June 2018), and agricultural yields have been reported to be far lower than in any other recent year.19 One measure that shows the extent of this is the NDVI, which is a remotely sensed (satellite) index that captures the abundance and health of plants. Comparing this measure to an average of recent years reveals that cropland areas in Deir-ez-Zor were abnormally less green in both April and October 2018.
Figure 19: Timeline of NDVI values in cropland areas of Deir-ez-Zor governorate
West LineNorth LineEast Line
North WestSouth West
West LineNorth LineEast Line
North WestSouth West