north star landform and soil report
TRANSCRIPT

Report
North Star Landform and Soil Report
Environment
09 March 2011 NS-RP-EN-0004


North Star Landform and Soil Report Page 3 of 88
NS-RP-EN-0004_Rev 0
EXECUTIVE SUMMARY
Overview
Fortescue Metals Group Ltd (FMG) is proposing to undertake mine development activities at its North Star magnetite Project, located approximately 100 km south of Port Hedland and 25 km west of the FMG rail line. The Project will involve mining of ore using conventional open pit methods as well as construction of support infrastructure, including roads, a processing facility, rail load out areas, tailings storage facilities and an accommodation camp.
GHD was commissioned in August 2011 to undertake a landform and soil assessment of the Project area. The broad objectives of the assessment were to:
• Identify and describe key landforms within the Project area;
• assess potential impacts to landforms from mining operations;
• assess the suitability of potentially impacted soils for rehabilitation purposes; and
• provide supporting information for environmental approval and mine closure documentation.
Setting
The assessment area (North Star/Glacial Valley deposit and TSFs) is located within a highly dissected peneplain, characterised by a complex mosaic of geology and landforms. Dominating the site is the north-south strike ridge hosting the North Star and Glacial Valley deposits and the extensive valley units identified as potential TSF sites. Relief ranges from approximately 220 m to 420 m. The proposed ore transport corridor extends west from the southern extent of the mine area to the Port Headland – Newman rail line. The route traverses a series of ephemeral flow lines (including the Turner River), valleys, gentle plains, rises and low hills.
Methodology
A desktop review of Land Systems, geology and soil information as well as a review of Digital Elevation Model (DEM) imagery and aerial photography was undertaken prior to the field assessment. The landform and soil field assessment was conducted during the period 14-17 October 2011. The landform assessment involved site inspections of representative landform units within the project area in order to verify the results of the desktop assessment and to provide additional site information. The soil assessment involved characterising soil profiles within the assessment area. Unused drill pad sumps were utilised for subsoil characterisation where possible to minimise disturbance and expedite the test pit excavation program. Test pits were developed using an excavator at locations where unused sumps were not available. A hand auger was used where sampling sites were located outside of previously disturbed areas or inaccessible. Samples were collected and analysed for a range of geotechnical and geochemical parameters.
North Star Landform and Soil Report Page 4 of 88
NS-RP-EN-0004_Rev 0
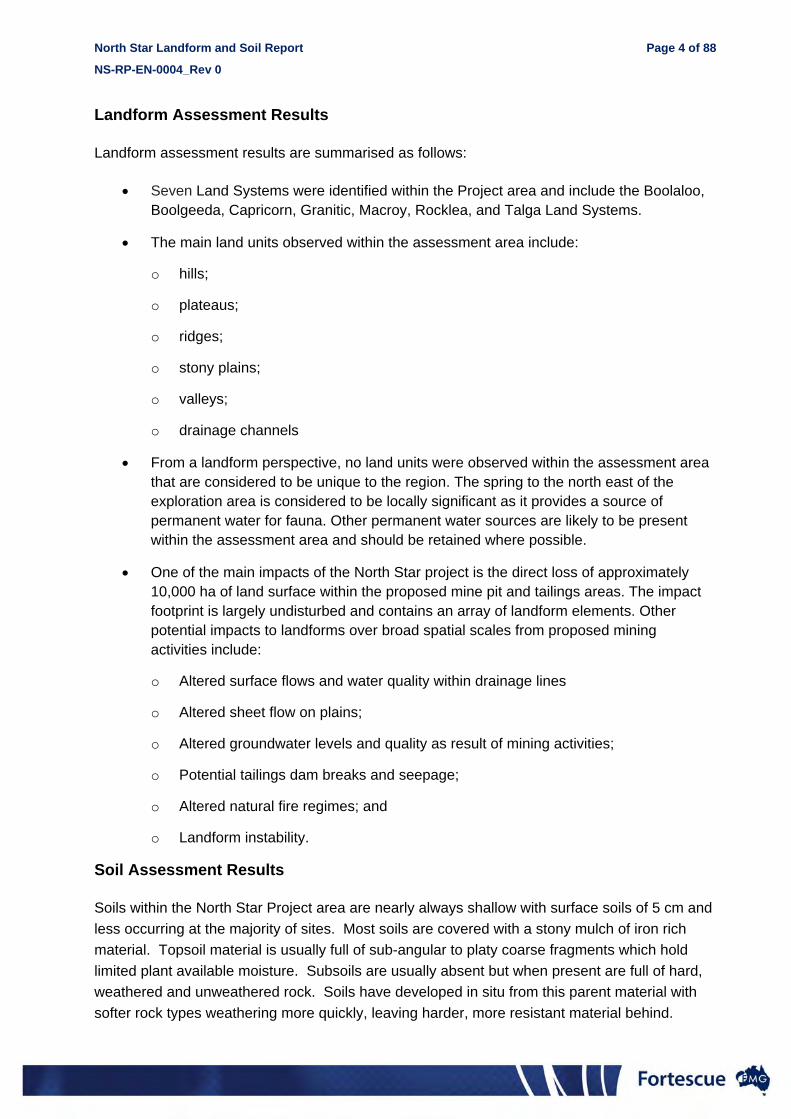
Landform Assessment Results
Landform assessment results are summarised as follows:
• Seven Land Systems were identified within the Project area and include the Boolaloo, Boolgeeda, Capricorn, Granitic, Macroy, Rocklea, and Talga Land Systems.
• The main land units observed within the assessment area include:
o hills;
o plateaus;
o ridges;
o stony plains;
o valleys;
o drainage channels
• From a landform perspective, no land units were observed within the assessment area that are considered to be unique to the region. The spring to the north east of the exploration area is considered to be locally significant as it provides a source of permanent water for fauna. Other permanent water sources are likely to be present within the assessment area and should be retained where possible.
• One of the main impacts of the North Star project is the direct loss of approximately 10,000 ha of land surface within the proposed mine pit and tailings areas. The impact footprint is largely undisturbed and contains an array of landform elements. Other potential impacts to landforms over broad spatial scales from proposed mining activities include:
o Altered surface flows and water quality within drainage lines
o Altered sheet flow on plains;
o Altered groundwater levels and quality as result of mining activities;
o Potential tailings dam breaks and seepage;
o Altered natural fire regimes; and
o Landform instability.
Soil Assessment Results
Soils within the North Star Project area are nearly always shallow with surface soils of 5 cm and less occurring at the majority of sites. Most soils are covered with a stony mulch of iron rich material. Topsoil material is usually full of sub-angular to platy coarse fragments which hold limited plant available moisture. Subsoils are usually absent but when present are full of hard, weathered and unweathered rock. Soils have developed in situ from this parent material with softer rock types weathering more quickly, leaving harder, more resistant material behind.

North Star Landform and Soil Report Page 5 of 88
NS-RP-EN-0004_Rev 0
Soil types identified within the project area include:
• Shallow red sandy clay loams soils developed on plateaus of sedimentary rock types;
• Skeletal red sandy loam and clay soils developed on sandstone and other mixed sedimentary rock types;
• Pale alluvial/colluvial soils on undulating rises;
• Shallow coarse sandy loams and clay loams developed on Goethite;
• Neutral to alkaline Soils on Rises of Valley plains; and
• Alkaline clays on igneous rocks.
The soils sampled within the assessment area are generally chemically and physically stable. Most pH values fall within a range that is suitable for plant growth and will not reduce the availability of nutrients to plants. The exception to this is site 6 which has a topsoil pH of 8.7. This pH may restrict plant growth. Electrical Conductivity (EC) values are low with correspondingly low levels of sodium and chloride.
Soil nutrient levels are generally very low, especially nitrate N. Cation Exchange Capacity (CEC) values are generally low due to the low levels of organic matter and clay content present. The low Exchangeable Sodium Percentage (ESP) coupled with moderate Ca/Mg ratios frequently being < 1, indicates that these soils are relatively stable and are only slightly dispersible. Furthermore, all sites apart from site 12, recorded a dispersion index of zero. The high sand content, low clay content and low organic carbon levels present at each site mean that the soil particles are not strongly aggregated and may rupture with energy input from rainfall events. These soils will disperse slightly when wet, but are unlikely to erode on battered slopes of suitable design and are likely to provide a good physical medium for plant growth.
Trace elements in most cases are at low levels, except manganese and iron. Heavy metals were present at high levels at some sites. Mobility of heavy metals will be investigated, independently of this assessment, as part of a geochemical waste study. Further testing is needed to determine whether or not these elements are potentially mobile.
The main rehabilitation constraint at North Star from a soil perspective is not the quality but the quantity of material available for rehabilitation. Soil auditing and careful planning will be essential to ensure this resource is used efficiency and effectively.

North Star Landform and Soil Report Page 6 of 88
NS-RP-EN-0004_Rev 0
TABLE OF CONTENTS
EXECUTIVE SUMMARY ............................................................................................................. 3
1. INTRODUCTION ............................................................................................................ 10
1.1 Background ....................................................................................................... 10
1.2 Assessment Area .............................................................................................. 10
1.3 Scope of Works ................................................................................................. 11
1.4 Project Description ........................................................................................... 11
2. METHODOLOGY ........................................................................................................... 12
2.1 Landform Assessment ..................................................................................... 12
2.1.1 Desktop Study ....................................................................................... 12
2.1.2 Field Assessment .................................................................................. 12
2.1.3 Terminology .......................................................................................... 12
2.2 Soil Assessment ............................................................................................... 13
2.2.1 Desktop Study ....................................................................................... 13
2.2.2 Field Assessment .................................................................................. 13
2.2.3 Laboratory Testing ................................................................................ 14
2.2.4 Nomenclature ........................................................................................ 15
2.3 Limitations ......................................................................................................... 15
3. ENVIRONMENTAL SETTING ........................................................................................ 16
3.1 Location ............................................................................................................. 16
3.2 Climate ............................................................................................................... 16
3.3 Phytogeography ................................................................................................ 17
3.4 Land Systems .................................................................................................... 17
3.5 Geology .............................................................................................................. 23
3.5.1 Regional ................................................................................................ 23
3.5.2 Local ...................................................................................................... 23
3.6 Soils .................................................................................................................... 24
3.6.1 Regional ................................................................................................ 24
3.6.2 Local ...................................................................................................... 24
3.7 Surface Hydrology ............................................................................................ 26

North Star Landform and Soil Report Page 7 of 88
NS-RP-EN-0004_Rev 0
3.7.1 Regional ................................................................................................ 26
3.7.2 Local ...................................................................................................... 26
3.8 Hydrogeology .................................................................................................... 27
3.8.1 Regional ................................................................................................ 27
3.8.2 Local ...................................................................................................... 27
3.9 Environmentally Sensitive Areas .................................................................... 28
3.10 Vegetation .......................................................................................................... 28
4. LANDFORM ASSESSMENT FINDINGS ....................................................................... 29
4.1 Dominant Landform Features .......................................................................... 29
4.1.1 North Star/Glacial Valley Plateau .......................................................... 29
4.1.2 West Star Plateau ................................................................................. 32
4.1.3 Proposed Tailings Storage Facilities ..................................................... 34
4.1.4 Other Infrastructure areas and Landform Features ............................... 36
4.2 Regional Significance of Assessment Area ................................................... 38
4.3 Potential Landform Impacts ............................................................................. 38
5. SOIL ASSESSMENT RESULTS .................................................................................... 42
5.1 Soil Profile Descriptions ................................................................................... 42
5.2 Soil Stability (Erosion) Assessment ................................................................ 47
5.3 Soil Chemical Assessment .............................................................................. 48
5.3.1 Soil pH ................................................................................................... 48
5.3.2 Electrical Conductivity ........................................................................... 49
5.3.3 Soil Nutrients ......................................................................................... 49
5.3.4 Organic Matter....................................................................................... 50
5.3.5 Exchange Capacity ............................................................................... 50
5.3.6 Exchangeable Sodium Percentage (ESP) ............................................ 51
5.3.7 Ca/Mg Ratio .......................................................................................... 51
5.3.8 Trace Elements ..................................................................................... 52
5.3.9 Heavy Metals ........................................................................................ 52
5.3.10 Potential Soil Physical Limitations ......................................................... 53
5.4 Soil Suitability Summary .................................................................................. 54
6. LANDFORM PRINCIPLES FOR REHABILITATION ..................................................... 58

North Star Landform and Soil Report Page 8 of 88
NS-RP-EN-0004_Rev 0
List of Tables Table 1: Land Systems within Assessment Area ......................................................... 19 Table 2: Additional Land Systems outside Assessment Area intersecting Proposed
Transport Corridor .......................................................................................... 21 Table 3: Soils Potentially Occurring in the Assessment Area based on Land System
Mapping by Payne A.L. in Van Vreeswyk et al. (2004) .................................. 25 Table 4: Potential Impacts and Management Strategies .............................................. 40 Table 5: Soil Types and Occurrence in Assessment Area ........................................... 43 Table 6: Topsoil Dispersion Percentage and Emerson Class Results for Selected
Sample Sites .................................................................................................. 48 Table 7: Optimal Ranges for Micronutrients (Baker and Eldershaw, 1993) ................. 52 Table 8: Soil Results Summary .................................................................................... 56
List of Plates Plate 1: North Star Plateau looking east. ..................................................................... 30 Plate 2: Prominent Escarpment of the North Star feature left of photo. West Star
feature visible to right. .................................................................................... 31 Plate 3: Stony mulch cover on North Star Plateau ...................................................... 31 Plate 4: BIF outcrop on Glacial Valley plateau. Dipping at approximately 70º. ............ 32 Plate 5: Western Slopes of the West Star plateau lacking the cliffed escarpment of
North Star ....................................................................................................... 33 Plate 6: Gently undulating summit of the Western Star plateau .................................. 33 Plate 7: Valley of Northern TSF ................................................................................... 35 Plate 8: Scree slope in foreground with eastern rim of northern TSF in background .. 35 Plate 9: Spring north east of Exploration Camp ........................................................... 37 Plate 10: Stony plain at proposed accommodation site ................................................. 37

North Star Landform and Soil Report Page 9 of 88
NS-RP-EN-0004_Rev 0
LIST OF FIGURES Figure 1: Assessment Area and Regional Locality Map ................................................ 65 Figure 2: Land System Mapping (1:500,000) ................................................................ 69 Figure 3: Land System Mapping of Assessment Area (1:60,000) ................................. 73 Figure 4: Pictorial Map of Landform Units ..................................................................... 77 Figure 5: Soils Profile ..................................................................................................... 81
LIST OF APPENDICES Appendix 1: Laboratory Results Appendix 2: Soil Test Pit Logs Appendix 3: Soil Dispersion Category Descriptions

North Star Landform and Soil Report Page 10 of 88
NS-RP-EN-0004_Rev 0
1. INTRODUCTION
1.1 Background
Fortescue Metals Group Ltd (FMG) is proposing to undertake mine development activities at its North Star magnetite Project, located approximately 100 km south of Port Hedland and 25 km west of the FMG rail line. The Project will involve mining of ore using conventional open pit methods as well as construction of support infrastructure, including roads, a processing facility, tailings storage facilities, waste rock dump, administration buildings and an accommodation camp. An infill drill drilling program is currently underway to increase the current stated resource of 312 Mt Indicated and 912 Mt Inferred.
GHD was commissioned in August 2011 to undertake a landform and soil assessment of the Project area. The broad objectives of the assessment were to:
• Identify and describe key landforms within the Project area;
• Assess potential impacts to landforms from mining operations;
• Assess the suitability of potentially impacted soils for rehabilitation purposes; and
• Provide supporting information for environmental approval and mine closure documentation.
1.2 Assessment Area
The landform and soil assessment area covers an area of some 220 km2 and encompasses the proposed mine outline and key supporting infrastructure areas (i.e. mine pit areas, tailings storage facilities, processing facility, and accommodation camp) as well as the Glacial Valley and West Star features. The assessment area does not include the proposed transport corridors to the west of the accommodation camp location. A map of the assessment area and its regional location is provided in Figure 1.
The northern extent of the assessment area lies to the north of the main access track running from the Great Northern Highway to the exploration camp. The eastern extent intersects the low hills and stony plains of the Rocklea land system east of the proposed tailings storage facility. The southern perimeter passes immediately to the south of the Glacial Valley feature and the western extent lies immediately west of the proposed accommodation camp.
The assessment area is a highly eroded peneplain, comprising of a mosaic of variable landforms. Relief ranges from approximately 220m to 420m. A prominent strike plateau hosting the North Star and Glacial Valley deposits runs centrally along the project area in a north south direction. The two proposed tailings storage facilities (herein referred to as TSF north and TSF south) are situated to the north and east of the North Star plateau. The processing plant and accommodation village are situated to the west of the North Star feature. Apart from the

North Star Landform and Soil Report Page 11 of 88
NS-RP-EN-0004_Rev 0
exploration camp and current and historical exploration activities, the site is undeveloped. Lost Boys Creek, which is a tributary of the Turner River, meanders in a north-west direction within the northern extent of the assessment area.
1.3 Scope of Works
This landform and soil assessment has been prepared according to the scope of works requested by FMG in Request for Tender documentation dated 6 July 2011 and involved both desktop and field assessments. The desktop assessment included:
• A review of any available information on the existing environment, topography, soils, geology, hydrogeology, hydrology and flora and fauna;
• A review of topographic, geological and environmental constraints mapping;
• A review of completed baseline environmental surveys and available soil investigations; and
• A review of Land Systems mapping and associated geomorphological characteristics.
The field assessment was undertaken to verify the findings of the desktop investigation and assist with identifying and describing the landform units and soils present within the project area.
The methodology adopted to complete the scope of works is provided in Section 2.
1.4 Project Description
The North Star magnetite project has a proposed mine life of 25 years and the resource is estimated at 1.23 billion tonnes. The magnetite is in the form of Banded Iron Formation (BIF) and is a member of the Pincunah Formation, one of several BIF units located within the Pilbara Craton. The BIF at this site has a north-south orientation, is of uniform composition and varies in depth from 350 m to 450 m. The resource is approximately 8.1 km long and located along an elevated ridge (80 -120 m high) forming the catchment divide between the Shaw, Turner and Strelley Rivers.
Mining will involve conventional open pit mining techniques, including drill and blast followed by load and haul. Proposed mine infrastructure consists of mine pits, a processing plant, waste dumps, ore stockpiles, tailings facilities and supporting infrastructure. The proposed tailings storage facility, with a total capacity of 709 Mt, has been designed to take advantage of the natural topography and will be constructed from predominantly waste rock fill sourced from mining operations. Water supply for the construction phase will be sourced from the existing bores within the FMG rail corridor to the west. Water for the operational phase will be sourced from the proposed borefield location within the Canning Basin.

North Star Landform and Soil Report Page 12 of 88
NS-RP-EN-0004_Rev 0
2. METHODOLOGY
2.1 Landform Assessment
2.1.1 Desktop Study
A desktop review of Land Systems and landforms at a regional scale was undertaken prior to the field assessment. Landform units within the project area were delineated utilising aerial photography and Digital Elevation Model (DEM) imagery.
2.1.2 Field Assessment
The landform field investigation was conducted during the period 14 - 17 October 2011 and involved site inspections of representative landform units within the project area in order to verify the results of the desktop assessment and to provide additional site information. The following information was recorded:
• Landform unit;
• Location;
• Size of landform/extent;
• Topography;
• Vegetation; and
• Surface soil characteristics.
The landform investigation focused on the proposed mine pit areas and associated infrastructure. Site inspection locations were selected to achieve adequate landform and spatial representation within the assessment area.
2.1.3 Terminology
Terminology used in this report for the characterisation of landform attributes follows that specified by the National Committee on Soil and Terrain (2009) and Van Vreeswyk, A.M.E., A.L. Payne, K.A. Leighton and P. Hennig (2004).The former was used where a discrepancy exists between the two.

North Star Landform and Soil Report Page 13 of 88
NS-RP-EN-0004_Rev 0
2.2 Soil Assessment
2.2.1 Desktop Study
Geology, land system, soil, contour and aerial photo mapping was reviewed prior to the field survey to identify areas of interest and to determine representative test pit locations within the assessment area. The number of site locations was determined following consideration of the complexity of land units within each land-system. Footprints of areas likely to be disturbed such as pits, waste dumps, tailings storage areas and other potential infrastructure sites were studied more intensively than their surrounds. Sites with similar attributes (e.g. height and slope geometry) to reconstructed landforms were selected as reference sites for collection of baseline data.
2.2.2 Field Assessment
The soil field survey was conducted in conjunction with the landform assessment during the period 14-17 October 2011.
Test pits locations were confirmed following a reconnaissance of site conditions at each location. Unused drill pad sumps were utilised for subsoil characterisation where possible to minimise disturbance. Test pits were developed using an excavator at locations where unused sumps were not available. A hand auger was used where sampling sites were located outside of previously disturbed or inaccessible areas.
Site information recorded at each test pit location included:
• GPS location (Eastings and Northings);
• Landform pattern and element;
• Microrelief;
• Geology/lithology; and
• Disturbance
Soils at each site were described in terms of their horizons and soil formation processes. Soil morphological features recorded at each site included:
• Colour;
• Texture;
• Structure; and
• Consistency

North Star Landform and Soil Report Page 14 of 88
NS-RP-EN-0004_Rev 0
Soils were also described in terms of their general attributes such as rockiness, pH, ERD (effective rooting depth) and moisture holding ability (obtained by field texture).
Samples were collected at each test pit site within both the topsoil and subsoil. Two subsoil samples were taken where the depth of the subsoil profile was greater than or equal to 1 m. Samples were analysed for both their chemical and physical properties to assess the soil’s suitability as a stable cover for constructed landforms and as a medium for plant growth (refer Section 2.2.3).
2.2.3 Laboratory Testing
Geotechnical Analysis
A programme of laboratory testing was undertaken to assess the engineering properties of the soils and to assess their potential as cover and construction material. Tests were carried out in accordance with current Australian Standards (AS 1289) and included the following:
• Emerson’s Class Number; and
• Percent Dispersion.
Atterberg limits (ASTM 2010) and modified compaction testing was not carried out due to the amount of coarse fragments present and the lack of clay in the profiles at each site. The testing was carried out by Trilab, a National Association of Testing Authority (NATA) accredited laboratory located in Perth, Western Australia.
Geochemical Analysis
All samples from the test pit sites (topsoil and subsoil) were submitted to CSBP Soil and Plant Laboratories located at Bibra Lake, Western Australia for the following suite of analyses:
• pH (1:5 H2O and 1:5 CaCl2)
• Electrical Conductivity (1:5 H2O)
• Total Plant available nutrients
• Organic Carbon
• Exchangeable Cations (Ca, Mg, K, Na)
• Nitrate and Ammonium Nitrogen
• Phosphorus
• Trace elements
• Exchangeable Sodium Percentage (ESP)
• Heavy Metals
North Star Landform and Soil Report Page 15 of 88
NS-RP-EN-0004_Rev 0
• Dispersion Index
2.2.4 Nomenclature
Soils were described in the field according to the Australian Soil and Land Survey Field Handbook (National Committee on Soil and Terrain 2009).
2.3 Limitations
The following limitations were encountered during the assessment:
• Test pit locations able to be mechanically excavated were restricted to previously disturbed areas. A hand auger was used to describe and sample the soil at undisturbed sites.
• Available soil mapping was conducted at a scale of 1:2,000,000 (Northcote 1968). This scale was of limited use in delineating and characterising soils in the field. Land system mapping at 1:250,000 was used as a surrogate.

North Star Landform and Soil Report Page 16 of 88
NS-RP-EN-0004_Rev 0
3. ENVIRONMENTAL SETTING
3.1 Location
The assessment area (herein referred to as the ‘Project area’) is situated within the north-central Pilbara region, approximately 100 km south of Port Hedland and 25 km east of the Port Hedland to Newman railway line. The Project area encompasses FMG Mining tenements M45/1180, M45/1181, M45/1182, M45/1183, M45/1184, M45/1211, M451212, M45 1213, Miscellaneous Licence tenement L45/276 and Exploration tenements E45/2510 and E45/3084.
The mine area (North Star/Glacial Valley deposit and TSFs) is located within a highly dissected peneplain, characterised by a complex mosaic of geology and landforms. Dominating the site is the north-south strike ridge hosting the North Star and Glacial Valley deposits and the extensive valley units identified as potential TSF sites. Relief ranges from approximately 220 m to 420 m. The proposed ore transport corridor extends west from the southern extent of the mine area to the FMG rail line. The route traverses a series of ephemeral flow lines (including the Turner River), valleys, gentle plains, rises and low hills.
A number of local prospects and potential mining operations surround the project area. No mines are currently operational within the immediate vicinity of the site. The nearest Department of Environment and Conservation estate is Munagaroona Range Nature Reserve (Reserve No 31429) which lies approximately 72 km to the south west of the Project area.
3.2 Climate
The Pilbara Region of Western Australia experiences an arid-tropical climate with two distinct seasons; a hot summer from October to April and a mild winter from May to September (Gentilli 1972). Annual evaporation exceeds rainfall by as much as 2,500 mm per year. Seasonally low but unreliable rainfall, together with high temperatures and high diurnal temperature variations are also characteristic climatic features of the region. This region has in the past experienced no rainfall in any month of the year, which is typical of a desert climate (Beard 1975).
The majority of the Pilbara has a bimodal rainfall distribution, resulting in two rainfall maxima per year. From January to March, rain results from storms penetrating from the north, producing sporadic and intense thunderstorms. Tropical cyclones and depressions moving southwards from northern Australian waters also cause heavy rainfall events. From May to June cold fronts move easterly across Western Australia and may occasionally reach the Pilbara Region. These fronts produce light winter rains that are generally ineffective for extensive plant growth. Surface water can be found in some pools and springs in the Pilbara Region all year round, although watercourses are generally ephemeral, drying up for at least part of each year (DoW 2008).

North Star Landform and Soil Report Page 17 of 88
NS-RP-EN-0004_Rev 0
The closest official Bureau of Meteorology (BOM) weather recording station (now closed) was at Yandee, where climate data is available for records between 1971 and 1982 (BOM 2011). Recorded climatic data is summarised below:
• Mean Daily Maximum Temperature: 41 °C (Dec) – 26.0 °C (June)
• Mean Daily Minimum Temperature: 24.8 °C (Jan) – 10.8 °C (July)
• Annual Rainfall: 311.6 mm
• Mean Annual Rain Days: 29.7 days
3.3 Phytogeography
The assessment area is located within the Chichester subregion of the Pilbara biogeographic region as delineated under the Interim Biogeographic Regionalisation for Australia (IBRA) system. IBRA is a national planning framework in which 85 biogeographic regions and 403 sub-regions have been established to assist in setting reservation targets across the entire Australian landscape. Each bioregion is a geographically distinct area of land with common characteristics such as geology, landform patterns, climate, vegetation and fauna (Thackway and Cresswell 1995). Sub-regions were defined on the basis of major geomorphological features within each bioregion.
The Chichester subregion (PIL 1) is summarised as consisting largely of undulating granite and basalt plains with significant areas of basalt ranges. The plains are described as typically supporting a shrub steppe of Acacia inaequilatera over Triodia wiseana hummock grasslands with tree steppes of Eucalyptus leucophloia dominating the ranges (Kendrick and McKenzie 2001).
3.4 Land Systems
Land systems comprise common land units with recurring patterns of landform, soil and vegetation associations. Van Vreeswyk et al. (2004) mapped a total of 102 Land Systems within the Pilbara region following an inventory and condition survey of the region from 1995 to 1999. Delineating and mapping Land Systems was undertaken utilising aerial photography and desktop biophysical information. Descriptions were compiled using field data gathered during landscape traverses and inventory site visits.
Seven Land Systems were identified within the assessment area and include the Boolaloo, Boolgeeda, Capricorn, Granitic, Macroy, Rocklea, and Talga Land Systems. The biophysical characteristics of these Land Systems (as described by Van Vreeswyk et al. 2004) and their representation within the assessment area and the broader Pilbara region is provided in Table 1. Land systems mapped for the broader area (1:500,000) as well as the assessment area (1:60,000) are shown in Figure 2 and Figure 3 respectively.

North Star Landform and Soil Report Page 18 of 88
NS-RP-EN-0004_Rev 0
The proposed infrastructure corridor to the west of the assessment area intersects the Rocklea, Talga, Macroy, River and Boolaloo Land Systems and passes within 500 m of the Robe Land System. A description of the River and Robe Land Systems in provided in in Table 2. The remaining land systems occur within the assessment area and are described in Table 1.

North Star Landform and Soil Assessment Page 19 of 88
NS-RP-EN-0004_Rev 0 Rport
Table 1: Land Systems within Assessment Area
Land System Land System Photograph System Description (Source: Van Vreeswyk et al. 2004)
Geology Approximate Coverage of Assessment Area
Approximate Coverage of Pilbara Survey Area
Area (km²)
% Total Area (km²) % Total
Boolaloo Erosional surfaces; granite hills with boulder strewn slopes, tor heaps and bare domes surrounded by restricted stony and sandy plains; widely spaced tributary drainage patterns of narrow drainage floors and channels. Relief mostly less than 50 m.
Achaean granite and gneiss, minor Quaternary sand
0.15 0.6 1,502 0.8
Boolgeeda Predominantly depositional surfaces; very gently inclined stony slopes and plains below hill systems becoming almost level further downslope; closely spaced, dendritic and sub-parallel drainage lines. Relief up to about 20 m. Supports hard and soft spinifex grasslands and mulga shrublands.
Quaternary colluvium 5.19 2.3 7,748 4.3

North Star Landform and Soil Report Page 20 of 88
NS-RP-EN-0004_Rev 0
Land System Land System Photograph System Description (Source: Van
Vreeswyk et al. 2004) Geology Approximate
Coverage of Assessment Area
Approximate Coverage of Pilbara Survey Area
Capricorn
Erosional surfaces; ranges and hills, restricted stony lower plains and valleys; moderately spaced tributary drainage patterns. Relief up to 180 m. Supports shrubby hard and soft spinifex grasslands.
Lower Proterozoic sandstone, greywacke, dolomite and shale
115 52.1 5,296 2.9
Granitic
Erosional surfaces; hill tracts and domes on granitic rocks with rough crests, associated rocky hill slopes, restricted lower stony plains; narrow, widely spaced tributary drainage drainage floors and channels. Relief up to 100 m.
Achaean and Proterozoic granite, gneiss, granodiorite and porphyry
10 4.4 4,020 2.2
Macroy
Erosional surfaces; gently undulating stony plains and interfluves with quartz surface mantles, sandy surfaced plains, minor calcrete plains, closely spaced tributary drainage lines in upper parts, wider downslope; minor granite hills, tor fields and quartz ridges. Relief up to 25 m. Supports hard and soft spinifex grasslands.
Achaean granite and granodiorite; Quaternary alluvium, colluvium and minor alluvium.
10 4.6 13,095 7.2

North Star Landform and Soil Report Page 21 of 88
NS-RP-EN-0004_Rev 0
Land System Land System Photograph System Description (Source: Van
Vreeswyk et al. 2004) Geology Approximate
Coverage of Assessment Area
Approximate Coverage of Pilbara Survey Area
Rocklea
Erosional surfaces; ridges and plateaux remnants on basalt with steep stony slopes, restricted lower slopes, stony interfluves and minor gilgai plains, moderately spaced tributary drainage patterns of small channels in shallow valleys in upper parts becoming broader floors and channels downslope. Relief up to 110 m. Supporting hard spinifex (and occasionally soft spinifex) grasslands.
Achaean basalt, Lower Proterozoic basalt, dolerite, tuff and agglomerate, minor shale and jaspilite
53 23.7 22,993 12.7
Talga
Erosional surfaces; hill tracts and ridges on basalt, greenstones, schist, other metamorphics and chert with rocky rounded crests and ridge tops extending for many kilometres, very steep upper slopes, more gently inclined lower footslopes, restricted lower stony plains and interfluves; moderately spaced tributary and strike aligned drainage floors and channels. Relief to 100 m. Supports hard and soft spinifex grasslands.
Achaean basic volcanics, ultramafic rocks and other metamorphics.
27 12.3 2,124 1.2
Table 2: Additional Land Systems outside Assessment Area intersecting Proposed Transport Corridor

North Star Landform and Soil Report Page 22 of 88
NS-RP-EN-0004_Rev 0
Land System Land System Photograph System Description (Source: Van Vreeswyk et al. 2004)
Geology Approximate Coverage of the Pilbara Survey Area1
Area (km²) % Total
River
Flood plains and river terraces subject to fairly regular overbank flooding, sandy banks and poorly defined levees and cobble plains. Supports grassy eucalypt woodlands, tussock grasslands and soft spinifex grasslands.
Quaternary alluvium 4,088 2.3
Robe
Erosional surfaces; formed by partial dissection of old Tertiary surfaces, dissected plateaux and long lines of low mesas along present and past river valleys, indented breakaway faces, limonite outcrop and pisolitic gravelly mantles, restricted lower slopes; closely to moderately spaced narrow tributary drainage floors. Relief up to 50 m. Supporting hard spinifex (and occasionally soft spinifex) grasslands.
Tertiary pisolitic limonite and laterite.
865 0.5
1 From Van Vreeswyk et al. (2004)

North Star Landform and Soil Assessment Page 23 of 88
NS-RP-EN-0004_Rev 0 Rport 3.5 Geology
3.5.1 Regional
The assessment area lies within the Pilbara Craton, a Pre Cambrian tectonic unit comprising granitic, sedimentary and volcanic rocks (Hickman 1983). Geology is dominated by the ancient granite-greenstone terrane, occurring as broad expanses of granitoid rocks interspersed with arcuate and linear belts of greenstone formations (Van Vreeswyk et al. 2004).
Magnetite mineralisation in the North Star area is mainly confined to the Banded Iron Formation (BIF), a member of the Pincunah Formation. The thickness of BIF varies from 350 to over 450 m, forming a flat-topped north-south strike ridge about 500–800 m wide and 80–120 m high. The strata dips at approximately 80o west and 70o east. Apart from common small scale folding, there is little large scale folding. There are a number of faults in the BIF roughly parallel to the strike. Partially oxidised outcrop of the lower BIF yields magnetic susceptibility measurements of 1000 to 10 000 x 105 with isolated highs up to 30 000 x 105 SI units.
Current knowledge indicates that the Pincunah BIF extends to a minimum depth of 300 m and remains open at depth. It is highly likely that the same thickness of magnetite ore extends below 300 m depth and the potential volume of ore available is only constrained by the economics of mining.
The western sequence (footwall) of the BIF is a sequence of poorly exposed shales up to 500 m thick. The contact between the shales and BIF forms a prominent cliff which is likely to be sheared and faulted. This unit forms the lower part of the Pincunah Formation.
The eastern sequence (hanging wall) of the BIF comprises interbedded shales, mudstones, cherts, BIF and quartzite beds, each typically 1–20 m thick. This unit comprises the upper part of the Pincunah Formation.
3.5.2 Local
Magnetite mineralisation at North Star occurs within the BIF member of the Pincunah Formation. The BIF has been divided into the following units based on physical and geochemical characteristics2:
• Unit 1: Top 30–50 m of the BIF below ground surface where magnetite has been oxidised to hematite and goethite is a major mineral. There is no evidence of economic concentrations of hematite ore at or near surface in the oxide zone.
• Unit 2: This is the main magnetite ore at North Star. The unit is dipping vertically.
• Unit 3: This vertically dipping unit lies to the east of the central Unit 2 BIF. This BIF unit has variable magnetic susceptibility and high Na2O than the surrounding units.
2 Raw data supplied by Fortescue.

North Star Landform and Soil Report Page 24 of 88
NS-RP-EN-0004_Rev 0
• Unit 4: This vertically dipping unit lies to the east of the central Unit 2 BIF. This BIF has
variable magnetic susceptibility and shale content.
• Unit 5: This unit only occurs in the southern area of North Star and it is distinguished by its red colour from the abundance of jasper.
3.6 Soils
3.6.1 Regional
More than a third of the Pilbara consists of rugged, hills, ranges and plateaus occurring mostly in the central and southern parts. The oldest landscapes within the region occur in the central eastern area and consist of extensive gently undulating granitic plains, tor fields, drainage tracts and occasional low greenstone hills. Soils on this terrain are mostly red shallow sands. The hills give way to broad gently sloping plains with red sandy earths, deep red sands and loamy red earths (Van Vreeswyk et al. 2004).
Most of the soil types within areas of higher relief have considerable quantities of stone throughout the soil profile and often possess a stony surface mantle with rock outcrop. Less dominant soils include red shallow loams with some shallow red sands. Calcareous shallow loams are mostly common on hills based on Basalt, and shallow red/brown non-cracking clays occur as isolated pockets of soils within the hill systems and within hill valleys. Soils become deeper downslope from the ranges. In these areas, the dominant soils are stony surfaced red loamy earths with some areas of deep red/brown non-cracking clay. The lowest landscape units have self-mulching cracking clays with areas of deep red/brown non-cracking clays or red deep loamy surface texture contrast soils (Van Vreeswyk et al. 2004).
Hills and mesas on the eastern margins of the Pilbara region have stony soils and calcrete dominated areas primarily have calcareous shallow loams. The stony plains below the hill systems have red loamy earths and give way further downslope to deep red/brown non-cracking clays.
Soils within the Fortescue Basin which is situated between the Hamersley Plateau and the Chichester Range are predominantly alluvial soils deposited in large fans.
Soils of the granitic terrane and granite hills are typically red shallow sands. Adjacent plains are characterised by red sandy earths, red deep sands and red loamy earths (Van Vreeswyk. et al. 2004).
3.6.2 Local
Soil mapping at a local scale within the North Star Project area is extremely limited. At the time of this assessment, land system mapping at a scale of 1:250,000 (Van Vreeswyk et al. 2004) was the best available data set for soils within the area. Soil types identified as potentially

North Star Landform and Soil Report Page 25 of 88
NS-RP-EN-0004_Rev 0
occurring within the area based on soil descriptions provided for Land Systems mapped within the assessment area provided in Table 3.
Table 3: Soils Potentially Occurring in the Assessment Area based on Land System Mapping by Payne A.L. in Van Vreeswyk et al. (2004)
Land System Soils
Boolaloo • Hills, tor heaps and hill slopes – Bare rock, stony soils and red shallow sands
• Sandy plains – Red deep sands
• Stony plains - Red shallow sands
• Tracts receiving run-on – Red shallow sands
• Narrow drainage floors and channels – Red sandy earths. Channels with river bed soils
Boolgeeda • Low hills and rises – Stony soils and red shallow loams
• Stony slopes and upper plains – Red shallow loams or red loamy earths
• Stony lower plains – Red loamy earths
• Groves – Red loamy earths
• Narrow drainage floors and channels – Red loamy earths and minor self-mulching cracking clays. Channels with river bed soils
Capricorn • Ridges, hills and upper slopes – Stony soils
• Lower footslopes – Red shallow loams
• Stony plains – Red shallow sands and red shallow loams
• Narrow drainage floors and channels – River bed soils
Granitic • Hills, ridges, domes and upper slopes – Stony soils, red shallow sands and bare rock
• Lower slopes – Red shallow sands
• Stony plains – Red shallow sands and red loamy earths
• Narrow drainage floors and channels – Red shallow sands and shallow river bed soils in channels
• Drainage foci - Red shallow sands
Macroy • Low hills and ridges – Stony soils and red shallow loams
• Stony plains and interfluves – Red shallow sands, red sandy earths, red shallow sandy duplex soils and red shallow loams
• Sandy plains – Red deep sandy duplex, red shallow sandy duplex, red sandy earths and red deep sand
• Calcrete plains – Calcareous shallow loams and red deep sandy duplex soils

North Star Landform and Soil Report Page 26 of 88
NS-RP-EN-0004_Rev 0
Land System Soils
• Drainage floors and channels – Red sandy earths, red deep sands, red deep sandy duplex soils and red loamy earths. Channels of river bed soils
Rocklea • Hills, ridges, plateaux and upper slopes – Stony soils, red shallow loams and calcareous shallow loams
• Lower slopes – Red shallow loams and red shallow sandy duplex soils
• Stony plains and interfluves – Calcareous shallow loams, red sandy earths and shallow red/brown non-cracking clays
• Gilgai plains – Self-mulching cracking clays
• Upper drainage lines – Red shallow sands and calcareous sallow loams. Channels with river bed soils
• Drainage floors and channels – Red loamy earths with red shallow sandy duplex soils and red/brown non-cracking clays
Talga • Hills and ridges – Stony soils and some calcareous shallow loams
• Lower footslopes – Calcareous shallow loams and red shallow loams
• Stony plains – Red shallow loams and minor calcareous shallow loams
• Drainage floors and channels – Red, deep sandy duplex soils. Channels with river bed soils
3.7 Surface Hydrology
3.7.1 Regional
Watercourses in the Pilbara Region are ephemeral and flow only occasionally. Major rainfall events, generally as a result of cyclones, can cause major flows in a number of rivers almost every year between December and April. The rivers are generally dry between August and November, with only occasional short-lived flows. Most of the major rivers in the Pilbara Region have extensive floodplains that periodically become inundated. Surface water may be found in some pools and springs in the Pilbara region all year round.
3.7.2 Local
The assessment area straddles the Shaw River, Turner River and Strelley River catchments. The North Star/Glacial Valley plateau acts as the principle drainage divide between the Turner River to the west, Shaw River to the south east and Strelley River to the north east. All three river systems generally drain in a northerly direction towards the coast. Drainage on lower slopes and plains is via a network of tributary flowlines. Drainage on the hills and slopes is variable but tends to be via unidirectional flowlines. Sheet flow is also likely to occur on level to gently sloping plains following heavy rainfall events. A prominent drainage line, known as Lost

North Star Landform and Soil Report Page 27 of 88
NS-RP-EN-0004_Rev 0
Boys Creek flows in a north west direction through the valley of the proposed northern TSF, eventually discharging into Turners Creek. Drainage along the proposed rail corridor is largely defined by an unnamed drainage channel which meanders in a westerly direction across the plains of the Rocklea, Talga and Macroy Land Systems. All drainage lines within the assessment area are ephemeral.
A permanent spring was observed approximately 6 km north west of the North Star exploration camp (MGA Zone 50: 718573E, 7655491). Water seepage from fractured geology may also provide permanent sources of water within the assessment area.
3.8 Hydrogeology
3.8.1 Regional
The central Pilbara aquifers fall into three broad groups and include the unconsolidated sedimentary aquifers composed of alluvium and colluvium, chemically deposited aquifers (calcrete and pisolitic limonite) and fracture rock aquifers. Valley fill deposits can be up to 200m thick including clay, sand and gravel sequences sourced from alluvial outwash, river valleys and scree slopes. Calcrete and pisolitic aquifers, characterised by Karstic formations are capable of large groundwater yields in the region of 1500 kL/day to 5000 kL/day. The granitic-greenstone area of the Pilbara region generally lacks groundwater resources with the most dominant groundwater feature found in the Hamersley basin located to the south of the proposed operation. Groundwater in these calcrete or pisolite valley-fill aquifers is generally fresh or brackish and is the most easily obtainable groundwater source.
The Achaean granite-greenstone, characteristic of the proposed mine site, is generally overlain by thin alluvial sediments in the river valleys. Depth to water is generally 5 to 10 m below the surface in the granitic areas. Groundwater from exploration bores at the site varies between 36 m and 280 m confirming expectation of deeper groundwater levels in the greenstone formations. Major greenstone aquifers are located within Quartz veins and chert layers and is fresh inland to brackish as they approach the coast. Aquifer yields are dependent on intersecting fractures and or targeting shallow alluvium. The Pilbara and in particular the granitic-greenstone terrane is not considered a major regional groundwater resource (Van Vreeswyk et al. 2004).
3.8.2 Local
FMG drill log data indicates an average water level (mAHD) of approximately 80 m, based on provisional data from 72 bores, 30 of which indicated the presence of groundwater. The potentiometric surface suggests groundwater flows in a north-easterly direction towards the Shaw River.

North Star Landform and Soil Report Page 28 of 88
NS-RP-EN-0004_Rev 0
3.9 Environmentally Sensitive Areas
The Department of Environment and Conservation’s (DEC) online Native Vegetation Viewer provides information on the location of ESAs, as declared by a Notice under section 51B of the Environmental Protection Act 1986 (EP Act). This database also indicate areas where low impact mineral and petroleum activities cannot occur without a Native Vegetation Clearing Permit, as defined under Schedule One of the Environmental Protection (Clearing of native Vegetation) Regulations 2004.
The DEC’s online Native Vegetation Viewer was searched to determine the location of any ESA’s within the vicinity of the assessment area. No ESAs were identified (Department of Environment and Conservation 2010).
3.10 Vegetation
The vegetation of the Pilbara region was mapped by Beard as part of the Western Australian mapping project conducted from 1964 to 1981 (Beard 1990). The vegetation associations recorded within the assessment area include:
• Vegetation Association 82: Hummock grasslands, low tree steppe; snappy gum over Triodia wiseana; and
• Vegetation Association 93: Hummock grasslands, shrub steppe; kanji over soft spinifex.
GHD understands that Ecologia Environment recently completed a vegetation and flora survey of the assessment area. The associated report and findings were not available at the time of writing this report.

North Star Landform and Soil Report Page 29 of 88
NS-RP-EN-0004_Rev 0
4. LANDFORM ASSESSMENT FINDINGS
4.1 Dominant Landform Features
The assessment area lies largely within a highly eroded peneplain. Remnants of the ancient peneplain surface now exist as plateaus, hills and ridges within the landscape. Geology is also complex resulting in a high degree of heterogeneity within landform elements.
The main land units observed within the assessment area include:
• hills;
• plateaus;
• ridges;
• stony plains;
• valleys;
• drainage channels
A summary of key landforms present within proposed mine and infrastructure areas is provided below. A pictorial map of representative landforms within the assessment area is provided in Figure 4.
4.1.1 North Star/Glacial Valley Plateau
Numerous hills, plateaus and ridges exist within the project area. The ore body is primarily situated beneath the North Star/Glacial Valley plateau and West Star plateau. Both plateaus are orientated in a north-south direction with the northern extent of each ridge sweeping in an arc to the north west. This pattern of orientation is repeated across adjacent landform features and may be indicative of former rotational/twisting forces acting on the broader land unit.
The North Star/Glacial Valley feature extends over a length of some 10 km and ranges in height (local relief) from approximately 80 to 120 m. The ridge top is characterised by a gently undulating plateau varying in width from 500 to 1000 m. The western margin of the North Star plateau is abruptly defined by a cliffed to precipitous upper slope of rock outcrop (escarpment), approximately 15 – 30 m in height. Remaining upper slopes are moderately inclined to very steep with abundant scree material present. The lack of an escarpment on the eastern margin of the feature may be a reflection of the less resistant eastern shale sequence which lies to the east of the harder BIF unit. Mid-slopes are generally concave with maximal convex lower slopes (20-30 %). The eastern extent of the plateau grades into a series of ridges low hills ranging in height from 40-60 m.

North Star Landform and Soil Report Page 30 of 88
NS-RP-EN-0004_Rev 0
Soils on the plateau and slopes are fairly uniform and typically consist of shallow red/brown fine sandy clay loams. The surface substrate was dominated by a stony mantle of sub-angular to platy coarse ironstone fragments (up to 95 % cover), with rock outcrop comprising the remainder of the substrate. Drainage is via shallow flowlines which often converge at the crest forming deep to moderately deep incised gullies. Flowlines emanating from the northern extent of the plateau drain towards Lost Boys Creek. Flowlines from the central and southern parts drain into unnamed creeks to the east and west of the feature. Vegetation on the plateau is dominated by hummock grassland of Eucalyptus leucophloia and Corymbia hamersleyana over Acacia inaequilatera, A. acradenia, A. orthocarpa and A. ptychophyylla over Triodia ? wiseana. A. tumida var. pilbarensis and A. adoxa var adoxa are often dominant within minor flowlines present; however, species composition is largely similar to adjacent areas. This is likely to be a reflection of the prevailing dry soil conditions within flowlines. The limited additional water available to plants following short duration flow events often results in denser vegetation cover rather significant changes in species composition.
Plate 1: North Star Plateau looking east.
Surface of ancient peneplain visible at rear of photo.

North Star Landform and Soil Report Page 31 of 88
NS-RP-EN-0004_Rev 0
Plate 2: Prominent Escarpment of the North Star feature left of photo. West Star feature visible to right.
Plate 3: Stony mulch cover on North Star Plateau
.

North Star Landform and Soil Report Page 32 of 88
NS-RP-EN-0004_Rev 0
Plate 4: BIF outcrop on Glacial Valley plateau. Dipping at approximately 70º.
4.1.2 West Star Plateau
The West Star feature lies approximately 500 m west of the North Star plateau. It is similar in height and orientation to the North Star feature but is shorter in length (approximately 3.5 km) and width (200 – 500 m). The plateau surface is gently undulating but lacks the prominent cliffed escarpment of North Star. The upper slopes are typically very steep with rock outcrop dominant. Mid-slopes are generally concave with maximal convex lower slopes (20-30 %). Soils on the West Star plateau are typically shallow red-brown sandy clay loams with a stony mulch surface cover. Outcropping of goethite parent material was observed across the summit. Drainage is generally convergent on the plateau; however, flow lines and gullies are typically less pronounced than those of the North Star feature. Drainage on the slopes is closely spaced and unidirectional. Vegetation assemblages were similar to North Star.

North Star Landform and Soil Report Page 33 of 88
NS-RP-EN-0004_Rev 0
Plate 5: Western Slopes of the West Star plateau lacking the cliffed escarpment of North Star
Plate 6: Gently undulating summit of the Western Star plateau
North Star Landform and Soil Report Page 34 of 88
NS-RP-EN-0004_Rev 0
4.1.3 Proposed Tailings Storage Facilities
The proposed tailings storage facilities (TSFs) are situated within two broad valley units of the Capricorn system. The northern TSF valley is bounded by an extensive near vertical escarpment to the north (relief of 90-140 m) and a series of closely spaced low hills, hills and ridges to the south. The valley also contains considerable internal relief (up to 80 m) with rises, low hills, ridges and mesas prevalent within the broader unit. Ridges and mesas were typically steep sided with upper concave scree slopes ranging from 30-60 %. A prominent mesa is situated adjacent to the main access track through the northern TSF (refer Plate 7). The mesa stands at approximately 80m tall, is flat topped and possesses a hard ironstone capping (approximately 5-7 m depth) with leached, softer material below. Slopes are steep and covered in scree material. Side slopes have much reduced lower slope length. Ridges present are characterised by narrow crests and short adjoining slopes. Low hills (40 – 70 m) and rises (9 – 30 m) were moderately inclined with average slope angles generally less than 20 %. Crests of low hills are generally rounded, although rocky outcrops are not uncommon. Mid to upper slopes are convex with waning concave lower slopes. Slope lengths typically ranged from 100-130 m. A rock mulch is present on all slopes and crests (95 % cover). Material typically consists of sub-angular gravels and cobbles (10-20 cm). Gently undulating stony plains and tributary drainage channels comprise the lower parts of the valley surface. The valley floor of the northern TSF falls gradually to the west with an overall slope of approximately 1.5 %.
Vegetation within minor flowlines is typically an open woodland of Eucalyptus victrix, Corymbia hamersleyana over Acacia tumida var. pilbarensis, A. bivenosa, A. acradenia and Gossypium sp. over Triodia spp. The main channel, known as Lost Boys Creek, meanders along the valley floor, flowing to the north west and eventually discharging into Turners Creek. Lost Boys Creek is approximately 20-30 m wide with outer terraces subject to flooding during heavy rainfall events.
Soils on the stony plains are variable, ranging from loamy sands to light medium clays. Associated vegetation is generally an open low woodland of Corymbia hamersleyana over Grevillea wickhamii and Acacia bivenosa over Triodia spp.
The southern TSF valley is bounded to the west by the North Star plateau and a series of interrupted ridge lines, low hills and hills to the east. A narrow ridge running in a north east/south west direction dissects the proposed TSF site. A valley approximately 350 m wide lies immediately east of this ridgeline. A drainage channel at the base of the valley flows through a steep sided gorge in the adjacent eastern ridge and drains to the stony plains of the Rocklea system. The western extent of the southern TSF is heavily dissected and dominated by a series of ridges and low hills with similar attributes to those within the northern TSF.

North Star Landform and Soil Report Page 35 of 88
NS-RP-EN-0004_Rev 0
Plate 7: Valley of Northern TSF
Low hills and rises in mid ground and prominent mesa with lateritic capping in background
Plate 8: Scree slope in foreground with eastern rim of northern TSF in background

North Star Landform and Soil Report Page 36 of 88
NS-RP-EN-0004_Rev 0
4.1.4 Other Infrastructure areas and Landform Features
The proposed process plant site is situated on stony plains, rises and low hills. The stony plains present are gently undulating with a surface cover of fine ironstone segregations. Soils at the site are primarily alluvial with some colluvial material present. A number of flow lines draining from the adjacent hills intersect the proposed process plant site. These flowlines respond quickly to rainfall producing short duration flow events. Sheetflow would also be conveyed across the plains during rainfall events.
The accommodation village site is situated on a gently undulating stony plain, falling gradually to the south (1-2 % slope). Soils are primarily sandy loams of alluvial origin. The site is situated between two upper drainage lines receiving runoff from the adjacent hills. Both channels meander in a westerly direction before eventually draining into Turners Creek. Sheetflow is also likely to be conveyed across the plains during rainfall events.
Water from a spring was observed flowing along a drainage channel within a deeply incised gorge, approximately 6 km north west of the exploration camp. The spring surfaces within a rock pool at the base of a rock bench and flows down the channel for approximately 150 m before returning underground. The associated drainage channel heads in an easterly direction for approximately 20km before discharging into the Strelley River. This surface expression of groundwater provides a permanent source of water for a range of fauna and should be maintained. The vegetation of the surrounding area appears typical of most Pilbara features that support permanent water.
Other features within the study area that provide a source of permanent water should also be maintained where possible. Hydrological studies should be undertaken to investigate the impact of any dewatering on associated aquifers.

North Star Landform and Soil Report Page 37 of 88
NS-RP-EN-0004_Rev 0
Plate 9: Spring north east of Exploration Camp
Plate 10: Stony plain at proposed accommodation site

North Star Landform and Soil Report Page 38 of 88
NS-RP-EN-0004_Rev 0
4.2 Regional Significance of Assessment Area
The proposed mining and infrastructure support areas are primarily located within the Capricorn, Rocklea and Talga Land Systems. On a broad scale, all are reasonably well represented with each comprising greater than 1 % (1817 km2) of the Pilbara land mass (refer Figure 2 and Figure 3). Furthermore, all of the above Land Systems are relatively widespread in the Pilbara region, with none restricted to the local area.
The majority of the proposed disturbance footprint lies within the Capricorn land system. This system comprises 2.9 % of the Pilbara region and occurs in relatively large tracts from west of Pannawonica to east of Marble Bar. Vegetation within the system is typically in excellent condition due to the ruggedness of the terrain and the lack of grazing by livestock.
From a landform perspective, no land units were observed within the assessment area that are considered to be unique to the region. The spring to the north east of the exploration area is considered to be locally significant as it provides a source of permanent water for fauna. The assessment area forms a very small component of the Turner River, Shelley River and Shaw River catchments and is, therefore, not considered regionally significant from a surface hydrology perspective.
Data from baseline biological surveys was unavailable at the time of writing this report; however, such studies may identify other land units of local significance based on ecological communities present.
4.3 Potential Landform Impacts
Proposed mining activities will result in a number of impacts to land units within the receiving environment. Cumulative effects of impacts from other proposed mining operations within the local area may also be sufficient to initiate broader scale landscape degradation.
One of the main potential impacts of the North Star project is the direct loss of approximately 10,000 ha of land surface within the proposed mine pit and tailings areas. The impact footprint is largely undisturbed and contains an array of landform elements. Other potential impacts to landforms over broad spatial scales from proposed mining activities include:
• Altered surface flows and water quality within drainage lines
• Altered sheet flow on plains;
• Altered groundwater levels and quality as result of mining activities;
• Tailings dam breaks, seepage, Acid and Metalliferous Drainage (AMD);
• Altered natural fire regimes;
• Landform instability; and

North Star Landform and Soil Report Page 39 of 88
NS-RP-EN-0004_Rev 0
• Revegetation failure.
• Strategies for managing impacts should incorporate the following general principles:
• consider impacts at a broad landscape level (i.e. beyond the immediate project boundaries);
• engage relevant stakeholders from government, industry and community groups;
• recognise geomorphological processes influencing landform development and function;
• maintain ecological integrity in preference to restoration (i.e. limit the disturbance footprint); and
• be adaptive and allow for change as a result of monitoring and feedback.
Further detail of potential impacts and suggested management strategies is provided in Table 4.

North Star Landform and Soil Report Page 40 of 88
NS-RP-EN-0004_Rev 0 Rport Table 4: Potential Impacts and Management Strategies
Description Management Strategy
Loss of landform Direct loss of considerable land surface area (21.7km2 plus support infrastructure and waste rock dump areas) from mining activity within the Project area
Minimise the footprint of disturbance
Altered surface flows and water quality in drainage lines
Indicative mine and infrastructure outlines intersect a number of drainage channels, including Lost Boys Creek and an unnamed creek to the south that runs adjacent to the infrastructure corridor. A considerable portion of Lost Boys Creek and its catchment will be consumed by the northern TSF. Downstream vegetation health may be impacted. Ground disturbance, diversions, embankments and dewater discharge may also have an impact on water quality and vegetation within and beyond the project area.
Manage through approved surface water management study
Altered sheet flow on plains Changes to downslope vegetation health from disruptions to surface flow from road/rail formations and other excavations. Sheetflow sensitive vegetation communities were not apparent during the site visit. Review results of vegetation and flora report to assess presence.
Manage through an approved surface water management plan
Altered groundwater levels and quality
Groundwater drawdown from bore extraction resulting in potential impacts to facultative phreatophytes (i.e. partial groundwater dependent species). The proposed borefield is well beyond the assessment area and any potential drawdown will not affect vegetation within the assessment area.
Depth to groundwater within the mine area (based on limited sampling) varies from approximately 36 – 280 m Groundwater mounding may occur if reinjection of dewater is undertaken.
Manage impacts through an approved groundwater operating strategy
Groundwater modelling to assess potential mounding, drawdown
Monitor vegetation health within potential impact zone
TSF associated impacts Dam breaks and groundwater mounding from TSF seepage may impact land units over broad areas.
Manage through TSF management plan
Monitor vegetation health within potential impact zone

North Star Landform and Soil Report Page 41 of 88
NS-RP-EN-0004_Rev 0
Description Management Strategy
Revegetation failure Revegetation failures are commonly attributed to:
• hostile waste materials
• undesirable physical, chemical and biological properties of surface materials and/or poor
• lack of water infiltration and availability
• slope design – berms and bench designs prone to structural breakdown from erosion (rills and tunnelling)
• lack of scientific knowledge
• single prescription approach - lack of experimental/trial work to build information base
• climatic influences
• inadequate resourcing
Prepare a soil management and rehabilitation plan that incorporates adaptive management as a fundamental principle
Identify and fill information gaps
Undertake progressive rehabilitation with ongoing operational trials to refine approach
Surface instability Increased erosion through vegetation removal, mining activities and infrastructure construction.
Minimise disturbance footprint at design stage
Undertake progressive rehabilitation throughout the life of mine
Consider landform principles (Section 6) for rehabilitation at planning and design stages
Increased incidence of anthropogenic fire
Fire is a natural feature of the Western Australian landscape; however, altered fire regimes can result in changes to vegetation composition. Fires can also exacerbate erosion and weed invasion. Whilst the majority of fires may be attributed to natural causes (lightning), increased human activity from mining operations may result in increased fire frequencies.
Employee and contractor education
Manage through an approved Fire Management Plan

North Star Landform and Soil Report Page 42 of 88
NS-RP-EN-0004_Rev 0 Rport 5. SOIL ASSESSMENT RESULTS
5.1 Soil Profile Descriptions
Soils within the North Star Project area are nearly always shallow with surface soils of 5 cm and less occurring at the majority of sites (See Figure 5). Most soils are covered with a stony mulch of iron rich material. This stony mantle, although appearing as inhospitable medium for plant growth, is a key reason why the landforms that they occupy remain stable and relatively free of soil erosion. Most topsoil material contains a high percentage of sub-angular to platy coarse fragments which hold limited plant available moisture. Subsoils are usually absent but when present contains a high percentage of hard, weathered and unweathered rock. Soils have developed in situ from this parent material with softer rock types weathering more quickly, leaving harder, more resistant material behind. Geology of the North Star assessment area is complex with folding and faulting occurring within geological sequences. In some areas, metamorphic processes have occurred making some rock types hard and resistant to weathering. Due to the hardness and age of the various lithologies on-site, soil types are less likely to be influenced by the nature of the parent material. Sedimentary rocks of various lithologies and igneous intrusive rocks have all to some extent been mineralised forming rocks rich in silica and iron regardless of original geology type. Therefore, soil types have been differentiated based on intrinsic morphological characteristics such as soil depth, colour, texture, pH and other soil attributes. Due to the relatively impoverished nature of the soils at North Star, soil chemistry is less important to rehabilitation than the physical health of the soil.
Soil sampling sites were chosen in areas where ore bodies will potentially be mined and where tailings facilities may be located. All sites were located within the Capricorn Land System which was predominantly made up of a land unit consisting of the plateaus of North Star, West Star and Glacial Valley and the two valleys making up the tailings facilities to the north and east of North Star plateau. Soils on areas of high relief were skeletal whilst soils in the valleys were deeper but still had relatively shallow profiles. The key factor behind the predominance of shallow soils at North Star is that nearly all landforms are undergoing active erosion with very few depositional areas within the landscape.
Residual landscapes are a feature of the landforms and soils at North Star. Clay material has been broken down over time leaving compounds rich in iron, aluminium and silica. Due to the fact that these compounds have relatively low nutrient holding capacities, nutrients may be required to stimulate rehabilitation. It is the physical properties of the soils that need to be preserved whilst stockpiled. Additions of lime, organic matter and perhaps clay will bolster soil physical properties as will the incorporation of soil microbes and fungi.

North Star Landform and Soil Report Page 43 of 88
NS-RP-EN-0004_Rev 0 Rport Table 5: Soil Types and Occurrence in Assessment Area
Soil Type (ASC)3 Soil Profile Photograph Description Occurrence in Assessment Area
Tenosols
Shallow red sandy clay loams soils developed on plateaus of sedimentary rock types.
Key characteristics:
• Red/brown sandy clay loam;
• Surface stony mulch;
• Full of iron rich coarse fragments;
• Highly permeable, well drained;
• Low in plant available nutrients; and
• Ca/Mg ratio > 1
Tenosols occupy the plateaus of higher relief. These soils are common within the Capricorn Land System and have shallow topsoils with minimal pedological organisation. Subsoils if present are only weakly developed. These soils are always covered with a stony mulch of iron rich material. Rock outcrops are not uncommon. Parent material of fine white sandstone is partially weathered with some fines occupying spaces between coarse fragments. These soils are low in clay as it has weathered to final products of gibbsite and goethite. Due to low clay levels, these soils have relatively low Cation Exchange Capacities (CECs). Soil macro-nutrients are at low to moderate levels whilst zinc and copper are also at low levels. pH is acidic whilst ECs are at low levels.
Sites 1 and 2 and 12. These soils are found on the upper slopes and crests of the hills and plateaus within North and West Star.
3 (ASC) – The Australian Soil Classification

North Star Landform and Soil Report Page 44 of 88
NS-RP-EN-0004_Rev 0
Soil Type (ASC)3 Soil Profile Photograph Description Occurrence in Assessment Area
Tenosols
Skeletal red sandy loam and clay soils developed on mixed sedimentary rocks.
Key characteristics:
• Red/brown sandy loams and clays; • Occupy low hills and ridge lines; • Extremely shallow A horizon; • No B horizons present; • Parent material of mixed shales, sandstones, and
mudstones; and • Acid topsoil with low EC values.
Site 3, 6 and 11.
These soils are found on the mid and upper slopes of the Low Hills and Ridge-lines of North Star and Glacial Valley. These soils are also found on the lower slopes of Low Hills within the Northern Tailings Facility.
Rudosols/Kandosols
Pale alluvial/colluvial soils on undulating rises.
Key Characteristics:
• Pale brown stony topsoil; • Darker red stony subsoil; • Single grained structure; • Loose topsoil condition; • Acid soil reaction trend; • Moderately permeable with moderately rapid drainage;
and • Neutral pH
Pale red alluvial/colluvial soils with 20-50% coarse fragments. Stony mulch present on surface. Fine coarse fragments down to 20 cm.
These soils occupy the valley plains and gently undulating rises below the North and West Star landforms. These soils have developed in-situ but have also been influenced by alluvial geomorphic processes. These soils represent areas of aggradation which are rare within the North Star Site.

North Star Landform and Soil Report Page 45 of 88
NS-RP-EN-0004_Rev 0
Soil Type (ASC)3 Soil Profile Photograph Description Occurrence in Assessment Area
Tenosols
Shallow coarse sandy loams and clay loams Developed on Goethite.
Key Characteristics:
• Red/brown sandy and clay loams;
• Relatively friable consistency;
• Acid to mildly alkaline soil reaction trend;
• Stony mulch present on surface; and
• Coarse fragments throughout the profile.
These soils are moderately permeable and well drained, red oxidised soils with parent material encountered at 25-40 cm. These soils have weakly developed A horizons over decomposing parent material high in iron. These soils occupy hill slopes and hill crests within low hills of the Capricorn Land System. These soils have low EC
Site 5 and Site 10
These soils are loamy and have developed from softer parent material and possess topsoil and subsoil horizons with gravel sized coarse fragments. These soils are not as rocky and hard as their counterparts.
These soils are found on hill crests and hill slopes of hills and low hills occupying West Star and Glacial Valley.
Tenosols/Rudosols
Neutral to alkaline Soils on Rises of Valley plains.
Key Characteristics:
• Neutral to alkaline soil reaction trend;
• Parent material of sandstone and silicified igneous rocks;
• Stony mulch on surface;
• Shallow topsoils over rocky decomposing parent material and hard rock;
• Low CEC;
• Hardsetting surface soils; and
• Soils formed on rises within narrow valley plains
Shallow, red surface soils over pale sandstones and light blue siliceous material. Low Plant Available Water
Site 7 and site 9.
Loamy sands developed in Valley plains and rises within the northern and southern tailings facilities. Parent material is hard and resistant to weathering.

North Star Landform and Soil Report Page 46 of 88
NS-RP-EN-0004_Rev 0
Soil Type (ASC)3 Soil Profile Photograph Description Occurrence in Assessment Area
Content (PAWC). Low EC. Erosional landform within tailings valleys.
Rudosols
Alkaline clays on igneous rocks.
Key Characteristics:
• Alkaline soil reaction trend;
• Shallow topsoil over hard igneous rock;
• Superior nutrient levels derived from intermediate to basic parent material;
• Stony mulch on surface of soil;
• Coarse fragments throughout topsoil; and
• Light medium clay texture.
Shallow rudimentary soil profile with limited profile differentiation. Alkaline pH suggesting higher CEC than most soils. Slowly permeable due to rock in subsoil. High levels of runoff. Moderately well drained.
Site 8
These soils are located along a line of igneous rock outcrop, occurring in the valley of the northern tailings facility. This formation could be a dyke of a mafic rock type. These soils are shallow, high in clay and posses higher CEC.
Other intrusive rock types of this nature are found within other areas of the North Star Site.

North Star Landform and Soil Report Page 47 of 88
NS-RP-EN-0004_Rev 0 Rport 5.2 Soil Stability (Erosion) Assessment
Selected soil samples were analysed for their stability with regard to their potential to disperse during rainfall events. Two types of tests were carried out on the topsoil samples collected from North Star. These tests included:
• Dispersion percentage (%)
• Emerson Dispersion Class
Sherrad et. al. (1976) recommends undertaking multiple tests where possible to assess dispersion. Due to the high levels of coarse fragments and lack of clay fines in most samples only the 2 above tests were able to be undertaken. Soil dispersion potential is the likelihood that soils will release a cloud of fine clay particles when brought into contact with water. The dispersion percentage is calculated by measuring the difference between complete dispersion simulated by using a dispersive chemical and the degree of natural dispersion which occurs in water. The difference between these two values is multiplied by 100 to achieve a percent dispersion (Baker and Eldershaw 1993). Emerson Dispersion Class numbers were also obtained for the topsoil at each selected site. This test involves the placement of a ped of soil into a petri dish of water and studying the behaviour of this aggregate over time. If the ped disperses into a cloud of colloidal material relatively quickly the soil is considered to be dispersive. The rate and extent of this process determines how dispersive the medium is (Hazelton and Murphy 2007).
Overall, topsoils sampled within the assessment area are considered to be relatively stable and suitable as a rehabilitation resource. Dispersion Percentage and Emerson Class results for selected topsoil samples are provided in Figure 4. A description of Dispersion % and Emerson Class categories is provided in Appendix C.

North Star Landform and Soil Report Page 48 of 88
NS-RP-EN-0004_Rev 0
Table 6: Topsoil Dispersion Percentage and Emerson Class Results for Selected Sample Sites
Site Number Dispersion (%) Emerson Class (Topsoil) Overall Evaluation
2 31 5 Non to slightly dispersive
5 40 5 Non to slightly dispersive
6 59 5 Non to slightly dispersive
7 26 5 Non to slightly dispersive
9 25 5 Non to slightly dispersive
12 0 5 Non to slightly dispersive
Non to slightly dispersive
Moderately dispersive
Highly dispersive
Interpretation of Figure 4 suggests that the Emerson Classes for all sites indicate that the soil material is only slightly dispersive for all selected sites. Dispersion percentages indicate that site 12 is not dispersive and that sites 2, 5, 6, 7, and 9 are only slightly dispersive. All the sites sampled had an overall rating of non to slightly dispersive.
5.3 Soil Chemical Assessment
Laboratory results from soil analyses undertaken by CSBP are tabulated in Appendix A. The results of the soil tests are summarised below:
5.3.1 Soil pH
Soil pH provides a measure of soil acidity and is typically measured in water or 0.1 M CaCl2
(Hazelton and Murphy 2007). The latter is considered to more closely reflect concentrations with the natural soil solution; however, both measures are generally considered when assessing suitable conditions for plant growth.
The pH (H2O) is moderately acid to neutral (5.7–6.9) in the topsoils of sites 1–4 and sites 9–12. However, sites 5-8 have a topsoil pH (H2O) of mildly alkaline to strongly alkaline (7.5–8.7). The subsoils of each site (0.3–1.0 m) have a pH range from neutral to moderately alkaline with values ranging from 6.6 to 8.0.
The alkaline value at site 8 is high at 8.7. This pH may be caustic to roots and may limit the availability of some nutrients to plants. All other sites have subsoils suitable for most plant species and should not affect the availability of nutrients within the profile. Where the subsoil

North Star Landform and Soil Report Page 49 of 88
NS-RP-EN-0004_Rev 0
has a pH greater than 8.0 phosphorus and some trace elements such as boron may be less available to plants. Such results are not uncommon in the region and soil pH is likely to be suitable for plant re-establishment if local species tolerant of alkaline soils are used for rehabilitation.
5.3.2 Electrical Conductivity
Electrical conductivity (EC) indicates the amount of soluble (salt) ions in soil or water. EC is typically categorised according to soil texture and is the most common measure of soil salinity. High salinity levels can adversely impact on plant growth through osmosis. Plant roots are unable to uptake water due to high levels of salt in the soil solution. The threshold EC value for plant growth is 1.2 dS/m. EC values for all sites at all depths were generally low, indicating that salt levels were also low within the profile. EC values ranged from less than 0.010 dS/m at site 9 to 0.163 dS/m at site 5.
Given that sodium chloride (NaCl) is a major salt compound contributing to conductivity, it is not surprising that sodium chloride levels were also low in the profile. Chloride levels (Cl) did not exceed 170 mg/kg, whilst exchangeable sodium levels were also low, not exceeding 0.51 meq/100g. Other salt types, such as carbonates, sulphates and potassium which also conduct electricity are also at low levels.
5.3.3 Soil Nutrients
Nitrogen (N), phosphorus (P), potassium (K) and sulfur (S) are the key macronutrients for plant growth and are largely derived from the soil and organic matter. Approximate values that may be considered typical for arid zone soils include nitrate and phosphorus values between 5-10 mg/kg, potassium values between 150-200 mg/kg and <100mg/kg sulphur (GHD, 2010).
Levels of nitrate (i.e. plant available N) recorded from soils within the assessment area ranged from <1–5 mg/kg. Less than 8 mg/kg is considered to be low. However, nitrate can be readily applied to these soils to boost plant production.
Phosphorus levels ranged from <2–24 mg/kg in the topsoil and <2 mg/kg in the subsoil. Less than 5 mg/kg is considered low for phosphorus levels. Only topsoils within sites 2, 8, 10, 11 and 12 have P above this level. All soils in the area would respond well to P amelioration. It is important to note, however, that excessive addition of P can result in P toxicity. Williams and Pratt (2008) reported that total plant biomass of native Western Australian Goldfields plants increased with increased addition of P up to 15 mg/kg but total plant biomass remained constant or decreased at higher concentrations.
Potassium levels in the topsoil ranged from 75–179 mg/kg. Subsoil K levels ranged between 22–131 mg/kg. Levels of 100–300 mg/kg are considered optimal for K. In areas where the soil has <100 mg/kg additions of K fertiliser would be beneficial.

North Star Landform and Soil Report Page 50 of 88
NS-RP-EN-0004_Rev 0
Levels of sulphate (S) throughout the site were at very low levels. Topsoil and subsoil S values range between 1.1 and 13.8 mg/kg with most values below 2.0 mg/kg. These values are comparatively low compared to the optimal range of 20–50 mg/kg. The addition of sulphate, such as elemental sulphur fertilisers during rehabilitation will provide a positive plant growth response.
5.3.4 Organic Matter
Organic matter is directly derived from plants and animals and is an important factor influencing many physical, chemical and biological soil characteristics. Its key functions include increasing plant available water, supporting organisms in the soil, buffering pH and improving the structural stability and nutrient levels of soils (Hazelton and Murphy, 2007). Organic carbon at all 12 sites was at very low levels of 0.11–0.99%. The optimal OC range is 2–3%. Due to low OC levels, these soils will have poor structure, be more prone to hardsetting and will have reduced permeability’s due to the lack of stable soil aggregates and pore space for the movement of soil-water. Addition of organic matter would be beneficial for soil structure as well as improving levels of biological microorganisms needed for improved soil health.
5.3.5 Exchange Capacity
Cation exchange capacity (CEC) is a measure of a soil’s capacity to hold and exchangeable cation nutrients. It affects the buffering capacity of a soil, nutrient availability, calcium levels and soil stability (Hazelton and Murphy, 2007). A low CEC value indicates that the soil has a low resistance to soil chemistry changes resulting from land disturbance (Hazelton and Murphy, 2007).
CEC is commonly approximated by calculating the effective CEC. A figure of less than 6 meq/100g is considered to be very low. Sites 1, 2, 4, and 9–12 have values below 6 meq/100g. Sites 3, and 5–8 have CEC higher than this threshold with site 8 having the highest value of just above 15 meq/100g. The high CEC at site 8 is reflected in the high clay content at this site (38%). However, both the topsoil and lower subsoil at this site also have a high CEC. This data indicates that the soil is younger than its counterparts with cation levels not depleted through weathering and leaching over time.
The low CEC in the remaining soils is mainly due to the relatively small amounts of clay where cations and nutrients do not have sufficient surface area to bind to. A high proportion of nutrients added to the system will be lost through deep drainage and not be retained by the soil. Low CEC also means that if there is a sudden increase in nutrient levels or chemicals from mine waste materials, the soil will be unable to absorb these ions and hence buffer against change.

North Star Landform and Soil Report Page 51 of 88
NS-RP-EN-0004_Rev 0
5.3.6 Exchangeable Sodium Percentage (ESP)
Exchangeable sodium percentage (ESP) is a measure of the amount of sodium in the exchange sites within the soil. It is usually measured as a percentage of sodium ions relative to the other cations that make up the CEC of the soil. These cations include calcium, magnesium and potassium. Sodic soils when wet tend to disperse and break down soil structure which in turn seals pores within the soil leading to low permeability. These soils also are prone to soil erosion because soil strength is weakened when soil peds break down. Tunnel erosion is also an issue for soils possessing a sodic B horizon which can slump when wet. Soils which have ESPs of greater than 6% are considered sodic. However, high sodicity soils can have an ESP greater than 25%. ESPs measured for the assessment area are all low with a maximum value recorded of 5.0%. These soils are only likely to slightly disperse due to the relatively low levels of sodium present. However, low sodium levels alone cannot be used to characterise the dispersive character of a soil. Calcium to magnesium ratios and physical characteristics are also important parameters in determining soil stability.
5.3.7 Ca/Mg Ratio
High levels of magnesium relative to calcium can affect a soil’s stability.
Soil colloids (as well as sites on soil humus) are negatively charged, with calcium and magnesium making up the bulk of the cations attracted to the colloid surface. Calcium ions flocculate and hold the soil aggregates together. Soil magnesium ions tend to act more like sodium ions and less like calcium ions and tend to disperse and disrupt soil aggregates. A balance between the two is needed to maintain ideal soil structure. A Ca/Mg ratio of greater than 1 is considered to be satisfactory for soil structure and plant growth. A higher ratio is desirable and can be achieved with the addition of lime. Some soils within the assessment area have Ca/Mg ratios of less than one which indicate potential for instability. Sites 4, 8 and 9 all have ratios less than 1. These soils in theory may therefor disperse particularly if they have inflated ESP values. However, as none of these sites have high ESP levels there is likely to be no interaction between these parameters as high magnesium levels usually are of greater concern when both magnesium and sodium levels are high. Soils with low ESP and low Ca/Mg ratios, as is the case with parts of the assessment area, should only be slightly dispersive. The topsoil Dispersion Percentage for all selected sites supports this theory with all sites having a percentage less than 60%. See Table 6..

North Star Landform and Soil Report Page 52 of 88
NS-RP-EN-0004_Rev 0
5.3.8 Trace Elements
The most important trace elements and their optimal range for plant growth are:
Table 7: Optimal Ranges for Micronutrients (Baker and Eldershaw, 1993)
Trace Element Optimum Range
Copper 3-6
Zinc 2-4
Iron 2-20
Manganese 3-6
Boron 0.3-0.5
The soils within the assessment area are all deficient in copper with all values less than 2.07 mg/kg. Iron levels are moderate to high with the highest value of about 98 mg/kg. Zinc levels are extremely low, with the highest level recorded at 0.67 mg/kg in the topsoil of site 1. This is much lower than the desired levels. Manganese levels are generally higher and range from 2.33–38.82 mg/kg. Only site 3 and site 8 are within the desirable range. Combined with low pH, high manganese levels can be toxic to plants. Where manganese levels are high the pH should be maintained at a high level by the addition of lime if necessary. About 50% of the sites analysed have boron levels within the optimum range. The remainder have boron level less than 0.3 mg/kg. These soils would respond to the application of Borax or some other Boron containing compound. High pH levels beyond pH of 8.0 may restrict the availability of some trace elements. Trace elements can be added in the form of chelates and can be applied by foliar application.
5.3.9 Heavy Metals
All sites were measured for levels of the following heavy metals:
• Arsenic
• Cadmium
• Chromium
• Cobalt
• Lead
• Molybdenum
• Selenium

North Star Landform and Soil Report Page 53 of 88
NS-RP-EN-0004_Rev 0
The heavy metal levels within the samples collected in the Project area were compared to the EIL (Soil Ecological Investigative Levels) levels published within the “Contaminated Site Reference Series - Assessment Levels for Soil, Sediment and Water, Department of Environment and Conservation, WA (2010).
Site 2 has 38 mg/kg of Arsenic which is above the level of 20 mg/kg. A number of sites have excessive Chromium levels of greater than 3 mg/kg. Sites 5, 7, 8 and 9 have high values of chromium with site 8 having an extreme value of 1552 mg/kg. This value was obtained at 1.0 m depth. Site 3 and site 8 have elevated levels of between 54 and 84 mg/kg of cobalt. The optimum range for cobalt is between 0-50 mg/kg. Lead levels for all sites are below threshold levels of 600 mg/kg. Molybdenum levels for all sites are also below threshold values. The sites tested for heavy metal levels (12) because of their limited number may not be representative of the landscape within the assessment area.
Comparing the threshold values within the document to the values obtained from the soil analyses, it is apparent that some sites naturally have elevated levels of heavy metals exceeding threshold values set by the aforementioned publication. Given that the assessment area is a highly mineralised environment it may not be unusual for excessive levels of heavy metals to concentrate in this environment. Additionally, the guideline values have been derived in an urban environment and it may be fair to argue that these criteria are not representative of the assessment area.
Due to the relatively high levels of some heavy metals present at this site, it would be advantageous to know whether or not these elements would be mobile within the landscape or whether they would be adsorbed strongly to organic matter, rock and soil material. Mobility of heavy metals will be investigated, independently of this assessment, as part of a geochemical waste study. Due to the fact that plant growth, although sparse in some areas, seems to proliferate, it is unlikely that elevated heavy metal levels inhibit plant growth. Established species seem to be tolerant of any elevated metal levels within the assessment area.
5.3.10 Potential Soil Physical Limitations
Potential physical limitations that the soils of North Star may possess include:
• Hardsetting surface behaviour of some topsoils can be limiting to plant growth. Soils with sandy loam and clay loam topsoils with low organic matter are most likely to set hard. This is because the particle size distribution of these textures is conducive to particle sorting that results in massive, structureless layers with very little pore space. These hardsetting soils can be ameliorated with the addition or organic matter and may also respond to the application of gypsum.
• Shallow topsoils are another feature of the soils at North Star. These topsoils are usually less than 5 cm in depth and often don’t have any subsoil present. The sheer lack of soil material provides no storage capacity for rainwater. Hence, plants must uptake water whilst they can and complete their life cycle while the moisture is present

North Star Landform and Soil Report Page 54 of 88
NS-RP-EN-0004_Rev 0
at the surface. Perennial plant species are forced to send fibrous roots into regolith to try and tap into water that may be captured by the rock. Spinifex is a good example, sending many roots through cracks in rocks to source some of this captured water.
• Excessive amounts of coarse fragments, particularly in the topsoil limits the amount of water a soil can hold for plant growth. Coarse fragments have relatively large pore spaces but retain water poorly. After a rainfall event, whatever the amount of water is left after surface runoff, fills pore spaces between the coarse material. The plants must make use of this water quickly as the water rapidly drains laterally down slope by subsurface flow or is lost below the soil profile entering fractured rock and parent material.
• Compaction is another physical limitation which some soils maybe predisposed to. Compaction of areas that receive heavy traffic over the life of the mine may reduce the capacity of these areas to respond to rehabilitation. These compacted layers need to be aerated so that water and air can reach plant roots. This can be achieved by deep ripping and tilling the soil before rehabilitation of the site.
• Most of the soils have a sand content of > 60% and very low clay content (with the exception of site 3 and 8 which have clay contents in excess of 38%). Hence, the soil is not physically capable of retaining plant nutrients for any significant amounts of time. Not only does this make for an inhospitable growing medium for plants but also downgrades its ability to retain moisture when used as a growing medium above capped tailings dams. The matric potential of these soils is low with suction not sufficient enough to hold water within macro and micro-pores. High levels of sand can also pre-dispose soils to erosion.
5.4 Soil Suitability Summary
The soils sampled within the assessment area are generally chemically and physically stable. Most pH values fall within a range that is suitable for plant growth and will not reduce the availability of nutrients to plants. The exception to this is site 6 which has a topsoil pH of 8.7. This pH may restrict plant growth and could be ameliorated using elemental sulphur or some other acidifying agent. EC values are low with correspondingly low levels of sodium and chloride.
Soil nutrient levels are generally very low, especially nitrate N. The levels of P and K are also generally low. However a number of soils do have favourable levels for plant growth. S levels are very low and these soils should respond once again to elemental S fertilisers. CEC are generally low due to the low levels of organic matter and clay content present. However, some soils have a favourable CEC such as site 8 which also has a moderate clay content. Site 8 has a CEC of about 15 meq/100g. The reason for this high CEC may be due to the relative age of this soil. This soil may not have been under the same weathering and leaching environment as the other soils and thus has more clay particles for nutrient attachment. The low ESP coupled with moderate Ca/Mg ratios frequently being < 1, indicate these soils are relatively stable and are only slightly dispersible. Most soils at North Star are slightly dispersible due to the lack of

North Star Landform and Soil Report Page 55 of 88
NS-RP-EN-0004_Rev 0
cohesive forces provided by the soil matrix. Low clay, high sand and low OC levels means that the soils are vulnerable to erosive, high intensity rainfall events due to their lack of strength usually afforded by these agents. Inclusion of a surface rock mulch in rehabilitated areas will minimise the mobility of any entrained sediments.
Trace elements in most cases are at low levels, except manganese and iron. These levels may be toxic but may be managed by adjusting pH levels. pH should be maintained at a high level with addition of lime to suppress any manganese toxicity.
Samples tested from some of the selected sites indicate that heavy metals are present at levels higher than the current available DEC series. Mobility of heavy metals will be investigated, independently of this assessment, as part of a geochemical waste study. If there is a risk to the environment there may be ways to ameliorate soil material by immobilising the metals by adjusting pH, redox potential or some other chemical parameter to precipitate the metals out of solution if indeed they are present in the soil solution.
All sites within the assessment area possess moderate soil physical characteristics. The high sand and low clay content in the soils is the main limitation. These soils will only slightly disperse when wet, are unlikely to erode on battered slopes of suitable design and are likely to provide a good physical medium in which plants should flourish. The biggest limitation facing rehabilitation at North Star is the relatively small amount of this resource available on-site. This is mainly due to the nature of the landforms present within the assessment area. Most surfaces within the North Star site are erosional with little deposition occurring on-site. Plateaus, mesas, low hills and rises and valley plains are still actively being eroded by gully erosion and sheet flow. There are very few sites within the assessment area that are being aggraded with alluvial and colluvial material. The areas under active erosion are residual landforms that have weathered, forming stony mulches of hard iron rich material that is basically the remains of the soil forming process over millions of years. The majority of the remaining clay material is left in the fractures of parent material and the surface coarse fragments. Although nutrient levels are typically low in natural soils, the application of a selected suite of nutrients may be beneficial to the establishment of plants during rehabilitation of disturbed sites. Additions of lime and organic matter will assist with improving soil structure.
Further studies are needed to determine the porosity of the soils and geology within the proposed northern and southern tailings facility areas. This will determine whether these proposed areas will have to be lined so that potential leachates do not enter any groundwater systems.
Topsoil (and subsoil) is very limited. Post-mine landforms mimicking pre-mined landforms will have to achieve and maintain stability and vegetation cover with minimal amounts of topsoil. Although topsoil and subsoil material is sparse, the quality of this material is generally good and should be suitable for rehabilitation.
A summary of soil test results is provided in Table 3.

North Star Landform and Soil Report Page 56 of 88
NS-RP-EN-0004_Rev 0
Table 8: Soil Results Summary
Parameter Topsoil Mean Topsoil Range Comment
pH (H2O) 6.8 5.7-8.7 Optimal
EC (dS/m) 0.035 0.010-0.163 Low
Soil Nutrients (mg/kg)
N 1.83 <1-5 Low
P 6.75 <2-24 Low
K 118 59-179 Low
S 2.96 1.1-8.0 Low
Organic Carbon (%) 0.46 0.11-0.99 Low
Cation Exchange Capacity (%)
5.3 2.5-11.8 Low
Exchangeable Sodium Percentage (%)
0.95 0.2-3.1 Low
Ca/Mg ratio 3.10 0.80-8.60 Moderate
Trace Elements (mg/kg)
Copper (mg/kg) 1.015 0.57-2.07 Low
Iron 19.11 2.22-97.92 High
Manganese 13.17 2.33-38.82 High
Zinc 0.27 0.06-0.67 Low
Boron 0.29 0.12-0.50 Low
Heavy Metals (µg/kg)
Arsenic 10,713 604-38080 High
Cadmium 66.33 40-124 Moderate
Chromium 452,167 49,600-964,000 High
Cobalt 18,770 6200-42,400 High
Lead 13,653 5880-27,600 Moderate
Molybdenum 1255.3 268-3132 Moderate
Geotechnical Properties
Overall Dispersibility* N/A N/A Low

North Star Landform and Soil Report Page 57 of 88
NS-RP-EN-0004_Rev 0
Low
Moderate
High
Optimal
*Mean values not calculated as individual sample results are discrete values indicating range classifications.

North Star Landform and Soil Report Page 58 of 88
NS-RP-EN-0004_Rev 0
6. LANDFORM PRINCIPLES FOR REHABILITATION
The management of constructed and natural landforms during operations and at closure is important in developing stable, safe and resilient landforms that are compatible with regional physiography (where practicable).
Key landform principles to consider when planning for rehabilitation and mine closure include:
• Post mining landforms should be geotechnically stable and safe;
• Constructed landforms should blend in with the surrounding hills and rises where possible. Slopes should be energy reducing and no steeper than naturally occurring slopes with similar attributes (i.e. material composition and erosion potential);
• Mine plans should examine opportunities to backfill pit voids with overburden in order to reduce the overall disturbance footprint;
• Vegetation cover should be self-sustaining and compatible with surrounding vegetation communities;
• Surface waters discharged off site should have similar quality to undisturbed catchments;
• Off-site impacts should be negligible; and
• The end land use for the area should be determined in consultation with stakeholders, and agreed with regulatory authorities during the life of mine.
It is anticipated that a detailed rehabilitation and soil management plan will prepared for the North Star Project as part of the closure planning process. Broad considerations for key landform elements are provided below:
Waste Rock Dumps (if required)
• Model landform design on low hills present in the assessment area to enhance stability and achieve compatibility with local topography. Key attributes of low hill features include:
o Rounded, gentle crests;
o Convex mid to upper slopes (approximately 15 %) with waning concave lower slopes;
o Oblong to oval basal footprint;
o Slope lengths generally ranging from 100 to 130 m;
o Height ranging from 40 to 70 m (local relief);
o Stony surface mulch of sub-angular gravels and cobbles (10-20 cm), constituting approximately 95% cover;

North Star Landform and Soil Report Page 59 of 88
NS-RP-EN-0004_Rev 0
o Shallow soils (less than 50 cm depth), red brown coarse sandy clay loam top soil
and subsoil, weak sub angular blocky structure, pH 6 -7 (moderately acid to neutral), low nutrient levels, moderate to high permeability and well drained; and
o Vegetation cover typically ranges from 30 - 50 %. Vegetation comprises of a hummock grassland with Eucalyptus leucophloia and Corymbia hamersleyana over Acacia inaequilatera, A. acradenia, A. orthocarpa and A. ptychophyylla over Triodia ? wiseana.
• Encapsulate potential Acid and Metalliferous Drainage (AMD) materials.
• Design a store and release cover utilising available material.
• Undertake erosion modelling to refine slope geometry to assist in achieving long term stability.
• The maintenance of soil structure is important in maximising revegetation outcomes. Soil structure may be retained by limiting the number of times soil is handled from stripping to replacement.
• Although subsoils may provide a suitable growth medium from a physical and chemical perspective, subsoils lack the valuable native seed bank and soil biota of surface soils. Therefore, topsoils should stripped and stored separately to subsoils. Topsoil stockpiles should be constructed to minimise the deterioration of nutrients, seed banks and soil biota. Where possible, the duration of topsoil stockpiling should be limited to around 6 to 12 months and stockpiles should not be higher than 2 m.
• Re-vegetation trials should take place during operations to determine the optimal conditions for topsoil replacement and vegetation re-establishment during rehabilitation. Progressive rehabilitation should be undertaken where possible.
• Waste dump surfaces should be direct seeded using local provenance species capable of surviving within the modified conditions of constructed landforms.
• Monitor rehabilitation performance and modify approach as required.
Open Pits
• Abandonment bunds should be positioned and constructed in accordance with DoCEP Guidelines, Safety Bund walls for Abandoned Open Pit Mines (Department of Industry and Resources 1997). The final design should include sufficient ramps and sloped areas so that animals and/or people can exit the voids.
Site Infrastructure
• Following removal of structures, disturbed surfaces should be:
o reshaped to blend in with surrounding relief and drainage (compacted surfaces should be deep ripped),

North Star Landform and Soil Report Page 60 of 88
NS-RP-EN-0004_Rev 0
o covered with topsoil to provide a medium for plant growth and to provide a natural
seed source,
o lightly ripped to maximise rainfall infiltration and enhance revegetation success,
o seeded with local provenance species.
Tailings Storage Facilities
Rehabilitation of TSF’s on site should include the following:
• Relevant tenement closure conditions are met in accordance with the requirements of the State Mining Engineer (DMP) and the Inspectorate Environmental and Rehabilitation Officer (DMP), and may include, pre rehabilitation site inspection of structural, physical and chemical characteristics/risks of the TSF, to be undertaken prior to rehabilitation works commencing.
• TSF closure objectives are set including:
o side wall stability, top surface capping with waste rock (depth 1m) and topsoil (depth 100 to 200 mm),
o deep ripping under dry conditions along the surveyed contour (depth 1m and 1.5 m intervals)
o the establishment of a self-sustaining vegetation community compatible with surrounding vegetation.
• Flood protection must ensure:
o the TSF is able to store the at least 1:100 year ARI (Annual Recurrence Interval), 72 hour rainfall event without overtopping.
o water shedding structures may not carry significant sediment to watercourses.
• Removal of current operating infrastructure by:
o removing all discharge and return pipework,
o blocking all outfalls,
o removal of all fencing
o appropriate battering of TSF slope (top third at 18o , middle third at 15o and bottom third 10o) including access ramps and ensure all such features are impassable to vehicles.
• Groundwater monitoring is conducted for a time period appropriate to local site conditions (minimum 5 years) unless results indicate a stable state has been achieved at acceptable levels.
• Revegetation of TSF structures should be carried out prior to the rainfall season, including seeding, planting and slow release fertilisation. Post revegetation monitoring

North Star Landform and Soil Report Page 61 of 88
NS-RP-EN-0004_Rev 0
must be undertaken to ensure weeds and pest animals are controlled/eradicated particularly in the first two years of establishment (quarterly inspections recommended). Long term monitoring of rehabilitation is required to identify the need for remedial action with the goal of achieving a self-sustaining ecological community. Remedial action may include, repair of water control structures, deep erosion or instability control, re-ripping, re-armouring of landform sides and revegetation including analyses of physical, chemical and biological conditions where required.

North Star Landform and Soil Report Page 62 of 88
NS-RP-EN-0004_Rev 0
REFERENCES
ASTM (2010) ASTM D4318 - 10 Standard Test Methods for Liquid Limit, Plastic Limit, and Plasticity Index of Soils
Baker, D.E. and Eldershaw, V.J. (1993). Interpreting Soil Analyses. QLD Department of Primary Industries, Project Report Series QO93014.
Beard J.S. (1990). Plant Life of Western Australia. Kanagroo Press, NSW
Beard, J.S. (1975). Vegetation Survey of Western Australia: Pilbara. 1:1000000 Vegetation Series Explanatory Notes to Sheet 5.
Bureau of Meteorology. (2011). Climate Data Online. Available at http://www.bom.gov.au, accessed 28 November 2011.
National Committee on Soil and Terrain (2009) Australian soil and land survey field handbook (3rd edn). CSIRO Publishing: Melbourne
Department of Environment and Conservation. (2010). Definitions, Categories and Criteria for Threatened and Priority Ecological Communities. Available: http://www.dec.wa.gov.au/content/view/849/2017/. Accessed 17 November 2011.
Department of Environment and Conservation (2010). Contaminated Site Reference Series – Assessment Levels for Soil, Sediment and Water
Department of Environment and Conservation (2011b).Native Vegetation Map Viewer. Available: http://maps.dec.wa.gov.au/idelve/nv/index.jsp. Accessed 28 November 2011
Department of Minerals and Energy (1997). Safety Bund Walls Around Abandoned Open Pit Mines Guideline. Document No: ZMA048HA
Department of Water (2008). Pilbara Regional Water Plan Supporting Detail. November 2008.
FMG Ltd (2011) Website: Current Activities. Accessed 25/11/2011 at http://www.fmgl.com.au/our_business/Exploration/Current_Activities.
Gentilli J. (1972) Australian Climate Patterns. Melbourne: Thomas Nelson (Australia). Hazelton, P. and Murphy, B. (2007). Interpreting soil test results: what do all the numbers mean? (2nd Ed).
NSW Department of Natural Resources, CSIRO Publishing, Collingwood. Hickman AH. (1983). Geology of the Pilbara Block and its environs. Perth: Western Australia Geological
Survey bulletin 127 Isbell, R.F. (2002). ‘The Australian Soil Classification (revised edn).’ CSIRO Publishing: Melbourne). Kendrick, P. and McKenzie, N. (2001). Pilbara1 (PIL1 – Chichester subregion). In.A Biodiversity Audit of
Western Australia’s 53 Biogeographical Subregions in 2002. Lascelles, D. F (2000) Marra Mamba Iron Formation stratigraphy in the eastern Chichester Range,
Western Australia. Australian Journal of Earth Sceiences, v47, pp 799-806. Northcote,K.H. with Beckmann,G.G., Bettenay,E., Churchward,H.M., Van Dijk,D.C., Dimmock,G.M.,
Hubble,G.D., Isbell,R.F., McArthur,W.M., Murtha,G.G., Nicolls K.D., Paton,T.R., Thompson,C.H., Webb,A.A. and Wright,M.J. (1960-1968). Atlas of Australian Soils, Sheets 1 to 10. With explanatory data (CSIRO Aust. and Melbourne University Press: Melbourne).
Sherrard, J.L., Decker, R.S. and Dunnigan (1976) Identification and Nature of Dispersive Soils. Journal of Geological Engineering Division. Vol. 102, No 4, April 1976, pp. 287-301
Thackway, R and I.D. Cresswell. (1995). An Interim Biogeographical Regionalisation for Australia: A Framework for Establishing the National System of Reserves. Version 4.0, Australian Nature Conservation Agency, Canberra.
Van Vreeswyk, A.M.E., A.L. Payne, K.A. Leighton and P. Hennig. (2004). An Inventory and Condition Survey of the Pilbara Region, Western Australia. Technical Bulletin 92.Department of Agriculture.
Williams, A. and Pratt, A. (2008) in Goldfields Environmental Management Workshop Proceedings 2008

North Star Landform and Soil Report Page 63 of 88
NS-RP-EN-0004_Rev 0
WorleyParsons (2011), Fortescue Metals Group LTD, North Star Magnetite Project: Preliminary Acid
Mine Drainage. 301012-01426

North Star Landform and Soil Report Page 64 of 88
NS-RP-EN-0004_Rev 0
This page has been left blank intentionally

North Star Landform and Soil Report Page 65 of 88
NS-RP-EN-0004_Rev 0
Figure 1: Assessment Area and Regional Locality Map

North Star Landform and Soil Report Page 66 of 88
NS-RP-EN-0004_Rev 0
This page has been left blank intentionally

GHD House, 239 Adelaide Terrace Perth WA 6004 T 61 8 6222 8222 F 61 8 6222 8555 E [email protected] W www.ghd.com.au
PIP
PIN
GA
RR
A R
D
689,000
689,000
697,500
697,500
706,000
706,000
714,500
714,500
7,640,
500
7,640,
500
7,649,
000
7,649,
000
7,657,
500
7,657,
500
G:\61\27391\GIS\Maps\MXD\6127391_G044_Rev0.mxd© 2012. Whilst every care has been taken to prepare this map, GHD, GA, FMG and Landgate make no representations or warranties about its accuracy, reliability, completeness or suitability for any particular purpose and cannot accept liability and responsibility of any kind (whether in contract, tort or otherwise) for any expenses, losses, damages and/or costs (including indirect or consequential damage) which are or may be incurred by any party as a result of the map being inaccurate, incomplete or unsuitable in any way and for any reason.
LEGEND
0 0.85 1.7 2.55 3.4 4.25
Kilometres
Map Projection: Transverse MercatorHorizontal Datum: GDA 1994Grid: GDA 1994 MGA Zone 50
Fortescue Metals Group LtdSoil and Landform Assessment
Figure 1
Job NumberRevision 0
61-27391
28 Mar 2012North StarLocation Map andAssessment Area
o Date
Data source: Landgate: Roads - 20110927, Rail - 20110927; FMG: North Star Mosaic - August 2011, Infrastructure - 20110920; GHD: Infrastructure 20m Buffer - 20110927, Assessment Area - 20120116; GA: Topo 250k Series 3 - 2006. Created by:vdinh
at A31:85,000
Rails
Roads
Infrastructure
20m Infrastructure Buffer
Assessment Area
INDEE
NULLAGINE
NULLAGINE
MARBLE BAR
WHIM CREEKWALLAREENYA
SOUTH HEDLANDINDIAN OCEAN
Locality Map

North Star Landform and Soil Report Page 68 of 88
NS-RP-EN-0004_Rev 0
This page has been left blank intentionally

North Star Landform and Soil Report Page 69 of 88
NS-RP-EN-0004_Rev 0
Figure 2: Land System Mapping (1:500,000)

North Star Landform and Soil Report Page 70 of 88
NS-RP-EN-0004_Rev 0
This page has been left blank intentionally

GHD House, 239 Adelaide Terrace Perth WA 6004 T 61 8 6222 8222 F 61 8 6222 8555 E [email protected] W www.ghd.com.au
RGEMAC
RGEBOO
RGECPN
RGEMAC
RGEUAR
RGEMAC
RGEMAC
RGETLG
RGEROC
RGECPN
RGEROC
RGETLG
RGETLG
RGEUAR
RGEGRC
RGEROC
RGEROC
RGECPNRGERIV
RGEMAC
RGECPN
RGEMAC
RGEMAC
RGEBGD
RGEMAC
RGECPN
RGEUAR
RGEMAC
RGEPLA
RGEMAC
RGEMAC
RGECPN
RGESAT
RGEROC
RGEMAC
RGECPN
RGEPLA
RGETLG
RGEBGD
RGEBGD
RGEPLA
RGEMAC
RGEGRG
RGEBGD
RGETLG
RGESAT
RGEGRC
RGEROC
RGETLG
RGESAT
RGEMAC
RGEBGD
RGETLG
RGEPLA
RGEROC
RGEMAC
RGEROC
RGEROC
RGESAT
RGEPLA
RGEMAC
RGEBGD
RGECPN
RGEMAL
RGEGRC
RGESAT
RGETLG
RGEBOO
RGEPLA
RGERIV
RGERIV
RGERIV
RGEROC
RGERIV
RGEMAC RGECPN
RGEROC
RGEUAR
RGESAT
RGEBOO
RGEROB
RGERIV
RGECPN
RGETLG
RGERIV
RGEMAC
RGESAT
RGEBGD
RGEGRC
RGEPLA
RGEBGD
RGEBGD
RGEPLA
RGEBGD
RGEMAC
RGEBLK
RGECPN
RGEMAC
RGEW_RIVER
RGEBOO
RGEROC
RGEBOO RGECPN
RGEPLA
RGEPLA
RGEPLA
RGEROB
RGEGRC
RGEPLA
RGETLG
RGECPN
RGEBGD
RGEBOO
RGEROB
RGEWHS
RGEBOO
RGECPN
RGEGRG
RGEGRC
RGECPN
RGEROC
RGEBLK
RGEBOO
RGEBLK
RGEW_RIVER
RGEGRC
RGEMAC
RGEBOO
RGEROC
RGEROB
RGERIVRGEROC
RGEGRC
RGEBOO
RGEBOO
RGERIV
RGEROB
RGERIV
RGEBOO
RGEBOO
RGEBGD
RGEBOO
RGEBGD
RGEBGD
RGEW_RIVER
RGEROC
RGEBOO
RGEBOO
RGEROC
RGEBOO
RGEUARRGEBGD
RGEBGD
RGEBOO
RGEBOO
RGEBOO
RGECAL
RGEW_RIVERRGETLG
RGEBOO RGEBGD
RGEBOO
RGEROC
RGEROB
RGESAT
RGEBOO
RGEWHS
RGECPN
RGEMACRGEBOO
RGEBOO
RGEROB
RGERIV
RGEBOO
RGERIV
RGERIV
RGEGRC
RGEBOO
RGEROB
RGEBOO
RGEBOO
RGEBOO
RGECPN
RGERIV
RGEBLK
RGEMAC
RGEBOORGEBOO
RGECPN
675,000
675,000
700,000
700,000
725,000
725,000
750,000
750,000
7,625,
000
7,625,
000
7,650,
000
7,650,
000
7,675,
000
7,675,
000
G:\61\27391\GIS\Maps\MXD\9.3 For QA\6127391_G027_Rev0_93.mxd© 2012. Whilst every care has been taken to prepare this map, GHD, FMG and DAFWA make no representations or warranties about its accuracy, reliability, completeness or suitability for any particular purpose and cannot accept liability and responsibility of any kind (whether in contract, tort or otherwise) for any expenses, losses, damages and/or costs (including indirect or consequential damage) which are or may be incurred by any party as a result of the map being inaccurate, incomplete or unsuitable in any way and for any reason.
LEGEND
0 2.5 5 7.5 10 12.5
Kilometres
Map Projection: Transverse MercatorHorizontal Datum: GDA 1994Grid: GDA 1994 MGA Zone 50
Fortescue Metals Group LtdSoil and Landform Assessment
Figure 2
Job NumberRevision 0
61-27391
28 Mar 2012
North Star Land System Mapping (1:250,000)
o Date
Data source: DAFWA: Land System - 2007; FMG: Infrastructure - 20110920;. Created by:vdinh, erice
Infrastructure
Land System 1:250
<all other values>
RGEBGD : Stony plains with spinifex grasslands
RGEBLK : Hills and ranges with spinifex grasslands
RGEBOO : Hills and ranges with spinifex grasslands
RGECAL : Calcrete plains with spinifex grasslands
RGECPN : Hills and ranges with spinifex grasslands
RGEGRC : Hills and ranges with spinifex grasslands
RGEGRG : Sandplains and occasional dunes with spinifex grasslands
RGEMAC : Stony plains with spinifex grasslands
RGEMAL : Alluvial and sandy plains with soft spinifex grasslands
RGEPLA : Stony plains with spinifex grasslands
RGERIV : River plains with grassy woodlands and tussock grasslands
RGEROB : Mesas, breakaways and stony plains with spinifex grasslands
RGEROC : Hills and ranges with spinifex grasslands
RGESAT : Stony plains with spinifex grasslands
RGETLG : Hills and ranges with spinifex grasslands
RGEUAR : Sandplains and occasional dunes with spinifex grasslands
RGEWHS : Undulating stony plains with cracking clay soils and tussock grasslands
RGEW_RIVER :
at A31:250,000

North Star Landform and Soil Report Page 72 of 88
NS-RP-EN-0004_Rev 0
This page has been left blank intentionally

North Star Landform and Soil Report Page 73 of 88
NS-RP-EN-0004_Rev 0
Figure 3: Land System Mapping of Assessment Area (1:60,000)

North Star Landform and Soil Report Page 74 of 88
NS-RP-EN-0004_Rev 0
This page has been left blank intentionally

710,000
710,000
715,000
715,000
720,000
720,000
7,645,
000
7,645,
000
7,650,
000
7,650,
000
7,655,
000
7,655,
000
G:\61\27391\GIS\Maps\MXD\9.3 For QA\6127391_G041_Rev0_93.mxd
LEGEND
0 0.5 1 1.5 2 2.50.25
Kilometres
Map Projection: Transverse MercatorHorizontal Datum: GDA 1994Grid: GDA 1994 MGA Zone 50 o
© 2012. Whilst every care has been taken to prepare this map, GHD, Landgate, DAFWA and Fortescue Metals Groupe make no representations or warranties about its accuracy, reliability, completeness or suitability for any particular purpose and cannot accept liability and responsibility of any kind (whether in contract, tort or otherwise) for any expenses, losses, damages and/or costs (including indirect or consequential damage) which are or may be incurred by any party as a result of the map being inaccurate, incomplete or unsuitable in any way and for any reason.
Figure 3
Job NumberRevision 0
61-27391
28 Mar 2012Date
Data source: Landgate: Wodinga 2001 Mosaic - 20111129, Northshaw 2005 Mosaic - 20111129, Roads - 20110927; Fortescue Metals Group: Aerial Imagery - 20110416, Infrastucture - 20110927; DAFWA: Landsystem - 20110913; GHD Assessment Area - 20111123. Created by:vdinh
GHD House, 239 Adelaide Terrace Perth WA 6004 T 61 8 6222 8222 F 61 8 6222 8555 E [email protected] W www.ghd.com.au
1:50,000 A3 Fortescue Metals Group LtdSoil and Landform Assessment
North Star Landsystem Mapping (1:50,000)
Roads
Infrastructure
Assessment Area
Land Systems Boolaloo Land System
Boolgeeda Land System
Capricorn Land System
Granitic Land System
Macroy Land System
Rocklea Land System
Talga Land System

North Star Landform and Soil Report Page 76 of 88
NS-RP-EN-0004_Rev 0
This page has been left blank intentionally

North Star Landform and Soil Report Page 77 of 88
NS-RP-EN-0004_Rev 0
Figure 4: Pictorial Map of Landform Units

North Star Landform and Soil Report Page 78 of 88
NS-RP-EN-0004_Rev 0
This page has been left blank intentionally

GHD House, 239 Adelaide Terrace Perth WA 6004 T 61 8 6222 8222 F 61 8 6222 8555 E [email protected] W www.ghd.com.au
1
2
3
456
7
8
9
710,000
710,000
720,000
720,000
7,650,
000
7,650,
000
G:\61\27391\GIS\Maps\MXD\9.3 For QA\6127391_G031_Rev0_93.mxd© 2012. Whilst every care has been taken to prepare this map, GHD, DAFWA, FMG and Landgate make no representations or warranties about its accuracy, reliability, completeness or suitability for any particular purpose and cannot accept liability and responsibility of any kind (whether in contract, tort or otherwise) for any expenses, losses, damages and/or costs (including indirect or consequential damage) which are or may be incurred by any party as a result of the map being inaccurate, incomplete or unsuitable in any way and for any reason.
LEGEND
0 1 2 3 4 5
Kilometres
Map Projection: Transverse MercatorHorizontal Datum: GDA 1994Grid: GDA 1994 MGA Zone 50
Fortescue Metals Group LtdSoil and Landform Assessment
Figure 4
Job NumberRevision 0
61-27391
28 Mar 2012North StarPictorial Map of TypicalLandform Units
o Date
Data source: DAFWA: Land System - 2007; Landgate: Roads - 20110927, Wodinga 2001 Mosaic - 20111129, Northshaw 2005 Mosaic - 20111129; FMG: Infrastucture - 20110927; GHD: Photos - 20111012, Assessment Area - 20111123. Created by:vdinh, erice
Infrastructure
Roads
Assessment Area
Land Systems Boolaloo Land System
Boolgeeda Land System
Capricorn Land System
Granitic Land System
Macroy Land System
Rocklea Land System
Talga Land System
1 2 3 4 5
6 7
8
at A31:100,000
9
Drainage channel of the Capricorn Land System. Prominent mesa with lateritic cropping. Low hill in foreground with cliffed escarpment of peneplain in background.
Elevated plain with low rises and network of minor flow lines Low hills and hills of Capricorn land system.
Summit of West Star Plateau. Summit of Glacial Valley plateau.
Valley plain of proposed camp and processing plant. Permanent spring flowing within a deeply incised gorge.
1 Photo Number

North Star Landform and Soil Report Page 80 of 88
NS-RP-EN-0004_Rev 0
This page has been left blank intentionally

North Star Landform and Soil Report Page 81 of 88
NS-RP-EN-0004_Rev 0
Figure 5: Soils Profile

North Star Landform and Soil Report Page 82 of 88
NS-RP-EN-0004_Rev 0
This page has been left blank intentionally

Descript ion Physical Chemical
Red coarse loamy sand
EC 0.020dS/m. Ca/M g>1. Low N,P,K,S. Low OC. ESP<65- 70
Weathered rock to hard rock
Subangular 0.5-1.0 and 10-15 cm coarse fragments on the harsett ing surface. Weak subangular blocky structure. 5% corase fragment in the topsoil overlying hard rock
0 - 5
Descript ion Physical Chemical
Brown coarse
sandly light medium clay
pH 7.0-7.5. EC 0.025-0.108dS/m. Ca/M g>1. Low N,P,K,S. Low OC. ESP<6
Few 1-5 cm greenstone coarse fragments on hardsett ing surface. Weak subangular blocky topsoil overlying massive subsoil. 25% 1-5 cm coarse fragments
0 - 15
15 - 50
50 -
Red coarse sandy light medium clay
Grey weathered rocks
Descript ion Physical Chemical
Red coarse loamy sand
3 0 -6 0 -
Red coarse loamy sand
0 - 3 0
6 0 -
pH 6.5. EC 0.018dS/m. Ca/M g>1. Low N,P,K,S. Low OC. ESP<6
30% mixed lithology angular coarse fragments on hardsett ing surface. Single grained structure. 40% angular coarse fragments in the topsoil to 90% coarse fragments to 40 cm
light grey hard weathered rock
Descript ion Physical Chemical
Red sandy loam
3 - Qweathered rock
0 - 3
pH 6.5. EC 0.010dS/m. Ca/M g>1. Low N,P,K,S. Low OC. ESP<6
95% 5-10 cm angular Banded Iron Formation including 10% rock outcrop on hardsett ing surface. M assive structure with 40% mixed lithology coarse fragments in the surface horizon. Few 1-2 cm iron seggregat ions.
Descript ion Physical Chemical
Red coarse sandy clay loam topsoil
10 -6 0
Abundant weatheed rock
0 - 10
40% shale fragments. Single grained structure. Harsett ing surface condit ion
pH 6.5. EC 0.032 dS/m. Ca/mg>1. LowN,P,K,S. Low OC. ESP<6%
60 - Weathered rock
Descript ion Physical Chemical
Red coarse sandy loam
4 0 -2 5
Red coarse sandy loam
95% subangular 2-5 cm coarse fragments of Banded Iron Formation including 30% of rock outcrop. Weak subangular blocky structure in the topsoil overlying massive subsoil. 25% sandstone coarse fragments in the surface horizon and 40% in the subsoil.
pH 6.0. EC <0.010dS/m. Ca/M g>1. Low N,P,K,S. Low OC. ESP<6
0 - 4 0
2 5Weathered
parent material
Descript ion Physical Chemical
Brown sandy loam
pH 6.5. EC 0.017dS/m. Ca/M g>1. Low N,P,K,S. Low OC. ESP<6
95% bandded Iron Format ion coarse fragments with 10% rock outcrop on hardsett ing surface. M assive structure with 40% mixed lithology coarse fragments. Some 1-2 cm iron seggregatrions
0 - 3
3 - Weathered rock
Descript ion Physical Chemical
Red sandy loam
15-12 0
Qweathered rock
0 - 15
pH 6.5. EC 0.017dS/m. Ca/M g>1. Low N,P,K,S. Low OC. ESP<6
60% Banded Iron Formation (goethite) folded and faulted outcrop on hardsett ing surface. Weak polyhedral structure in the topsoils overlying massive subsoil. 80-90% of shale and other sedimentary rocks fragmemts and underlain by hard moderately weathered rock.
Descript ion Physical Chemical
pH 7.5. EC 0.065dS/m. Ca/M g>1. Low N,P,K,S. Low OC. ESP<6
100% 2-5 cm subangular coarse fragments on hardsett ing surface. M assive structure throughout with 60% 1-5 cm sandstone fragments in the topsoil overlying weathered to hard rock.
0 - 5 Red coarse sandly loam
Descript ion Physical Chemical
Red medium clay
0 .5-1.0 Fresh rock
0 -0 .5
30% angular to platy coarse fragments of Banded Iron Formation on loose land surface condit ion. 50-90% angular gravel size coarse fragments in the topsoil wih weak structure.
EC 0.040dS/m. Ca/M g>1. Low N,P,K,S. Low OC. ESP<6
Descript ion Physical Chemical
Red f ine sandy clay loam topsoil
10 -8 0
Red f ine sandy clay laom
0 - 10
EC 0.042dS/m. Ca/M g>1. Low N,P,K,S. Low OC. ESP<6
95% Subangular to platy coarse fragments of Banded Iron Formation. Single grained structure to massive in the subsoil. Hardsett ing surface
Descript ion Physical Chemical
Brown coarse sandy loam
0 - 2 0
2 0 -
pH 6.5-7.0. EC 0.163dS/m. Ca/M g>1. Low N,P,K,S. Low OC. ESP<6
80% subangular mixed litholgoy coarse fragments on loose surface condit ion. Single grained structure with 50% coarse fragements in the topsoil and 20% in the subsoil.
Red coarse sandy loam
Descript ion Physical Chemical
Red clay loam
Hard rock
0 - 4 0
4 0 -
95% of 2-5 cm iron nodules on hardsett ing surface condit ion. M assive structure throughout the prof ile. 60% 1-5 cm iron nodules in the topsoil underlain by hard rock.
pH 6.5-7.0. EC 0.114dS/m. Ca/M g>1. Low N,P,K,S. Low OC. ESP<6
GHD House, 239 Adelaide Terrace Perth WA 6004 T 61 8 6222 8222 F 61 8 6222 8555 E [email protected] W www.ghd.com.au
!>!>
!>
!>
!>
!>
!>!>
!>
!>
!>
!>
AG
AgYpi
ASAS
AGAG
AS
AgYnu
AgYi
ASAS
Aj
Au
AGAGAb
AuAu
Au ASAS
AuAu
AjAgYi
AWSAWS
AjAj
ADAD
AgYi
Au
AgYka
AWS
Ab
AuAu
AGAG
AgYgi
Au
ASdASd
AuAu
AS
AgYin
AgYi
Au
Aod
AgYkaAgYka
AgYgi
AgYi
Au
Acq
Au
Au
Au
Acq
As
AaD
AgYwo
689,000
689,000
697,500
697,500
706,000
706,000
714,500
714,500
7,640,
500
7,640,
500
7,649,
000
7,649,
000
7,657,
500
7,657,
500
G:\61\27391\GIS\Maps\MXD\6127391_G035_Rev0.mxd© 2012. Whilst every care has been taken to prepare this map, GHD, DMP and FMG make no representations or warranties about its accuracy, reliability, completeness or suitability for any particular purpose and cannot accept liability and responsibility of any kind (whether in contract, tort or otherwise) for any expenses, losses, damages and/or costs (including indirect or consequential damage) which are or may be incurred by any party as a result of the map being inaccurate, incomplete or unsuitable in any way and for any reason.
0 1.2 2.4 3.6 4.8 6
Kilometres
Map Projection: Transverse MercatorHorizontal Datum: GDA 1994Grid: GDA 1994 MGA Zone 50
Fortescue Metals Group LtdSoil and Landform Assessment
Figure 5
Job NumberRevision 0
61-27391
28 Mar 2012
North StarSoil Profiles
o Date
Data source: DMP: Geology 100k - 1999; FMG: North Star Imagery - August 2011, Infrastructure - 20110920;. Created by:vdinh
DRAFT
!> Site Location
1:100k GeologyAD: De Grey Group
AG: Gorge Creek Group
AG: Undivided
AS: Sulphur Springs Group
ASd: Dolerite
AWS: Salgash Subgroup
AaD: Dalton Suite
Ab: Metabasalt
Acq: Interbedded chert and quartzite
AgYgi: Gillam Monzogranite
AgYi: Interleaved granodiorite, granite, and pegmatite
AgYin: Biotite-hornblende gneiss
AgYka: Kavir Granodiorite
AgYnu: Numbana Monzogranite
AgYpe: Petroglyph Gneiss
AgYpi: Pincunah Monzogranite
AgYwo: Woodstock Monzogranite
Aj: Golden Cockatoo Formation
Aod: Metadolerite
As: Metamorphosed sedimentary rocks
Au: Ultramafic rock, metamorphosed
Au: Ultramafic tectonic breccia
Site 1 Site 2 Site 3 Site 4 Site 5 Site 6 Site 7
Site 8
Site 9
Site 10
Site 11
Site 12 Site 12
at A31:120,000

North Star Landform and Soil Report
NS-RP-EN-0004_Rev 0
This page has been left blank intentionally

North Star Landform and Soil Report
NS-RP-EN-0004_Rev 0
Appendix 1: Laboratory Results

North Star Landform and Soil Report
NS-RP-EN-0004_Rev 0
This page has been left blank intentionally

CustomerJob
Date Rec'dName Code Depth Colour Gravel Texture Ammonium
NitrogenNitrateNitrogen
% mg/Kg mg/Kg
5CS11017 TP1-NS-0.1 15/10/11 0-10 BR 0 3.5 6 25CS11016 TP2-NS-0.1 15/10/11 0-10 BRRD 0 3.5 4 55CS11018 TP3-NS-0.1 15/10/11 0-10 BROR 0 3.5 3 < 15CS11019 TP4-NS-0.1 15/10/11 0-10 BR 5-10 2.5 1 < 15CS11020 TP4-NS-0.3 15/10/11 0-10 BRRD 0 3.5 3 < 15CS11021 TP5-NS-0.1 16/10/11 0-10 BRRD 5-10 3.0 2 25CS11022 TP6-NS-0.1 17/10/11 0-10 DKBR 15-20 2.5 < 1 < 15CS11023 TP7-NS-0.1 17/10/11 0-10 BR 0 2.5 3 25CS11024 TP8-NS-0.1 17/10/11 0-10 BRGR 0 3.0 1 < 15CS11025 TP8-NS-0.3 17/10/11 0-10 BR 5-10 3.5 2 < 15CS11026 TP8-NS-1.0 17/10/11 0-10 GRBR 5-10 3.5 1 < 15CS11027 TP9-NS-0.1 17/10/11 0-10 BR 5-10 2.5 3 < 15CS11028 TP10-NS-0.1 17/10/11 0-10 BRRD 5 3.0 2 < 15CS11029 TP11-NS-0.1 17/10/11 0-10 BRRD 5-10 3.0 3 45CS11030 TP12-NS-0.1 17/10/11 0-10 BRRD 5 3.5 1 1
GHD Pty Ltd08/11/118/11/2011
Lab Number
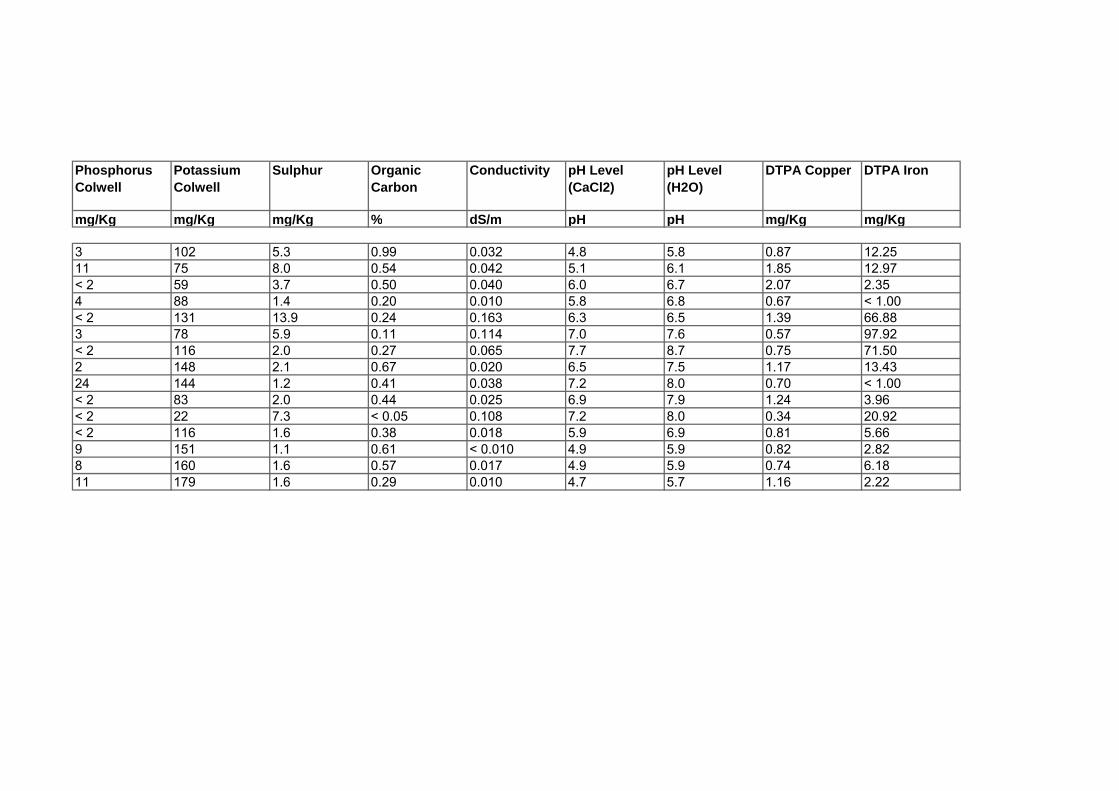
PhosphorusColwell
PotassiumColwell
Sulphur OrganicCarbon
Conductivity pH Level(CaCl2)
pH Level(H2O)
DTPA Copper DTPA Iron
mg/Kg mg/Kg mg/Kg % dS/m pH pH mg/Kg mg/Kg
3 102 5.3 0.99 0.032 4.8 5.8 0.87 12.2511 75 8.0 0.54 0.042 5.1 6.1 1.85 12.97< 2 59 3.7 0.50 0.040 6.0 6.7 2.07 2.354 88 1.4 0.20 0.010 5.8 6.8 0.67 < 1.00< 2 131 13.9 0.24 0.163 6.3 6.5 1.39 66.883 78 5.9 0.11 0.114 7.0 7.6 0.57 97.92< 2 116 2.0 0.27 0.065 7.7 8.7 0.75 71.502 148 2.1 0.67 0.020 6.5 7.5 1.17 13.4324 144 1.2 0.41 0.038 7.2 8.0 0.70 < 1.00< 2 83 2.0 0.44 0.025 6.9 7.9 1.24 3.96< 2 22 7.3 < 0.05 0.108 7.2 8.0 0.34 20.92< 2 116 1.6 0.38 0.018 5.9 6.9 0.81 5.669 151 1.1 0.61 < 0.010 4.9 5.9 0.82 2.828 160 1.6 0.57 0.017 4.9 5.9 0.74 6.1811 179 1.6 0.29 0.010 4.7 5.7 1.16 2.22

DTPAManganese
DTPA Zinc Exc.Aluminium
Exc. Calcium Exc.Magnesium
Exc.Potassium
Exc. Sodium Boron HotCaCl2
Chloride
mg/Kg mg/Kg meq/100g meq/100g meq/100g meq/100g meq/100g mg/Kg mg/Kg
10.92 0.14 0.128 3.17 1.21 0.24 0.03 0.37 9.716.49 0.67 0.085 1.85 0.81 0.16 0.09 0.50 17.62.33 0.07 < 0.001 4.84 1.18 0.15 0.04 0.41 2.37.12 0.20 < 0.001 1.49 0.83 0.15 0.03 0.12 3.837.85 0.09 < 0.001 2.02 2.07 0.27 0.23 0.36 170.128.85 0.06 < 0.001 3.04 0.62 0.20 0.05 0.24 14.338.82 0.24 < 0.001 6.05 0.70 0.20 0.03 0.16 9.58.92 0.43 < 0.001 3.64 3.17 0.28 0.03 0.23 2.24.19 0.19 < 0.001 9.57 1.94 0.24 0.02 0.19 3.12.61 0.06 < 0.001 6.27 8.78 0.21 0.39 0.60 2.25.95 0.07 < 0.001 5.56 8.94 0.06 0.51 0.29 123.06.70 0.30 < 0.001 2.24 2.85 0.23 0.02 0.19 6.011.67 0.34 0.105 2.43 1.22 0.32 0.03 0.27 4.410.33 0.36 0.110 2.10 0.89 0.35 0.05 0.33 8.911.65 0.27 0.176 2.49 1.34 0.46 0.05 0.43 5.3

% Clay % CourseSand
% Fine Sand % Sand % Silt DispersionIndex
Arsenic Cadmium Chromium
% % % % % µg/Kg µg/Kg µg/Kg
18.19 31.42 35.19 66.61 15.20 0.00 8400.00 40.00 180400.0016.72 34.29 31.23 65.52 17.76 0.00 38080.00 48.00 780000.0043.46 20.69 21.01 41.71 14.83 0.00 10000.00 52.00 357600.005.87 50.81 31.48 82.29 11.84 0.00 6880.00 108.00 99600.0023.23 57.86 12.12 69.98 6.79 0.00 12920.00 112.00 222800.005.91 74.14 13.00 87.15 6.95 0.00 19840.00 124.00 964000.008.79 70.12 15.20 85.32 5.89 12.00 9480.00 76.00 49600.009.87 60.45 25.71 86.16 3.97 0.00 2308.00 48.00 768000.006.88 60.00 25.20 85.20 7.92 0.00 3004.00 64.00 808000.0038.39 39.01 14.71 53.72 7.89 0.00 5800.00 64.00 1040000.009.78 71.62 11.72 83.34 6.88 0.00 604.00 28.00 1564000.009.84 52.57 31.65 84.22 5.93 0.00 4360.00 56.00 720000.0011.77 19.69 52.78 72.48 15.76 0.00 9080.00 60.00 236400.008.97 26.55 53.46 80.01 11.02 0.00 9440.00 64.00 298400.0017.23 20.69 44.80 65.49 17.28 0.00 7680.00 56.00 164000.00

Cobalt Lead Molybdenum Selenium ESPExchangeable
µg/Kg µg/Kg µg/Kg µg/Kg %
6960.00 9880.00 1092.0 612.00 0.710080.00 16320.00 1816.0 1488.00 3.17760.00 27600.00 2180.0 976.00 0.639480.00 10160.00 1352.0 324.40 1.151200.00 16360.00 2672.0 756.00 5.06200.00 22320.00 3132.0 1376.00 1.217320.00 16040.00 1648.0 234.00 0.528520.00 6400.00 268.0 291.20 0.442400.00 5880.00 304.0 142.80 0.238080.00 9760.00 728.0 504.00 2.584000.00 2104.00 308.0 146.40 3.432200.00 10600.00 588.0 215.20 0.49640.00 12280.00 928.0 680.00 0.68400.00 12920.00 824.0 472.00 1.416280.00 13440.00 932.0 704.00 1.2
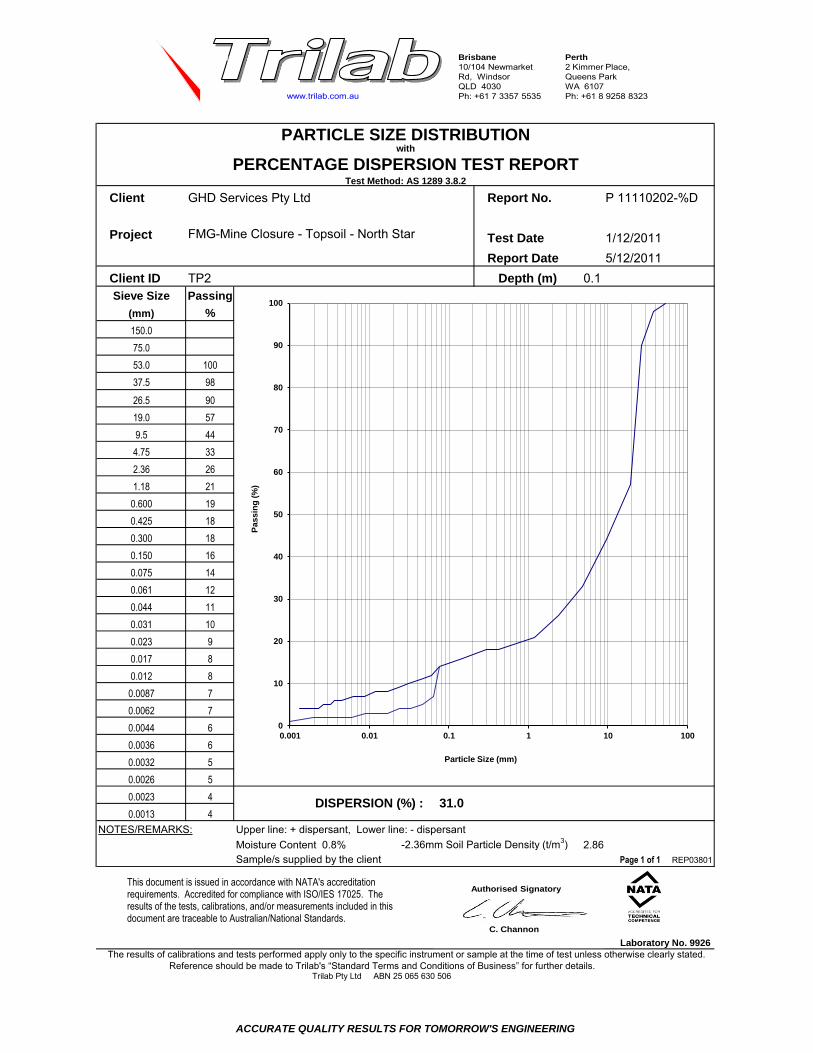
www.trilab.com.au
Brisbane10/104 Newmarket Rd, Windsor QLD 4030 Ph: +61 7 3357 5535
Perth2 Kimmer Place, Queens Park WA 6107 Ph: +61 8 9258 8323
chrisc 1919
Client Report No.
Project Test DateReport Date
Client ID TP2 Depth (m)Sieve Size Passing
(mm) %150.0
75.0
53.0 100
37.5 98
26.5 90
19.0 57
9.5 44
4.75 33
2.36 26
1.18 21
0.600 19
0.425 18
0.300 18
0.150 16
0.075 14
0.061 12
0.044 11
0.031 10
0.023 9
0.017 8
0.012 8
0.0087 7
0.0062 7
0.0044 6
0.0036 6
0.0032 5
0.0026 5
0.0023 4
0.0013 4
NOTES/REMARKS: Upper line: + dispersant, Lower line: - dispersantMoisture Content 0.8% -2.36mm Soil Particle Density (t/m3) 2.86Sample/s supplied by the client Page 1 of 1 REP03801
Laboratory No. 9926
PARTICLE SIZE DISTRIBUTION
Test Method: AS 1289 3.8.2PERCENTAGE DISPERSION TEST REPORT
DISPERSION (%) : 31.0
with
GHD Services Pty Ltd
FMG-Mine Closure - Topsoil - North Star
0.1
1/12/20115/12/2011
P 11110202-%D
Trilab Pty Ltd ABN 25 065 630 506 Reference should be made to Trilab's “Standard Terms and Conditions of Business” for further details.
The results of calibrations and tests performed apply only to the specific instrument or sample at the time of test unless otherwise clearly stated.
0
10
20
30
40
50
60
70
80
90
100
0.001 0.01 0.1 1 10 100
Pass
ing
(%)
Particle Size (mm)
This document is issued in accordance with NATA's accreditation requirements. Accredited for compliance with ISO/IES 17025. The results of the tests, calibrations, and/or measurements included in this document are traceable to Australian/National Standards.
Authorised Signatory
C. Channon
ACCURATE QUALITY RESULTS FOR TOMORROW'S ENGINEERING

www.trilab.com.au
Brisbane10/104 Newmarket Rd, Windsor QLD 4030 Ph: +61 7 3357 5535
Perth2 Kimmer Place, Queens Park WA 6107 Ph: +61 8 9258 8323
chrisc 1919
James
Client Report No.
Project Test DateReport Date
Sample No. 11110202 11110203 11110204 11110205 11110206 11110207
Client ID TP2 TP5 TP6 TP7 TP9 TP12
Depth (m) 0.1 0.1 0.1 0.1 0.1 0.1
Description
Emerson Class Number 5 5 5 5 5 5
Sample No.
Client ID
Depth (m)
Description
Emerson Class Number
Sample No.
Client ID
Depth (m)
Description
Emerson Class Number
NOTES/REMARKS:
Sample/s supplied by the client Tested with Distilled water at 21.3°C Page 1 of 1 REP00401
Laboratory No. 9926
EMERSON CLASS NUMBER TEST REPORTTest Method: AS 1289 3.8.1
GHD Services Pty Ltd
FMG-Mine Closure - Topsoil - North Star
P 11110202-EM
01/12/201126/11/2011
Trilab Pty Ltd ABN 25 065 630 506 Reference should be made to Trilab's “Standard Terms and Conditions of Business” for further details.
The results of calibrations and tests performed apply only to the specific instrument or sample at the time of test unless otherwise clearly stated.
This document is issued in accordance with NATA's accreditation requirements. Accredited for compliance with ISO/IES 17025. The results of the tests, calibrations, and/or measurements included in this document are traceable to Australian/National Standards.
Authorised Signatory
C. Channon
ACCURATE QUALITY RESULTS FOR TOMORROW'S ENGINEERING

www.trilab.com.au
Brisbane10/104 Newmarket Rd, Windsor QLD 4030 Ph: +61 7 3357 5535
Perth2 Kimmer Place, Queens Park WA 6107 Ph: +61 8 9258 8323
chrisc 1919
Client Report No.
Project Test DateReport Date
Client ID TP5 Depth (m)Sieve Size Passing
(mm) %150.0
75.0
53.0 100
37.5 92
26.5 88
19.0 80
9.5 65
4.75 42
2.36 25
1.18 17
0.600 15
0.425 14
0.300 14
0.150 13
0.075 11
0.059 8
0.042 7
0.031 6
0.022 6
0.016 5
0.012 5
0.0083 4
0.0059 4
0.0042 4
0.0034 3
0.003 3
0.0024 3
0.0021 3
0.0012 2
NOTES/REMARKS: Upper line: + dispersant, Lower line: - dispersantMoisture Content 0.9% -2.36mm Soil Particle Density (t/m3) 3.17Sample/s supplied by the client Page 1 of 1 REP03801
Laboratory No. 9926
Trilab Pty Ltd ABN 25 065 630 506 Reference should be made to Trilab's “Standard Terms and Conditions of Business” for further details.
The results of calibrations and tests performed apply only to the specific instrument or sample at the time of test unless otherwise clearly stated.
PARTICLE SIZE DISTRIBUTION
Test Method: AS 1289 3.8.2PERCENTAGE DISPERSION TEST REPORT
DISPERSION (%) : 40.0
with
GHD Services Pty Ltd
FMG-Mine Closure - Topsoil - North Star
0.1
1/12/20115/12/2011
P 11110203-%D
0
10
20
30
40
50
60
70
80
90
100
0.001 0.01 0.1 1 10 100
Pass
ing
(%)
Particle Size (mm)
This document is issued in accordance with NATA's accreditation requirements. Accredited for compliance with ISO/IES 17025. The results of the tests, calibrations, and/or measurements included in this document are traceable to Australian/National Standards.
Authorised Signatory
C. Channon
ACCURATE QUALITY RESULTS FOR TOMORROW'S ENGINEERING

www.trilab.com.au
Brisbane10/104 Newmarket Rd, Windsor QLD 4030 Ph: +61 7 3357 5535
Perth2 Kimmer Place, Queens Park WA 6107 Ph: +61 8 9258 8323
chrisc 1919
Client Report No.
Project Test DateReport Date
Client ID TP6 Depth (m)Sieve Size Passing
(mm) %150.0
75.0
53.0
37.5
26.5
19.0 100
9.5 87
4.75 79
2.36 75
1.18 71
0.600 63
0.425 57
0.300 51
0.150 38
0.075 28
0.068 25
0.049 21
0.035 18
0.025 17
0.018 15
0.013 14
0.0095 12
0.0068 10
0.0048 10
0.004 8
0.0034 7
0.0028 7
0.0024 4
0.0014 3
NOTES/REMARKS: Upper line: + dispersant, Lower line: - dispersantMoisture Content 0.6% -2.36mm Soil Particle Density (t/m3) 2.68Sample/s supplied by the client Page 1 of 1 REP03801
Laboratory No. 9926
Trilab Pty Ltd ABN 25 065 630 506 Reference should be made to Trilab's “Standard Terms and Conditions of Business” for further details.
The results of calibrations and tests performed apply only to the specific instrument or sample at the time of test unless otherwise clearly stated.
PARTICLE SIZE DISTRIBUTION
Test Method: AS 1289 3.8.2PERCENTAGE DISPERSION TEST REPORT
DISPERSION (%) : 59.0
with
GHD Services Pty Ltd
FMG-Mine Closure - Topsoil - North Star
0.1
1/12/20115/12/2011
P 11110204-%D
0
10
20
30
40
50
60
70
80
90
100
0.001 0.01 0.1 1 10 100
Pass
ing
(%)
Particle Size (mm)
This document is issued in accordance with NATA's accreditation requirements. Accredited for compliance with ISO/IES 17025. The results of the tests, calibrations, and/or measurements included in this document are traceable to Australian/National Standards.
Authorised Signatory
C. Channon
ACCURATE QUALITY RESULTS FOR TOMORROW'S ENGINEERING

www.trilab.com.au
Brisbane10/104 Newmarket Rd, Windsor QLD 4030 Ph: +61 7 3357 5535
Perth2 Kimmer Place, Queens Park WA 6107 Ph: +61 8 9258 8323
chrisc 1919
Client Report No.
Project Test DateReport Date
Client ID TP7 Depth (m)Sieve Size Passing
(mm) %150.0
75.0
53.0
37.5
26.5
19.0
9.5
4.75
2.36 100
1.18 99
0.600 91
0.425 82
0.300 67
0.150 40
0.075 28
0.071 25
0.051 21
0.036 18
0.026 16
0.019 16
0.014 14
0.0098 14
0.007 12
0.005 11
0.0041 10
0.0035 10
0.0029 9
0.0025 8
0.0015 6
NOTES/REMARKS: Upper line: + dispersant, Lower line: - dispersantMoisture Content 0.7% -2.36mm Soil Particle Density (t/m3) 2.58Sample/s supplied by the client Page 1 of 1 REP03801
Laboratory No. 9926
Trilab Pty Ltd ABN 25 065 630 506 Reference should be made to Trilab's “Standard Terms and Conditions of Business” for further details.
The results of calibrations and tests performed apply only to the specific instrument or sample at the time of test unless otherwise clearly stated.
PARTICLE SIZE DISTRIBUTION
Test Method: AS 1289 3.8.2PERCENTAGE DISPERSION TEST REPORT
DISPERSION (%) : 26.0
with
GHD Services Pty Ltd
FMG-Mine Closure - Topsoil - North Star
0.1
1/12/20116/12/2011
P 11110205-%D
0
10
20
30
40
50
60
70
80
90
100
0.001 0.01 0.1 1 10
Pass
ing
(%)
Particle Size (mm)
This document is issued in accordance with NATA's accreditation requirements. Accredited for compliance with ISO/IES 17025. The results of the tests, calibrations, and/or measurements included in this document are traceable to Australian/National Standards.
Authorised Signatory
C. Channon
ACCURATE QUALITY RESULTS FOR TOMORROW'S ENGINEERING

www.trilab.com.au
Brisbane10/104 Newmarket Rd, Windsor QLD 4030 Ph: +61 7 3357 5535
Perth2 Kimmer Place, Queens Park WA 6107 Ph: +61 8 9258 8323
chrisc 1919
Client Report No.
Project Test DateReport Date
Client ID TP9 Depth (m)Sieve Size Passing
(mm) %150.0
75.0
53.0
37.5
26.5
19.0 100
9.5 97
4.75 86
2.36 79
1.18 76
0.600 69
0.425 62
0.300 52
0.150 33
0.075 20
0.07 15
0.05 14
0.035 12
0.025 12
0.018 12
0.013 10
0.0095 10
0.0068 8
0.0048 8
0.0039 7
0.0034 7
0.0028 6
0.0024 6
0.0014 3
NOTES/REMARKS: Upper line: + dispersant, Lower line: - dispersantMoisture Content 0.6% -2.36mm Soil Particle Density (t/m3) 2.69Sample/s supplied by the client Page 1 of 1 REP03801
Laboratory No. 9926
PARTICLE SIZE DISTRIBUTION
Test Method: AS 1289 3.8.2PERCENTAGE DISPERSION TEST REPORT
DISPERSION (%) : 25.0
with
GHD Services Pty Ltd
FMG-Mine Closure - Topsoil - North Star
0.1
1/12/20116/12/2011
P 11110206-%D
Trilab Pty Ltd ABN 25 065 630 506 Reference should be made to Trilab's “Standard Terms and Conditions of Business” for further details.
The results of calibrations and tests performed apply only to the specific instrument or sample at the time of test unless otherwise clearly stated.
0
10
20
30
40
50
60
70
80
90
100
0.001 0.01 0.1 1 10 100
Pass
ing
(%)
Particle Size (mm)
This document is issued in accordance with NATA's accreditation requirements. Accredited for compliance with ISO/IES 17025. The results of the tests, calibrations, and/or measurements included in this document are traceable to Australian/National Standards.
Authorised Signatory
C. Channon
ACCURATE QUALITY RESULTS FOR TOMORROW'S ENGINEERING

www.trilab.com.au
Brisbane10/104 Newmarket Rd, Windsor QLD 4030 Ph: +61 7 3357 5535
Perth2 Kimmer Place, Queens Park WA 6107 Ph: +61 8 9258 8323
chrisc 1919
Client Report No.
Project Test DateReport Date
Client ID TP12 Depth (m)Sieve Size Passing
(mm) %150.0
75.0
53.0
37.5
26.5 100
19.0 83
9.5 53
4.75 41
2.36 37
1.18 34
0.600 32
0.425 31
0.300 30
0.150 27
0.075 22
0.06 17
0.044 14
0.032 13
0.023 11
0.017 10
0.012 9
0.0088 8
0.0063 7
0.0045 6
0.0037 6
0.0032 6
0.0026 5
0.0023 5
0.0013 4
NOTES/REMARKS: Upper line: + dispersant, Lower line: - dispersantMoisture Content 0.6% -2.36mm Soil Particle Density (t/m3) 2.87Sample/s supplied by the client Page 1 of 1 REP03801
Laboratory No. 9926
Trilab Pty Ltd ABN 25 065 630 506 Reference should be made to Trilab's “Standard Terms and Conditions of Business” for further details.
The results of calibrations and tests performed apply only to the specific instrument or sample at the time of test unless otherwise clearly stated.
PARTICLE SIZE DISTRIBUTION
Test Method: AS 1289 3.8.2PERCENTAGE DISPERSION TEST REPORT
DISPERSION (%) : 0.0
with
GHD Services Pty Ltd
FMG-Mine Closure - Topsoil - North Star
0.1
1/12/20116/12/2011
P 11110207-%D
0
10
20
30
40
50
60
70
80
90
100
0.001 0.01 0.1 1 10 100
Pass
ing
(%)
Particle Size (mm)
This document is issued in accordance with NATA's accreditation requirements. Accredited for compliance with ISO/IES 17025. The results of the tests, calibrations, and/or measurements included in this document are traceable to Australian/National Standards.
Authorised Signatory
C. Channon
ACCURATE QUALITY RESULTS FOR TOMORROW'S ENGINEERING

North Star Landform and Soil Report
NS-RP-EN-0004_Rev 0
Appendix 2: Soil Test Pit Logs

North Star Landform and Soil Report
NS-RP-EN-0004_Rev 0
This page has been left blank intentionally

Site Description Sheet
Client: Fortescue Metals
Date: 15/10/11 Site: TP1 N.S. 1st of day WP 60
Location: Capricorn L.S. Drill Line 50.6 Map Reference: S 712300 E 7650620
Micro Relief:Rock fragments, Course 10 – 20cmIronstone, platy to sub-angular blocky Run-off: Rapid
Permeability: High Permeability Erosion:
Drainage: Well Drained S C Fragments: 90% Iron formation
Substrate:Fine sandstone (white) and shale(blue) Rock Outcrops: 10% R.O. – Iron formation
Site Disturbance: 0 (only drill pad) Surface Condition: H
Landform
Slope: (%) *22 - 21 Morphological Type: U
Relief: 90 – 300m – HILL Landform Element:HSL/DDE – Upper reaches ofdrainage line on plateau
Elevation: 376.2m +- 4.3 Landform Pattern Type: DDE on plateau
Soil Description
Horizon Depth (m) Boundary Colour Mottles Texture CoarseFragments Structure Segregations Consistency Field
pH
A 0 – 10 C/wavy 2.5YR43 0 KSCL Platy shale 40% G 0 D4-5 0.5 – 6.5
C 10 – 60 D 0 Platy shale 80% V 0 D5
R 60 - 0 Platy shale 90%* V 0 D6 – hard rock
Notes:- shallow soil over moderately weathered rock.*22 – 21 – looking up 2 different slopes*90% hard fresh rock

Site Description Sheet
Client: Fortescue Metals
Date: 15/10/11 Site: TP2 –North Star 61
Location: Capricorn Drill line 50.2 Map Reference: S 712801 E 7650792
Micro Relief:Stony mulch, shale and mudstone insoil as well banded Run-off: Rapid
Permeability: Moderate – high Erosion:
Drainage: Well drained S C Fragments:95% Iron formation, sub-angularto platy 0 – 10cm
Substrate: HSL Rock Outcrops: Small areas
Site Disturbance: 0 Surface Condition: H (hard coarse fragments)
Landform
Slope (%): Morphological Type: Upper slope on hillcrest/plateau
Relief: Landform Element: HSL
Elevation: 400.8 +- 4.4 Landform Pattern Type: Hills – Undulating plateau
Soil Description
Horizon Depth (m) Boundary Colour Mottles Texture Coarse Fragments Structure Segregations Consistency FieldpH
A 0 – 10 D 5YR44 0 FSCL30% IS Angular/platy
1-10cm G 0 D very hard
B 10 – 80 5YR44 0 FSCL90% IS angular/platy
5-20cm V 0*D loosematerial
Notes:
No tilting on this materialIS capping on the hills to the east of North Star well layered clear horizontallyGully steepens towards escarpmentThen cut into escarpmentShallow gullies dissecting plateau gullies head E to N*rock fragments

Site Description Sheet
Client: Fortescue Metals
Date: 15/10/11 Site: TP3 North Star
Location: Capricorn L.S WP 63 Map Reference: S 7647832 E 713505
Micro Relief: Rock outcrops, stony mulch, Run-off: Rapid
Permeability: Moderate Erosion: Active sheet flow and gully flow
Drainage: Well Drained S C Fragments:
2 – 10cm Angular, sometimesplaty chert shale and blackmaterial
Substrate: Shale, sandstone Rock Outcrops: 30% IS (BIF)
Site Disturbance: 0 – drill pad Surface Condition: L
Landform
Slope (%): 20 Morphological Type: M
Relief: Landform Element: HSL
Elevation: 390.3 +- 5.2 Landform Pattern Type: LOW
Soil Description
Horizon Depth (m) Boundary Colour Mottles Texture CoarseFragments Structure Segregations Consistency Field
pH
A 0 –0. 5 S 2.5YR46 0 MC50 – 90% mulch
gravel angular 1-5cm WSB 1 – 2cm 0 D4
R* 0.5 – 1.0 0 Rock fresh 0
Notes:
R* or C*BIF upslope, folded/faulted

Site Description Sheet
Client: Fortescue Metals
Date: 15/10/11 Site: TP4 – N.S. 3.45
Location: Capricorn L.S. WP65 Map Reference: S 711201 E 7651629
Micro Relief: Stony mulch Run-off: Moderate
Permeability: Moderate Erosion: Sheet flow
Drainage: Moderately rapid S C Fragments: 80% sub-angular mixed geology
Substrate: Alluvium/colluvium Rock Outcrops:
Site Disturbance: 0 Surface Condition: L
Landform
Slope (%): 3 Morphological Type: F
Relief: Hills Landform Element: VLF with undulating rises
Elevation: 282 +-5.0 Landform Pattern Type: HILLS
Soil Description
Horizon Depth (m) Boundary Colour Mottles Texture CoarseFragments Structure Segregations Consistency Field
pH
A1 0 -1- D 7.5YR33 0 KSLA50% SA 0-5cmmixed geology G 0 D2 0 – 6.5
A3/B1 20 - 5YR44 020% SA 2-5cmmixed geology G 0 D2 30 – 7.0
Notes:
Down to 42cm

Site Description Sheet
Client: Fortescue Metals
Date: 16/10/11 Site: TP5 – N.S (West Star) WP 97
Location:West Star – Plateau 3% alongplateau Map Reference: S 7650796 E 710817
Micro Relief: Stony mulch Run-off: Rapid
Permeability: Moderately permeable Erosion: Minor sheet erosion
Drainage: Rapid S C Fragments: 95% 2-5cm IS nodules (angular)
Substrate: Goethite (yellow oaky rock) Rock Outcrops: 5%
Site Disturbance: 0 – drill pad Surface Condition: H
Landform
Slope (%): 3 Morphological Type: C
Relief: 90 – 300 Landform Element: HCR
Elevation: 382.5 +- 5.0 Landform Pattern Type: HILL
Soil Description
Horizon Depth (m) Boundary Colour Mottles Texture CoarseFragments Structure Segregations Consistency Field
pH
A 0 – 40 C and wavy 2.5YR36 0 CL 60% IS 1-5cm V 0 D3-4 05 – 6.5
C/R 40 – PM 0 Hard rock and V 0 D6 30 – 7.0
some course
fragments at P.M.
Notes:
Red A horizon over weathered rock

Site Description Sheet
Client: Fortescue Metals
Date: 17/10/11 Site: TP6 N.S.-TSF (western end)
Location: Capricorn L.S. WP100 Map Reference: S 7653165 E 711372
Micro Relief: Stony Run-off: Rapid
Permeability: Low to moderate due to C/R Erosion: Restricted to adjacent gullies
Drainage: Well drained S C Fragments:100% stony sub-angular C Frags2-5cm
Substrate: Sandstone Rock Outcrops:
Site Disturbance: 0 – test pit only Surface Condition: H
Landform
Slope (%): 10 + 2 Morphological Type: L
Relief: LOW Landform Element: HSL
Elevation: 254.5 +- 4.3 Landform Pattern Type: LOW
Soil Description
Horizon Depth (m) Boundary Colour Mottles Texture CoarseFragments Structure Segregations Consistency Field
pH
A 0 – 5 C 2.5YR44 0 KSL 60% sandstone V 0 D2 0.5 – 7.5
C/R* 0.5 – 0.6 0 1-5cm grey shale/ V 0 D6
Sandstone
Sub-angular
Notes:
*rock (partially weathered)Coarse Fragments also have cobbles

Site Description Sheet
Client: Fortescue Metals
Date: 17/10/11 Site: TP7 WP 101
Location: North Star – TSF-East of Spinifex Hill Map Reference: S 7651148 E 0714080
Micro Relief: Stony mulch Run-off: Moderately rapid
Permeability: Slow due to rock Erosion:
Drainage: Imperfect S C Fragments:Siliceous & non-siliceous rock –sub-angular 15-10cm and 0.5-1.0
Substrate: Pale blue – igneous intrusive Rock Outcrops:
Site Disturbance: 0 Surface Condition: H
Landform
Slope (%): 3 Morphological Type:
Relief: Landform Element:
Elevation: 286m +- 4.0 Landform Pattern Type: VLF with rises (close to dykes)
Soil Description
Horizon Depth (m) Boundary Colour Mottles Texture CoarseFragments Structure Segregations Consistency Field
pH
A 0 -5 D 5YR34 0 KLS 5% gravel WSB 0 D2
C/R 5 -70 0 Hard rock 0 D6
Same as P.M.
1-2cm
Notes:

Site Description Sheet
Client: Fortescue Metals
Date: 17/10/11 Site: TP8 West of 1 – way
Location: Capricorn L.S. WP 103 Map Reference: S 7650923 E 0714694
Micro Relief: Stony mulch Run-off: Rapid
Permeability: Slowly permeable Erosion:Sheet flow (some sorting ofsurface)
Drainage: S C Fragments:Fine greenstone with (1-5cm)gravel
Substrate: Weathered intrusive Rock Outcrops:
Site Disturbance: 0 Surface Condition: H
Landform
Slope (%): 2-3 Morphological Type: L – Mid-slope
Relief: Hills Landform Element: HSL
Elevation: 288 +- 4.6m Landform Pattern Type: VFL
Soil Description
Horizon Depth (m) Boundary Colour Mottles Texture CoarseFragments Structure Segregations Consistency Field
pH
A 0 – 15 C 7.5YR33 0 KSLMC1-5cm 25%mixed geol 1-2cm WSB Fine IS segs D2 5 – 7.0
B2/3 15 – 50 A 2.5YR34 0 KSLMC V 0 D4 30 – 7.5
C 50 - Grey deco V D6
Notes:
Minor sheet flow entering into minor DDESheet flow would not travel too far.VFL has a lot of relief in it +- minor flow linesVFL with surrounding hillsWeathered rock below CNetwork of water courses
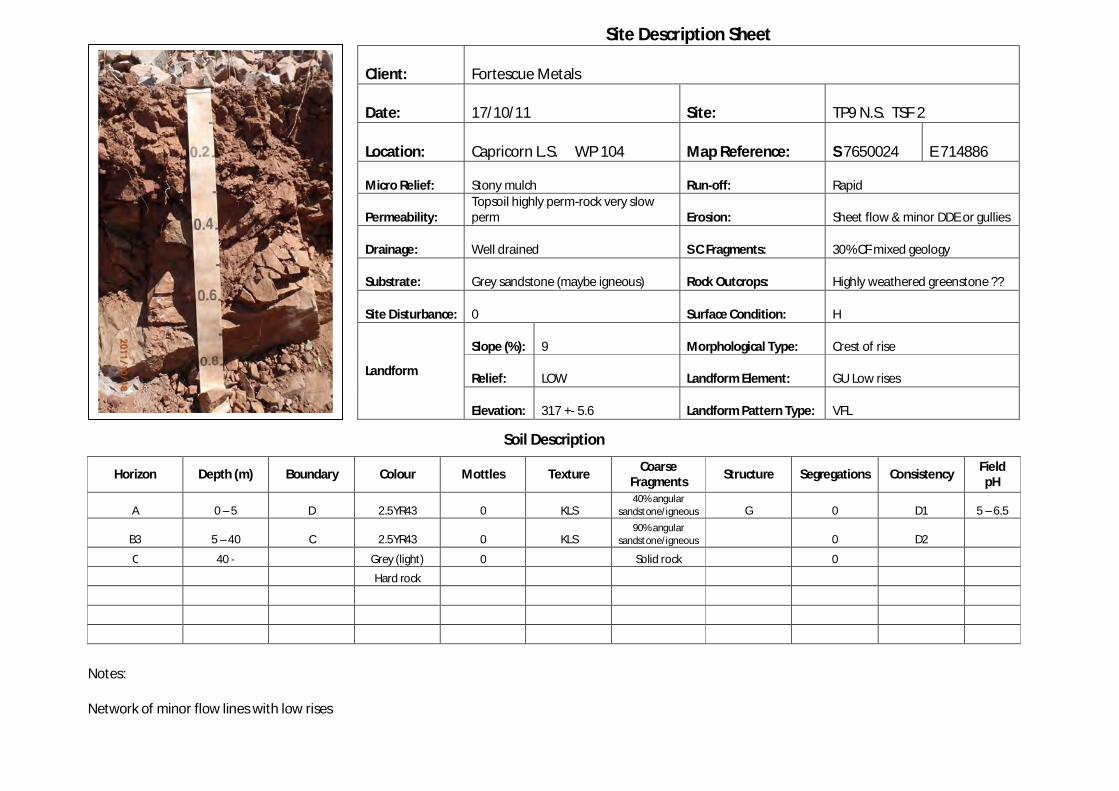
Site Description Sheet
Client: Fortescue Metals
Date: 17/10/11 Site: TP9 N.S. TSF 2
Location: Capricorn L.S. WP 104 Map Reference: S 7650024 E 714886
Micro Relief: Stony mulch Run-off: Rapid
Permeability:Topsoil highly perm-rock very slowperm Erosion: Sheet flow & minor DDE or gullies
Drainage: Well drained S C Fragments: 30% CF mixed geology
Substrate: Grey sandstone (maybe igneous) Rock Outcrops: Highly weathered greenstone ??
Site Disturbance: 0 Surface Condition: H
Landform
Slope (%): 9 Morphological Type: Crest of rise
Relief: LOW Landform Element: GU Low rises
Elevation: 317 +- 5.6 Landform Pattern Type: VFL
Soil Description
Horizon Depth (m) Boundary Colour Mottles Texture CoarseFragments Structure Segregations Consistency Field
pH
A 0 – 5 D 2.5YR43 0 KLS40% angular
sandstone/igneous G 0 D1 5 – 6.5
B3 5 – 40 C 2.5YR43 0 KLS90% angular
sandstone/igneous 0 D2
C 40 - Grey (light) 0 Solid rock 0
Hard rock
Notes:
Network of minor flow lines with low rises

Site Description Sheet
Client: Fortescue Metals
Date: 17/10/11 Site:TP 10 N.S Line 47.something
Location: Capricorn L.S. WP 106 Map Reference: S 7647055 E 0713492
Micro Relief: Stony mulch Run-off: Rapid
Permeability: Moderate Erosion: Sheet flow
Drainage: Well drained S C Fragments: 95%sub-angular BIF 2-5cm
Substrate: Goethite, iron enriched silica & shale Rock Outcrops: 30% rock outcrop BIF
Site Disturbance: 0 Surface Condition: H
Landform
Slope (%): 4 Morphological Type: U
Relief: LOW Landform Element: HSL
Elevation: 410m +- 3.9 Landform Pattern Type: LOW
Soil Description
Horizon Depth (m) Boundary Colour Mottles Texture CoarseFragments Structure Segregations Consistency Field
pH
A 0 – 4 D 2.5YR34 0 KSL 25% SA PM 1-2cm WSB 0 D@ 05 – 6.0
B3 4 – 25 C 2.5YR36 0 KSL40% SA PM 0-
1cm V 0 D4 30 – 6.0
C 25 - 0 V 0 D6
Notes:

Site Description Sheet
Client: Fortescue Metals
Date: 17/10/11 Site: TP11 N.S. 0.1 (glacial valley)
Location:Capricorn L.S. ph(346 west)ph(347 north) Map Reference: S 7644404 E 0714037
Micro Relief: Stony mulch Run-off: Rapid
Permeability: Moderate Erosion: Sheet flow
Drainage: Medium to rapid S C Fragments: 95% IS % BIFF 5-10cm angular
Substrate: Quartz, rhyolite?, BIF, goethite Rock Outcrops: 10% BIF
Site Disturbance: 0 Surface Condition: H
Landform
Slope (%): 5 Morphological Type: U
Relief: Landform Element: HSL
Elevation: 423 +- 4.0m Landform Pattern Type: Ridge line hill (on plateau)
Soil Description
Horizon Depth (m) Boundary Colour Mottles Texture CoarseFragments Structure Segregations Consistency Field
pH
A 0 - 3 A 5YR34 0 SL 40% mixed V Fine IS segs 1-2m DA 05 – 6.5
C 3 -
Notes:
May stabilize sites C – Bif and other decomposing rockSkeletal soilRock may be useful as rock mulch for reconstructed landforms….or cutting unavailable

Site Description Sheet
Client: Fortescue Metals
Date: 17/10/11 Site:TP12 N.S. North end ofWest Star
Location: Capricorn L.S. WP 113 Map Reference: S 7651633 E 0709242
Micro Relief: Stony mulch Run-off: Moderate – rapid
Permeability: Moderate permeability Erosion: Sheet flow
Drainage: Well drained S C Fragments:BIF, Ironstone, folded & faultedoutcrop
Substrate: Mudstone, siltstone or fire sandstone Rock Outcrops: BIF goethite 60%
Site Disturbance: 0 Surface Condition: H
Landform
Slope (%): 6 Morphological Type: U
Relief: Hills Landform Element: HSL
Elevation: 380m +- 4.8 Landform Pattern Type: Hills
Soil Description
Horizon Depth (m) Boundary Colour Mottles Texture CoarseFragments Structure Segregations Consistency Field
pH
A 0 – 15 C 5YR33 0 FSCL 80% shale WPO 0 D3 5.0-6.5
B# 15 – 1.20 5YR33 0 FSCL 90% rock V 0 D4
Hard PM V 0 D7
Moderately
weathered
Notes:Georthite nearbyP.M. mudstone/siltstoneFine sandstone

Site Description Sheet
Client:
Date: Site:
Location: Map Reference: S E
Micro Relief: Run-off:
Permeability: Erosion:
Drainage: S C Fragments:
Substrate: Rock Outcrops:
Site Disturbance: Surface Condition:
Landform
Slope (%): Morphological Type:
Relief: Landform Element:
Elevation: Landform Pattern Type:
Soil Description
Horizon Depth (m) Boundary Colour Mottles Texture CoarseFragments Structure Segregations Consistency Field
pH
Notes:

North Star Landform and Soil Report
NS-RP-EN-0004_Rev 0
This page has been left blank intentionally

North Star Landform and Soil Report
NS-RP-EN-0004_Rev 0
Appendix 3: Soil Dispersion Category Descriptions

North Star Landform and Soil Report
NS-RP-EN-0004_Rev 0
This page has been left blank intentionally

Dispersion Percentage Classifications
(Baker and Eldershaw 1993)
Low Dispersion (%) Moderate High
R </= 60% 60-80% > 80%
Emerson Classes (Hazelton and Murphy 2007)
Dispersibility Emerson Aggregate Classes
Very High 1 and 2 (3)
High 2 (2)
High to Moderate 2 (1)
Moderate 3 (4) and 3 (3)
Slight 3 (2), 3 (1) and 5
Negligible/aggregated 4,6,7,8
Emerson Class Descriptions (Hazelton and Murphy 2007)
Class 1 Aggregates most certainly indicate high tunnelling susceptibility.
Class 2 Aggregates indicate some degree* of tunnelling susceptibility.
2(1) Desirable for water storage structures to ensure sealing.
2(2) Unstable**
2(3) Unstable**
Class 3 Aggregates generally stable and indicate a more desirable material forconservation earthworks (if surface soils containing Class 3 aggregates arecultivated, crusting may become a problem).
3(1) Most suitable for earthworks.
3(2) Most suitable for earthworks.
3(3) **
3(4) **
Class 4*** Aggregated materials may not hold water in a dam, depending on particlesize distribution and degree of dispersion.
Class 5*** Aggregated materials may not hold water in a dam, depending on particlesize distribution and degree of dispersion.
Class 6 Aggregated materials unlikely to hold water in a dam.