north of the delta offstream storage investigation project docs/no… · north of the delta...
TRANSCRIPT

North of the Delta Offstream Storage Investigation
DRAFT 34
Other Regional StructuresOther regional structures besides faults include folds and joints. Regional
folds generally trend in the same northwest direction as the regional faults. Some ofthe folds, such as Corning and Dunnigan Hills, are probably the surface expressionof deeper movements along faults. Regional folds are consistent with a compressivestress regime oriented about N75E.
The largest structure is the synclinal fold of the Sacramento Valley. On thewest side, the Cretaceous mudstone, sandstone, and conglomerate dip moderatelyto steeply east and strike northwest. On the east side, similar beds dip to the westand strike in about the same direction.
The Chico monocline occurs along the east side of the valley between Chicoand Red Bluff. Along the east side, beds dip shallowly to the west, but at the axis ofthe monocline, the beds dip more steeply toward the center of the valley. The axisis also displaced by numerous faults trending parallel to the axial plane.
Jointing is pervasive in the GVS but is generally not present in rocks youngerthan the Cretaceous. The Cretaceous mudstones are generally the most jointed.Jointing sets in three directions, and spacings from less than an inch to about a footare common. The joint directions are perpendicular to each other with one setparallel to the bedding and the other two sets perpendicular to the bedding and toeach other. The pervasive jointing causes the exposed mudstone outcrops to slakereadily.
The Cretaceous sandstones and conglomerates vary in joint spacingdepending mostly on the thickness of the individual beds. Joint directions aresimilar to the mudstones. The massive units have joint spacings ranging from a fewfeet to several tens of feet or more.
SeismicityThe seismicity of the western Sacramento Valley foothills has been recorded
by a number of different agencies over the last 100 years. These agencies includethe University of California, Berkeley, the California Department of Conservation,USGS, and DWR. The accuracy in the measurements of the epicenters, focii, andmagnitude has improved over the years as more instruments with greater sensitivityand accuracy have been installed. The older data were recorded with instrumentslocated several hundred miles away. Consequently, the plotted locations of seismicevents may be off by tens of miles.
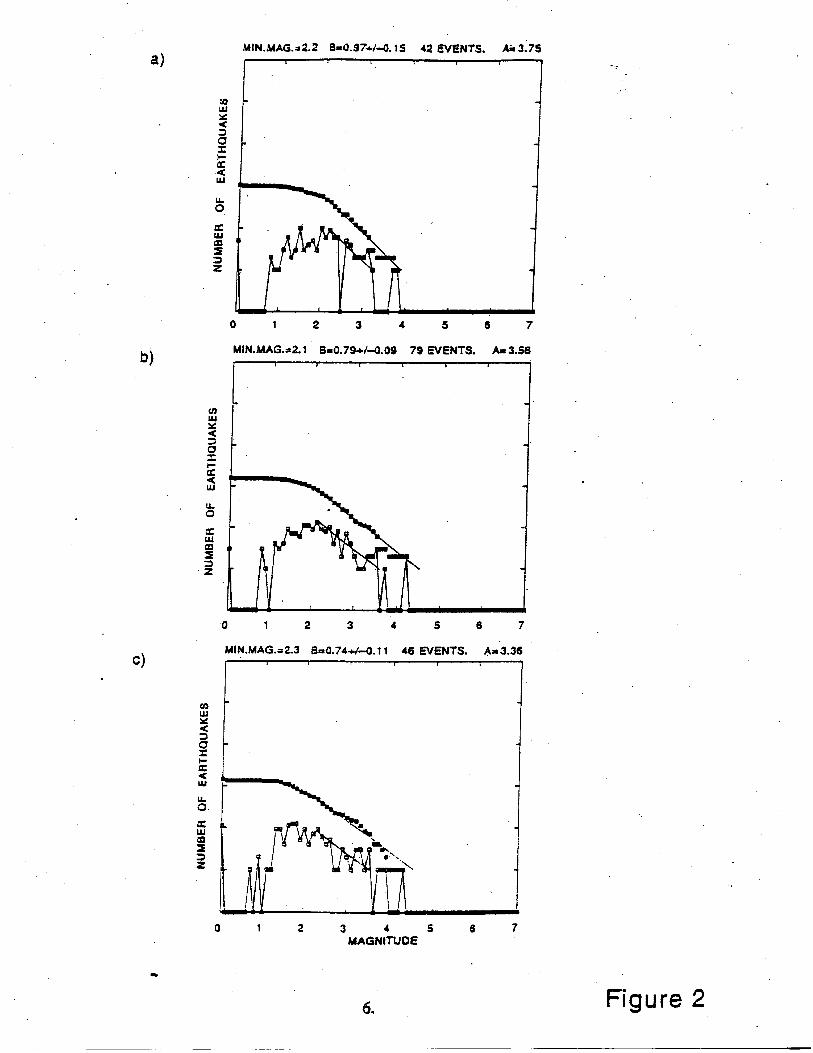
Earthquakes as small as M1 and M2 have been recorded in the project areasince the installation of the Northern California Seismic Network beginning in1975 (Attachment A). The appendix includes an analysis of earthquake activity todate. DWR, in 1991, as part of the Red Bank Project, worked with USGS to installfour additional seismic stations in the area. Accuracy in the plotting of epicenterswith the data from these stations can be within several miles for relatively smallearthquakes occurring close by. USGS provided DWR with an analysis of the datarecorded to date by the network.
According to USGS, the number of earthquakes recorded by the network istypically three or less and often zero per month.
Appendix O: Phase 1 Fault and Seismic Hazards Investigation
DRAFT 35
Historical EarthquakesHistorical seismic activity for the last 200 years or so in the central and
northern part of the Sacramento Valley has been low to moderate compared toother areas of California. Events in Northern California larger than M6 haveoccurred in the San Francisco Bay region, near Eureka, north of Tahoe, and in theVacaville-Winters area. Events larger than M7 occurred in Eureka in 1923 and1992, and in the San Francisco area in 1868, 1906, and 1989.
Major fault zones known to be seismically active near the project area includethe Foothills fault system, the Chico monocline, the blind thrusts of the GreatValley fault, the Willows and Corning faults, the Bartlett Springs, Maacama, andSan Andreas faults, and the Cascadia subduction zone.
The Winters-Vacaville earthquakes of April 19-21, 1892, are the twoearthquakes with the most significant impact on the design of the proposedprojects, particularly Thomes-Newville, Sites, and Colusa. This is because theproposed dams and structures are overlying the same Great Valley fault (CoastRanges-Sierra Nevada block boundary) that is believed to have been the cause ofthe earthquakes. This zone is believed to extend the entire length of the greaterCentral Valley. A similar temblor (M6.7) to the Winters-Vacaville earthquakesoccurred in 1983, causing considerable damage in the Coalinga area.
The two major Winters-Vacaville temblors and numerous aftershocksproduced widespread damage throughout much of Solano, Yolo, and NapaCounties. The towns of Winters, Vacaville, and Dixon suffered massive destructionwith intensities reaching MM IX and estimated magnitudes between six and seven(DWR 1978).
On January 7, 1881, an estimated M5 occurred east of Red Bluff at the edgeof the Cascade Range. On June 6, 1884, an estimated M5 occurred near or northof Red Bluff. One wall cracked. An M4.5 occurred in the Willows area on July 24,1903, with some cracking and falling plaster. An MM VI event occurred on April16, 1904, south of Redding. An M5.7 occurred northeast of Chico on February 8,1940, and an M4.6 near Chico in 1966. Both of these were probably associatedwith the Chico monocline. An M4.7 event occurred on April 29, 1968, nearWillows (Wong 1988).
On August 1, 1975 an M5.7 occurred near Oroville on the Cleveland Hillsfault. This quake renewed interest in the Foothills fault system and speculationsabout RIS related to Lake Oroville.
Several earthquakes have occurred fairly recently near Redding, Chico,Cottonwood, and Willows. A series of earthquakes, including an M5.2 thatoccurred in November 1998, struck the Redding area over a period of months.Historic earthquakes of M6+ have occurred both in the valley and in the CoastRanges to the west.
Earthquake Design CriteriaThe MCE measure is used because the likelihood of such earthquakes
occurring is great enough, and the probability of certain faults being active andtheir recurrence rates are not known for most faults. The MCE implicitly takes intoaccount such factors. The resultant ground motions from MCE are the most

North of the Delta Offstream Storage Investigation
DRAFT 36
appropriate consideration for critical structures and for public safety because theyare considered to be conservative.
Hazards relating to earthquakes include surface rupture, soil liquefaction, andshaking. Generally, ground shaking is the predominant source of earthquakedamage, resulting in 90 percent or more of the damage; but in areas withliquefaction potential, damage can increase commensurately. Surface rupturegenerally results in less than 5 percent of the damage. Neither surface ruptures norliquefaction is considered to be a likely cause of damage to the proposed projects.
The magnitude or local magnitude of an earthquake is defined as thelogarithm to the base 10 of the amplitude, in microns, of the largest tracedeflection observed on a standard torsion seismograph at a distance of 100 kmfrom the epicenter. The moment magnitude is a newer concept calculated frommodern seismographs, taking into account all the seismic waves; or it can beestimated based on the rupture area (MW=4.07+0.98log(lw)). This estimated valueis used when historic earthquakes or potential earthquakes lacking instrument dataare evaluated.
CDMG (1996) published a probabilistic seismic hazard map showing peakhorizontal ground acceleration on uniform soft-rock sites. The values have a10 percent probability of exceedance in 50 years. Acceleration at 10 percent in50 years ranges from about 0.1 to over 1g. The map shows that the damsites lie in azone with a 50-year recurrence interval of between 0.1 and 0.3 g. CDMG alsodeveloped a map showing areas that are thought to have experienced an intensity ofMM VII or greater between 1800 and 1996. This includes most of the northcoastal area but is somewhat west of the proposed damsites.
Seismic Stations and Microseismic NetworksFigure 9 shows the seismic stations in Northern California. The majority of
stations are clustered around preexisting reservoirs such as Lake Shasta, LakeOroville, Stony Gorge Reservoir, and Clear Lake.
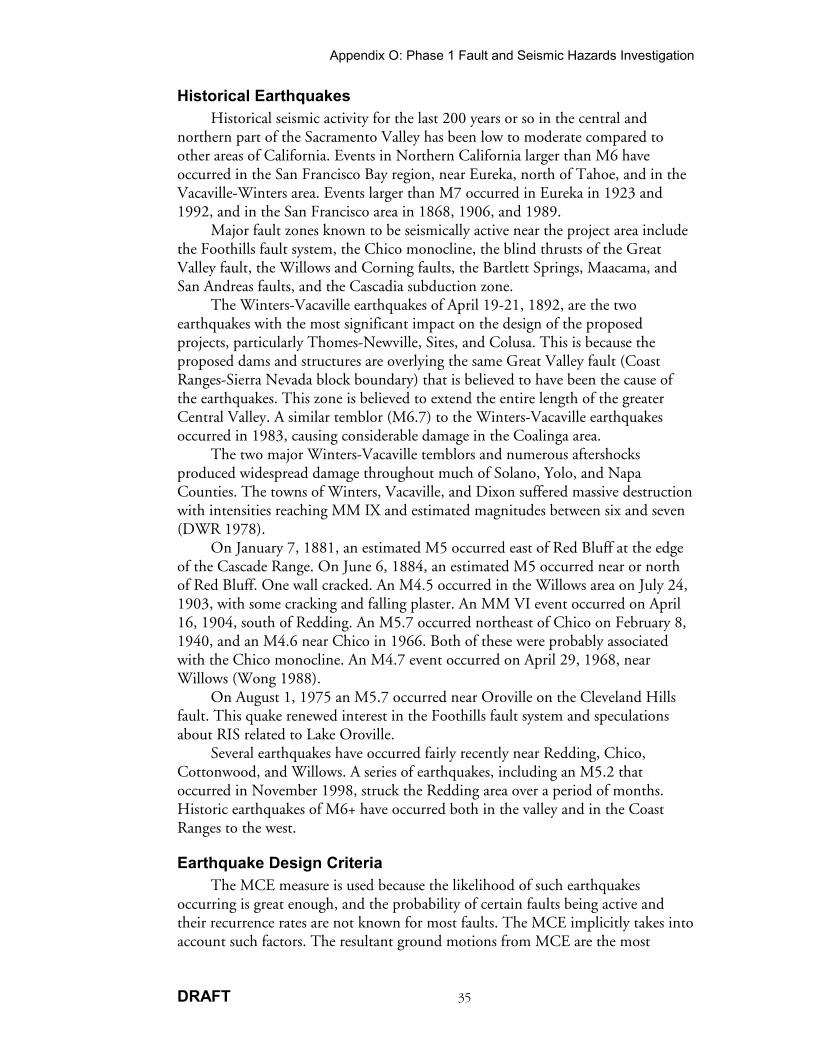
Figure 10 shows the epicenter data for the north-central part of theSacramento Valley. Sources of data include DWR (1900-1949, ML>3), U.C.Berkeley (1950-1970, ML>3), and USGS (1970 to present, ML>1). Earthquakes ofML>4 are fairly rare, averaging about one per year. Smaller quakes between M1-3are more common, averaging two to three per month.
Figure 10 shows earthquakes from one of several seismic networks that haveoperated intermittently. These include the survey’s main network, the Shasta Damnetwork, and the DWR network. The data shows the date, time, location,hypocentral depth, maximum intensity, and local magnitude of each earthquake.Accuracy of location and magnitude is dependent on the density and geometry ofthe seismic stations existing at the time of the event.
A microseismic network was installed in 1991 and is maintained by USGS aspart of the Red Bank Project investigation to fill in the gap between Stony GorgeReservoir and Lake Shasta. The purpose was to monitor and analyzemicroearthquakes to assist in defining hidden faults along the Coast Ranges-SierraNevada block boundary and to determine whether this zone extended this far tothe north. The network consists of five additional stations in the Red Bank area


Appendix O: Phase 1 Fault and Seismic Hazards Investigation
DRAFT 39
that are shown on Figure 10. DWR receives their reports quarterly and enters theinformation into an appropriate database. A summary of the data is in AttachmentA.
USBR installed a 10-station microseismic network in the Shasta-Trinity areain 1982. The network has provided hypocenter information on magnitudes as lowas 0.2. Two older stations operated by U.C. Berkeley are at Whiskeytown Damand at Mineral near Mt. Lassen.
Northern California Earthquake PotentialThere are a number of different methodologies for estimating earthquake
ground motion parameters. These include: simple prescribed parameter values,selection of a design strong-motion record, probabilistic seismic hazard analysis,and deterministic seismic hazard analysis. The latter two types were done for thisstudy.
Probabilistic Seismic Hazard AnalysisThis type of analysis is site-specific. According to CDMG (1997, Web site),
this includes the following:• Compiling a database of potentially damaging earthquake sources, including
known active faults and historic seismic source zones, activity rates, anddistances from project sites. This should include a comparison withpublished slip rates. Differences in slip rates should be documented and thereasons for them explained.
• Using published maximum moment magnitudes for earthquake sources, orestimates that are justified, well documented, and based on publishedprocedures.
• Using published curves for attenuation of peak ground acceleration withdistance from the earthquake source as a function of earthquake magnitudeand travel path.
• Evaluating likely effects of site-specific response characteristics from softsoils, topography, and near-source effects.
• Characterizing the ground motion in terms of peak ground acceleration witha 10 percent probability of exceedance in 50 years, taking into accounthistorical seismicity, available paleoseismic data, the slip rate of active faults,and site-specific resonance characteristics.
A probabilistic seismic hazard working group on Northern Californiaearthquake potential was convened in 1994 as part of the USGS NationalEarthquake Hazards Reduction Program. The working group was composed ofmany scientists from academia, government, and private industry, includingCDMG (1996) and USGS (1996). The task of the working group was to create amap and database of active faults, both surficial and buried. The database contains62 potential Northern California sources, including fault segments and areal-distributed zones. Factors considered include broadly-based plate tectonics,geologic slip rates, geodetic strain rates, and microseismicity. The hazard maps
North of the Delta Offstream Storage Investigation
DRAFT 40
form the basis for the ground motion design maps of the 1997 edition of theNational Hazard Reduction Program Recommended Provisions for Seismic Regulationsfor New Buildings. Maps and databases developed by the working group are onCDMG’s Web site (see References).
Because of the brief historical record of earthquakes, a standard methodologywas used, based on the empirical relationships between fundamental earthquakeparameters (USGS 1996), including the following:• Fault segmentation or determination of source length (l) - The fault rupture
length is generally related to the size of the earthquake.• Fault down-dip width (w) - Dip width is generally assumed to be 12 km in
Northern California, except where more accurate data frommicroearthquakes or other sources are available.
• Historical values of magnitude (MW) - Historical values were used whereavailable: otherwise the empirical relation of the moment to rupture areaMW=4.07+0.98log(lw)(km2) was used.
• Average coseismic slip (d) - Historical values were used when available;otherwise the relationship between seismic moment and moment magnitudewas used to determine d.
• Long-term slip rate (r) - Only minimum values on a few faults are availablefor this measurement. The values are provided in ranges that are a measureof the reliability.
• Recurrence time (t) - Historic values were used when possible, otherwise theempirical relation t=d/r was used, where d is the average coseismic slip and ris the slip rate.
CDMG (1996) published a Probabilistic Seismic Hazard Map (10 percentprobability in 50 years) of Peak Horizontal Ground Acceleration in Uniform Soft-Rock Site Conditions. This is shown on the CDMG Web site. The map shows thatthe project damsites fall within the 0.1 to 0.3g zone. It is important to note,however, that a 50-year recurrence interval is too small for such a large andimportant structure as a large dam, since the consequences of failure are too large.For these structures, a deterministic approach is generally adopted.
Deterministic Seismic Hazard AnalysisDeterministic evaluation (CDMG Web site) of seismic hazards includes the
following:• Evaluating potentially damaging earthquake sources and deterministic
selection of one or more suitable “controlling” sources and seismic events.The magnitude for any fault should be the maximum value that is specific tothe seismic source. Maximum earthquakes may be assessed by estimatingrupture dimensions of the fault.
• Using published curves for the effects of seismic travel paths using theshortest distance from the sources to the sites.
• Evaluating the effects of site-specific response characteristics on either siteacceleration or cyclic shear stresses within the soils of interest.

Appendix O: Phase 1 Fault and Seismic Hazards Investigation
DRAFT 41
Caltrans published a deterministic map in 1996 based on the MCE andaccompanying text detailing the latest understanding of earthquake science andearthquake engineering. The work was apparently done independently of USGSand CDMG work. Also, the potential for an M8+ on the Gorda plate-Cascadiasubduction zone was not considered. This probably affected the predicted peakhorizontal acceleration for the Red Bank Project, but not the Thomes-Newville,Sites, and Colusa Projects.
DSOD uses a deterministic approach. This method includes setting an MCEfor the project and determining the peak acceleration based on the horizontaldistance, the predominant period for the maximum acceleration, and thebracketed duration of the shaking.
Table 2 shows the published information regarding peak horizontalacceleration, MCE, and acceleration probabilities for each of the project damsites.This is based on the Caltrans California Seismic Hazard Map 1996 which showsmajor active faults and contours of expected peak acceleration. Also shown is theMW earthquake based on the Great Valley fault system segmentation model(CDMG 1996). The last column is the 10 percent probability in 50 years that thepeak horizontal acceleration will equal or exceed the predicted value on soft-rocksite conditions (CDMG 1996).
Table 2. Published Seismic Criteria for Project Damsites Source:CDMG 1996, Caltrans 1996
Damsite Creek
PeakAcceleration
Caltrans 1996(g)
MWCDMG1996
10% in 50years
CDMG 1996(g)
Dippingvat S.F. Cottonwood 0.4-0.5 6.7 0.1-0.2
Schoenfield Red Bank 0.4-0.5 6.7 0.1-0.2
Newville N.F. Stony 0.6+ 6.7 0.1-0.2
Grindstone Grindstone 0.4-0.5 6.7 0.2-0.3
Logan Logan 0.4-0.5 6.7 0.1-0.2
Hunters Hunters 0.4-0.5 6.7 0.1-0.2
Golden Gate Funks 0.5-0.6 6.7 0.2-0.3
Sites Stone Corral 0.5-0.6 6.7 0.2-0.3
Caution should be used in applying these criteria to dam designs. Thehighest peak acceleration shown on the Caltrans map is 0.6g. This is a realisticvalue for most instances. However, surprisingly high peak accelerations exceeding1g have been recorded in several instances during recent earthquakes such as SanFernando and Northridge. Caltrans does not imply that the 0.6 is the maximum

North of the Delta Offstream Storage Investigation
DRAFT 42
possible, but rather to indicate the least controversial upper level of peakacceleration known to occur.
USBR (1986) published a seismotectonic study of the northernmost part ofCalifornia for its project features. The seismographs show a variety of fault planesolutions from 1983-84 network data but mostly strike-slip faulting from north-south compression or east-west extension. Whether extension or compression isthe causative stress in the Shasta area cannot be determined from the currentinformation. There is also no evidence in the seismic patterns to determine theorientation of the fault planes. Clusters, however, do identify localized zoneswhere stress is being released. The seismicity does not appear to correspond withfaults or geologic structures mapped on the surface.
Reservoir-Induced SeismicityIncreased earthquake activity has been associated with the filling of a number
of reservoirs. From a total of 64 cases of possible RIS reported worldwide prior to1983, 45 were classified as actual cases (HMT 1983).
The magnitude of RIS is a function of the location, depth, and size of areservoir, and seismic activity in the area. The two main RIS triggeringmechanisms appear to be the increased stress from loading the reservoir area, andthe increased pore pressure from seepage. Both of these factors relate directly toreservoir height and volume, with height probably being more important thanvolume. Data indicate that RIS is most common in reservoirs greater than 300 feetin height in regions that are seismically active.
RIS is believed to be a consideration for all of the proposed reservoirs becauseof the large volume of water and depths that could exceed 300 feet. An M6.5earthquake occurring directly under a damsite at a depth of about 6 miles isbelieved to be a conservative estimate of this type of event. This is based onnumerous RIS events ranging from M5 to M6.5 that have been documentedworldwide.
The RIS event is smaller than other potential earthquakes related to theGreat Valley fault or Gorda plate subduction that could occur at the damsites, andtherefore are not considered to be the source of the Design Earthquake.
Project Design EarthquakesProject Design Earthquakes are based on the deterministic approach and the
occurrence of an MCE. Design Earthquakes are based on a number of factors,including the occurrence of historic earthquakes and concern for public safety asdescribed in previous sections. The earthquakes were selected to present aconservative estimate of the MCE.
Red Bank Design EarthquakeThree types of earthquakes were considered for the Red Bank Project. The
first is an M6.5 RIS event occurring at a depth of 10 km directly under the dam.The second is a Great Valley fault rupture, in this case, of several segmentsresulting in an M7 event directly under the dam at a depth of 10 to 12 km. Thethird is a Gorda plate event of M8.3 at a depth of 35 km directly underneath the
Appendix O: Phase 1 Fault and Seismic Hazards Investigation
DRAFT 43
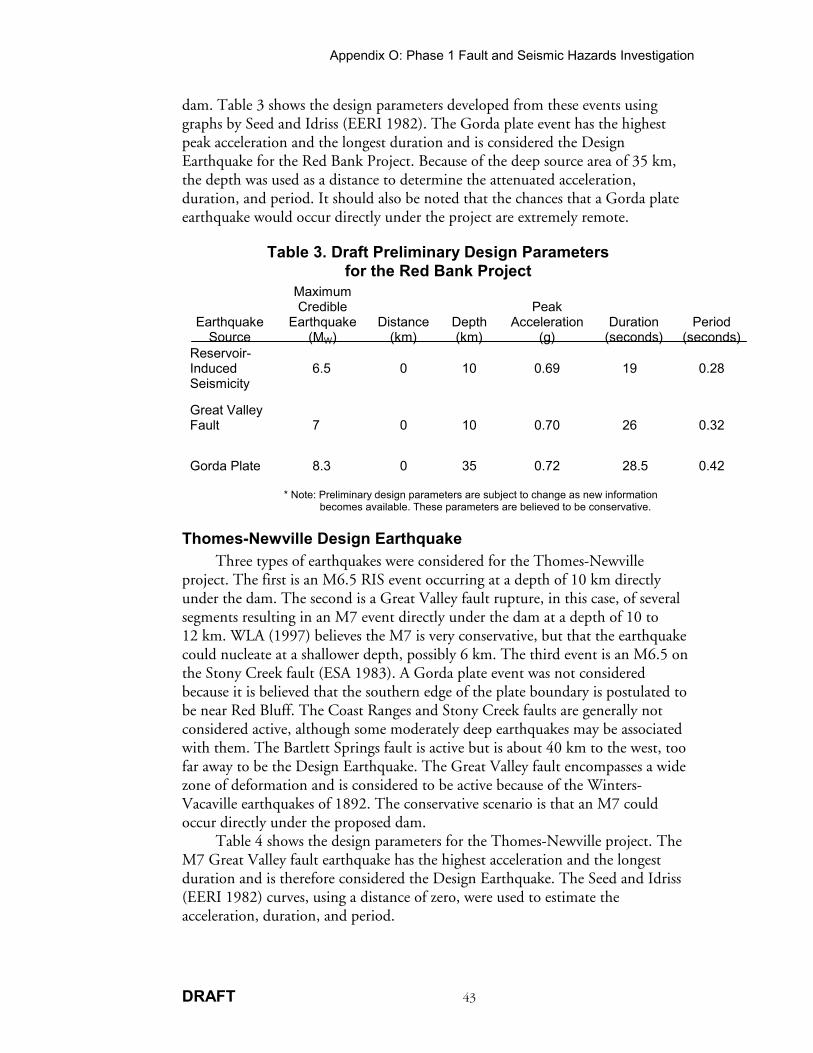
dam. Table 3 shows the design parameters developed from these events usinggraphs by Seed and Idriss (EERI 1982). The Gorda plate event has the highestpeak acceleration and the longest duration and is considered the DesignEarthquake for the Red Bank Project. Because of the deep source area of 35 km,the depth was used as a distance to determine the attenuated acceleration,duration, and period. It should also be noted that the chances that a Gorda plateearthquake would occur directly under the project are extremely remote.
Table 3. Draft Preliminary Design Parametersfor the Red Bank Project
EarthquakeSource
MaximumCredible
Earthquake(MW)
Distance(km)
Depth(km)
PeakAcceleration
(g)Duration
(seconds)Period
(seconds)Reservoir-InducedSeismicity
6.5 0 10 0.69 19 0.28
Great ValleyFault 7 0 10 0.70 26 0.32
Gorda Plate 8.3 0 35 0.72 28.5 0.42
* Note: Preliminary design parameters are subject to change as new informationbecomes available. These parameters are believed to be conservative.
Thomes-Newville Design EarthquakeThree types of earthquakes were considered for the Thomes-Newville
project. The first is an M6.5 RIS event occurring at a depth of 10 km directlyunder the dam. The second is a Great Valley fault rupture, in this case, of severalsegments resulting in an M7 event directly under the dam at a depth of 10 to12 km. WLA (1997) believes the M7 is very conservative, but that the earthquakecould nucleate at a shallower depth, possibly 6 km. The third event is an M6.5 onthe Stony Creek fault (ESA 1983). A Gorda plate event was not consideredbecause it is believed that the southern edge of the plate boundary is postulated tobe near Red Bluff. The Coast Ranges and Stony Creek faults are generally notconsidered active, although some moderately deep earthquakes may be associatedwith them. The Bartlett Springs fault is active but is about 40 km to the west, toofar away to be the Design Earthquake. The Great Valley fault encompasses a widezone of deformation and is considered to be active because of the Winters-Vacaville earthquakes of 1892. The conservative scenario is that an M7 couldoccur directly under the proposed dam.
Table 4 shows the design parameters for the Thomes-Newville project. TheM7 Great Valley fault earthquake has the highest acceleration and the longestduration and is therefore considered the Design Earthquake. The Seed and Idriss(EERI 1982) curves, using a distance of zero, were used to estimate theacceleration, duration, and period.

North of the Delta Offstream Storage Investigation
DRAFT 44
Table 4. Draft Preliminary Design Parameters for the Thomes-Newville Project
EarthquakeSource
MaximumCredible
Earthquake(MW)
Distance(km)
Depth(km)
PeakAcceleration
(g)Duration
(seconds) Period
(seconds)Reservoir-InducedSeismicity
6.5 0 10 0.69 19 0.28
Great ValleyFault 7 0 10 0.70 26 0.32BartlettSprings 7.1 40 10 0.17 23.5 0.32
Stony CreekFault 6.5 6 10 0.28 19 0.28
* Note: Preliminary Design parameters are subject to change, as new informationbecomes available. These parameters are believed to be conservative.
Sites and Colusa Projects Design EarthquakeThree types of earthquakes were considered for the Sites and Colusa Projects.
The first is a RIS of M6.5 occurring at a depth of 10 km. The second is an M7.1occurring on the Bartlett Springs fault at a distance of 40 km. The third is a GreatValley fault multiple-segment rupture with an M7 occurring at a depth of 10 km.Table 5 summarizes the design parameters. The M7 Great Valley fault event isconsidered to be the design earthquake. WLA (1997) considers the M7 to be veryconservative, but the site-source distance may be somewhat less. Directivity effectsmay be significant in estimating ground motions.
Table 5. Draft Preliminary Design Parameters for the Sites andColusa Projects
EarthquakeSource
MaximumCredible
Earthquake(MW)
Distance(km)
Depth(km)
PeakAcceleration
(g)Duration
(seconds)Period
(seconds)Reservoir-InducedSeismicity
6.5 0 10 0.40 19 0.28
Great ValleyFault 7 0
10 0.70 26 0.32
Stony CreekFault 6.5 16 10 - - -
BartlettSprings 7.1 32 10 - - -
* Note: Preliminary Design parameters are subject to change as new informationbecomes available. These parameters are believed to be conservative.

Appendix O: Phase 1 Fault and Seismic Hazards Investigation
DRAFT 45
Damsite Geology And SurfaceRupture Hazards
CDMG (1996) published guidelines for evaluating the hazards of surfacefault ruptures. The guidelines include a suggested report outline on faults, thetypes of exploration methods, and a comprehensive list of references. The study ofthe potential hazards of surface fault ruptures is based partially on the concepts ofrecency and recurrence, with the more recent the faulting and the higher therecurrence interval, the greater the probability for future faulting.
This Phase I report is a summary of past investigations and does not includeany current field investigations. Phase II will include detailed mapping, trenching,drilling, and stereo aerial photo, side-looking radar, and low-sun-anglephotography analyses. The Red Bank Project was initially investigated by DWR(1991) between 1989 and 1991. The Thomes-Newville Project was investigatedbetween 1980 and 1983 by DWR (1980) and ESA (1980). USBR investigated theSites Project between 1969 and the mid-1980s. No damsite geology has been donefor the Colusa Cell Project.
Red Bank ProjectThe Red Bank Project was initially envisioned as a number of earthfill
structures. Advances in the use of roller compacted concrete (RCC) createdrenewed interest in the project (DWR 1987). The faulting and seismicity wasinvestigated in detail by DWR (1991) and a summary is provided here. Figure 11shows the damsite foundation areas, simplified geology, and faulting in the RedBank area. Two small diversion structures, Bluedoor and Lanyan, are not discussedin the text.
Dippingvat Dam SiteDippingvat is in a narrow gorge on South Fork Cottonwood Creek. The
proposed dam is a 256-foot-high RCC structure impounding 104,000 acre-feet.The damsite is on Upper Cretaceous (Turonian) conglomerate (39 percent),sandstone (6 percent), and mudstone (55 percent). The beds dip downstream45 to 65 degrees and strike northwest.
Quaternary and Recent deposits include minimal stream channel depositsaveraging about 2 feet thick and colluvial soil along the base of the abutmentsaveraging from about 5 to a maximum of 15 feet. Terrace deposits are found bothupstream and downstream of the axis.
Three faults are exposed in the foundation. All were intersected duringdrilling. Associated with the faults were narrow zones of gouge and shearedmudstone. Fault DD-1 bears diagonally (N25W) across the channel at the damaxis. The fault can be traced at least 700 feet, with an apparent horizontal offset of75 to 100 feet, and a width of 3 feet. Fault DD-2 trends N40W and offsets aconglomerate bed on the left abutment. It is poorly exposed but drillingintersected a number of narrow shears, each less than a foot wide, which may beassociated with this fault. Fault DD-3 is about 300 feet downstream of the axis.This fault is a zone of fracturing with minimal offset. The faults do not crossdatable Quaternary deposits. DWR (1991) concluded that the faults were pre-Quaternary in age and would not create a seismic or surface rupture hazard.


Appendix O: Phase 1 Fault and Seismic Hazards Investigation
DRAFT 47
Schoenfield Dam SiteThe Schoenfield Dam site is in a narrow and steep gorge on Red Bank
Creek. The proposed dam would be a 300-foot-high RCC structure. The damfoundation consists of Upper Cretaceous (Turonian) sandstone (82 percent),mudstone (14 percent), and minor conglomerate (4 percent), with the beddingthickness varying from less than one inch to tens of feet. The beds trend northwestand dip about 60 degrees to the east.
Quaternary to Recent deposits consist of minor stream gravel in the channeland some colluvium at the base of the abutments. Terrace deposits 4- to 8-feetthick occur both upstream and downstream of the axis within the foundation area.
There are two mapped faults and several smaller faults that intersect thefoundation area. All are transverse faults that are roughly perpendicular to theregional strike of bedding. Fault SD-1 cuts the dam axis at N15E high on the leftabutment and has an apparent right lateral offset of 45 feet. The fault is poorlyexposed and does not appear to have great lateral extent. A small terrace lies acrossthe fault trace but no trenching was done. SD-2 is more prominent, trends N25E,and cuts through the right abutment. Movement appears to be right-lateral with adisplacement of about 75 feet. The fault consists of highly sheared andslickensided fault gouge. The faults do not cross datable Quaternary deposits.DWR (1991) concluded that the faults were pre-Quaternary in age and would notcreate a seismic or surface rupture hazard.
Thomes-Newville ProjectThe Thomes-Newville Project consists of a 1.4 to 1.9 maf reservoir created
by Newville Dam, a diversion dam on Thomes Creek, conveyance facilities to thereservoir, and Tehenn Reservoir, an afterbay with a pumping-generating plant.Additional facilities would be needed to bring water in from Black Butte Reservoirand the Sacramento River. The plan and geologic conditions were described indetail by DWR (1980).
A fault and seismic investigation was completed by ESA (1980). ESAconcluded that none of the numerous well defined, dated, Quaternary terraces inthe area show any topographic expression of offset by faulting or deformation bytectonic stresses.
Even the Pliocene Tehama formation that caps the ridges east of the reservoirarea shows no signs of tectonic activity. The two critical structures proposed forthis project are the Newville Dam and the Burrows Gap Saddle Dam. Figure 12shows the damsite geology and the locations of faults.
Newville Dam SiteThe Newville Dam site is about 20 miles west of Corning on North Fork
Stony Creek where the creek crosses Rocky Ridge. The dam would be a 288- to325-foot-high earth-rockfill structure. The dam would be founded on sandstone,mudstone, and conglomerate of the Jurassic Stony Creek formation andCretaceous mudstones of the Lodoga formation. The units strike N-S and dip50 to 80 degrees to the east.


Appendix O: Phase 1 Fault and Seismic Hazards Investigation
DRAFT 49
Colluvium, alluvium, and terrace deposits cover about 20 percent of thefoundation. The colluvium is generally less than 5 feet thick except at the base ofthe slopes where depths to 15 feet are reached. Gravelly deposits to 5 feet thickcover parts of the stream channel. Terrace deposits are the most abundant, andcover large areas both upstream and downstream of the dam axis. The terracesconsist of 5 to 20 feet of sandy clay overlying a silty-to-clayey sand and gravel from3 to 15 feet thick.
There are five faults crossing the foundation area. These are all roughlyparallel, striking N50E across the regional bedding. The faults show apparentright-lateral movement and dip steeply. The faults appear to widen and branchirregularly in the mudstone beds. Diamond core drill holes encountered closelyfractured and slickensided rock with numerous mud seams. Caving and sloughingwere severe.
Complex fault movement makes the total amount of displacement difficultto determine, but it could be as high as 4,000 feet along the fault parallel to HeiferCreek. ESA (1980) placed four trenches across these features. The faults appearedto be confined to the Jurassic and Cretaceous bedrock and were considered to bepre-Tehama formation in age (3.3 mya). None showed any evidence ofQuaternary-to-Recent movement.
The faults range in width from a few feet to over 40 feet and typically consistof highly fractured rock with seams of mylonite. Some faults have been cementedwith calcium carbonate.
Burrows Gap Dam Site and Chrome DikeOnly a minimal amount of mapping has been done at these damsites.
Burrows Gap Dam site foundation rocks consist mostly of sandstone andconglomerate with mudstone occurring on the upstream and downstream sections.Several NE-trending faults with minimal movement cross the foundation area.Chrome Dike is founded mostly on mudstone and Quaternary deposits. TheStony Creek fault trends just west of the right abutment. No trenching or drillinghas been done at either damsite.
Sites ProjectThe Sites Project would be either a 1.2 maf smaller project or a 1.9 maf
larger project about 10 miles west of Maxwell in the Antelope Valley. The projectwould consist of Sites Dam that would dam Stone Corral Creek, Golden GateDam that would dam Funks Creek, and an additional 5 to 12 saddle damsitesacross low areas along the reservoir rim. USBR has investigated the constructionmaterials (1981) and engineering geology for the Sites Project (1969). Brown andRich (1961) produced the Geologic Map of the Lodoga Quadrangle, Glenn andColusa Counties, California, which includes the geology of Sites and Golden GateDam sites, and the Hunters and Logan Dam sites of the Colusa Project.
General geologic structural trends of bedding, folding and some faulting areN-NW, with most of the cross faults trending NE-SW across the prevailingstructural trend.

North of the Delta Offstream Storage Investigation
DRAFT 50
The Salt Lake fault is a major structural feature that trends within a mile ofmost of the damsites in the Sites and Colusa Projects and possibly through theSites Dam site. Most of the fieldwork and aerial photography analyses in Phase IIwill be directed at this fault.
The fault is a thrust that developed on the eastern limb of the doublyplunging, west-vergent Sites anticline (DWR 1978). Salt water springs, gas seeps,and sag ponds on the fault trace suggest the possibility of recent fault activity. Inseveral locations, however, the fault is concealed by unbroken Pliocene Tehamaformation, suggesting that the latest movement occurred prior to this time.Quaternary terrace deposits near and over the fault do not appear to be deformed(WLA 1997).
Preliminary field work and aerial photo analyses for this study suggest thatthe fault is not a trace, but a zone of subparallel shears, faults, and folding that maybe wider than the mapped trace. It is therefore possible that movement hasoccurred since the Pliocene period on one of the fault traces.
Exposures are generally poor across the Salt Lake fault. Some geologic detailcan be seen along Stone Corral and Funks Creeks, but the section is incomplete.Exposures at Stone Corral Creek directly west of the town of Sites shows fracturedrock with numerous shears, folding, discontinuities in bedding, and faulting.
At Funks Creek, most of the Cretaceous bedrock is below the thalweg of thecreek and not exposed. Some bedrock is exposed along the fault trace mapped byBrown and Rich (1961). Black discoloration, probably caused by seepage of gasand hydrothermal fluids, occurs on a number of these outcrops. Farther to theeast, toward the Golden Gate Dam site, numerous shears, dislocations, and highlyfractured rock are exposed. Several zones of mylonite also occur. The mostprobable location of major fault activity occurs along a linear valley directly to thewest but has no bedrock exposures. Poor or no exposures occur along the Salt Lakefault where it crosses Logan Creek or Hunter Creek.
Sites Dam SiteSites Dam site is underlaid by Upper Cretaceous interbedded sandstone,
mudstone, and conglomerate of the Cortina formation. Within the reservoir areato the west, Cretaceous Boxer formation beds are folded by the Sites anticline.Beds at the damsite strike NNW and dip 40 to 60 degrees east. The predominantunit in the foundation is massive sandstone and associated thin-bedded sandstone,siltstone, and claystone of the Venado sandstone member.
Quaternary to Recent deposits include colluvium, alluvium, terrace deposits,and landslide deposits. Minor alluvium occurs in the stream channel. Terracedeposits are the most abundant, occurring both above and below the dam axis.The terrace deposits typically range in depth from 15 to 30 feet. Colluviumaverages about 5 feet on the foundation area but may reach depths of 15 feet at thebase of the slope. One small landslide occured on the left abutment and a largerslide occured on the right abutment. The larger landslide deposit is probably about30 feet thick at the base but thinner at the top. It is in the range of 200 feet highand about 75 feet wide at the base. The landslide also covers the trace of fault S2on the right abutment. Figure 13 shows the geologic map that was developed by
Appendix O: Phase 1 Fault and Seismic Hazards Investigation
DRAFT 51
USBR (1969) and modified by DWR (1998) to show an additional fault andseveral landslides.
Faults at Sites include faults S1 and S2. S2, mapped by Brown and Rich(1961), extends from near the vicinity of the town of Sites, trends northeastthrough the right abutment, crosses the channel near the dam axis, and thenextends downstream on the left abutment. The fault is several miles, possibly up to5 miles, long. The fault shows apparent right lateral displacement and possiblevertical displacement with the north side up.
Fault S1 was not mapped by Brown and Rich (1961) or by USBR (1969). Itwas mapped by WLA (1997) as a thrust fault. It crosses the left abutment, then thechannel near the dam axis, and trends to the southeast across the right abutment.There is a possibility that S1 is a southward extension of the Salt Lake fault, whichis shown by Brown and Rich to terminate about 2 miles north of the damsite.
The Salt Lake fault follows the axis of the Sites anticline, a major, doublyplunging, nearly isoclinal anticline on the west side of Logan Ridge. The anticlineand the Fruto syncline to the west extend a distance of at least 40 miles andpossibly farther.
The Salt Lake fault is a high-angle reverse fault or a thrust fault thatdeveloped adjacent to the axis of the anticline (DWR 1978). Salt water springs,gas seeps, and sag ponds occur along the fault trace. In several locations, the fault isconcealed by unbroken Pliocene Tehama formation, suggesting that the latestmovement occurred prior to deposition of the Tehama formation (3.3 mya) inthese areas (USBR 1969).
The presence of this possibly active fault in the foundation at Sites is aconcern and will therefore be a major part of the Phase II field investigation. It isalso believed that the surficial folding and faulting is a result of deep-seated thrustfaulting along the Great Valley thrust fault system.
Golden Gate Dam SiteThere are three damsites at Golden Gate: an upper site that was mapped and
drilled by USBR in the 1960s, best for a small Sites Reservoir, and two lower sitesthat have not been investigated previously that are best for a large Sites Reservoir.The lower sites are the focus of this study. The damsites are on the same ridge asSites Dam and only a few miles to the north, resulting in similar bedrock geologyof predominant sandstone with interbedded mudstone and some conglomerate.
Quaternary to Recent deposits include colluvium, alluvium, landslide, andterrace deposits. Stream gravel deposits are minor and range in thickness to about5 feet. Colluvium typically ranges from 5 feet to about 15 feet at the base of theslopes. Several landslides have occurred: one small recent one on the rightabutment, and a larger older one on the left abutment. Terrace deposits are themost extensive, mostly Upper Modesto and Lower Riverbank formations. Theseaverage 15 to 20 feet thick, but may reach a thickness in excess of 25 feet. Thecomposition is variable, but generally consists of an upper layer of silt and soil, anda lower layer of clayey gravel and cobbles.
Several faults cross the foundation area. Faults GG1, GG2 and GG3 weremapped by Brown and Rich (1961). GG1 extends from the right abutment of

Appendix O: Phase 1 Fault and Seismic Hazards Investigation
DRAFT 53
the two lower sites, crosses the channel slightly upstream of the dam axes, crossesthe left abutment, and then extends an additional 2 miles in a NW directionbefore it ends or is lost in the mudstones to the east. Apparent right lateraldisplacement is estimated to be in the range of 0.3 mile.
Fault GG2 is much smaller and extends across the left abutment of the upperdamsite, then trends NE and misses the left abutment of the lower damsitefoundation by about one-fourth mile. Apparent right lateral displacement isestimated to be about 50 feet.
Fault GG3 is south of the damsite, but trends across the diversion alignmentbetween Golden Gate and Funks Reservoirs. Displacement is estimated at about1,500 feet.
Colusa ProjectThe Colusa Project would include the larger Sites Project, but would also
expand northward into the Colusa compartment. Here Logan Dam would crossLogan Creek and Hunters Dam would cross Hunters Creek. In addition, anumber of saddle dams would be required (Figure 14). No detailed geologicexploration has been conducted.
Hunters Dam SiteBrown and Rich mapped one fault crossing the left abutment. The north
side is up, and apparent right lateral displacement is estimated to be less than100 feet.
Hunters Dam site is on Logan Ridge, the same ridge as the Sites, GoldenGate, and Logan Dam sites. It is underlaid by Upper Cretaceous interbeddedsandstone, mudstone, and conglomerate of the Boxer formation. Within thereservoir area to the west, the Cretaceous beds are folded by the Sites anticline.Beds strike NNW and dip 40 to 60 degrees east. The predominant unit in thefoundation is massive sandstone and associated thin-bedded siltstone and claystoneof the Venado sandstone member.
Quaternary to Recent deposits include colluvium, alluvium, terrace deposits,and landslide deposits. Minor alluvium occurs in the stream channel. Terracedeposits are the most abundant, occurring above, on, and below the dam axis. Theterrace deposits typically range in depth from 15 to 30 feet. Colluvium averagesabout 5 feet on the foundation but may reach depths of 15 feet at the base of theslope.
Logan Dam SiteLogan Dam site is underlaid by the same bedrock units as all the other
damsites. Quaternary to Recent deposits include colluvium, alluvium, terracedeposits, and landslide deposits. Minor alluvium occurs in the stream channel.Terrace deposits are the most abundant, occurring both above and below the damaxis. The terrace deposits typically range in depth from 15 to 30 feet. Colluviumaverages about 5 feet on the foundation but may reach depths of 15 feet at thebase of the slope. No faults were mapped by Brown and Rich at this site. Salt Lakefault is about 1 mile to the west.


Appendix O: Phase 1 Fault and Seismic Hazards Investigation
DRAFT 55
References CitedAnderson Consulting Group. 1997. Preliminary Design Report, Funks Creek
Project.
Atwater, T. 1970. Implications of Plate Tectonics for the Cenozoic Tectonic Evolutionof Western North America. Geologic Society of America Bulletin, Vol. 81, pp.3513-3536.
Bailey, E. H. and D. L. Jones. 1973. Preliminary Lithologic Map, Colyear SpringsQuadrangle, California. U.S. Geological Survey, Miscellaneous Field StudiesMap MF-516, Scale 1:48,000.
Beaudoin, B. C., et al. 1997. Transitions from Slabs to Slabless: Results from 1993Mendocino Triple Junction Seismic Experiment. Available from Web site:http://pangea.stanford.edu/~bruce/pubs/mengeo.html.
Brown, R. D. and E. Rich. 1961. Geologic Map of the Lodoga Quadrangle, Glennand Colusa Counties, CA. U.S. Geological Survey Oil and Gas InvestigationsMap OM-210.
California Department of Conservation, Division of Mines and Geology(CDMG), 1996 and 1997. Available from Web site:http://www.consrv.ca.gov/dmg/.
California Department of Water Resources (DWR). 1957. The California WaterPlan, Bulletin 3.
----- 1974. Seismic Stability Evaluation of Earth Embankments. DWR class notes.
----- 1978. West Sacramento Valley Fault and Seismicity Study, Glenn Complex,Colusa Reservoir, Berryessa Enlargement. Division of Design andConstruction, Project Geology Branch, 43 pp.
----- 1980. Thomes-Newville and Glenn Reservoir Plans - Engineering Feasibility.Northern District Report. November.
----- 1982. Newville Unit Seismic and Fault Activity Study: Review and Analysis ofPrevious Reports; Recommendation for Further Work. Northern District, 49pp.
----- 1987. The Dippingvat-Schoenfield Project. Northern District Report.November.
----- 1990. Engineering Geology of the Red Bank Project, Tehama County,California. Northern District Memorandum Report, 90 pp. November.

North of the Delta Offstream Storage Investigation
DRAFT 56
----- 1991. Red Bank Project Fault Investigation, Tehama County: Review andAnalysis of Previous Reports; Recommendations for Further Work. NorthernDistrict Memorandum Report, 74 pp.
Chuber, S. 1961. Late Mesozoic Stratigraphy of the Elk Creek-Fruto Area, GlennCounty, California, PhD. Thesis, Stanford University, 115 pp.
Cockerham, R. S. 1984. “Evidence for a 180-KM-Long Subducted Slab BeneathNorthern California.” Bulletin of the Seismological Society of America, Vol. 74,No. 2, pp. 569-576.
Earth Sciences Associates. 1980. Seismic and Fault Activity Study, Proposed GlennReservoir Complex. January.
Frankel, A., C. T. Mueller, D. Barnhard, E. Perkins, N. Layendecker, N.Dickman, S. Hanson, and M. Hopper. 1996. National Seismic Hazard Maps.USGS Open File Report 96-532.
Freymuller, J., and P. Segall. 1997. Kinematics of the Pacific-North American PlateBoundary Zone, Northern California. Available from Web site:http://pangea.stanford.edu/~segall/norcal.html.
Harlan-Miller-Tait Associates. 1983. Fault Evaluation of the Cottonwood CreekProject. Prepared for U.S. Army Corps of Engineers, Sacramento District.DACW 05-82-C0074, 98 pp.
Harlan-Miller-Tait Consultants. 1984. Supplemental Fault Evaluation of theCottonwood Creek Project. Prepared for the U.S. Army Corps of Engineers,Sacramento District. DACW 05-84-D-1635, 32 pp.
Harwood, D.S. 1984. “Evidence for Late Cenozoic East-West CompressiveTectonism in the Sacramento Valley, California.” in Crouch , J.K. and S.B.Bachman, eds. Tectonism and Sedimentation along the California Margin.Pacific Section S.E.P.M., Vol. 38, pp. 933-941.
Harwood, D. S. and E. Helley. 1987. Late Cenozoic Tectonism of the SacramentoValley, California. U.S. Geological Survey Professional Paper 1359, 46 pp.
Helley, E. J., D. S. Harwood, J. A. Barker, and E. A. Griffen. 1981. Geologic Mapof the Battle Creek Fault Zone and Adjacent Parts of the Northern SacramentoValley, California. U.S. Geological Survey Map MF-1298, Scale 1:62,500.
Helley, E. J. and D. Harwood. 1985. Geologic Map of the Late Cenozoic Deposits ofthe Sacramento Valley and Northern Sierra Foothills, California. U.S.Geological Survey Map MF-1790.

Appendix O: Phase 1 Fault and Seismic Hazards Investigation
DRAFT 57
Jayco, A. S., M. C. Blake, Jr., et al. 1987. “Attenuation of the Coast RangesOphiolite by Extensional Faulting, and Nature of the Coast Ranges'Thrust,' California.” Tectonics, Vol. 6, No. 4, pp. 475-488.
Jennings, Ralph. 1990. Record Searchlight article: Shasta Shaker, November 1.
Kirby, J. M. 1943. “Sites Region.” California Division of Mines and GeologyBulletin 118, pp. 606-608.
Krueger, S. W. and D. L. Jones. 1989. “Extensional Fault Uplift of RegionalFranciscan Blueschists due to Subduction Shallowing during the LaramideOrogeny.” Geology, Vol. 17, pp. 1157-1159.
Luce, G. C. 1993. Segmentation Model of the Coast Ranges-Sierran Block BoundaryZone, Sacramento Valley, California, M.S. Thesis, University of Nevada,Reno.
Phipps S. P. and J. R. Unruh. 1992. “Crustal-Scale Wedging beneath an ImbricateRoof-Thrust System.” Geology of a Transect across the Western SacramentoValley and Northern Coast Ranges, California, Field Guide to the Tectonics ofthe Boundary between the California Coast Ranges and the Great Valley ofCalifornia. Am. Assoc. of Petroleum Geologists, GB-70.
Platt, J. P. 1986. “Dynamics of Orogenic Wedges and the Uplift of High-pressureMetamorphic Rocks.” Geological Society of America Bulletin, Vol. 97,pp. 1037-1053.
Schwartz, D. P. and C. Coppersmith. 1984. “Fault Behavior and CharacteristicEarthquakes; Examples from the Wasatch and San Andreas Fault Zones.”Journal of Geophysical Research, Vol. 89, pp. 5681-5698.
Seed, H. B. 1966. A Method of Earthquake Resistant Design of Earth Dams. JournalSMFD, ASCE, Vol. 92, No. SM1.
Seed, H. B. and I. M. Idriss. 1982. Ground Motion and Soil Liquifaction DuringEarthquakes. Engineering Monographs on Earthquake Criteria, StructuralDesign, and Strong Motion Records, Earthquake Engineering ResearchInstitute, Vol. 5, p. 134.
Sherard, J., R. Woodward, S. Gizienski, and R. Clevenger. 1963. Earth and EarthRock Dams, Engineering Problems of Design and Construction.
Sherard, J. L. 1966. Earthquake Considerations in Earth Dam Design. Conferenceon Stability of Slopes and Embankments. ASCE, Soil Mechanics andFoundations Division, Berkeley, California.

North of the Delta Offstream Storage Investigation
DRAFT 58
Unruh, J. R. and E. Moores. 1992. “Quaternary Blind Thrusting in theSouthwestern Sacramento Valley, California.” Tectonics (preliminary reviewcopy).
U.S. Bureau of Reclamation. 1969. Stony Canal, West Sacramento Canal Unit,Central Valley Project, California. Project Development Division, ProjectGeology.
U.S. Bureau of Reclamation. 1986. Seismotectonic Study of Northern California forShasta, Keswick, Spring Creek Debris, Trinity, Lewiston, and WhiskeytownDams, Central Valley Project California. Engineering and Research Center,Denver Colorado, Report No. 86-1.
U.S. Bureau of Reclamation, formerly U.S. Water and Power Resources Services.1981. Seismic Design Parameters for the Stony Gorge Dam.
U.S. Geological Survey, 1996. Available from Web site: http://www.usgs.gov.
Walter, S. R. 1986. “Intermediate-Focus Earthquakes Associated with Gorda PlateSubduction in Northern California.” Bulletin of the Seismological Society ofAmerica, Vol. 76, pp. 583-588.
Wentworth, C. M., and M. D. Zoback. 1990. “The Style of the Late CenozoicDeformation at the Eastern Front of the California Coast Ranges.” Journal ofTectonics, preliminary report.
Wentworth, C. M., M. C. Blake, Jr., et al. 1984. “Tectonic Wedge Associatedwith Emplacement of the Franciscan Assemblage, California Coast Ranges.”In Franciscan Geology of Northern California. Pacific Section, S.E.P.M., Vol.43, pp. 163-173.
William Lettis and Associates. 1997. Seismotectonic Evaluation - Stony Gorge andEast Park Dams of the Orland Project and Monticello Dam of the SolanoProject. Prepared for the USBR, 145 pp. with plates and appendices,October.
Wong, I. G., R. Ely, and A. Kollman. 1988. “Contemporary Seismicity andTectonics of the Northern and Central Coast Ranges-Sierra Block BoundaryZones, California.” Journal of Geophysical Research, Vol. 93, pp. 7813-7833.
Zoback, M. L. and M. D. Zoback. 1989. “Tectonic Stress Field of theContinental United States” in LC. Pakiser and W. D. Mooney (eds.),Geophysical Framework of the Continental United States. Geological Society ofAmerica Memoir 172, pp. 523-540.

Appendix O: Phase 1 Fault and Seismic Hazards Investigation
DRAFT 59
Attachment ASeismicity near the Red Bank, Thomes-Newville, and Colusa Projects
Recorded by the Northern California Seismic Networkby
David Oppenheimer


State of California, Gray Davis, GovernorThe Resources Agency, Mary D. Nichols, Secretary for Resources
Department of Water Resources, Thomas M. Hannigan, Director
Steve Macaulay, Chief Deputy DirectorRaymond D. Hart, Deputy Director
L. Lucinda Chipponeri, Assistant Director for LegislationSusan N. Weber, Chief Counsel
William J. Bennett, Chief, Division of Planning and Local Assistance
This report was prepared under the direction ofNaser J. Bateni, Chief, Integrated Storage Investigations
In coordination with CALFED
byCharlie Brown, Department of Fish and Game
Brad Burkholder, Department of Fish and GameJenny Marr*, Department of Fish and Game
Frank Wernette, Department of Fish and Game
David J. Bogener, Department of Water ResourcesGerald Boles, Department of Water Resources
Koll Buer, Department of Water ResourcesDoug Denton, Department of Water Resources
K. Glyn Echols, Department of Water ResourcesGary Hester, Department of Water Resources
Ralph Hinton, Department of Water ResourcesGail Kuenster, Department of Water Resources
Joyce Lacey-Rickert, Department of Water ResourcesGlen Pearson, Department of Water Resources
Doug Rischbieter, Department of Water ResourcesWaiman Yip, Department of Water Resources
Robert Orlins, Department of Parks and Recreation
assisted byNikki Blomquist, Department of Water Resources
Linton Brown, Department of Water ResourcesBarbara Castro, Department of Water Resources
Julia Culp, Department of Water ResourcesJennifer Davis, Department of Water Resources
Mark Dombrowski, Department of Water ResourcesLawrence Janeway, Department of Water Resources
Sandy Merritt, Department of Water ResourcesShawn Pike, Department of Water Resources
Carole Rains, Department of Water ResourcesApril Scholzen, Department of Water ResourcesMichael Serna, Department of Water ResourcesSusan Tatayon, Department of Water Resources
Caroline Warren, Department of Water Resources
*formerly with Department of Water Resources

State of CaliforniaThe Resources Agency
Department of Water ResourcesDivision of Planning and Local Assistance