north housing market characteristic area horsforth, adel
TRANSCRIPT

NORTH HOUSING MARKET CHARACTERISTIC AREA
HORSFORTH, ADEL & WHARFEDALE, KIRKSTALL, HEADINGLEY, WEETWOOD, MOORTOWN, ALWOODLEY, ROUNDHAY, CHAPEL ALLERTON WARDS (with a
small area of Killingbeck & Seacroft Ward)
INTRODUCTION 1. North Housing Market Characteristic Area and Wards 1.1 Plan 1 shows the boundaries of the wards that fall, to a greater or lesser extent,
within North Leeds Housing Market Characteristic Area (HMCA). The plan also shows the areas of greenspace by type that fall in the area.
1.2 The greenspace sites shown on the plan and used in the following assessment are
those which were identified and surveyed during the citywide Open Space, Sport and Recreation Assessment (referred to as the Open Space Audit) in 2008 and not the allocated greenspace (N1, N1a, N5 and N6) identified in the UDP Review 2006. Many sites are in both but there are variations which must be noted: 1) some allocated sites are not included (where they have been developed); 2) others appear with amended boundaries; and 3) there are additional sites which are not currently allocated but have been identified through the audit as functioning as greenspace. Plan 2 overlays the existing UDP allocations with the boundaries of the Open Space Audit sites and thereby clearly shows the differences between the two. Appendix 1 contains a list of those allocated sites which do not appear on the plan and the reasons why they are not shown. It is proposed to delete these sites, revise the boundaries of some sites to reflect what is currently on the ground and designate the new sites identified through the Open Space Audit.
1.3 Housing Market Characteristic Areas are sub-areas recognising the diverse nature
and characteristics of market areas across the City. These areas take account of topographical and settlement spatial definitions as well as operational housing markets in terms of house prices and land values. They reflect geographical areas that people tend to associate with finding properties to live in.
1.4 Whilst other subjects have been considered on an HMCA basis, the quantity of
greenspace has been analysed according to wards because this allowed a more accurate analysis by ward population figures. The quality and accessibility of greenspace is assessed on an HMCA basis.
1.5 There are 10 wards that fall to a greater or lesser extent within the North Leeds HMCA. Four wards fall predominantly within the area, these being Weetwood, Kirkstall, Moortown and Roundhay, whilst Horsforth, Adel & Wharfedale, Alwoodley, Headingley and Chapel Allerton fall in more than one HMCA. A very small area of Killingbeck and Seacroft Ward falls within the area, however it is only a very small part of the ward and there are no areas of greenspace in it therefore the ward will be considered in detail under the Inner Area HMCA.
1.6 Where an area of greenspace falls across the boundary of the ward then only the part of the greenspace that falls within the ward has been included in the analysis. Care has been taken to check this would not result in the division of a facility.
2.0 Total Greenspace in 9 Wards

2.1 Total greenspace in all wards is 1593.196 ha on 347 greenspace sites. Excluding
green corridors, cemeteries and golf courses the total is 1110.629 ha and this relates to 309 sites. There are 4 sites within Alwoodley and Roundhay Wards covering an area of 2.809ha that fall within the Outer North East HMCA.
3.0 Core Strategy Policy G3: Standards for Open Space, Sport and Recreation 3.1 Policy G3 sets out standards for the following types of greenspace:
• Parks and Gardens
• Outdoor Sports Provision - excludes MUGAs, single goal ends and golf courses. Includes tennis courts, bowling greens, athletics tracks, synthetic pitches, adult pitches, junior pitches (football, rugby, cricket)
• Amenity greenspace – excludes cemeteries.
• Children and young people’s equipped play facilities – includes MUGAs skate parks, teen shelters, play facilities.
• Allotments – both used and unused.
• Natural greenspace - excludes green corridors. 3.2 There are no standards in the Core Strategy for cemeteries, green corridors and
golf courses (but these are shown on Plan 1 for completeness).
QUANTITY OF GREENSPACE 4.0 Methodology 4.1 The tables below show the breakdown of provision, or quantity, for each of the 6
types of greenspace defined in Policy G3 in the Core Strategy. The quantities have been divided by the total population of each ward to give a standard which can be compared against the standards in Policy G3.
4.2 The ward population is taken from the ONS Population Census 2011. Ward
Populations are as follows:
Ward Population
Horsforth 21,506
Adel & Wharfedale 19,430
Kirkstall 21,709
Headingley 20,533
Weetwood 22,375
Moortown 22,792
Alwoodley 22,766
Roundhay 22,546
Chapel Allerton 23,536
4.3 Child populations are taken from the ONS Population Census 2011 and the 2007
mid year estimates. The 2011 census figures are grouped in 5 year categories so there are accurate figures for 0 - 4, 5 – 9 and 10 – 14 year olds. The next category is 15 – 19 year olds so the 2007 mid year estimates have been used to estimate the number of 15 and 16 year olds. These estimates are broken down to individual years so the number of 11 and 12 year olds in 2007 (15 and 16 year olds in 2011) has been added to the 2011 population figures to give an estimate of children and young people by ward. This is set out below:

Ward Population aged 0 -16 years
Horsforth 3,885
Adel & Wharfedale 3,656
Kirkstall 3,224
Headingley 777
Weetwood 3,537
Moortown 3,947
Alwoodley 4,478
Roundhay 4,901
Chapel Allerton 4,794
4.4 Core Strategy Policy G3 identifies the following standards for quantity of
greenspace:
Greenspace type Quantity per 1000 population
Parks and Gardens 1 hectare
Outdoor sports provision 1.2 hectares (excluding education provision)
Amenity greenspace 0.45 hectares
Children and young people’s equipped play facilities
2 facilities per 1,000 children (excluding education provision)
Allotments 0.24 hectares
Natural Greenspace 0.7 hectares (main urban area and major settlements, 2 ha other areas)
5.0 Quantities by types and Wards 5.1 The quantities of greenspace types compared to the Core Strategy standards are
as follows for the nine wards in the North area. Parks and Gardens Parks and Gardens Horsforth Ward
SITE_ID SITE_NAME AREA_HA
61 Horsforth Hall Park 15.151
1108 Drury Avenue Recreation Ground 1.969
1109 Cragg Hill Recreation Ground 2.849
1356 Jubilee Hall 0.694
Total 20.663
5.3.1 Quantity (per thousand people) - 20.663 ÷ 22.457 = 0.92 hectares 5.3.2 Conclusions - Compared against the standard of 1 hectare per 1000 population,
Horsforth ward falls slightly short of the recommended Core Strategy standard and so is deficient in terms of the quantity of Parks and Gardens.
Parks and Gardens Adel & Wharfedale Ward
SITE_ID SITE_NAME AREA_HA
53 Golden Acre Park 41.998

58 Holt Park 2.136
712 Pool Recreation Ground 3.232
26 Bedquilts Recreation Ground 22.123
Total 69.489
5.2.1 Quantity (per thousand people) - 69.489 ÷ 19.430= 3.57 hectares 5.2.2 Conclusions: Compared against the standard of 1 hectare per 1000 population,
Adel & Wharfedale ward exceeds the recommended Core Strategy standard by more than double and so has surplus provision in terms of the quantity of Parks and Gardens.
Parks and Gardens Kirkstall Ward
SITE_ID SITE_NAME AREA_HA
34 Burley Park 6.347
70 Kirkstall Abbey Estate 24.157
678 Old Farm Close Greenspace 1.570
473 Sandford Road 1.564
387 The Village Street Recreation Ground 1.874
1833 Hawksworth Wood 21.848
25 Becketts Park 0.314
25 Becketts Park 2.173
Total 59.847
Quantity (per thousand people) – 59.847 ÷ 21.709= 2.76 hectares Compared against the standard of 1 hectare per 1000 population, Kirkstall ward exceeds the recommended Core Strategy standard and so has surplus provision in terms of the quantity of Parks and Gardens. Parks and Gardens Headingley Ward
SITE_ID SITE_NAME AREA_HA
25 Becketts Park 2.017
Total 2.017
Quantity (per thousand people) – 2.017 ÷ 20.533 = 0.1 hectares Compared against the standard of 1 hectare per 1000 population, Headingley ward falls extremely short of the recommended Core Strategy standard and so is deficient in terms of the quantity of Parks and Gardens. Parks and Gardens Weetwood Ward
SITE_ID SITE_NAME AREA_HA
144 Meanwood Park 1.247
100 Tinshill Recreation Ground 6.876
25 Becketts Park 14.320
1492 Silk Mill Bank 1.132
Total 23.575
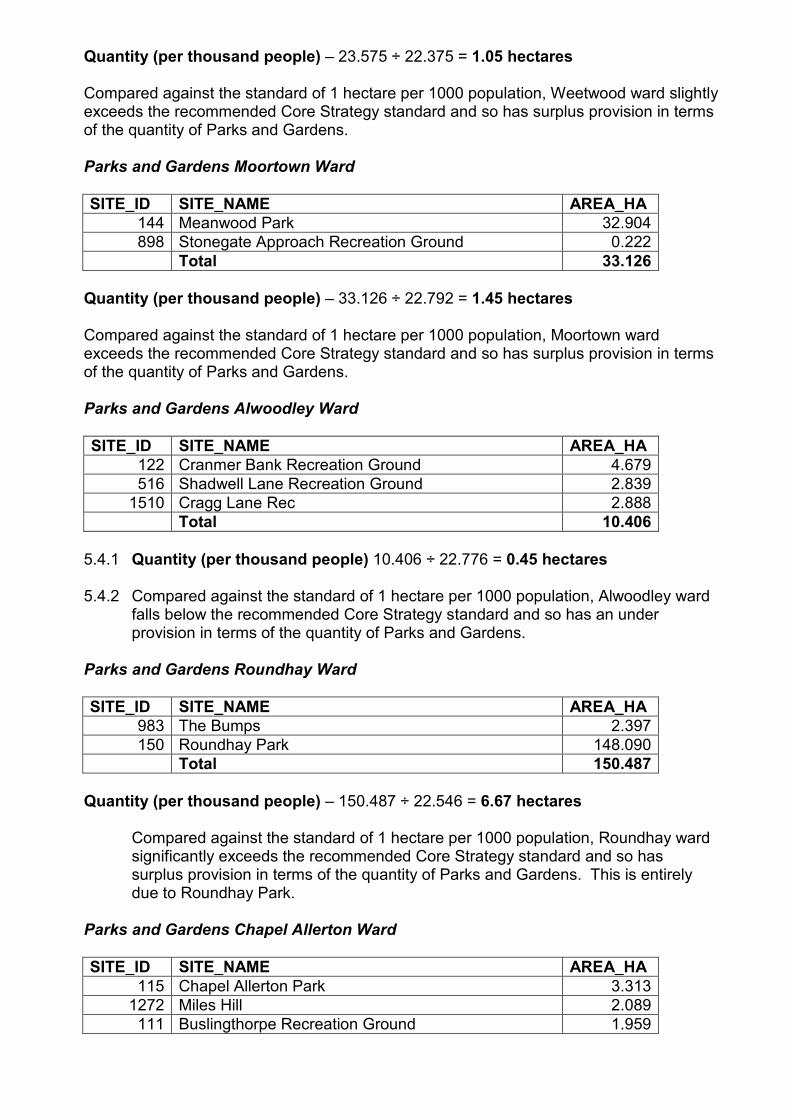
Quantity (per thousand people) – 23.575 ÷ 22.375 = 1.05 hectares Compared against the standard of 1 hectare per 1000 population, Weetwood ward slightly exceeds the recommended Core Strategy standard and so has surplus provision in terms of the quantity of Parks and Gardens. Parks and Gardens Moortown Ward
SITE_ID SITE_NAME AREA_HA
144 Meanwood Park 32.904
898 Stonegate Approach Recreation Ground 0.222
Total 33.126
Quantity (per thousand people) – 33.126 ÷ 22.792 = 1.45 hectares Compared against the standard of 1 hectare per 1000 population, Moortown ward exceeds the recommended Core Strategy standard and so has surplus provision in terms of the quantity of Parks and Gardens. Parks and Gardens Alwoodley Ward
SITE_ID SITE_NAME AREA_HA
122 Cranmer Bank Recreation Ground 4.679
516 Shadwell Lane Recreation Ground 2.839
1510 Cragg Lane Rec 2.888
Total 10.406
5.4.1 Quantity (per thousand people) 10.406 ÷ 22.776 = 0.45 hectares 5.4.2 Compared against the standard of 1 hectare per 1000 population, Alwoodley ward
falls below the recommended Core Strategy standard and so has an under provision in terms of the quantity of Parks and Gardens.
Parks and Gardens Roundhay Ward
SITE_ID SITE_NAME AREA_HA
983 The Bumps 2.397
150 Roundhay Park 148.090
Total 150.487
Quantity (per thousand people) – 150.487 ÷ 22.546 = 6.67 hectares
Compared against the standard of 1 hectare per 1000 population, Roundhay ward significantly exceeds the recommended Core Strategy standard and so has surplus provision in terms of the quantity of Parks and Gardens. This is entirely due to Roundhay Park.
Parks and Gardens Chapel Allerton Ward
SITE_ID SITE_NAME AREA_HA
115 Chapel Allerton Park 3.313
1272 Miles Hill 2.089
111 Buslingthorpe Recreation Ground 1.959

87 Potternewton Park 12.606
Total 19.967
Quantity (per thousand people) – 19.967 ÷ 23.536 = 0.85 hectares
Compared against the standard of 1 hectare per 1000 population, Chapel Allerton ward falls below the recommended Core Strategy standard and so has an under provision in terms of the quantity of Parks and Gardens.
Parks and Gardens - Overall Conclusions
5.4.1 If the totals for the 9 wards are added together it creates an overall standard of 1.98 hectares per 1,000 population for the area. This exceeds the Core Strategy standard however this figure is an average so whilst there is an excess of provision in 5 Wards, there is an under provision in 4 Wards. This demonstrates that the quantity of parks and gardens is very unevenly distributed across the North HMCA with some wards being very deficient (Headingley) and other wards having a large surplas (Adel and Wharfedale, Roundhay).
Outdoor Sports Provision
5.5 Methodology 5.5.1 Outdoor sports facilities in educational use have been excluded as it cannot be
assumed that these are available for the public to use. Golf courses have also been excluded.
5.5.2 There are instances where outdoor sports provision occurs within other primary
typologies. We have identified these and used the Sport England Comparison Standards to extract out the size of facilities as follows:
• Playing pitch (adult) = 1.2ha
• Junior pitch = 0.5ha
• Bowling green = 0.14ha
• Tennis court = 0.0742ha
• Cricket pitch = 1.37ha
• Synthetic turf pitch = 0.7ha Outdoor Sports Provision Horsforth Ward
SITE_ID SITE_NAME
61 Horsforth Hall Park
967 Calverley Lane Sports Ground
1279 Rawdon Golf Course tennis courts
1836 Brownberrie Lane Rec
67 King George's Playing Fields
162 Woodside Recreation Ground
1063 Yarn Bury Rugby Club
1108 Drury Avenue Recreation Ground
1109 Cragg Hill Recreation Ground
1818 Rawdon Meadow Playing Fields
1816 Woodhouse Public School Playing Fields
5.8.1 The quantity of outdoor sports provision on the above sites is as follows:

Type No. Area (ha)
Adult Pitches 21 25.2
Junior Pitches 3 1.5
Cricket Pitches 7 9.59
Tennis Courts 13 0.965
Bowling Green 2 0.28
Synthetic Pitches 0 0
Total 46 37.535
5.8.2 Quantity (per thousand people) - 37.535 ÷ 22.457 = 1.7 hectares 5.8.3 Conclusions - Compared against the standard of 1.2 hectares per 1000
population, Horsforth Ward exceeds the recommended Core Strategy standard and so has surplus provision in terms of the quantity of outdoor sports provision.
Outdoor Sports Provision Adel & Wharfedale Ward
SITE_ID SITE_NAME
734 Pool Cricket Club
736 Arthington Cricket ground
925 New Rover Cricket Club
743 Bramhope Bowls Club
58 Holt Park
1851 Bramhope Tennis Club
1651 Holt Lane
1652 Old Cricket Ground Pool Road Mills
991 Adel Sports and Social Club
712 Pool Recreation Ground
741 Bramhope Recreation Ground
746 West Park Leeds RUFC Ground
26 Bedquilts Recreation Ground
1493 Cookridge Cricket Club
1500 Old Moderians Association
5.7.1 The quantity of outdoor sports provision on the above sites is as follows:
Type No. Area (ha)
Adult Pitches 12 14.4
Junior Pitches 1 0.5
Cricket Pitches 12 16.44
Tennis Courts 10 0.742
Bowling Green 3 0.42
Synthetic Pitches 2 1.4
Total 40 33.90
5.7.2 Quantity (per thousand people) - 33.90 ÷ 19.43 = 1.74 hectares 5.7.3 Conclusions - Compared against the standard of 1.2 hectares per 1000
population, Adel & Wharfedale Ward exceeds recommended Core Strategy standard and has a surplus of provision in terms of the quantity of outdoor sports provision.

Outdoor Sports Provision Kirkstall Ward
SITE_ID SITE_NAME
1375 Leeds Rugby Academy
928 Stanmore Terrace Sports Ground
34 Burley Park
70 Kirkstall Abbey Estate
1382 Abbey Gardens Rugby Pitches
1679 Butcher Hill Sports Ground
387 The Village Street Recreation Ground
1822 Willow Road - Rising Sun POS
1256 Queenswood Drive Sports Pitches
1833 Hawksworth Wood
1322 West Park Playing Fields
25 Becketts Park
25 Becketts Park
The quantity of outdoor sports provision on the above sites is as follows:
Type No. Area (ha)
Adult Pitches 21 25.2
Junior Pitches 5 2.5
Cricket Pitches 3 4.11
Tennis Courts 15 1.11
Bowling Green 4 0.56
Synthetic Pitches 0 0
Total 48 33.48
Quantity (per thousand people) – 33.48 ÷ 21.709 = 1.54 hectares Conclusions - Compared against the standard of 1.2 hectares per 1000 population, Kirkstall Ward exceeds the recommended Core Strategy standard and so has surplus provision in terms of the quantity of outdoor sports provision. Outdoor Sports Provision Headingley Ward
SITE_ID SITE_NAME
893 Headingley Stadium - Rugby Ground
894 Headingley Stadium - Yorkshire Cricket Club
The quantity of outdoor sports provision on the above sites is as follows:
Type No. Area (ha)
Adult Pitches 1 1.2
Junior Pitches 0 0
Cricket Pitches 1 1.37
Tennis Courts 0 0
Bowling Green 0 0
Synthetic Pitches 0 0
Total 2 2.57

Quantity (per thousand people) – 2.57 ÷ 20.533 = 0.12 hectares Compared against the standard of 1.2 hectares per 1000 population, Headingley Ward falls significantly below the recommended Core Strategy standard and so has an extreme under provision in terms of the quantity of outdoor sports provision. Outdoor Sports Provision Weetwood Ward
SITE_ID SITE_NAME
100 Tinshill Recreation Ground
1790 Lawnswood Recreation Ground
98 The Hollies
1322 West Park Playing Fields
25 Becketts Park
891 St Chads Tennis Club
892 St Chads Broomfield Cricket Club
The quantity of outdoor sports provision on the above sites is as follows:
Type No. Area (ha)
Adult Pitches 13 15.6
Junior Pitches 2 1
Cricket Pitches 2 2.74
Tennis Courts 15 1.11
Bowling Green 0 0
Synthetic Pitches 0 0
Total 32 20.45
Quantity (per thousand people) – 20.45 ÷ 22.375 = 0.91 hectares Compared against the standard of 1.2 hectares per 1000 population, Weetwood Ward falls below the recommended Core Strategy standard and so has an under provision in terms of the quantity of outdoor sports provision. Outdoor Sports Provision Moortown Ward
SITE_ID SITE_NAME
144 Meanwood Park
113 Carr Manor Recreation Ground
1598 Yorkshire Bank Sports Ground
985 The Moor Allerton Sports and Social Centre
945 David Lloyd Sports Club
60 Highbury Cricket Club (Disused)
946 Stonegate Road Recreation Ground
98 The Hollies
1283 Meanwood Cricket Club
518 Round Legions Club (Rugby Ground)
The quantity of outdoor sports provision on the above sites is as follows:
Type No. Area (ha)
Adult Pitches 4 4.8

Junior Pitches 2 1
Cricket Pitches 2 2.74
Tennis Courts 22 1.63
Bowling Green 2 0.28
Synthetic Pitches 0 0
Total 32 10.45
Quantity (per thousand people) – 10.45 ÷ 22.792 = 0.46 hectares Compared against the standard of 1.2 hectares per 1000 population, Moortown Ward falls noticeably below the recommended Core Strategy standard and so has an under provision in terms of the quantity of outdoor sports provision. Outdoor Sports Provision Alwoodley Ward
SITE_ID SITE_NAME
122 Cranmer Bank Recreation Ground
516 Shadwell Lane Recreation Ground
1513 Leodiensions Rugby Pitches
1293 Alwoodley Cricket Club
693 Allerton High School
689 Alwoodley Park
698 Wigton Sports Association
688 Alwoodley Community Association Sports Ground
5.8.1 The quantity of outdoor sports provision on the above sites is as follows:
Type No. Area (ha)
Adult Pitches 11 13.2
Junior Pitches 6 3
Cricket Pitches 2 2.74
Tennis Courts 2 0.148
Bowling Green 0 0
Synthetic Pitches 0 0
Total 21 19.09
5.8.2 Quantity (per thousand people) - 19.09 ÷ 22.776 = 0.84 hectares 5.8.3 Conclusions - Compared against the standard of 1.2 hectares per 1000
population, Alwoodley ward falls short of the recommended Core Strategy standard and so is deficient in terms of the quantity of outdoor sports provision.
Outdoor Sports Provision Roundhay Ward
SITE_ID SITE_NAME
502 Gledhow Lane Cricket Pitch
1719 Roundhay Tennis Club
150 Roundhay Park
The quantity of outdoor sports provision on the above sites is as follows:
Type No. Area (ha)

Adult Pitches 6 7.2
Junior Pitches 6 3
Cricket Pitches 7 9.59
Tennis Courts 18 1.33
Bowling Green 1 0.14
Synthetic Pitches 0 0
Total 38 21.26
Quantity (per thousand people) - 21.26 ÷ 22.546 = 0.94 hectares 5.8.3 Conclusions - Compared against the standard of 1.2 hectares per 1000 population, Roundhay ward falls short of the recommended Core Strategy standard and so is deficient in terms of the quantity of outdoor sports provision. Outdoor Sports Provision Chapel Allerton Ward
SITE_ID SITE_NAME
1273 Chapel Allerton Tennis, Squash and Gym Club
1546 Scott Hall Sports Pitches
115 Chapel Allerton Park
496 Yorkshire Amateur FC
1281 Scott Hall Pitches
1175 Newton Road
1167 Meanwood Road
935 Meanwood Road Rugby Club
936 Woodhouse Cricket Club
111 Buslingthorpe Recreation Ground
87 Potternewton Park
1532 Chapel Town Football Youth Development Centre
The quantity of outdoor sports provision on the above sites is as follows:
Type No. Area (ha)
Adult Pitches 12 14.4
Junior Pitches 1 0.5
Cricket Pitches 3 4.11
Tennis Courts 17 1.26
Bowling Green 4 0.56
Synthetic Pitches 0 0
Total 37 20.83
Quantity (per thousand people) - 20.83 ÷ 23.536 = 0.88 hectares Conclusions - Compared against the standard of 1.2 hectares per 1000 population, Chapel Allerton ward falls short of the recommended Core Strategy standard and so is deficient in terms of the quantity of outdoor sports provision. Outdoor Sports Provision – Overall Conclusions 5.10.1 If the totals of the 9 wards are added together it creates an overall standard of 1.01 hectares per 1,000 population. This is less than the Core Strategy standard and reflects the fact that of the 9 wards, only 3 have a surplas in the quantity of outdoor sport

provision and 6 of the wards are deficient, two of which are very significantly deficient (Headingley and Moortown).
Amenity Greenspace Amenity Greenspace Horsforth Ward
SITE_ID SITE_NAME AREA_ha
1352 King George Road 0.283
1666 Fulford Grange 1 0.276
1667 Fulford Grange 2 0.368
1342 Emmott Drive 0.215
1491 Roos Field 0.239
162 Woodside Recreation Ground 1.265
1402 Woodside Park Avenue POS 1.863
Total 4.509
5.12.1 Quantity (per thousand people) - 4.509 ÷ 22.457 = 0.20 hectares 5.12.2 Conclusions - Compared against the standard of 0.45 hectares per 1000
population, Horsforth Ward falls short of the recommended Core Strategy standard and so is deficient in terms of the quantity of amenity greenspace.
Amenity Greenspace Adel & Wharfedale Ward
SITE_ID SITE_NAME AREA_HA
735 Swallow Drive Greenspace 0.354
989 Mullbery Greenspace 0.869
186 Holtdale Place 1.133
1660 Ridgeside 0.416
1250 Cookridge Village Hall 0.113
972 Oaklands Fold Greenspace 0.211
1651 Holt Lane 2.311
1655 Hilton Grange 0.881
1252 Holtdale Approach 0.688
1253 Holtdale Green 0.493
1874 Holtdale Approach 0.460
Total 7.929
5.11.1 Quantity (per thousand people) 7.929 ÷ 19.430 = 0.40 hectares 5.11.2 Conclusions - Compared against the standard of 0.45 hectares per 1000
population, Adel & Wharfedale ward falls fractionally below the recommended Core Strategy standard and so has an under provision of amenity greenspace.
Amenity Greenspace Kirkstall Ward
SITE_ID SITE_NAME AREA_HA
1263 Queenswood Gardens 0.247
1374 Commercial Road Wildlife Garden 0.852
1847 West Park Ring Road Open Space 5.992
1677 Beckett Park Community Centre 0.276

471 Vesper Road Quarry 0.291
389 Greenhow Road 0.634
1822 Willow Road - Rising Sun POS 1.139
1373 Kirkstall Hill Amenity Area 1.080
1708 Norman Towers 0.678
Total 11.189
Quantity (per thousand people) 11.189 ÷ 21.709 = 0.51 hectares 5.11.2 Conclusions - Compared against the standard of 0.45 hectares per 1000
population, Kirkstall ward exceeds the recommended Core Strategy standard and so has small surplus provision in terms of the quantity of amenity greenspace.
Amenity Greenspace Headingley Ward
SITE_ID SITE_NAME AREA_HA
932 Grosvenor Road Greenspace 0.415
1533 Hinsley Hall 0.529
105 Lupton Flats Greenspace 0.975
Total 1.919
Quantity (per thousand people) – 1.919 ÷ 20.533 = 0.09 hectares Conclusions - Compared against the standard of 0.45 hectares per 1000 population, Headingley Ward falls extremely short of the recommended Core Strategy standard and so is deficient in terms of the quantity of amenity greenspace. Amenity Greenspace Weetwood Ward
SITE_ID SITE_NAME AREA_HA
1755 Haven Chase POS 0.346
943 Weetwood Avenue Greenspace 0.248
1221 Iveson Drive 0.294
1662 Becket Park Campus - The Acre 1.808
888 St Chad's Parish Centre 0.582
934 Grove Lane Greenspace 0.740
1527 Tinshill Mount 0.236
1158 Cookridge Methodist Church 0.217
1784 Cookridge Hospital Grounds 2. 0.632
1783 Cookridge Hospital Grounds 1. 1.285
1879 Former Headingley Filter Beds 0.543
Total 6.931
Quantity (per thousand people) – 6.931 ÷ 22.375 = 0.31 hectares Conclusions - Compared against the standard of 0.45 hectares per 1000 population, Weetwood Ward falls short of the recommended Core Strategy standard and so is deficient in terms of the quantity of amenity greenspace. Amenity Greenspace Moortown Ward
SITE_ID SITE_NAME AREA_HA

113 Carr Manor Recreation Ground 4.252
515 Church Crescent Greenspace 0.349
517 High Moor Avenue Greenspace 0.891
899 Stonegate Lane Greenspace 0.463
945 David Lloyd Sports Club 9.428
65 Mill Pond Lane Greenspace 0.555
1595 Queenshill 0.372
946 Stonegate Road Recreation Ground 10.511
1217 Leafield POS 0.273
900 Church Avenue Greenspace 0.433
897 Stonegate Approach Greenspace 0.510
Total 28.037
Quantity (per thousand people) – 28.037 ÷ 22.792 = 1.23 hectares Conclusions - Compared against the standard of 0.45 hectares per 1000 population, Moortown Ward exceeds the recommended Core Strategy standard and so has surplus provision in terms of the quantity of amenity greenspace. 5.13 Amenity Greenspace Alwoodley
SITE_ID SITE_NAME AREA_HA
700 Lingfield Hill Greenspace 0.217
429 Alderton Crescent 0.251
431 Tynwald Road 0.284
432 Tynwald Drive 0.268
433 Saxon Grove Wood 1.397
434 Boundary Farm Road - Church of the Nazarene 0.266
435 Deanswood 0.744
427 Scotland Wood Road Greenspace 0.503
444 Sandringham Gardens 0.725
451 Lingfield Gate 0.358
690 Windermere Drive 0.240
687 Birkdale Walk Greenspace 0.397
977 Middlethorne Rise Greenspace 1.276
978 Moss Plantation 4.476
980 Shadwell Lane Greenspace 0.726
1230 High Ash Drive 0.570
686 Nursery Grove Greenspace 0.269
691 St Barnabos Church 0.266
1268 Tynwald Road POS 0.251
1876 Saxton Mount/Tynwald Drive 0.259
Total 13.743
5.13.1 Quantity (per thousand people) 13.743 ÷ 22.776 = 0.60 hectares 5.13.2 Conclusions - Compared against the standard of 0.45 hectares per 1000 population, Alwoodley ward exceeds the recommended Core Strategy standard and so has a small surplus of provision in terms of the quantity of amenity greenspace. Amenity Greenspace Roundhay Ward

SITE_ID SITE_NAME AREA_HA
498 Brackenwood Community Centre 0.369
508 Lidgett Towers Greenspace 0.311
336 Upland Crescent / Easterly Avenue Amenity Area 0.617
356 Foxglove Avenue Greenspace 2.191
1540 Lincombe Mount 0.412
506 Gledhow Towers Greenspace 0.506
Total 4.406
Quantity (per thousand people) - 4.406 ÷ 22.546 = 0.19 hectares Conclusions - Compared against the standard of 0.45 hectares per 1000 population, Roundhay Ward falls short of the recommended Core Strategy standard and so is deficient in terms of the quantity of amenity greenspace. Amenity Greenspace Chapel Allerton Ward
SITE_ID SITE_NAME AREA_HA
1174 Beckhill Fold 0.420
939 Meanwood Road Green Corridor (1) 3.059
1172 Potternewton Heights 0.610
1167 Meanwood Road 1.817
752 Meanwood Valley Model Farm 10.016
1596 Reginald Street 0.845
410 Gledhow Manor Park 1.137
1815 St Martins Institute 0.270
Total 18.174
Quantity (per thousand people) – 18.174 ÷ 23.536 = 0.77 hectares Conclusions - Compared against the standard of 0.45 hectares per 1000 population, Chapel Allerton Ward exceeds the recommended Core Strategy standard and so has surplus provision in terms of the quantity of amenity greenspace. Amenity Greenspace – Overall Conclusions If the totals for the 9 wards are added together it creates an overall standard of 0.4778 hectares per 1,000 population for the area. This exceeds the Core Strategy standard however this figure is an average so whilst there is an excess of provision in 4 Wards, there is an under provision in 5 Wards with Headingley coming out as very deficient.
Children and Young People’s equipped play facilities: 5.15 Methodology 5.15.1 These lists exclude play facilities that are in educational use, since these are only
available during the school day and by the children attending that particular school. Children & Young People’s Equipped Play Facilities Horsforth Ward
SITE_ID SITE_NAME

61 Horsforth Hall Park
162 Woodside Recreation Ground
1356 Jubilee Hall
Type of Facility Number
MUGA 0
Child Play Area 4
Skate Park 1
Teen Shelter 0
TOTAL 5 FACILITIES
5.17.1 Requirement and provision - 3.885 × 2 = 7.8 facilities are required to meet the
Core Strategy standard of 2 facilities per 1,000 children. Therefore Horsforth Ward does not meet the standard as it only has 5 children’s play facilities.
Children & Young People’s Equipped Play Facilities Adel & Wharfedale Ward
SITE_ID SITE_NAME
740 Bramhope Playground ("The Knoll")
58 Holt Park
1660 Ridgeside
1250 Cookridge Village Hall
1651 Holt Lane
712 Pool Recreation Ground
TOTAL
Type of Facility Number
MUGA 1
Child Play Area 6
Skate Park 1
Teen Shelter 0
TOTAL 8 Facilities
5.16.1 Requirement and provision – 3.656 x 2 = 7 facilities required to meet the Core
Strategy standard of 2 facilities per 1,000 children. Therefore Adel & Wharfedale ward has a slight surplus in terms of Children and Young People’s Equipped Play provision as it has 8 facilities.
Children & Young Peoples Equipped Play Facilities Kirkstall Ward
SITE_ID SITE_NAME
34 Burley Park
70 Kirkstall Abbey Estate
1833 Hawksworth Wood
25 Becketts Park
25 Becketts Park
Type of Facility Number
MUGA 1
Child Play Area 5
Skate Park 2

Teen Shelter 0
TOTAL 8
5.17.2 Requirement and provision – 3.224 × 2 = 6.4 facilities are required to meet the
Core Strategy standard of 2 facilities per 1,000 children. Therefore Kirkstall Ward has a surplus in terms of Children and Young People’s Equipped Play provision as it has 8 facilities.
5.17.3 Children & Young Peoples Equipped Play Facilities Headingley Ward
SITE_ID SITE_NAME
216 Headingley Cricket Ground Practice Area
Type of Facility Number
MUGA 3
Child Play Area 0
Skate Park 0
Teen Shelter 0
TOTAL 3 Facilities
5.17.4 Requirement and provision – 0.777 × 2 = 1.55 facilities are required to meet the
Core Strategy standard of 2 facilities per 1,000 children. Therefore Headingley Ward has a surplus in terms of Children and Young People’s Equipped Play provision as it has 3 facilities.
Children & Young Peoples Equipped Play Facilities Weetwood Ward
SITE_ID SITE_NAME
1527 Tinshill Mount
25 Becketts Park
1492 Silk Mill Bank
Type of Facility Number
MUGA 0
Child Play Area 4
Skate Park 1
Teen Shelter 1
TOTAL 6 Facilities
5.17.5 Requirement and provision – 3.537 × 2 = 7.07 facilities are required to meet the
Core Strategy standard of 2 facilities per 1,000 children. Therefore Weetwood Ward does not meet the standard as it only has 6 children’s play facilities.
Children & Young Peoples Equipped Play Facilities Moortown Ward
SITE_ID SITE_NAME
144 Meanwood Park
985 The Moor Allerton Sports and Social Centre
898 Stonegate Approach Recreation Ground
1282 Meanwood Park Hospital Grounds (Former)
Type of Facility Number

MUGA 1
Child Play Area 6
Skate Park 1
Teen Shelter 0
TOTAL 8 Facilities
5.17.6 Requirement and provision – 3.947 × 2 = 7.89 facilities are required to meet the
Core Strategy standard of 2 facilities per 1,000 children. Therefore Moortown Ward has a small surplus in terms of Children and Young People’s Equipped Play provision as it has 8 facilities.
5.17 Children & Young Peoples Equipped Play Facilities Alwoodley
SITE_ID SITE_NAME
122 Cranmer Bank Recreation Ground
1510 Cragg Lane Rec
Type of Facility Number
MUGA 0
Child Play Area 2
Skate Park 1
Teen Shelter 0
TOTAL 3 Facilities
5.18.1 Requirement and provision - 4.478 × 2 = 9 facilities are required to meet the
Core Strategy standard of 2 facilities per 1,000 children. Therefore Alwoodley Ward is significantly under provided for in terms of Children and Young People’s Equipped Play provision as it has only 3 facilities, a third of the required amount.
Children & Young Peoples Equipped Play Facilities Roundhay Ward
SITE_ID SITE_NAME
983 The Bumps
412 Chandos Gardens Playground
150 Roundhay Park
Type of Facility Number
MUGA 1
Child Play Area 6
Skate Park 1
Teen Shelter 0
TOTAL 8 Facilities
Requirement and provision – 4.901 × 2 = 9.8 facilities are required to meet the Core Strategy standard of 2 facilities per 1,000 children. Therefore Roundhay Ward is under provided for in terms of Children and Young People’s Equipped Play provision as it has only 8 facilities. Children & Young Peoples Equipped Play Facilities Chapel Allerton Ward
SITE_ID SITE_NAME
115 Chapel Allerton Park

1272 Miles Hill
1281 Scott Hall Pitches
111 Buslingthorpe Recreation Ground
87 Potternewton Park
1596 Reginald Street
1532 Chapel Town Football Youth Development Centre
Type of Facility Number
MUGA 1
Child Play Area 6
Skate Park 1
Teen Shelter 0
TOTAL 8 Facilities
Requirement and provision – 4.794 × 2 = 9.59 facilities are required to meet the Core Strategy standard of 2 facilities per 1,000 children. Therefore Chapel Allerton Ward is under provided for in terms of Children and Young People’s Equipped Play provision as it has only 8 facilities. Children and Young Peoples Equipped Play Facilities – Overall Conclusions If the totals for the 9 wards are added together there are 57 children and young people’s equipped play facilities in the North HMCA. To meet the Core Strategy standard the requirement is for a quantity of 66.1 facilities. This indicates that overall the North HMCA is under-provided for in terms of quantity of equipped play facilities with Alwoodley ward having the greatest deficiency. Allotments: Allotments Horsforth Ward
SITE_ID SITE_NAME AREA_HA
823 Willow Green Allotments 1.470
1704 Springfield Close Allotments 0.389
1834 Low Hall Road Allotments 0.244
1106 Broadgate Lane (King Edward Avenue) Allotments 0.727
1103 Cragg Wood Allotments 1.018
Total 3.848
5.21.1 Quantity (per thousand people) - 3.848 ÷ 22.457 = 0.17 hectares 5.21.2 Conclusions - Compared against the standard of 0.24 hectares per 1000
population, Horsforth Ward falls short of the recommended standard and so is deficient in terms of the quantity of allotments.
Allotments Adel & Wharfedale Ward
SITE ID SITE_NAME AREA_HA
1756 Arthington Allotments 0.379
TOTAL 0.379
5.20.1 Quantity (per thousand people) 0.379 ÷ 20.354 = 0.02 hectares

5.20.2 Conclusions - Compared against the standard of 0.24 hectares per 1000
population, Adel & Wharfedale ward falls short of the recommended standard and so is deficient in terms of the quantity of allotments.
Allotments Kirkstall Ward
SITE_ID SITE_NAME AREA_HA
1707 Church Lane Allotment - Kirkstall 2.289
142 Beechwood Crescent Allotments 0.574
1002 Burley Model Allotment 2.797
1705 Headingley Station Allotments 2.504
477 Burley Mills (aka Goit Allotments) 6.534
Total 14.698
Quantity (per thousand people) - 14.698 ÷ 21.709 = 0.68 hectares Conclusions - Compared against the standard of 0.24 hectares per 1000 population, Kirkstall Ward exceeds the recommended Core Strategy standard and so has surplus provision in terms of the quantity of allotments. Allotments Headingley Ward
SITE_ID SITE_NAME AREA_HA
1020 St Anne's Road Allotments 0.556
1021 Ash Road Allotments 4.048
Total 4.604
Quantity (per thousand people) - 4.604 ÷ 20.533 = 0.22 hectares Conclusions - Compared against the standard of 0.24 hectares per 1000 population, Headingley Ward falls slightly short of the recommended standard and so is deficient in terms of the quantity of allotments. Allotments Weetwood Ward
SITE_ID SITE_NAME AREA_HA
1022 Hollin Lane Allotments (Mill Race) 2.179
Total 2.179
Quantity (per thousand people) - 2.179 ÷ 22.375 = 0.10 hectares Conclusions - Compared against the standard of 0.24 hectares per 1000 population, Weetwood Ward falls short of the recommended standard and so is deficient in terms of the quantity of allotments. Allotments Moortown Ward
SITE_ID SITE_NAME AREA_HA
933 Parkside Road Allotments 0.860

919 Stonegate Road Allotments 0.402
1023 Highbury Small Holding 0.224
Total 1.486
Quantity (per thousand people) - 1.486 ÷ 22.792 = 0.06 hectares Conclusions - Compared against the standard of 0.24 hectares per 1000 population, Moortown Ward falls significantly short of the recommended standard and so is deficient in terms of the quantity of allotments. Allotments Alwoodley Ward
SITE_ID SITE_NAME AREA_HA
1842 Deanswood Drive Allotments 0.234
Total 0.234
5.22.1 Quantity (per thousand people) 0.234 ÷ 22.776 = 0.01 hectares 5.22.2 Conclusions -Compared against the standard of 0.24 hectares per 1000
population, Alwoodley Ward falls significantly short of the recommended standard and so is deficient in terms of the quantity of allotments.
Allotments Roundhay Ward
SITE_ID SITE_NAME AREA_HA
503 Roundhay Allotment Gardens 1.613
504 North Park Avenue Allotments 1.495
Total 3.108
Quantity (per thousand people) - 3.108 ÷ 20.354 = 0.15 hectares Conclusions - Compared against the standard of 0.24 hectares per 1000 population, Roundhay Ward falls short of the recommended standard and so is deficient in terms of the quantity of allotments. Allotments Chapel Allerton Ward
SITE_ID SITE_NAME AREA_HA
1589 Bandstand Allotments 1.212
413 Gledhow Valley Allotments 4.292
1173 Meanwood Valley Urban Farm 0.289
Total 5.793
Quantity (per thousand people) - 5.793 ÷ 23.536 = 0.25 hectares Conclusions - Compared against the standard of 0.24 hectares per 1000 population, Chapel Allerton Ward slightly exceeds the recommended Core Strategy standard and so has surplus provision in terms of the quantity of allotments. 5.23 Allotments – overall conclusions 5.23.1 If the totals for the 9 wards are added together it creates an overall average
provision of 0.184 hectares per 1,000 population. This is less than the Core

Strategy standard and reflects the fact that the majority of the wards in the North HMCA are under-provided for in terms of the quantity of allotments, with two of the wards being very deficient. Only 2 of the 9 wards have a surplas in provision.
Natural Greenspace
Natural Greenspace Horsforth
SITE_ID SITE_NAME AREA_ha
1404 Little Hawksworth Wood 3.634
1355 Simms Pond 0.353
702 Park Lane College Horsforth 7.841
62 Hungerhills Wood 6.346
1665 Fulford Grange Meadow 1.077
1413 Orchard Hill 2.203
1658 Hall Lane (Hunger Hills Wood Smaller Site) 0.512
1785 Cragg Wood South 9.985
1787 Cragg Wood North 5.671
634 Calverley Picnic Area 1.341
1314 Bank Avenue/Gardens (Rear of) 0.225
1064 Wetstone Plantation 11.871
1140 Haigh Wood, West of the Railway Line 9.278
1111 Cragg Hill Farm 1.386
1412 Springwood Road (Rear of) 1.166
1380 New Road Side - Former Sewage Works 3.353
1381 The Outwood - Horsforth 2.281
1403 Cragg Wood Road 0.365
1401 High Fields 1.095
764 Swaine Wood 6.705
1110 Cragg Wood 3.533
1875 Victoria Mount/Crescent 2.482
1877 Rear of Woodside Pub 1.169
Total 83.872
5.25.1 Quantity (per thousand people) - 83.872 ÷ 22.457 = 3.73 hectares 5.25.2 Conclusions - Compared against the standard of 0.7 hectares per 1000
population, Horsforth Ward significantly exceeds the recommended standard and so has surplus provision in terms of the quantity of natural greenspace.
Natural Greenspace Adel & Wharfedale Ward
SITE_ID SITE_NAME AREA_HA
988 Tile Lane Wood 0.233
31 Breary Marsh 14.908
1721 Hall Drive 3.598
1354 Moseley Wood Croft 0.771
83 Otley Chevin Country Park 35.735
971 Smithy Mills Wood 0.651
973 Oaklands Grove Greenspace 0.310
974 East Moor Wood 2.255
1654 Hillcrest 1.425

1703 Smithy Lane Woods. 4.461
713 Pool Road Greenspace 1.669
747 Well Head Wood 2.709
748 Spring Wood 3.163
18 Adel Woods 4.744
154 Scotland Woods 4.597
1664 Mosley Beck 0.880
1501 Chestnut Plantation 3.275
990 Adel Wood (Adj to Long Causeway) 1.279
Total 86.663
5.24.1 Quantity (per thousand people) - 86.663 ÷ 19.430 = 4.46 hectares 5.24.2 Conclusions - Compared against the standard of 0.7 hectares per 1000
population, Adel & Wharfedale Ward exceeds the recommended Core Strategy standard by a huge margin and so has surplus provision in terms of the quantity of natural greenspace.
Natural Greenspace Kirkstall Ward
SITE_ID SITE_NAME AREA_HA
1706 Morris Woods 6.171
1672 Fillingfir Flicks 0.846
1198 Hollybush Wild Flower (BTCV) 0.402
1197 Monks Wood 1.048
474 Woodland Off Lea Farm Mount 5.063
475 Hawksworth Woods 1.396
476 Goits Woodland Walk 1 3.595
Total 18.521
Quantity (per thousand people) – 18.521 ÷ 21.709 = 0.85 hectares 5.25.2 Conclusions - Compared against the standard of 0.7 hectares per 1000
population, Kirkstall Ward exceeds the recommended standard and so has surplus provision in terms of the quantity of natural greenspace.
Natural Greenspace Headingley Ward
SITE_ID SITE_NAME AREA_HA
160 Woodhouse Ridge 10.881
1718 Shire View 1.121
Total 12.002
Quantity (per thousand people) – 12.002 ÷ 20.533 = 0.58 hectares Conclusions - Compared against the standard of 0.7 hectares per 1000 population, Headingley Ward falls short of the recommended standard and so is deficient in terms of the quantity of natural greenspace.

Natural Greenspace Weetwood Ward
SITE_ID SITE_NAME AREA_HA
1369 Haven Chase 0.511
1367 Ireland Wood & Cookridge Hospital Grounds 8.561
1141 Iveson Wood 2.634
1142 Clayton Wood 13.308
1143 Spring Wood 6.660
944 Weetwood Avenue Wood 0.660
1180 Ireland Wood B 2.339
1661 Queenswood Drive (Rear of) 5.875
98 The Hollies 22.664
1145 Back House Wood 2.961
1220 Bedford Close 0.364
1140 Haigh Wood, West of the Railway Line 0.166
1528 Church Wood 3.409
1370 Luttrell Crescent 0.536
1526 Ireland Wood 2.750
1522 Silk Mill Mews East 0.361
1791 Laith Road 1.413
1144 Daffy Wood 5.482
Total 80.654
Quantity (per thousand people) – 80.654 ÷ 22.375 = 3.6 hectares Conclusions - Compared against the standard of 0.7 hectares per 1000 population, Weetwood Ward significantly exceeds the recommended standard and so has surplus provision in terms of the quantity of natural greenspace. Natural Greenspace Moortown Ward
SITE_ID SITE_NAME AREA_HA
921 Ridge Plantation 2.977
923 Tongue Lane Wood 0.682
17 Addymans Wood 2.602
926 Tunnel How Wood 1.702
1171 Leafield Grange 0.227
145 The Spinney 0.267
98 The Hollies 0.088
1178 Highwood Grove Woods 0.856
1177 Shadwell Ring Road Woods 1.316
901 Parkside Green Greenspace 0.702
1282 Meanwood Park Hospital Grounds (Former) 17.486
Total 28.905
Quantity (per thousand people) – 28.905 ÷ 22.792 = 1.27 hectares

5.25.2 Conclusions - Compared against the standard of 0.7 hectares per 1000 population, Moortown Ward exceeds the recommended standard and so has surplus provision in terms of the quantity of natural greenspace.
Natural Greenspace Alwoodley Ward
SITE_ID SITE_NAME AREA_HA
448 Sandringham Mount Wood 0.710
449 Fir Tree Wood 2.391
981 Dark Wood 2.330
982 Birch Wood 3.543
1649 Goodrick Lane 0.570
1645 Shadwell Lane 0.346
1179 Moor Allerton POS 0.454
1600 Verity's Shaft 0.274
689 Alwoodley Park 12.226
18 Adel Woods 43.541
154 Scotland Woods 16.841
692 The Valley Greenspace 0.444
75 Moss Woods 5.457
Total 89.127
5.26.1 Quantity (per thousand people) - 89.127 ÷ 22.776 = 3.91 hectares 5.26.2 Conclusions - Compared against the standard of 0.7 hectares per 1000 population, Alwoodley Ward exceeds the recommended standard and so has surplus in terms of the quantity of natural greenspace. Natural Greenspace Roundhay Ward
SITE_ID SITE_NAME AREA_HA
52 Gledhow Valley Woods 15.634
17 Addymans Wood 6.951
463 Gledhow Valley Road Wood 8.230
50 Gipton Wood 8.207
1486 Park Road Avenue Woodland 1.333
1712 Wetherby Road POS 0.334
465 Ravenscar Wood 1.251
1539 Wetherby Road Meadow 2.873
260 Asket Hill 3.132
325 Hollin Hill Wood /Oakwood Green 2.367
509 Roundhay Hall Hospital 2.307
1887 Elmette/Roundhay Woods 3.387
Total 56.006
Quantity (per thousand people) – 56.006 ÷ 22.546 = 2.48 hectares 5.25.2 Conclusions - Compared against the standard of 0.7 hectares per 1000
population, Roundhay Ward exceeds the recommended standard and so has surplus provision in terms of the quantity of natural greenspace.
Natural Greenspace Chapel Allerton Ward

SITE_ID SITE_NAME AREA_HA
1545 Scott Hall Drive 2.115
1824 Sugarwell Hill 10.049
408 Chapel Allerton Park Wood 1.150
160 Woodhouse Ridge 0.931
676 Scott Hall Farm 1.594
510 Gledhow Lane Wood 5.086
Total 20.925
Quantity (per thousand people) – 20.925 ÷ 23.536 = 0.89 hectares 5.25.2 Conclusions - Compared against the standard of 0.7 hectares per 1000
population, Chapel Allerton Ward exceeds the recommended standard and so has surplus provision in terms of the quantity of natural greenspace.
Natural Greenspace – Overall Conclusions
If the totals for the 9 wards are added together it creates an overall standard of 2.42 hectares per 1,000 population for the area. This well exceeds the Core Strategy standard however this figure is an average. Provision is in surplus in 8 wards, with three of those wards having quite significant surplas. Only one ward (Headingley) has an under provision of natural greenspace.
6.0 Overall summary 6.1 The table below summarises the analysis of quantity of provision by greenspace
type and ward. Parks and
Gardens Outdoor Sports (excluding education)
Amenity Children & Young People
Allotments Natural
Standard 1ha/1000 people
1.2ha/1000 people
0.45ha/1000 people
2 facilities/ 1000 children
0.24ha/1000 people
0.7ha/1000 people
Horsforth Deficiency (0.08ha)
Surplus (0.5ha)
Deficiency (0.25ha)
Deficiency (2.8 facilities)
Deficiency (0.07ha)
Surplus (3.03ha)
Adel & Wharfedale
Surplus (2.57ha)
Surplus (0.54ha)
Deficiency (0.05ha)
Surplus (1 facility)
Deficiency (0.22ha)
Kirkstall Surplus (1.76ha)
Surplus (0.34ha)
Surplus (0.06ha)
Surplus (0.16 facilities)
Surplus (0.44ha)
Surplus (0.15ha)
Headingley Deficiency (0.9ha)
Deficiency (1.08ha)
Deficiency (0.36ha)
Surplus (1.45 facilities)
Deficiency (0.02ha)
Deficiency (0.12ha)
Weetwood Surplus (0.05ha)
Deficiency (0.29ha)
Deficiency (0.14ha)
Deficiency (1.07 facilities)
Deficiency (0.14ha)
Surplus (2.9ha)
Moortown Surplus (0.45ha)
Deficiency (0.74ha)
Surplus (0.78ha)
Surplus (0.11 facilities)
Deficiency (0.18ha)
Surplus (1.2ha)
Alwoodley Deficiency (-0.55 ha)
Deficiency (-0.36ha)
Surplus (0.15)
Deficiency of 6 facilities
Deficiency (-0.23 ha)
Surplus (1.91 ha)
Roundhay Surplus (5.67ha)
Deficiency (0.06ha)
Deficiency (0.26ha)
Deficiency (1.8 facilities)
Deficiency (0.09ha)
Surplus (1.78ha)

Chapel Allerton
Deficiency (0.15ha)
Deficiency (0.32ha)
Surplus (0.32ha)
Deficiency (1.5 facilities)
Surplus (0.01ha)
Surplus (0.19ha)
Average Surplus (0.975ha)
Deficiency (-0.31ha)
Requirement met (0.45ha total)
Deficiency (1.137 facilities)
Deficiency (-0.056ha)
Surplus (1.71ha)
Horsforth: It is noticeable that there are deficiencies in the provision of a number of greenspace types in Horsforth, though some are only marginally deficient. The exception is the considerable surplus of natural greenspace. Some of this may be suitable for laying out as parks and gardens, amenity, children and young people’s equipped play facilities or allotments. A comprehensive assessment will be required to determine the most appropriate use of surplus natural greenspace, whether this be for alternative greenspace typologies or potential development which could generate the funds to lay out new areas of greenspace which is currently deficient. Adel & Wharfedale: Generally speaking this ward is reasonably well provided for in terms of greenspace. It has a large surplas in the quantity of Parks and Gardens and natural greenspace but it is deficient in allotments and has a slight deficiency in amenity greenspace. Kirkstall: This is the only ward which has a surplus of provision in every type of greenspace which poses the question of whether any of this surplus land should be released for development to meet particularly housing requirements. Kirkstall lies within the Main Urban Area therefore development in the ward would fit with the general locational strategy for development as set out in Spatial Policy 1 of the draft Core Strategy. Headingley: Headingley is the most deficient ward with all typologies except Childrens and Young People’s Equipped Play facilities showing a deficiency. There is clearly little scope to address this through changing the type of surplus greenspace to one that is deficient, therefore the situation is reliant on laying out new greenspace. This could be delivered through development though in such a built up area, this would be subject to identifying new sites to lay out as greenspace. Weetwood: It is noticeable that there are deficiencies in the provision of a number of greenspace types in Weetwood. The exceptions are the surpluses of parks and gardens and natural greenspace. Some of this may be suitable for laying out as outdoor sport, amenity, children and young people’s equipped play facilities or allotments using the potential methods highlighted above, however the limited amount of surplus parks and gardens and natural greenspace is not enough to address the deficiencies in the other typologies. New land for greenspace will be required if the standards are to be met. A comprehensive assessment will be required to determine the most appropriate use of surplus parks and gardens and natural greenspace, whether this be for alternative greenspace typologies or potential development which could generate the funds to lay out new areas of greenspace which is currently deficient. Moortown: This ward has some small surplases of some typologies but of most significance is the deficiencies in allotments and outdoor sports provision. The deficiency in allotments reflects the position across the whole of the HMCA. Alwoodley: The most significant deficiency for this ward is in terms of children’s and young people’s equipped play facilities. It is also deficient in other typologies and only has a small surplas in terms of the quantity of amenity and natural greenspace.

Roundhay: This ward is well provided for in terms of Parks and Gardens and natural greenspace but it is deficient in all other typologies and is significantly deficient in the provision of children’s and young people’s equipped play facilities. Chapel Allerton: This ward is generally well balanced. It has some slight surplas of amenity greenspace, allotments and natural greenspace but not in any great excess. It has deficiencies in Parks and Gardens, Outdoor Sports and Children’s and Young People’s Equipped Play.
QUALITY OF GREENSPACE.
7.0 Methodology 7.1 Core Strategy Policy G3 identifies the following standards for the quality of
greenspace:
Greenspace type Quality
Parks and Gardens 7
Outdoor sports provision 7
Amenity greenspace 7
Children and young people’s equipped play facilities 7
Allotments 7
Natural Greenspace 7
7.2 Each type of greenspace should meet a quality score of 7. This score is
determined by assessing an area against a number of criteria, such as i) how welcoming; ii) level of health and safety; iii) cleanliness and maintenance; iv) conservation, habitats and heritage.
7.3 Plan 3 indicates whether the quality of each area of greenspace in the North
HMCA meets the required standard (a score of 7 and above) or not (a score of 6.9 or below). This only shows those areas of greenspace within the wards which fall within the North HMCA boundary. Those areas within those wards but outside the HMCA boundary are excluded.
7.4 The table below summarises key information about each typology. Parks and
Gardens Outdoor Sports
Amenity Children & young People
Allotments Natural
Number of sites 22 60 22 25 22 87
Number scoring 7 & above
3 18 11 5 4 3
Number scoring below 7
19 42 11 20 18 84
Highest score 7.46 9.5 8.18 7.46 7.83 8.9
Lowest score 3.26 1.84 1.13 3.26 0 1.12
Average score 5.59 6.06 5.15 5.76 5.30 4.72
7.5 Conclusions:
ACCESSIBILITY OF GREENSPACE

8.1 Core Strategy Policy G3 identifies the following standards for accessibility of greenspace. Each type of greenspace should be within the distance specified.
Greenspace type Accessibility distance
Parks and Gardens 720m
Outdoor sports provision Tennis courts – 720m Bowling greens and grass playing pitches – 3.2km Athletics tracks and synthetic pitches – 6.4km
Amenity greenspace 480m
Children and young people’s equipped play facilities
720m
Allotments 960m
Natural Greenspace 720m
8.2 Plans which show the required buffers as set out above, for each greenspace type
are available. Please contact Leeds City Council directly at [email protected]. Some conclusions are drawn out below:
8.2.1 Parks and Gardens The overwhelming majority of residential properties within the
north area have very good accessibility to Parks & Gardens, with the majority of the populated areas lying within 720m (a 10 minute walking distance) of parks and gardens. Only a very small proportion of residential properties fall beyond the 720m (10 minute walking distance) standard.
8.2.2 Outdoor Sports Provision The whole North area is within the required
accessibility distance (3.2km) for grass playing pitches, including bowling greens. Weetwood, Moortown, Chapel Allerton and Roundhay are well served by tennis courts and the majority of the area is within the (720m or 10 minute walking distance), with facilities beyond the North area boundary in Armley, Hyde Park & Woodhouse also serving the North area.
8.2.3 Amenity Greenspace Generally, the North area is well served by amenity
greenspace, with large areas of most wards able to access some form of amenity greenspace within the 480m buffer. The western edge of Horsforth ward is the most poorly served area in terms of amenity space accessibility, with Moortown the best served ward with the bulk of development falling within the 480m buffer.
8.2.4 Children and Young People’s Equipped Play Facilities Most of the built up
parts of the North area are within 720m of play facilities, however the south eastern part of Adel and Wharfedale and the northern part of Weetwood ward are the worst served, with the western edge of Horsforth ward also scoring poorly
8.2.5 Allotments A large part of the North area lies beyond the 960m threshold for
allotments, with accessibility to the north in Adel & Wharfedale, Alwoodley, and parts of Weetwood and Horsforth notably poor in comparison to the rest of the North area.
8.2.6 Natural Greenspace Only the north western and eastern edges of north area lie
beyond the accessibility to 20ha of natural greenspace within 2km Core Strategy G3 threshold. The overwhelming majority of the North area lies within 720m of some natural greenspace.
9.0 OVERALL CONCLUSIONS FROM THE GREENSPACE ANALYSIS IN NORTH: 9.1 Quantity 9.1.1 Overall North HMCA is well provided for in terms of certain types of greenspace,
though deficient in others. The most notable deficiency is in allotments, with some wards having very significant deficiencies. It should also be noted that most of the 9 wards generally have a reasonable level of provision, whilst lacking in some typologies this tends to be compensated with other typologies. However this is not the case in Headingley ward where there are deficiancies in all typologies except children’s and young people’s equipped play facilities. Kirkstall is the only ward in the HMCA to have a surplas of provision in all typologies.
9.1.2 The quantity of Parks and Gardens is very unevenly distributed across the HMCA
with some wards being very deficient (Headingley) and other wards having a large surplus (Adel and Wharfedale, Roundhay). The best provision is in natural greenspace with only Headingley ward having a deficiency. Horsforth, Adel and Wharfedale and Weetwood have very significant provision of natural greenspace. It should be noted that outdoor sport excludes a significant number of sport facilities within education facilities as they have been universally regarded as for the use of the school only and private. In some cases communities will have access to school pitches and facilities therefore these deficiencies may not exist.
9.1.3 There is a need to provide certain specific types of greenspace across all 9 wards.
This could be achieved by laying out some of the surplus areas of alternative greenspace types e.g. lay out some of the surplus natural greenspace to allotments which are deficient. Alternatively new areas which aren’t currently greenspace could be laid out to improve quantity of provision. This could be delivered by a developer as a requirement on new residential development or by the Council following the payment of commuted sums. If the typology of an area of greenspace is to be changed, it will need to be carefully assessed to ensure it is suitable and appropriate for the new type and not a well used and valued area of the original typology.
9.2 Quality 9.2.1 Across the North area, the majority of sites (194 out of 238) are below the required
quality standard of 7, which indicates an issue of substandard greenspace provision across all typologies in the area. The lack of good quality parks and gardens, natural greenspace and allotment sites is particularly noticeable.
9.3 Accessibility 9.3.1 Accessibility to all types of greenspace is generally good across the North area. QUESTIONS ABOUT GREENSPACE PROVISION IN NORTH General G1. Do you have any comments on the proposed boundary amendments,
additions and deletions to the greenspace provision in the area as shown on greenspace plan A?

G2. Do you think the Council should consider changing the type of greenspace where that type of greenspace is in surplus (ie more than meets the standard) to another type of greenspace that falls short of the standards?
G3. Do you think the Council should consider allowing development of any of the
greenspace sites where that type of greenspace is in surplus (ie more than meets the standard)? If so, which sites?
G4. The quality of many existing greenspace sites in the area falls below the
required standard. Do you agree that resources (including commuted sums obtained from planning permissions and legal agreements) should be channelled to improving quality of existing sites?
G5. Alternatively, if a site is of poor quality and/or disused, do you think it is
better to consider allowing development of that site to generate resources to invest in greenspace elsewhere?
G6. Do you agree that, where opportunities arise, new greenspace provision
should be provided in areas that fall below accessibility distance standards, to ensure residents have adequate access to different types of greenspace?
G7. Have you any other comments/suggestions about greenspace provision in
the area? Specific to North: G8. The existing UDP N1 greenspace designation at High Moor Avenue and the
open space to the west identified as amenity greenspace in the Open Space Audit, has been put forward as a possible housing site (SHLAA ref 81, see page 10 of Issues & Options). Do you think this land should be retained as greenspace (in one of the identified typologies) or released for housing??
G9. The existing UDP N5 (proposed greenspace) designation at land at Fraser
Avenue, Horsforth has been put forward as a possible housing site (SHLAA ref 1014, see page 11 Issues & Options). It was not identified as in a greenspace use in the Open Space Audit and has clearly not been delivered through Policy N5, therefore it is proposed to delete the allocation. Do you think this land should be retained as an opportunity for possible future greenspace or could it be released for housing?
G10. Part of the existing UDP N1A (allotments) designation at land off Gledhow
Valley Road, Chapel Allerton has been put forward as a possible housing site (SHLAA ref 1019, see page 11 Issues & Options). It was not identified as in a greenspace use in the Open Space Audit therefore it is proposed to amend the boundary of the allocation to exclude this land. Do you think this land should be retained as greenspace (in one of the identified typologies) or released for housing?
G11. The existing UDP N6 (playing pitches) designation at Highbury Cricket
Ground, North East Hollins Drive, Meanwood and the open space to the west identified as outdoor sport in the Open Space Audit, has been put forward as a possible housing site (SHLAA ref 1170, see page 13 Issues & Options). Do

you think this land should be retained as greenspace (in one of the identified typologies) or released for housing?
G12. The existing UDP N5 (proposed greenspace) designation at the Former
Yorkshire Bank Sports Ground, Shadwell Lane and the open space to the east identified as outdoor sport in the Open Space Audit, has been put forward as a possible housing site (SHLAA ref 1172, see page 13 Issues & Options). Do you think this site could be developed for housing or should it be retained as greenspace (in one of the identified typologies)?
G13. A significant part of the existing UDP N5 (proposed greenspace) designation
at land to rear of Oakford Terrace, Low Lane, Horsforth has been put forward as a possible housing site (SHLAA ref 1238, see page 14 Issues & Options). The majority of this site was identified as natural greenspace in the Open Space Audit. Do you think this land should be retained as an opportunity for possible future greenspace or could it be released for housing?
G14. A small part of the existing UDP N6 (playing pitches) designation at
Boddington Hall, Otley Road, Lawnswood has been put forward as a possible housing site (SHLAA ref 1299B, see page 15 Issues & Options). The whole N6 allocation (including the area beyond the SHLAA site) and the whole SHLAA site was identified as outdoor sport in educational ownership in the Open Space Audit. Do you think this land (the existing N6 allocation and the new areas identified through the Open Space Audit) should be allocated as greenspace (in one of the identified typologies) or released for housing?
G15. The existing UDP N5 (proposed greenspace) designation at land at Outwood
Lane, Horsforth has been put forward as a possible housing site (SHLAA ref 1310, see page 15 Issues & Options). It was not identified as in a greenspace use in the Open Space Audit and has clearly not been delivered through Policy N5, therefore it is proposed to delete the allocation. Do you think this land should be retained as an opportunity for possible future greenspace or could it be released for housing?
G16. The existing UDP N5 (proposed greenspace) designation at land at North
Ives Farm, Brownberrie Gardens, Horsforth has been put forward as a possible housing site (SHLAA ref 2046, see page 15 Issues & Options). It was not identified as in a greenspace use in the Open Space Audit and has clearly not been delivered through Policy N5, therefore it is proposed to delete the allocation (called land north of Brownberrie Walk/ Avenue for greenspace purposes). Do you think this land should be retained as an opportunity for possible future greenspace or could it be released for housing?
G17. The existing UDP N1A (allotments) designation at Carr Manor, Meanwood
has been put forward as part of a possible housing site (SHLAA ref 2055, see page 16 Issues & Options). The site was identified as allotments in the Open Space Audit. Do you think this land should be retained as greenspace (in one of the identified typologies) or released for housing?

G18. Part of the existing UDP N6 (playing pitches) designation at Allerton Grange Hill School, Talbot Avenue, Moor Allerton, identified as outdoor sport in educational ownership in the Open Space Audit, has been put forward as a possible housing site (SHLAA ref 2058, see page 16 Issues & Options). Do you think this land should be retained as greenspace (in one of the identified typologies) or released for housing?
G19. The existing UDP N6 (playing pitches) designation at Weetwood Avenue, Far
Headingley (Weetwood Sports Ground) has been put forward as part of a possible housing site (SHLAA ref 3376, see page 19 Issues & Options). The site was identified as outdoor sport in the Open Space Audit. Do you think this land should be retained as greenspace (in one of the identified typologies) or released for housing?
G20. The N1 greenspace UDP designation South of Fearnville Place has been put
forward as a possible housing site (SHLAA ref 4094, see page 20) Issues & Options. Do you think this site should be retained as greenspace (in one of the identified typologies) or released for housing?

Appendix 1 UDP designated greenspace sites not identified as greenspace in the Open Space Audit – proposed to be deleted Open Space type Ref number Address Reasons for proposed deletion
N1 9/3 Holtdale Approach, Holt Park Less than the 0.2ha threshold.
N1 16/16 Kirkstall Lane, Kirkstall Privately owned, no public access
N1 16/19 St Michael’s Lane, Headingley 2 areas less than the 0.2ha threshold.
N1 16/34 The Village Street, Burley Less than the 0.2ha threshold.
N1 18/5 Leafield Towers, Moortown 2 areas less than the 0.2ha threshold.
N5 (proposed open space)
Land at Outwood Lane, Horsforth In an agricultural rather than a greenspace use
N5 (proposed open space)
14/6X Land at Fraser Avenue, Horsforth In an agricultural rather than a greenspace use.
N5 (proposed open space)
14/21 Land north of Brownberrie Walk/ Avenue
In an agricultural rather than a greenspace use
N6 (playing pitch) 27/4X Talbot Road Sports Ground, Roundhay
Developed for housing
N6 (playing pitch) 13/8 Springbank Primary School, Headingley
Developed – hard standing/car parking.