north carolina child health carolina child health report card 2018 special focus: financial...
TRANSCRIPT
#ChildHealthNCJoin the Conversation
NCIOMwww.nciom.org
N O R T H C A R O L I N A
CHILD HEALTHReport Card
2018
Special Focus: Financial Security, Opportunity, and Health
www.ncchild.orgi
White
Grades and Change Over Time: Grades are assigned by a panel of health experts to bring attention to the current status of North Carolina children in salient measures of health and well-being. Grades are subjective measures of how well children in North Carolina are faring in a particular area, and are not meant to judge the performance of state agency or agencies providing data or services. Please note that several agencies have made a great deal of progress in recent years, which may not be reflected in these grades.
Percent changes have not been given for population count data involving small numbers of cases. Grades and trends are based on North Carolina’s performance year-to-year, disparities by race/ethnicity, and what level of child health and safety North Carolina should aspire to, regardless of how we compare nationally.
D E M O G R A P H I C S
African Americanor Black
American
IndianAsian Hispanic
or LatinxOther
Number of babies born (live births)
Percent of live births by race and ethnicity
Percent of total children under age 18 by race and ethnicity
Percent of children under age 5 (as a percent of race/ethnicity total)
Percent of children in excellent or very good health
Base
KEY| Data are not available
| Data suppressed
NA
--| Asian includes Hawaiian/Pacific Islander
| Other includes Multi-Racial and Two or More Races‡ §
| Race categories include Hispanic
| American Indian includes Native Alaskan†*
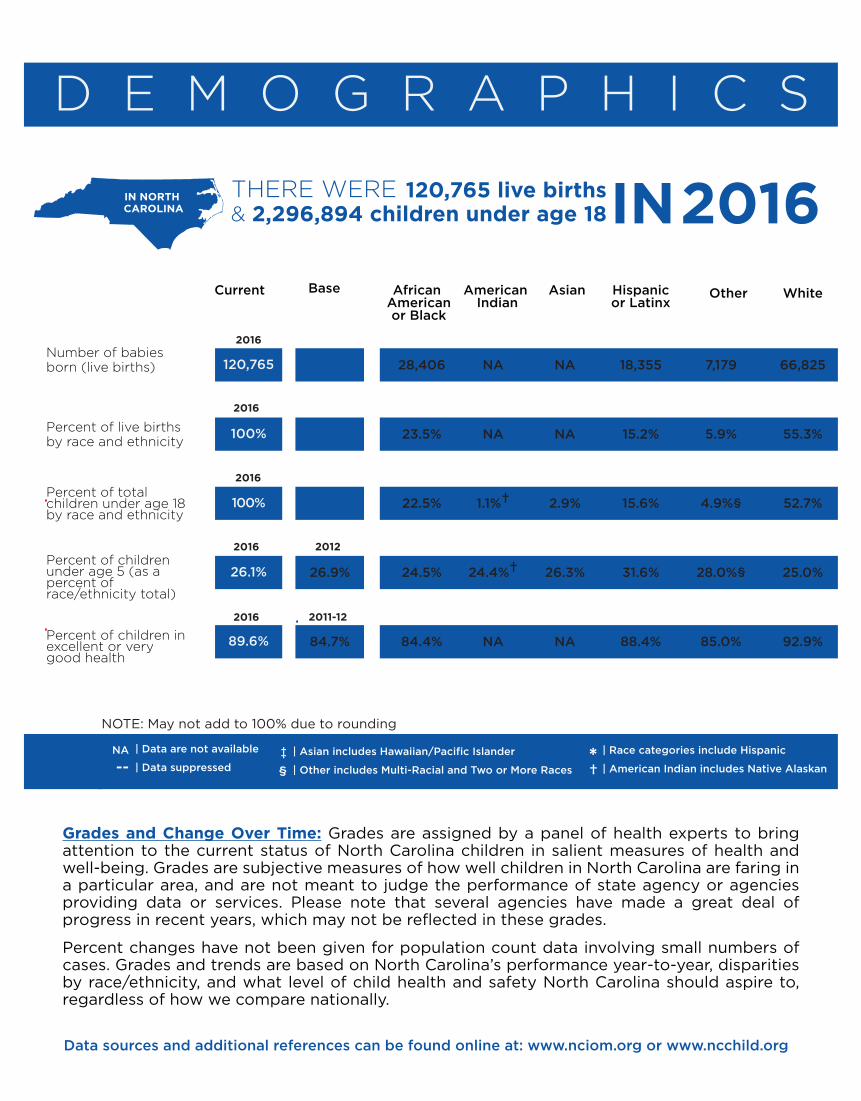
NOTE: May not add to 100% due to rounding
120,765
100%
100%
26.1%
89.6%
26.9%
84.7%
28,406
23.5%
22.5%
24.5%
84.4%
NA
NA
1.1%†
24.4%†
NA
NA
NA
2.9%
26.3%
NA
18,355
15.2%
15.6%
31.6%
88.4%
7,179
5.9%
4.9%§
28.0%§
85.0%
66,825
55.3%
52.7%
25.0%
92.9%
2016
2016
Current
IN NORTH
CAROLINA
THERE WERE IN 2016120,765 live births& 2,296,894 children under age 18
IN NORTH CAROLINA
Data sources and additional references can be found online at: www.nciom.org or www.ncchild.org
2016 2012
2016 2011-12
2016

FINANCIAL SECURITY, OPPORTUNITY, AND HEALTHFamily financial security is one of the most impactful determinants of children’s health, and children who live in poverty, particularly during early childhood are at risk of poor health outcomes throughout their lives.1 Children from low-income families fare worse in almost every indicator of health, including birth outcomes, access to care, health-risk behaviors, and mortality. These children are also often exposed to high levels of toxic stress, which can have a negative impact on cognitive development and learning, and can contribute to behavioral, social, emotional, and health problems later in life. Children living in financially secure families are more likely to achieve educational success and grow to be healthy, self-su�cient adults.
67% 33%
2Xmore likely
In 2015African American
children were
to live in poor or low-income homes than white children
vs.
81.5% OF CHILDREN IN LOW-INCOMEFAMILIES ARE HEALTHY
96.9% OF CHILDREN IN NON-LOW-INCOMEHOMES ARE HEALTHY
Unfortunately, not all of North Carolina’s kids have the benefits that come from living in financially secure families. Almost half of North Carolina’s children live in poor or low-income households (defined as income less than 200% federal poverty level), and one-third live in households that spend more than 30% of income on housing. In addition, 14% of children live in high-poverty neighborhoods; these children are more likely to be exposed to neighborhood violence and crime.
There are many opportunities for North Carolina stakeholders to work to reduce poverty, address the structural barriers that serve to keep families poor, and ensure that all of our state’s families are financially secure. Stakeholders can enhance financial security for families through programs and policies that promote job creation, improve education, and examine the impact of tax and wage policies. Together we can identify evidence-based solutions to improve the financial security of North Carolina’s families and improve opportunities and health outcomes for our state’s children.
Most kids in North Carolina are in EXCELLENT or VERY GOOD HEALTH, but this varies by income level
3 4OUTOF
LATINX CHILDREN lived in households making under 200% FPL
HEALTHY BIRTHS
KEY| Data are not available
| Data suppressed
NA
--| Asian includes Hawaiian/Pacific Islander
| Other includes Multi-Racial and Two or More Races‡ §
| Race categories include Hispanic
| American Indian includes Native Alaskan†*
African Americanor Black
American Indian
Asian Hispanicor Latinx
Other WhiteCurrent Base ChangeOver Time
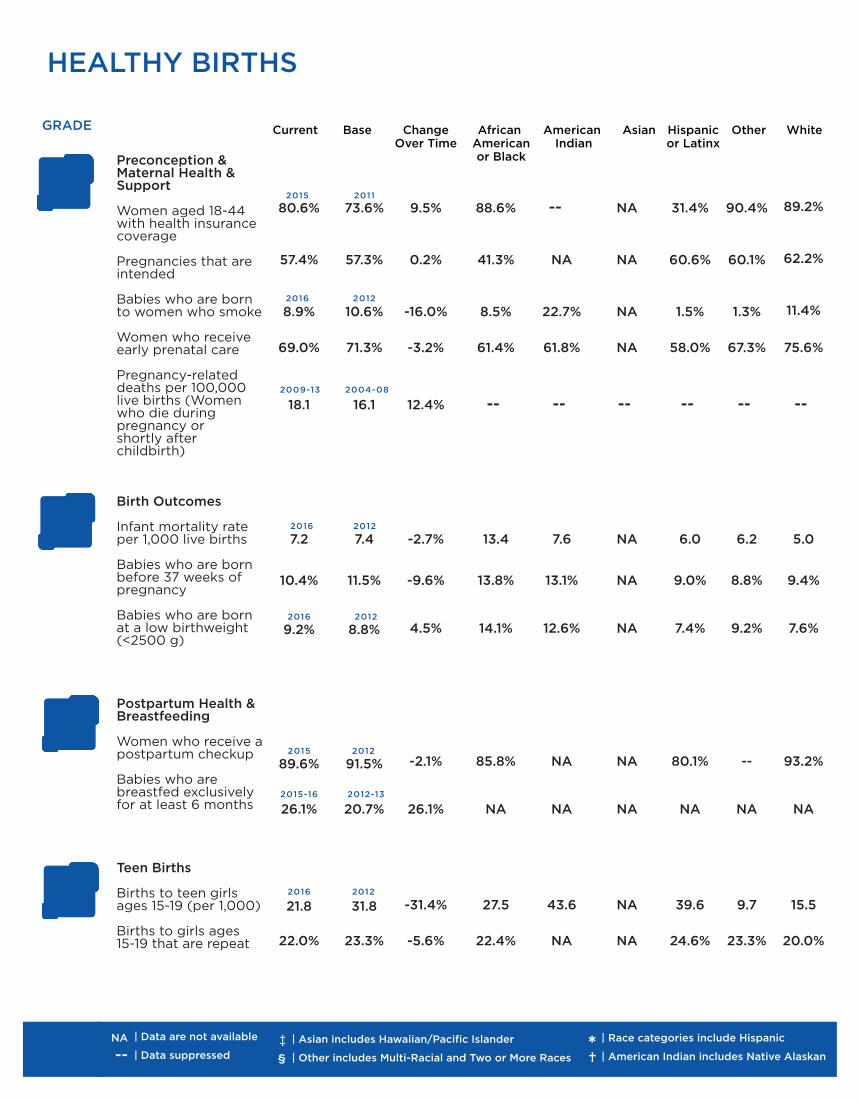
80.6%
57.4%
8.9%
69.0%
18.1
7.2
10.4%
9.2%
89.6%
26.1%
21.8
22.0%
C
D
B
B
Preconception & Maternal Health & Support
Women aged 18-44 with health insurance coverage
Pregnancies that are intended Babies who are born to women who smoke Women who receive early prenatal care Pregnancy-related deaths per 100,000 live births (Women who die during pregnancy or shortly after childbirth)
Birth Outcomes Infant mortality rate per 1,000 live births Babies who are born before 37 weeks of pregnancy Babies who are born at a low birthweight (<2500 g)
Postpartum Health & Breastfeeding Women who receive a postpartum checkup
Babies who are breastfed exclusively for at least 6 months
Teen Births Births to teen girls ages 15-19 (per 1,000) Births to girls ages 15-19 that are repeat
GRADE
73.6%
57.3%
10.6%
71.3%
16.1
7.4
11.5%
8.8%
91.5%
20.7%
31.8
23.3%
9.5%
0.2%
-16.0%
-3.2%
12.4%
-2.7%
-9.6%
4.5%
-2.1%
26.1%
-31.4%
-5.6%
88.6%
41.3%
8.5%
61.4%
--
13.4
13.8%
14.1%
85.8%
NA
27.5
22.4%
--
NA
22.7%
61.8%
--
7.6
13.1%
12.6%
NA
NA
43.6
NA
NA
NA
NA
NA
--
NA
NA
NA
NA
NA
NA
NA
31.4%
60.6%
1.5%
58.0%
--
6.0
9.0%
7.4%
80.1%
NA
39.6
24.6%
90.4%
60.1%
1.3%
67.3%
--
6.2
8.8%
9.2%
--
NA
9.7
23.3%
89.2%
62.2%
11.4%
75.6%
--
5.0
9.4%
7.6%
93.2%
NA
15.5
20.0%
2015 2011
2016 2012
2009-13 2004-08
2016 2012
2015 2012
2016 2012
2016 2012
2015-16 2012-13
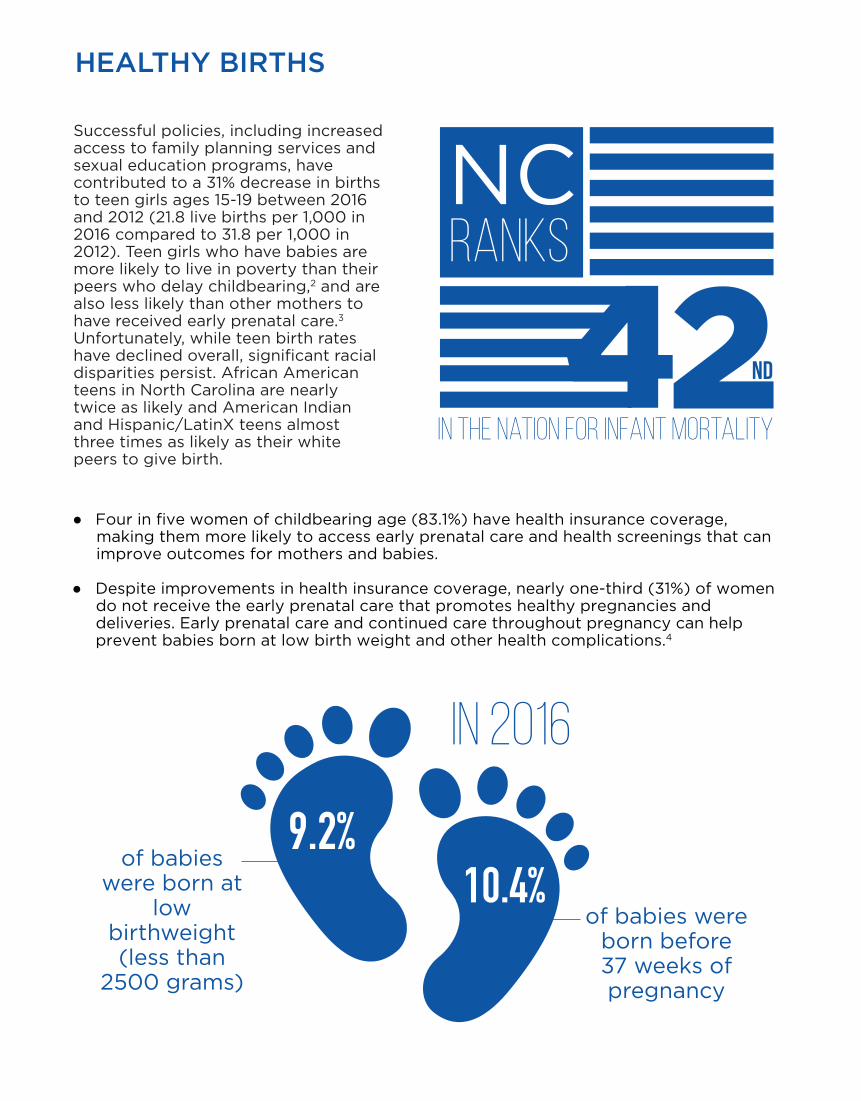
● Four in five women of childbearing age (83.1%) have health insurance coverage, making them more likely to access early prenatal care and health screenings that can improve outcomes for mothers and babies.
● Despite improvements in health insurance coverage, nearly one-third (31%) of women do not receive the early prenatal care that promotes healthy pregnancies and deliveries. Early prenatal care and continued care throughout pregnancy can help prevent babies born at low birth weight and other health complications.4
Successful policies, including increased access to family planning services and sexual education programs, have contributed to a 31% decrease in births to teen girls ages 15-19 between 2016 and 2012 (21.8 live births per 1,000 in 2016 compared to 31.8 per 1,000 in 2012). Teen girls who have babies are more likely to live in poverty than their peers who delay childbearing,2 and are also less likely than other mothers to have received early prenatal care.3 Unfortunately, while teen birth rates have declined overall, significant racial disparities persist. African American teens in North Carolina are nearly twice as likely and American Indian and Hispanic/LatinX teens almost three times as likely as their white peers to give birth.
HEALTHY BIRTHS
9.2%10.4%
of babies were born at
low birthweight (less than
2500 grams)
of babies were born before 37 weeks of pregnancy
In 2016
RANksNC
in the nation for infant mortality
nd
ACCESS TO CARE
KEY| Data are not available
| Data suppressed
NA
--| Asian includes Hawaiian/Pacific Islander
| Other includes Multi-Racial and Two or More Races‡ §
| Race categories include Hispanic
| American Indian includes Native Alaskan†*
African Americanor Black
American Indian
Asian Hispanicor Latinx
Other WhiteCurrent Base ChangeOver Time
95.5%
5.6%
43.5%
15.3%
15.0%
48.7%
1:1,072
1:384
57.0%
79.7%
96.3%
57.5%
A
C
D
B
Insurance Coverage
Children with health insurance coverage
Low income (<200% FPL) children without health insurance coverage Children covered by public health insurance Parents without health insurance coverage*
Oral Health Kindergarten students with untreated tooth decay Children with Medicaid who use dental services
School Health School nurse ratio School counselor ratio
Health Services Utilizations & Immunization Children with Medicaid who received a well-child checkup in the past year Children ages 19-35 months with appropriate immunizations
Children with appropriate immunizations at school entry
Adolescents ages 13-17 who have received 1 or more HPV vaccinations
GRADE
92.4%
9.7%
41.6%
20.6%
15.0%
47.2%
1:1,177
1:379
57.1%
76.6%
96.4%
53.3%
3.4%
-42.8%
4.6%
-25.7%
0.0%
3.2%
-8.9%
1.3%
-0.2%
4.0%
-0.1%
7.9%
96.9%*
NA
NA
13.7%
18.0%
NA
NA
NA
NA
75.8%
NA
62.5%
92.7%*†
NA
NA
21.1%†
24.0%
NA
NA
NA
NA
NA
NA
NA
93.6%*
NA
NA
10.1%‡
15.7%‡
NA
NA
NA
NA
NA
NA
NA
89.1%
NA
NA
53.7%
15.0%
NA
NA
NA
NA
74.2%
NA
69.8%
93.1%*§
NA
NA
15.5%§
13.0%§
NA
NA
NA
NA
NA
NA
NA
96.8%
NA
NA
8.7%
13.0%
NA
NA
NA
NA
85.2%
NA
50.6%
2016 2012
2015 2011
2016 2010
FY 2016 FY 2012
SY 2016-17 SY 2012-13
SY 2016-17 SY 2013-14
FY 2016 FY 2012
2016 2013
SY 2015-16 SY 2011-12
2016 2012

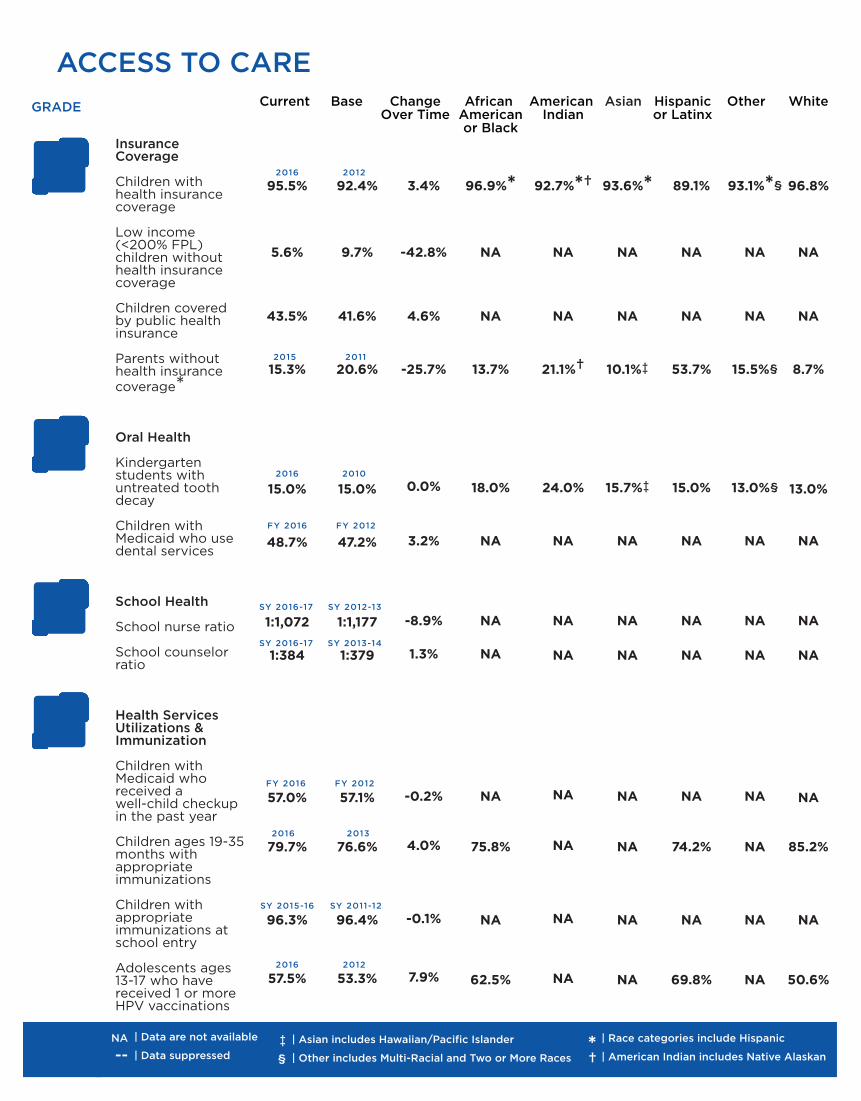
● Medicaid, NC Health Choice, and the A�ordable Care Act have led to gains in health insurance coverage for North Carolina. The expansion of enrollment processes, greater outreach, and increased coverage for parents have contributed to near total (96%) health insurance coverage for children in North Carolina. In addition, more parents in North Carolina have insurance. This can lead to greater economic security, as adults without insurance are more likely to have di�culty paying for basic items such as food, rent, or utility bills.6
● There is one school nurse for every 1,072 children in North Carolina public schools. While this ratio has improved, North Carolina still falls short of meeting the Centers for Disease Control and Prevention recommendation of one nurse for every 750 students in order to adequately meet the health and safety needs of children and school communities.7 School nurses are a particularly vital resource for students living in poverty, who often face barriers to traditional health care access and who may have no other support to manage chronic conditions or receive preventive care.
Children with health insurance are better able to access preventive health care services that can reduce unmet medical and prescription needs.5 For children in low-income homes, public health insurance through Medicaid and NC Health Choice puts otherwise una�ordable or unavailable services within reach. The percent of uninsured low-income children (5.6%) continues to decline, falling 43% in North Carolina between 2012 and 2016.
ACCESS TO CARE
Hispanic & american indian
to have health insurance coverage
than other races
P A R E N T S
50ONLY
Met the recommended school nurse ratio of
Public NC School Districts
1:750 children
areLESSLIKELY

SECURE HOMES AND NEIGHBORHOODS
KEY| Data are not available
| Data suppressed
NA
--| Asian includes Hawaiian/Pacific Islander
| Other includes Multi-Racial and Two or More Races‡ §
| Race categories include Hispanic
| American Indian includes Native Alaskan†*
African Americanor Black
American Indian
Asian Hispanicor Latinx
Other WhiteCurrent Base ChangeOver Time
B
F
B
D
Family Involvement
Family reads to children (ages 0-5) everyday
Families who eat meals together four or more times per week Housing and Economic Security Children who live in poor or low-income homes (<200% FPL) Children ages 0-5 who live in poor or low-income homes (<200% FPL)* Children living in households spending over 30% of income on housing costs Children who live in high-poverty neighborhoods
Environmental Health Children who have an asthma diagnosis Children tested with blood lead levels BLLs>5ug/dl
Child Abuse and Neglect Children who are investigated for child abuse or neglect Child abuse homicides
Children in Out-of-Home Care Percent of NC children in foster care
Percent children who exit to permanency within 24 months
GRADE
D
41.4%
72.0%
46.0%
49.2%
28.0%
14.0%
17.9%
1.9%
5.6%
28
0.7%
65.2%
44.3%
79.6%
51.0%
55.2%
34.0%
9.0%
15.5%
3.6%
5.9%
28
0.6%
69.1%
-6.5%
-9.0%
-9.8%
-10.9%
-17.6%
55.6%
15.5%
-47.2%
-5.1
0%
16.7%
-5.6%
49.7%
68.2%
64.0%*
67.1%
41.0%*
28.0%*
28.8%*
NA
8.6%*
14
1.0%*
62.6%*
NA
NA
--
73.9%†
24.0%*
39.0%*
NA
NA
8.1%*†
NA
1.5%*†
83.2%*†
NA
NA
29.0%*‡
28.4%‡
22.0%*‡
9.0%*‡
NA
NA
NA
NA
NA
NA
21.8%
70.5%
71.0%
74.7%
38.0%
22.0%
NA
NA
4.2%
NA
0.4%
NA
29.6%
70.6%
48.0%*§
87.1%
30.0%*§
14.0%*§
12.1%*
NA
5.8%*
NA
0.6%*
61.2%*
46.2%
74.6%
31.0%
40.4%
20.0%
5.0%
15.1%*
NA
4.7%*
14
0.6%*
66.2%*
2016 2011-12
2016 2012
2016 2012
2016 2011
2013-14 2009
2011-15 2006-10
2015 2011
SFY 2016 SFY 2012
2016 2012
SFY 2016 SFY 2012
SFY 2016 SFY 2012

● In North Carolina, many families also have a high housing burden: one-third of children live in households spending over 30% of their income on housing costs, and African American and Hispanic children are more likely to live in households with high housing costs. Higher housing costs can lead to di�culties accessing health insurance coverage and healthy foods, both of which can impact children’s health outcomes.
● More than 1 in 4 African American children in North Carolina has been diagnosed with asthma. Overall in North Carolina, rates of childhood asthma have risen in recent years. Kids in low-income homes have higher rates of childhood asthma and are more likely to be exposed to environmental triggers such as cockroaches and mold.9 If poorly controlled, asthma can impact children’s attendance at school and lead to parents missing work to care for their children and take them to the doctor.10
Early childhood experiences have a significant impact on health, educational achievement, and financial security. Adverse childhood experiences, such as abuse, neglect, or poverty can negatively a�ect brain development and increase risk for physical and behavioral health problems later in life. Providing children with safe and stable homes, relationships, and environments can protect against the impact of adverse childhood experiences, improve health, and generate increased financial security.8
Nearly
(<200% FPL)
HALFof North Carolina’s
children live in poor or low-income homes
SECURE HOMES AND NEIGHBORHOODS
North Carolina Resident Child Death Rates, by Type of Death,
Age 0-17
5.1 4.8
2.1
1.11.6
4.2 4.2
2 1.7 1.7
0
1
2
3
4
5
6
Unintentional motor vehicle
injuries
Other unintentional
injuries
Homicide Suicide Homicides and suicides using a
firearm
Rat
e p
er 1
00
,00
0 R
esid
ent C
hild
ren
Type of Death
2007-2011
2012-2016-2016
HEALTH RISK FACTORS
KEY| Data are not available
| Data suppressed
NA
--| Asian includes Hawaiian/Pacific Islander
| Other includes Multi-Racial and Two or More Races‡ §
| Race categories include Hispanic
| American Indian includes Native Alaskan†*
African Americanor Black
American Indian
Asian Hispanicor Latinx
Other WhiteCurrent Base ChangeOver Time
86.5%
57.8%
22.6%
23.3%
30.9%
13.1%
29.6%
22.3%
29.2%
17.9%
9.3%
12.3%
40.5%
C
D
D
D
Education
High school students who graduate on time
Third grade students reading at grade-level
Healthy Eating and Active Living Children who live in food-insecure households Children who meet recommended guidelines for physical activity Children ages 10-17 who are overweight or obese
Tobacco, Alcohol, and Substance Use High school students who currently use:Cigarettes
Electronic vapor products
Marijuana
Alcohol (including beer)
High school students who have ever used:Prescription Drugs without a doctor’s prescription
Mental Health High school students who attempted suicide in the past year
Past -year major depressive episode among adolescents ages 12-17
Adolescents ages 12-17 with major depressive episode who received treatment for depression
GRADE
82.5%
60.2%
26.7%
31.6%
31.4%
17.7%
NA
24.2%
34.3%
20.4%
5.0%
8.1%
36.0%
4.8%
-4.0%
-15.4%
-26.3%
-1.6%
-26.0%
-7.9%
-14.9%
-12.3%
86.0%
51.9%
12.5%
83.9%
40.9%
NA
23.0%
40.2%
10.8%
27.9%
27.9%
25.2%
15.8%
13.6%
NA
NA
84.3%
42.3%
NA
NA
NA
--
--
--
--
--
NA
NA
NA
93.8%
76.4%
NA
NA
NA
3.8%
7.7%
4.4%
10.4%
8.4%
3.4%
NA
NA
80.5%
42.6%
NA
15.7%
46.1%
14.9%
29.8%
22.4%
24.2%
14.1%
14.0%
NA
NA
84.0%§
62.1%§
NA
25.8%
18.0%
9.2%§
22.9%§
24.7%§
25.3%§
21.9%§
21.6%
NA
NA
89.3%
71.9%
NA
25.4%
23.5%
14.6%
31.3%
19.9%
32.9%
19.5%
5.5%
NA
NA
SY 2016-17 SY 2013-14
SY 2016-17 SY 2012-13
2015 2012
2016 2012
2016 2011-12
2015 2011
2014-15 2011-12
2011-15 2008-2012
2015 2011
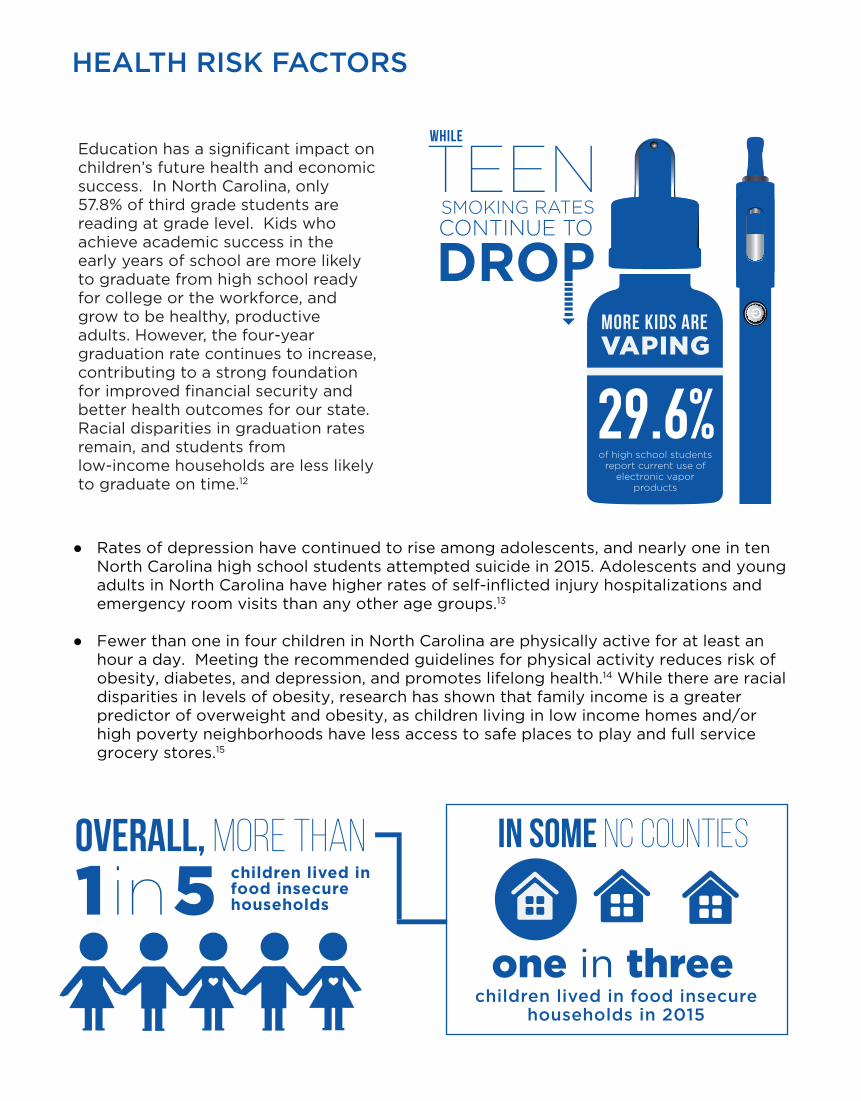
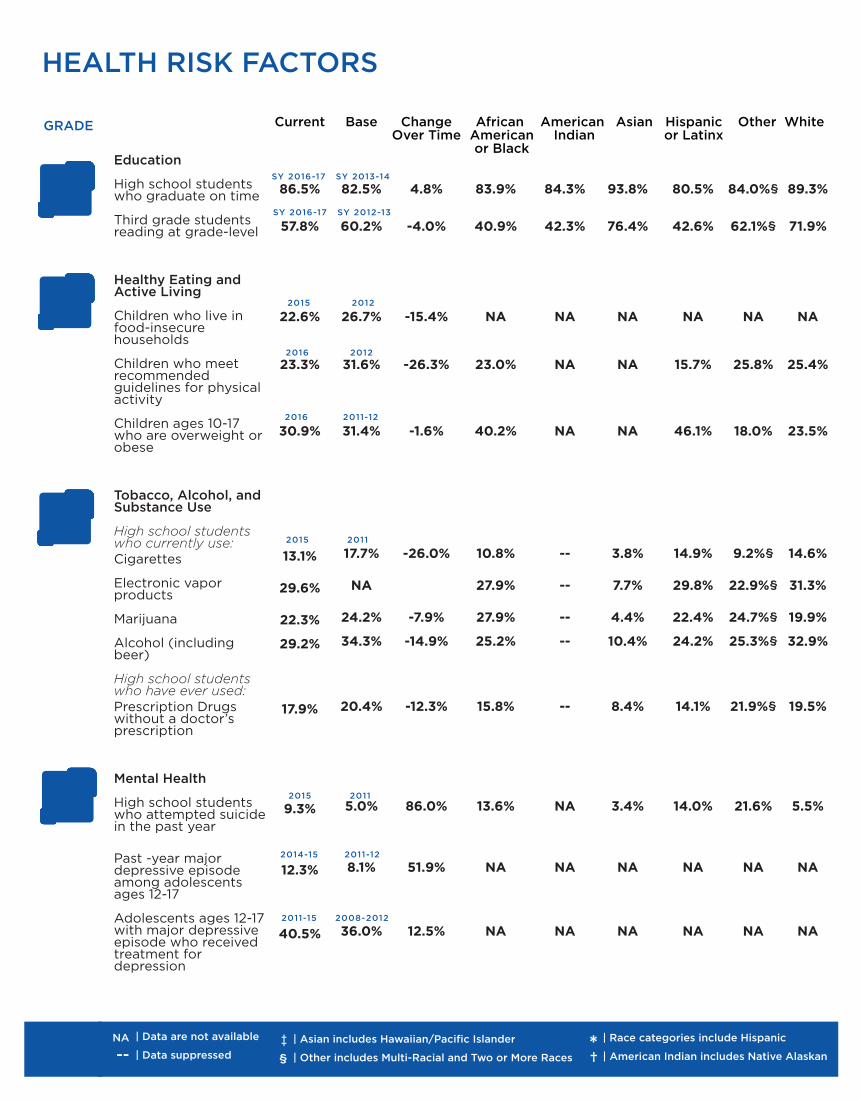
● Rates of depression have continued to rise among adolescents, and nearly one in ten North Carolina high school students attempted suicide in 2015. Adolescents and young adults in North Carolina have higher rates of self-inflicted injury hospitalizations and emergency room visits than any other age groups.13
● Fewer than one in four children in North Carolina are physically active for at least an hour a day. Meeting the recommended guidelines for physical activity reduces risk of obesity, diabetes, and depression, and promotes lifelong health.14 While there are racial disparities in levels of obesity, research has shown that family income is a greater predictor of overweight and obesity, as children living in low income homes and/or high poverty neighborhoods have less access to safe places to play and full service grocery stores.15
Education has a significant impact on children’s future health and economic success. In North Carolina, only 57.8% of third grade students are reading at grade level. Kids who achieve academic success in the early years of school are more likely to graduate from high school ready for college or the workforce, and grow to be healthy, productive adults. However, the four-year graduation rate continues to increase, contributing to a strong foundation for improved financial security and better health outcomes for our state. Racial disparities in graduation rates remain, and students from low-income households are less likely to graduate on time.12
HEALTH RISK FACTORS
1 in 5 children lived in food insecure households
OVERALL, more than
one in three children lived in food insecure
households in 2015
in some nc counties
SMOKING RATES TEENCONTINUE TO
WHILE
29.6%of high school students
report current use of electronic vapor
products
VAPING MORE KIDS ARE
NCIOM630 Davis Drive, Suite 100
Morrisville, NC 27560www.nciom.org919.445.6500
@ncinstituteofmedicine
@nciom
@ncchildorg
@ncchild
3101 Poplarwood Court Suite 300Raleigh, NC 27604 www.ncchild.org919.834.6623
Michelle Hughes, Executive DirectorWhitney Tucker, Research DirectorLatoya Beatty, 2017-2018 Research and Policy FellowRob Thompson, Deputy Director
Michelle Ries, Project DirectorAnne Foglia, Project DirectorMaggie Bailey, Research AssistantChloe’ Louderback, Graphic DesignerBerkeley Yorkery, Associate DirectorAdam Zolotor, President and CEO
This project was supported by the Annie E. Casey Foundation, and the Blue Cross and Blue Shield of North Carolina Foundation. NC Child and The North Carolina
Institute of Medicine thank our supporters and acknowledge that the findings and conclusions do not necessarily reflect the opinions of financial supporters.
www.ncchild.orgi