north american cement industry 2013 annual … american cement industry 2013 annual yearbook ......
TRANSCRIPT

North American Cement Industry
2013 Annual Yearbookn Construction Factsn Industry Trendsn Domestic & International Coverage

NORTH AMERICAN CEMENT INDUSTRY
ANNUAL YEARBOOK
2013
The following analysis is prepared by the Portland Cement Association’s Economic Research Department based on data sources believed to be reliable; however, accuracy cannot be guaranteed. This report is not
intended to represent the viewpoint of Portland Cement Association member companies. The Portland Cement Association assumes no legal responsibility for the outcome of decisions or commitments made onCement Association assumes no legal responsibility for the outcome of decisions or commitments made on
the basis of this information.
5420 Old Orchard RoadSkokie, Illinois 60077-1083MAIN 847.966.6200 FAX 847.966.9781www.cement.org
847.972.9006847.972.9192847.972.9188847.972.9310847.972.9068847.972.9042847.972.9048
The North American Cement Industry Annual Yearbook may not be electronically redistributed or reproduced, in whole or in part, without authorization of the Portland Cement Association.
© 2013 Portland Cement Association
Edward J. Sullivan, Chief Economist and Group VP Dave Zwicke, Senior Regional Economist Michael W. Howard, Senior EconomistJoseph T. Chiappe, Senior Market Intelligence Analyst Andrew Moss, Senior Market Intelligence AnalystBrian Schmidt, Market Intelligence AnalystKaren A. Arneson, Market Intelligence Specialist David Shaneen, Intern Economist

Table 1 Construction and Economic Activity 1
Table 2 Construction Put-in-Place 2
Table 3 Government Deficits 3
Table 4 Foreign Trade 4
Table 5 Residential Drivers 5
Table 6 Net Residential Balance 6
Table 7 Nonresidential Drivers 7
Table 8 Public Drivers 8
Table 9 U.S. Cement Industry Consumption - Exports - Imports - Shipments 9
Table 10 U.S. Cement Industry Consumption - Exports - Imports - Shipments (%) 10
Table 11 Apparent Use of Portland Cement by Market 11
Table 12 Alternative Measures of Cement Usage Intensity 12
Table 13 Single Family Construction 13
Table 14 Multifamily Construction 14
Table 15 Manufacturing Construction 15
Table 16 Office Construction 16
Table 17 Retail Construction 17
Table 18 Total Public Construction 18
Table 19 Highway Construction 19
Table 20 Portland Cement Consumption Growth by State 20
Table 21 Top 20 States in Portland Cement Consumption 21
Table 22 Highway Infrastructure Funding 23
Table 23 Highway Congestion Measures 24
Table 24 Airport Infrastructure Funding 25
Table 25 Airport Congestion Measures 26
Table 26 Seaport Congestion Measures 27
Table 27 Clinker Capacity 29
Table 28 Clinker Production, Capacity, and Capacity Utilization 30
Table 29 Age Distribution of U.S. Clinker Capacity by Process, 2011 31
Table 30 Clinker Capacity by Census District 32
Table 31 U.S. Cement Company Clinker Capacity 33
Table 32 Foreign and Domestic Affiliated U.S. Clinker Capacity 34
Table 33 Capacity Expansion Estimates 35
Table 34 15 Largest States Ranked by Cement Grinding Capacity 36
Table 35 Cement Imports 37
Table 36 U.S. Cement and Clinker Imports by Port - Top Customs Districts 38
Table 37 U.S. Cement and Clinker Imports by Country of Origin 38
Table 38 Cement and Clinker Imports by Census District 39
Table 39 Cement Inventories at Year-end 40
TABLE OF CONTENTS
Economic Activity
Cement Consumption
Infrastructure
Cement Supply
i

Table 40 Portland Cement Shipments by Type of Customer 41
Table 41 Portland Cement Shipments by Type of Product 41
Table 42 Shipments of Portland Cement from Mills by Type of Carrier 42
Table 43 Summary of Energy Consumption 43
Table 44 Alternative Fuels Utilized 44
Table 45 Fossil Fuel Mix 45
Table 46 Energy Consumption by Process 45
Table 47 Resources Used in Producing Cement 46
Table 48 U.S. Cement Industry Employment 47
Table 49 U.S. Cement Industry Financial Statistics 47
Table 50 Cement Industry Operating Characteristics 48
Table 51 Canadian Construction and Economic Activity 49
Table 52 Canadian Consumption - Exports - Imports - Shipments 50
Table 53 Canadian Consumption - Exports - Imports - Shipments (%) 51
Table 54 Alternative Measures of Canadian Cement Usage Intensity 52
Table 55 Canadian Construction Spending 52
Table 56 Canadian Cement and Clinker Exports 53
Table 57 Canadian Cement and Clinker Exports (destination) 53
Table 58 Canadian Cement and Clinker Imports by Source Country 54
Table 59 Canadian Cement and Clinker Imports by Province 55
Table 60 Provincial Grinding Capacity 56
Table 61 Provincial Portland Cement Consumption 56
Table 62 Growth of Provincial Portland Cement Consumption 56
Table 63 Canadian Cement Production and Capacity 57
Table 64 Canadian Clinker Capacity 57
Table 65 Age Distribution of Canadian Clinker Capacity by Process 58
Table 66 Canadian Cement Company Clinker Capacity 58
Table 67 Foreign Affiliated Canadian Clinker Capacity 58
Table 68 Summary of Energy Consumption 59
Table 69 Alternative Fuels Utilized 59
Table 70 Fuel Consumption Mix 60
Table 71 Canadian Energy Consumption by Process 60
Table 72 Canadian Employment 61
Table 73 Top World Producers of Hydraulic Cement 63
Table 74 Population Growth Rates for Top World Producers of Hydraulic Cement 64
Table 75 Cement Consumption 65
Canada
International
Operating Characteristics
ii
YEARBOOK 20131ECONOMIC ACTIVITY
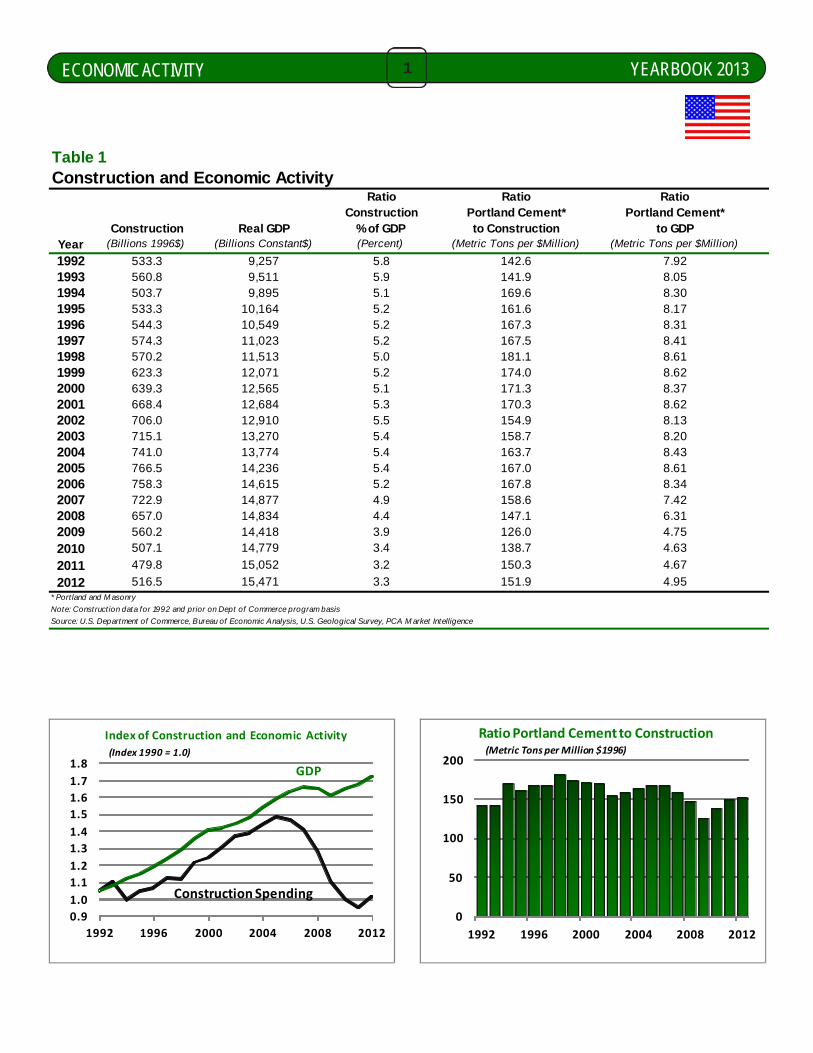
Table 1Construction and Economic Activity
Ratio Ratio RatioConstruction Portland Cement* Portland Cement*
Construction Real GDP % of GDP to Construction to GDPYear (Billions 1996$) (Billions Constant$) (Percent) (Metric Tons per $Million) (Metric Tons per $Million)
1992 533.3 9,257 5.8 142.6 7.921993 560.8 9,511 5.9 141.9 8.051994 503.7 9,895 5.1 169.6 8.301995 533.3 10,164 5.2 161.6 8.171996 544.3 10,549 5.2 167.3 8.311997 574.3 11,023 5.2 167.5 8.411998 570.2 11,513 5.0 181.1 8.611999 623.3 12,071 5.2 174.0 8.622000 639.3 12,565 5.1 171.3 8.372001 668.4 12,684 5.3 170.3 8.622002 706.0 12,910 5.5 154.9 8.132003 715.1 13,270 5.4 158.7 8.202004 741.0 13,774 5.4 163.7 8.432005 766.5 14,236 5.4 167.0 8.612006 758.3 14,615 5.2 167.8 8.342007 722.9 14,877 4.9 158.6 7.422008 657.0 14,834 4.4 147.1 6.312009 560.2 14,418 3.9 126.0 4.75
2010 507.1 14,779 3.4 138.7 4.63
2011 479.8 15,052 3.2 150.3 4.67
2012 516.5 15,471 3.3 151.9 4.95* Port land and M asonry
Note: Construct ion data for 1992 and prior on Dept of Commerce program basis
Source: U.S. Department of Commerce, Bureau of Economic Analysis, U.S. Geological Survey, PCA M arket Intelligence
GDP
0.9
1.0
1.1
1.2
1.3
1.4
1.5
1.6
1.7
1.8
1992 1996 2000 2004 2008 2012
Index of Construction and Economic Activity
(Index 1990 = 1.0)
Construction Spending
0
50
100
150
200
1992 1996 2000 2004 2008 2012
Ratio Portland Cement to Construction(Metric Tons per Million $1996)
ECONOMIC ENVIRONMENTECONOMIC ENVIRONMENTECONOMIC ENVIRONMENTECONOMIC ENVIRONMENTECONOMIC ENVIRONMENT

YEARBOOK 20132
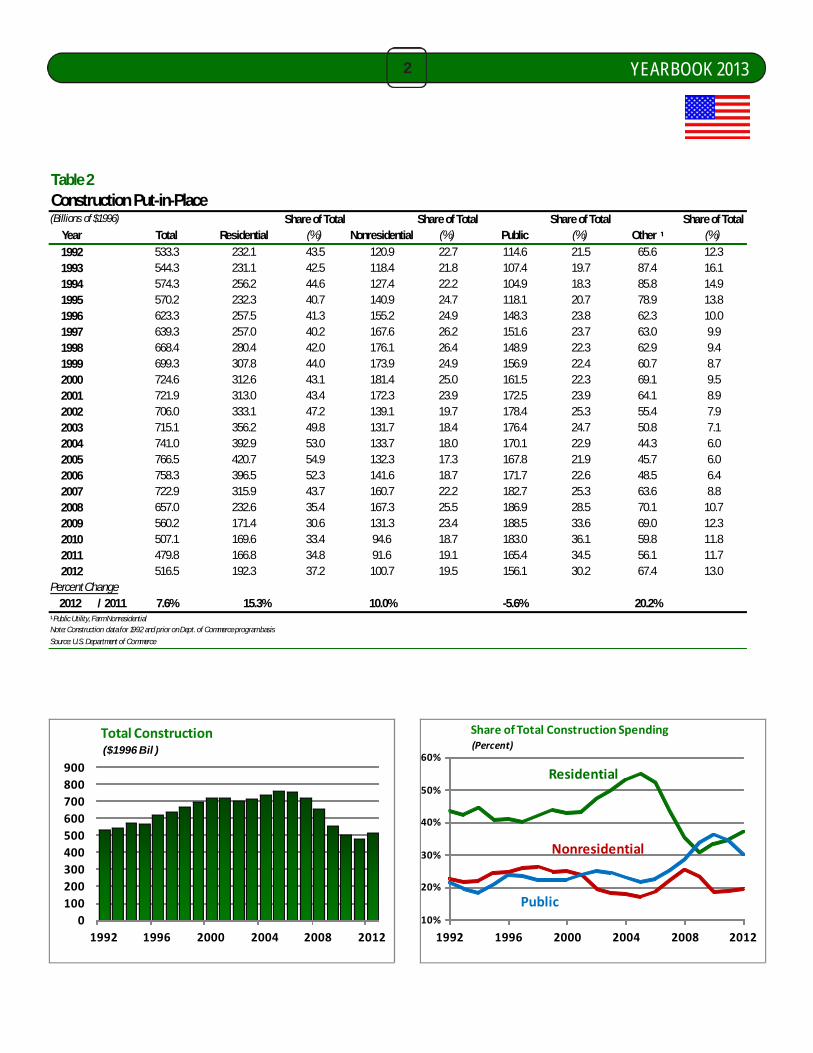
Table 2Construction Put-in-Place(Billions of $1996)
Year Total Residential Nonresidential Public Other ¹1992 533.3 232.1 43.5 120.9 22.7 114.6 21.5 65.6 12.31993 544.3 231.1 42.5 118.4 21.8 107.4 19.7 87.4 16.11994 574.3 256.2 44.6 127.4 22.2 104.9 18.3 85.8 14.91995 570.2 232.3 40.7 140.9 24.7 118.1 20.7 78.9 13.81996 623.3 257.5 41.3 155.2 24.9 148.3 23.8 62.3 10.01997 639.3 257.0 40.2 167.6 26.2 151.6 23.7 63.0 9.91998 668.4 280.4 42.0 176.1 26.4 148.9 22.3 62.9 9.41999 699.3 307.8 44.0 173.9 24.9 156.9 22.4 60.7 8.72000 724.6 312.6 43.1 181.4 25.0 161.5 22.3 69.1 9.52001 721.9 313.0 43.4 172.3 23.9 172.5 23.9 64.1 8.92002 706.0 333.1 47.2 139.1 19.7 178.4 25.3 55.4 7.92003 715.1 356.2 49.8 131.7 18.4 176.4 24.7 50.8 7.12004 741.0 392.9 53.0 133.7 18.0 170.1 22.9 44.3 6.02005 766.5 420.7 54.9 132.3 17.3 167.8 21.9 45.7 6.02006 758.3 396.5 52.3 141.6 18.7 171.7 22.6 48.5 6.42007 722.9 315.9 43.7 160.7 22.2 182.7 25.3 63.6 8.82008 657.0 232.6 35.4 167.3 25.5 186.9 28.5 70.1 10.72009 560.2 171.4 30.6 131.3 23.4 188.5 33.6 69.0 12.32010 507.1 169.6 33.4 94.6 18.7 183.0 36.1 59.8 11.82011 479.8 166.8 34.8 91.6 19.1 165.4 34.5 56.1 11.72012 516.5 192.3 37.2 100.7 19.5 156.1 30.2 67.4 13.0
Percent Change2012 / 2011 7.6% 15.3% 10.0% -5.6% 20.2%
¹ Public Utility, Farm NonresidentialNote: Construction data for 1992 and prior on Dept. of Commerce program basis
Source: U.S. Department of Commerce
Share of Total (%)
Share of Total (%)
Share of Total (%)
Share of Total (%)
0
100
200
300
400
500
600
700
800
900
1992 1996 2000 2004 2008 2012
Total Construction($1996 Bil )
10%
20%
30%
40%
50%
60%
1992 1996 2000 2004 2008 2012
Share of Total Construction Spending
Residential
Nonresidential
Public
(Percent)

Table 1 Construction and Economic Activity 1
Table 2 Construction Put-in-Place 2
Table 3 Government Deficits 3
Table 4 Foreign Trade 4
Table 5 Residential Drivers 5
Table 6 Net Residential Balance 6
Table 7 Nonresidential Drivers 7
Table 8 Public Drivers 8
Table 9 U.S. Cement Industry Consumption - Exports - Imports - Shipments 9
Table 10 U.S. Cement Industry Consumption - Exports - Imports - Shipments (%) 10
Table 11 Apparent Use of Portland Cement by Market 11
Table 12 Alternative Measures of Cement Usage Intensity 12
Table 13 Single Family Construction 13
Table 14 Multifamily Construction 14
Table 15 Manufacturing Construction 15
Table 16 Office Construction 16
Table 17 Retail Construction 17
Table 18 Total Public Construction 18
Table 19 Highway Construction 19
Table 20 Portland Cement Consumption Growth by State 20
Table 21 Top 20 States in Portland Cement Consumption 21
Table 22 Highway Infrastructure Funding 23
Table 23 Highway Congestion Measures 24
Table 24 Airport Infrastructure Funding 25
Table 25 Airport Congestion Measures 26
Table 26 Seaport Congestion Measures 27
Table 27 Clinker Capacity 29
Table 28 Clinker Production, Capacity, and Capacity Utilization 30
Table 29 Age Distribution of U.S. Clinker Capacity by Process, 2011 31
Table 30 Clinker Capacity by Census District 32
Table 31 U.S. Cement Company Clinker Capacity 33
Table 32 Foreign and Domestic Affiliated U.S. Clinker Capacity 34
Table 33 Capacity Expansion Estimates 35
Table 34 15 Largest States Ranked by Cement Grinding Capacity 36
Table 35 Cement Imports 37
Table 36 U.S. Cement and Clinker Imports by Port - Top Customs Districts 38
Table 37 U.S. Cement and Clinker Imports by Country of Origin 38
Table 38 Cement and Clinker Imports by Census District 39
Table 39 Cement Inventories at Year-end 40
TABLE OF CONTENTS
Economic Activity
Cement Consumption
Infrastructure
Cement Supply
i
Table 40 Portland Cement Shipments by Type of Customer 41
Table 41 Portland Cement Shipments by Type of Product 41
Table 42 Shipments of Portland Cement from Mills by Type of Carrier 42
Table 43 Summary of Energy Consumption 43
Table 44 Alternative Fuels Utilized 44
Table 45 Fossil Fuel Mix 45
Table 46 Energy Consumption by Process 45
Table 47 Resources Used in Producing Cement 46
Table 48 U.S. Cement Industry Employment 47
Table 49 U.S. Cement Industry Financial Statistics 47
Table 50 Cement Industry Operating Characteristics 48
Table 51 Canadian Construction and Economic Activity 49
Table 52 Canadian Consumption - Exports - Imports - Shipments 50
Table 53 Canadian Consumption - Exports - Imports - Shipments (%) 51
Table 54 Alternative Measures of Canadian Cement Usage Intensity 52
Table 55 Canadian Construction Spending 52
Table 56 Canadian Cement and Clinker Exports 53
Table 57 Canadian Cement and Clinker Exports (destination) 53
Table 58 Canadian Cement and Clinker Imports by Source Country 54
Table 59 Canadian Cement and Clinker Imports by Province 55
Table 60 Provincial Grinding Capacity 56
Table 61 Provincial Portland Cement Consumption 56
Table 62 Growth of Provincial Portland Cement Consumption 56
Table 63 Canadian Cement Production and Capacity 57
Table 64 Canadian Clinker Capacity 57
Table 65 Age Distribution of Canadian Clinker Capacity by Process 58
Table 66 Canadian Cement Company Clinker Capacity 58
Table 67 Foreign Affiliated Canadian Clinker Capacity 58
Table 68 Summary of Energy Consumption 59
Table 69 Alternative Fuels Utilized 59
Table 70 Fuel Consumption Mix 60
Table 71 Canadian Energy Consumption by Process 60
Table 72 Canadian Employment 61
Table 73 Top World Producers of Hydraulic Cement 63
Table 74 Population Growth Rates for Top World Producers of Hydraulic Cement 64
Table 75 Cement Consumption 65
Canada
International
Operating Characteristics
ii

YEARBOOK 20131ECONOMIC ACTIVITY
Table 1Construction and Economic Activity
Ratio Ratio RatioConstruction Portland Cement* Portland Cement*
Construction Real GDP % of GDP to Construction to GDPYear (Billions 1996$) (Billions Constant$) (Percent) (Metric Tons per $Million) (Metric Tons per $Million)
1992 533.3 9,257 5.8 142.6 7.921993 560.8 9,511 5.9 141.9 8.051994 503.7 9,895 5.1 169.6 8.301995 533.3 10,164 5.2 161.6 8.171996 544.3 10,549 5.2 167.3 8.311997 574.3 11,023 5.2 167.5 8.411998 570.2 11,513 5.0 181.1 8.611999 623.3 12,071 5.2 174.0 8.622000 639.3 12,565 5.1 171.3 8.372001 668.4 12,684 5.3 170.3 8.622002 706.0 12,910 5.5 154.9 8.132003 715.1 13,270 5.4 158.7 8.202004 741.0 13,774 5.4 163.7 8.432005 766.5 14,236 5.4 167.0 8.612006 758.3 14,615 5.2 167.8 8.342007 722.9 14,877 4.9 158.6 7.422008 657.0 14,834 4.4 147.1 6.312009 560.2 14,418 3.9 126.0 4.75
2010 507.1 14,779 3.4 138.7 4.63
2011 479.8 15,052 3.2 150.3 4.67
2012 516.5 15,471 3.3 151.9 4.95* Port land and M asonry
Note: Construct ion data for 1992 and prior on Dept of Commerce program basis
Source: U.S. Department of Commerce, Bureau of Economic Analysis, U.S. Geological Survey, PCA M arket Intelligence
GDP
0.9
1.0
1.1
1.2
1.3
1.4
1.5
1.6
1.7
1.8
1992 1996 2000 2004 2008 2012
Index of Construction and Economic Activity
(Index 1990 = 1.0)
Construction Spending
0
50
100
150
200
1992 1996 2000 2004 2008 2012
Ratio Portland Cement to Construction(Metric Tons per Million $1996)
ECONOMIC ENVIRONMENTECONOMIC ENVIRONMENTECONOMIC ENVIRONMENTECONOMIC ENVIRONMENTECONOMIC ENVIRONMENT
YEARBOOK 20132
Table 2Construction Put-in-Place(Billions of $1996)
Year Total Residential Nonresidential Public Other ¹1992 533.3 232.1 43.5 120.9 22.7 114.6 21.5 65.6 12.31993 544.3 231.1 42.5 118.4 21.8 107.4 19.7 87.4 16.11994 574.3 256.2 44.6 127.4 22.2 104.9 18.3 85.8 14.91995 570.2 232.3 40.7 140.9 24.7 118.1 20.7 78.9 13.81996 623.3 257.5 41.3 155.2 24.9 148.3 23.8 62.3 10.01997 639.3 257.0 40.2 167.6 26.2 151.6 23.7 63.0 9.91998 668.4 280.4 42.0 176.1 26.4 148.9 22.3 62.9 9.41999 699.3 307.8 44.0 173.9 24.9 156.9 22.4 60.7 8.72000 724.6 312.6 43.1 181.4 25.0 161.5 22.3 69.1 9.52001 721.9 313.0 43.4 172.3 23.9 172.5 23.9 64.1 8.92002 706.0 333.1 47.2 139.1 19.7 178.4 25.3 55.4 7.92003 715.1 356.2 49.8 131.7 18.4 176.4 24.7 50.8 7.12004 741.0 392.9 53.0 133.7 18.0 170.1 22.9 44.3 6.02005 766.5 420.7 54.9 132.3 17.3 167.8 21.9 45.7 6.02006 758.3 396.5 52.3 141.6 18.7 171.7 22.6 48.5 6.42007 722.9 315.9 43.7 160.7 22.2 182.7 25.3 63.6 8.82008 657.0 232.6 35.4 167.3 25.5 186.9 28.5 70.1 10.72009 560.2 171.4 30.6 131.3 23.4 188.5 33.6 69.0 12.32010 507.1 169.6 33.4 94.6 18.7 183.0 36.1 59.8 11.82011 479.8 166.8 34.8 91.6 19.1 165.4 34.5 56.1 11.72012 516.5 192.3 37.2 100.7 19.5 156.1 30.2 67.4 13.0
Percent Change2012 / 2011 7.6% 15.3% 10.0% -5.6% 20.2%
¹ Public Utility, Farm NonresidentialNote: Construction data for 1992 and prior on Dept. of Commerce program basis
Source: U.S. Department of Commerce
Share of Total (%)
Share of Total (%)
Share of Total (%)
Share of Total (%)
0
100
200
300
400
500
600
700
800
900
1992 1996 2000 2004 2008 2012
Total Construction($1996 Bil )
10%
20%
30%
40%
50%
60%
1992 1996 2000 2004 2008 2012
Share of Total Construction Spending
Residential
Nonresidential
Public
(Percent)

YEARBOOK 20133ECONOMIC ACTIVITY
Table 3Government Deficits
Federal Federal State Federal Deficit Federal Debt Long-Term NominalDebt Deficit/Surplus Deficit/Surplus Share of GDP Share of GDP Interest Rate GDP
Year ($ Bil ) ($ Bil ) ($ Bil ) (% ) (% ) (% ) ($ Bil )
1992 4,177 -327.0 -1.4 5.0 63.9 7.67 6,5391993 4,536 -226.3 -1.0 3.3 65.9 6.60 6,8791994 4,800 -185.0 8.2 2.5 65.7 7.37 7,3091995 4,989 -146.5 9.2 1.9 65.1 6.88 7,6641996 5,323 -110.9 23.0 1.4 65.7 6.70 8,1001997 5,502 -2.4 36.3 0.0 63.9 6.61 8,6081998 5,614 54.4 46.9 0.6 61.8 5.58 9,0891999 5,776 158.6 41.8 1.6 59.8 5.87 9,6662000 5,662 254.8 41.3 2.5 55.0 5.94 10,2902001 5,943 94.3 -15.9 0.9 55.9 5.49 10,6252002 6,406 -230.7 -54.1 2.1 58.3 5.42 10,9802003 6,998 -399.1 -38.8 3.5 60.8 5.05 11,5122004 7,596 -399.0 -8.4 3.3 61.9 5.11 12,2772005 8,170 -321.8 25.9 2.5 62.4 4.56 13,0952006 8,680 -209.2 51.0 1.5 62.6 4.87 13,8582007 9,229 -187.9 12.2 1.3 63.7 4.83 14,4802008 10,700 -680.5 -72.3 4.6 72.7 4.28 14,7202009 12,311 -1,471.3 -72.3 10.2 85.4 4.07 14,418
2010 14,025 -1,275.1 -25.3 8.5 93.8 4.25 14,958
2011 15,223 -1,249.6 -65.5 8.0 98.0 3.91 15,534
2012 16,433 -1,060.8 - 6.5 101.2 2.92 16,245Source: United States Department of Treasury, United States Federal Reserve
‐2000
‐1500
‐1000
‐500
0
500
1992 1996 2000 2004 2008 2012
Federal Deficit/Surplus($ Bil )
0
20
40
60
80
100
120
1992 1996 2000 2004 2008 2012
Federal Debt Share of GDP(Percent)

YEARBOOK 20134ECONOMIC ACTIVITY
Table 4Foreign Trade
Trade Deficit
Year ($ Bil )
1992 731 773 -42 0.61993 755 839 -84 1.21994 821 939 -118 1.61995 906 1,015 -109 1.41996 980 1,103 -123 1.51997 1,097 1,251 -155 1.81998 1,122 1,398 -275 3.01999 1,174 1,556 -382 4.02000 1,272 1,755 -483 4.72001 1,201 1,705 -504 4.72002 1,178 1,763 -585 5.32003 1,197 1,839 -642 5.62004 1,309 2,041 -732 6.02005 1,388 2,166 -777 5.92006 1,512 2,299 -786 5.72007 1,647 2,351 -704 4.92008 1,742 2,289 -547 3.72009 1,584 1,976 -392 2.72010 1,766 2,228 -463 3.12011 1,891 2,336 -446 2.92012 1,957 2,388 -431 2.7
Source: Bureau of Economic Analysis
Value of Exports($ Bil )
TradeDeficit as a
% of GDP(% )
Value of Imports($ Bil )
‐900
‐800
‐700
‐600
‐500
‐400
‐300
‐200
‐100
0
1992 1996 2000 2004 2008 2012
Trade Deficit($ Bil)
0
1
2
3
4
5
6
7
1992 1996 2000 2004 2008 2012
Trade Deficit as a Percent of GDP(Percent)
YEARBOOK 20135ECONOMIC ACTIVITY
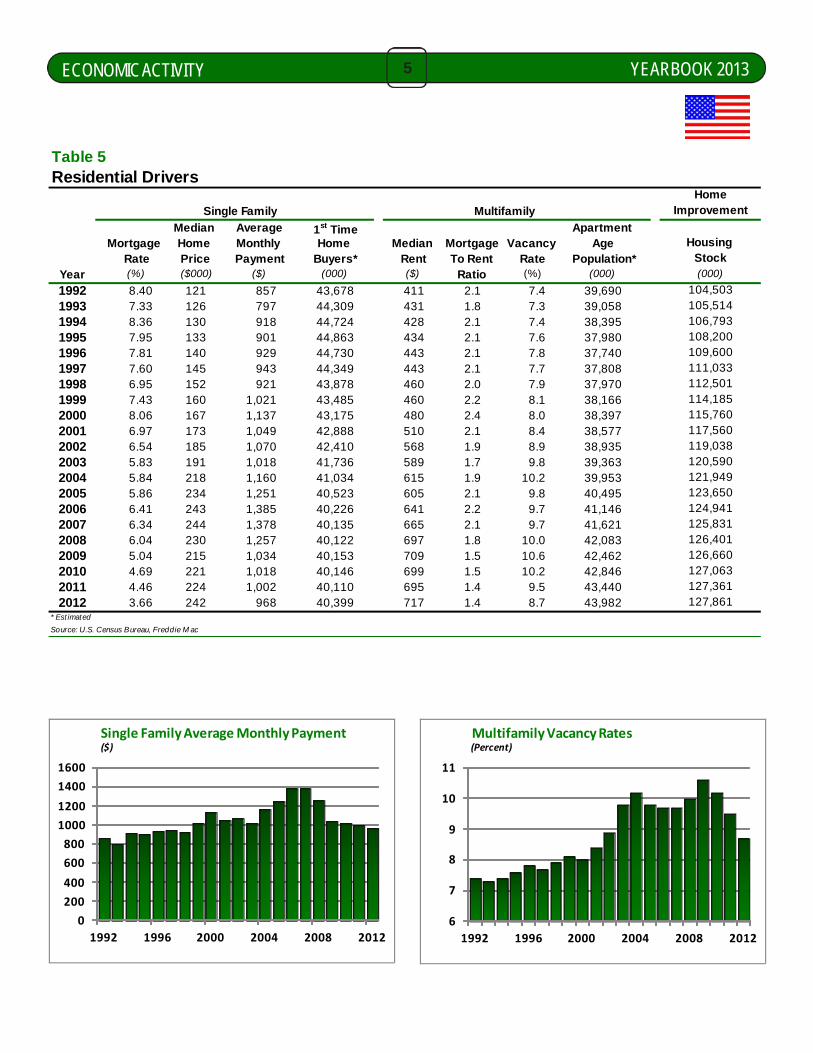
Table 5Residential Drivers
Single Family Multifamily
Median Average 1st Time Apartment Mortgage Home Monthly Home Median Mortgage Vacancy Age
Rate Price Payment Buyers* Rent To Rent Rate Population*Year (%) ($000) ($) (000) ($) Ratio (%) (000)
1992 8.40 121 857 43,678 411 2.1 7.4 39,6901993 7.33 126 797 44,309 431 1.8 7.3 39,0581994 8.36 130 918 44,724 428 2.1 7.4 38,3951995 7.95 133 901 44,863 434 2.1 7.6 37,9801996 7.81 140 929 44,730 443 2.1 7.8 37,7401997 7.60 145 943 44,349 443 2.1 7.7 37,8081998 6.95 152 921 43,878 460 2.0 7.9 37,9701999 7.43 160 1,021 43,485 460 2.2 8.1 38,1662000 8.06 167 1,137 43,175 480 2.4 8.0 38,3972001 6.97 173 1,049 42,888 510 2.1 8.4 38,5772002 6.54 185 1,070 42,410 568 1.9 8.9 38,9352003 5.83 191 1,018 41,736 589 1.7 9.8 39,3632004 5.84 218 1,160 41,034 615 1.9 10.2 39,9532005 5.86 234 1,251 40,523 605 2.1 9.8 40,4952006 6.41 243 1,385 40,226 641 2.2 9.7 41,1462007 6.34 244 1,378 40,135 665 2.1 9.7 41,6212008 6.04 230 1,257 40,122 697 1.8 10.0 42,0832009 5.04 215 1,034 40,153 709 1.5 10.6 42,4622010 4.69 221 1,018 40,146 699 1.5 10.2 42,8462011 4.46 224 1,002 40,110 695 1.4 9.5 43,4402012 3.66 242 968 40,399 717 1.4 8.7 43,982
* Est imated
Source: U.S. Census Bureau, Freddie M ac
106,793105,514104,503
121,949120,590119,038117,560115,760114,185112,501111,033109,600108,200
125,831124,941123,650
127,861127,361127,063126,660126,401
(000)
HomeImprovement
Housing Stock
0
200
400
600
800
1000
1200
1400
1600
1992 1996 2000 2004 2008 2012
Single Family Average Monthly Payment ($)
6
7
8
9
10
11
1992 1996 2000 2004 2008 2012
Multifamily Vacancy Rates(Percent)
YEARBOOK 20136ECONOMIC ACTIVITY
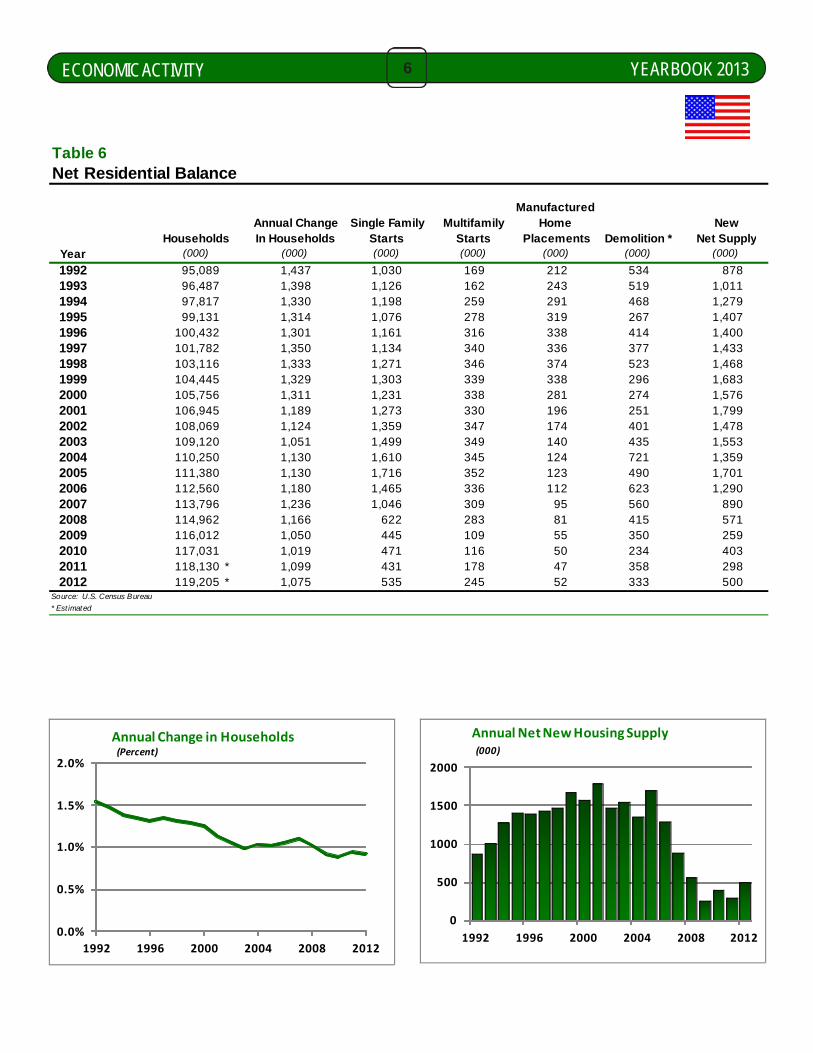
Table 6Net Residential Balance
Manufactured Annual Change Single Family Multifamily Home New
Households In Households Starts Starts Placements Demolition * Net SupplyYear (000) (000) (000) (000) (000) (000) (000)
1992 95,089 1,437 1,030 169 212 534 8781993 96,487 1,398 1,126 162 243 519 1,0111994 97,817 1,330 1,198 259 291 468 1,2791995 99,131 1,314 1,076 278 319 267 1,4071996 100,432 1,301 1,161 316 338 414 1,4001997 101,782 1,350 1,134 340 336 377 1,4331998 103,116 1,333 1,271 346 374 523 1,4681999 104,445 1,329 1,303 339 338 296 1,6832000 105,756 1,311 1,231 338 281 274 1,5762001 106,945 1,189 1,273 330 196 251 1,7992002 108,069 1,124 1,359 347 174 401 1,4782003 109,120 1,051 1,499 349 140 435 1,5532004 110,250 1,130 1,610 345 124 721 1,3592005 111,380 1,130 1,716 352 123 490 1,7012006 112,560 1,180 1,465 336 112 623 1,2902007 113,796 1,236 1,046 309 95 560 8902008 114,962 1,166 622 283 81 415 5712009 116,012 1,050 445 109 55 350 2592010 117,031 1,019 471 116 50 234 4032011 118,130 * 1,099 431 178 47 358 2982012 119,205 * 1,075 535 245 52 333 500
Source: U.S. Census Bureau
* Est imated
0.0%
0.5%
1.0%
1.5%
2.0%
1992 1996 2000 2004 2008 2012
Annual Change in Households(Percent)
0
500
1000
1500
2000
1992 1996 2000 2004 2008 2012
Annual Net New Housing Supply(000)
YEARBOOK 20137ECONOMIC ACTIVITY
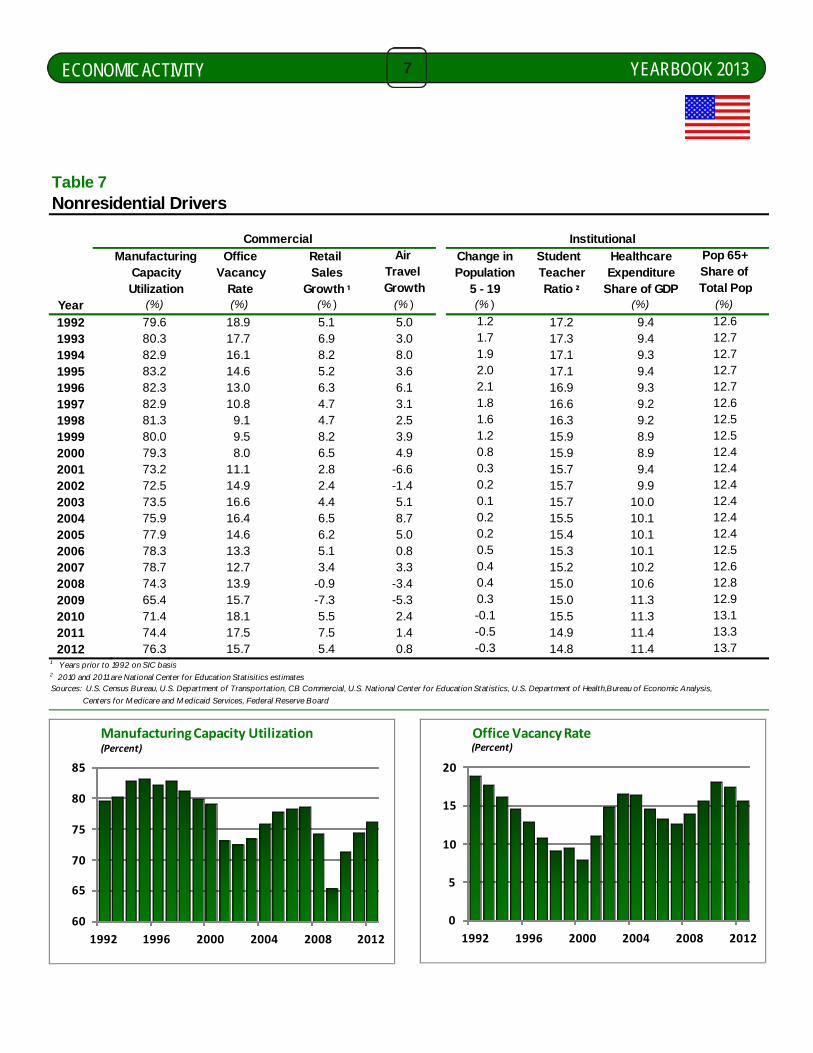
Table 7 Nonresidential Drivers
Commercial Institutional
Manufacturing Office Retail Change in Student HealthcareCapacity Vacancy Sales Population Teacher ExpenditureUtilization Rate Growth ¹ 5 - 19 Ratio ² Share of GDP
Year (%) (%) (% ) (%)
1992 79.6 18.9 5.1 5.0 17.2 9.41993 80.3 17.7 6.9 3.0 17.3 9.41994 82.9 16.1 8.2 8.0 17.1 9.31995 83.2 14.6 5.2 3.6 17.1 9.41996 82.3 13.0 6.3 6.1 16.9 9.31997 82.9 10.8 4.7 3.1 16.6 9.21998 81.3 9.1 4.7 2.5 16.3 9.21999 80.0 9.5 8.2 3.9 15.9 8.92000 79.3 8.0 6.5 4.9 15.9 8.92001 73.2 11.1 2.8 -6.6 15.7 9.42002 72.5 14.9 2.4 -1.4 15.7 9.92003 73.5 16.6 4.4 5.1 15.7 10.02004 75.9 16.4 6.5 8.7 15.5 10.12005 77.9 14.6 6.2 5.0 15.4 10.12006 78.3 13.3 5.1 0.8 15.3 10.12007 78.7 12.7 3.4 3.3 15.2 10.22008 74.3 13.9 -0.9 -3.4 15.0 10.62009 65.4 15.7 -7.3 -5.3 15.0 11.32010 71.4 18.1 5.5 2.4 15.5 11.32011 74.4 17.5 7.5 1.4 14.9 11.42012 76.3 15.7 5.4 0.8 14.8 11.4
1 Years prior to 1992 on SIC basis2 2010 and 2011 are National Center for Education Stat isit ics est imatesSources: U.S. Census Bureau, U.S. Department of Transportat ion, CB Commercial, U.S. National Center for Education Stat istics, U.S. Department of Health,Bureau of Economic Analysis,
Centers for M edicare and M edicaid Services, Federal Reserve Board
0.80.30.20.10.2
-0.5-0.3
0.20.50.40.40.3-0.1
12.812.6
1.71.92.02.11.81.61.2
1.2
Pop 65+Share of Total Pop
(%)(% )
12.6
12.512.612.712.712.712.7
Air
12.412.412.5
13.7
Travel Growth
(% )
12.512.412.412.412.4
13.313.112.9
60
65
70
75
80
85
1992 1996 2000 2004 2008 2012
Manufacturing Capacity Utilization(Percent)
0
5
10
15
20
1992 1996 2000 2004 2008 2012
Office Vacancy Rate(Percent)

YEARBOOK 20138ECONOMIC ACTIVITY
Table 8Public Drivers
State/Local State Deficit/Share of State State Surplus State
Total Public Deficit/ Government Share of Revenue Municipal
Construction 1 Surplus 1 Revenues 1 Total Rev1 Per Capita 1 Bond RateYear (%) ($ Bil ) ($ Bil ) (% ) ($) (%)
1992 88.3 -1.4 836 -0.2 3,257 6.481993 88.6 -1.0 877 -0.1 3,374 5.831994 88.8 8.2 934 0.9 3,550 6.181995 88.7 9.2 980 0.9 3,680 6.081996 89.5 23.0 1,033 2.2 3,833 5.831997 90.8 36.3 1,086 3.3 3,983 5.501998 90.7 46.9 1,149 4.1 4,164 5.151999 91.7 41.8 1,222 3.4 4,379 5.702000 92.2 41.3 1,303 3.2 4,618 6.182001 92.5 -15.9 1,353 -1.2 4,747 5.742002 92.2 -54.1 1,388 -3.9 4,827 5.642003 91.7 -38.8 1,475 -2.6 5,083 5.212004 91.7 -8.4 1,575 -0.5 5,379 5.112005 92.6 25.9 1,709 1.5 5,782 4.862006 93.1 51.0 1,811 2.8 6,069 4.712007 92.9 12.2 1,901 0.6 6,309 4.602008 92.3 -72.3 1,909 -3.8 6,278 5.662009 90.9 -72.3 1,919 -3.8 6,256 6.342010 89.8 -25.3 1,999 -1.3 6,461 5.602011 89.0 -65.5 2,030 -3.2 6,515 5.952012 90.1 - 2,039 - 6,497 4.79
1 Based on nominal values
531592614615607
Real PublicConstruction
SpendingPer Capita
(1996$)
399413447
497
572562540556550444
575568581608620605
‐80
‐60
‐40
‐20
0
20
40
60
1992 1995 1998 2001 2004 2007 2010
State and Local Net Fiscal Balances($ Bil)
350
400
450
500
550
600
650
1992 1996 2000 2004 2008 2012
Public Construction Spending Per Capita($1996)

YEARBOOK 20139CEMENT CONSUMPTION
Table 9U.S. Cement Industry Consumption - Exports - Imports - Shipments(Thousands of Metric Tons)
Consumption*
Portland Masonry Cement Cement Change Total Shipments By
Year Cement Cement Total Exports Imports In Stocks Domestic Producers
1992 73,354 2,704 76,058 754 6,159 -737
1993 76,575 3,014 79,589 618 7,056 -484
1994 82,154 3,267 85,420 646 11,302 -87
1995 83,017 3,160 86,176 761 13,848 1,113
1996 87,639 3,399 91,037 807 14,154 -326
1997 92,725 3,460 96,184 809 17,596 296
1998 99,153 4,101 103,254 763 24,085 -391
1999 104,074 4,352 108,427 736 29,321 974
2000 105,195 4,333 109,527 777 28,684 1,199
2001 109,318 4,482 113,800 785 25,861 -966
2002 104,950 4,436 109,387 874 24,169 1,080
2003 108,749 4,745 113,494 889 23,241 -1,070
2004 116,100 5,172 121,272 880 27,305 -3,965
2005 122,546 5,489 128,035 824 33,652 710
2006 121,850 5,401 127,251 723 35,896 1,930
2007 110,341 4,281 114,622 886 22,729 -490
2008 93,612 3,046 96,658 823 11,519 -530
2009 68,417 2,149 70,566 884 6,894 -2,280
2010 68,408 1,915 70,323 1,178 6,781 90
2011 70,292 1,836 72,127 1,414 6,543 100
2012 76,511 1,947 78,458 1,800 7,037 -2,070 *** Excludes A laska and Puerto Rico** USGS Est imateN o t e: Domest ic shipments include cement shipments f rom domest ic manufacturers and cement shipments ground f rom imported clinker, but exclude f inished cement imports.
Sources: U.S. Geological Survey, Department of Commerce - Foreign Trade Division, PCA M arket Intelligence
69,916
79,693
77,365
74,203
74,677
72,667
87,171
87,758
82,819
80,816
79,541
92,289
94,008
95,916
90,882
90,071
71,151
67,099
64,810
62,275
85,432
0
20
40
60
80
100
120
140
1992 1996 2000 2004 2008 2012
U.S. Portland Cement Consumption
(Million Metric Tons)
0.0
1.0
2.0
3.0
4.0
5.0
6.0
1992 1996 2000 2004 2008 2012
U.S. Masonry Cement Consumption(Million Metric Tons)
YEARBOOK 201310CEMENT CONSUMPTION
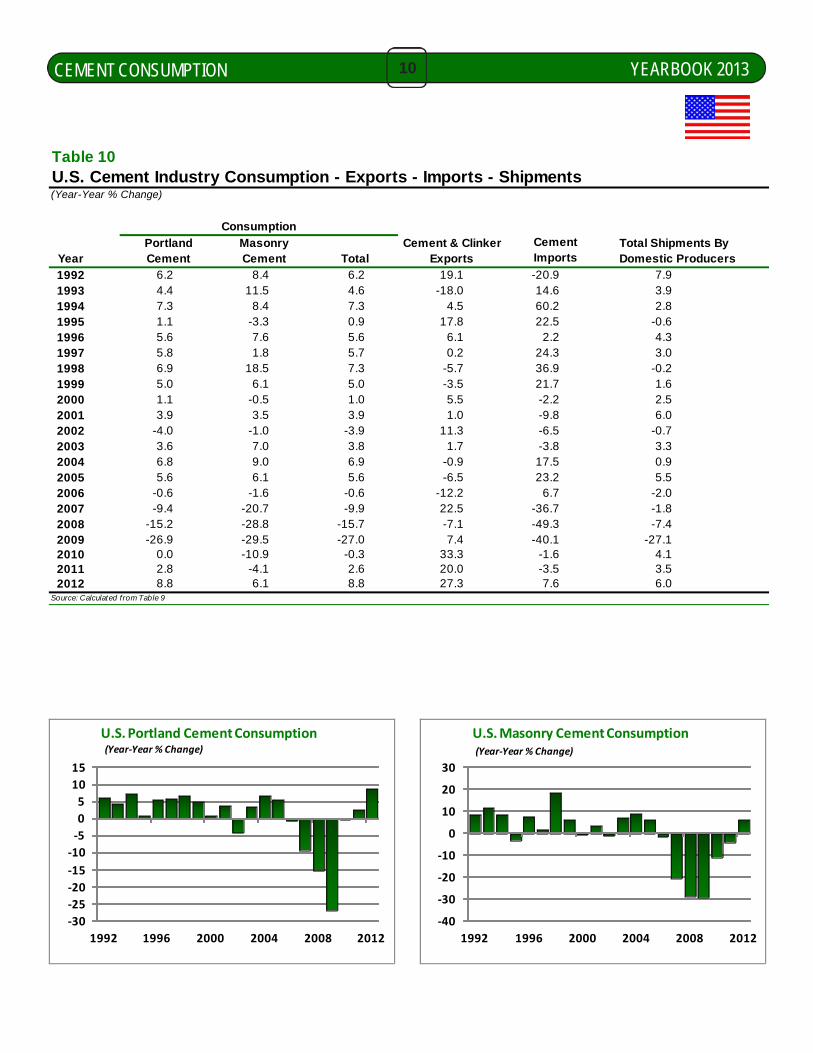
Table 10U.S. Cement Industry Consumption - Exports - Imports - Shipments(Year-Year % Change)
Consumption
Portland Masonry Cement & Clinker Total Shipments ByYear Cement Cement Total Exports Domestic Producers
1992 6.2 8.4 6.2 19.1 -20.9 7.91993 4.4 11.5 4.6 -18.0 14.6 3.91994 7.3 8.4 7.3 4.5 60.2 2.81995 1.1 -3.3 0.9 17.8 22.5 -0.61996 5.6 7.6 5.6 6.1 2.2 4.31997 5.8 1.8 5.7 0.2 24.3 3.01998 6.9 18.5 7.3 -5.7 36.9 -0.21999 5.0 6.1 5.0 -3.5 21.7 1.62000 1.1 -0.5 1.0 5.5 -2.2 2.52001 3.9 3.5 3.9 1.0 -9.8 6.02002 -4.0 -1.0 -3.9 11.3 -6.5 -0.72003 3.6 7.0 3.8 1.7 -3.8 3.32004 6.8 9.0 6.9 -0.9 17.5 0.92005 5.6 6.1 5.6 -6.5 23.2 5.52006 -0.6 -1.6 -0.6 -12.2 6.7 -2.02007 -9.4 -20.7 -9.9 22.5 -36.7 -1.82008 -15.2 -28.8 -15.7 -7.1 -49.3 -7.42009 -26.9 -29.5 -27.0 7.4 -40.1 -27.12010 0.0 -10.9 -0.3 33.3 -1.6 4.12011 2.8 -4.1 2.6 20.0 -3.5 3.52012 8.8 6.1 8.8 27.3 7.6 6.0
Source: Calculated f rom Table 9
ImportsCement
‐30
‐25
‐20
‐15
‐10
‐5
0
5
10
15
1992 1996 2000 2004 2008 2012
U.S. Portland Cement Consumption(Year‐Year % Change)
‐40
‐30
‐20
‐10
0
10
20
30
1992 1996 2000 2004 2008 2012
U.S. Masonry Cement Consumption(Year‐Year % Change)
YEARBOOK 201311CEMENT CONSUMPTION
0
10,000
20,000
30,000
40,000
50,000
1992 1996 2000 2004 2008 2012
Apparent Use of Portland Cement(Residential Buildings ‐ Thousand Metric Tons)
25%24%
51%
Apparent Use of Portland Cement by Market
(5 Year Average Share)
Residential Nonresidential Public
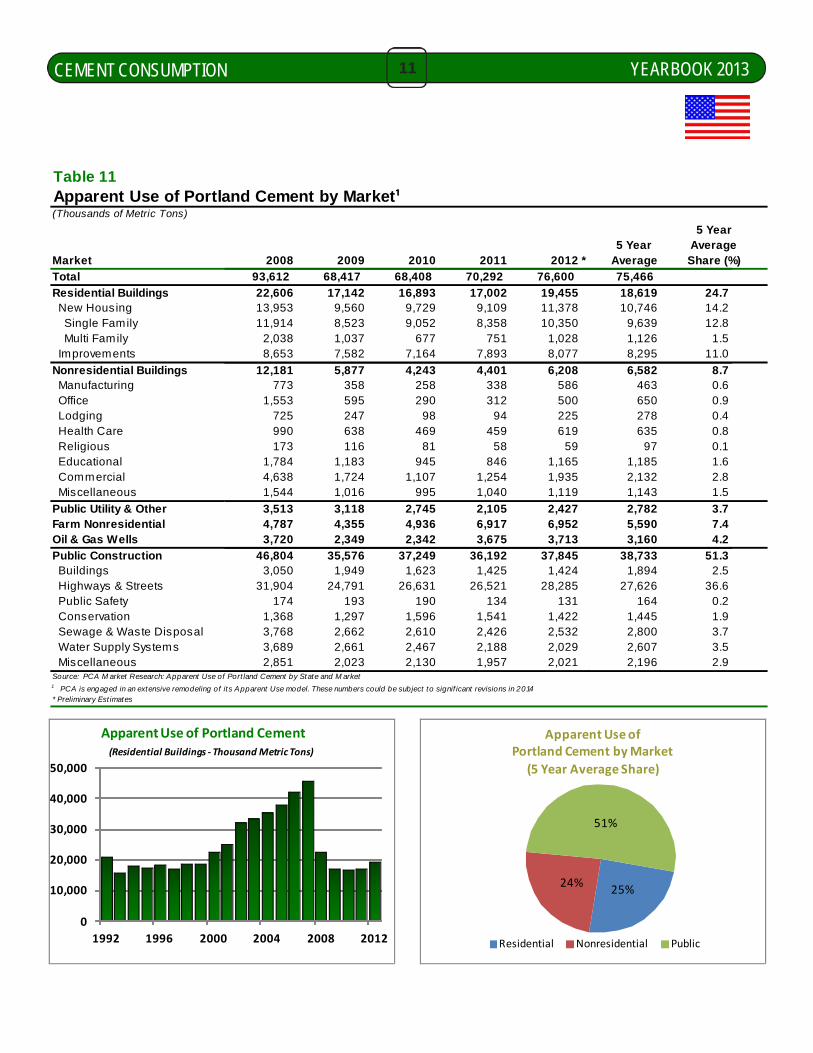
Table 11Apparent Use of Portland Cement by Market¹(Thousands of Metric Tons)
5 Year5 Year Average
Market 2008 2009 2010 2011 2012 * Average Share (%)
Total 93,612 68,417 68,408 70,292 76,600 75,466
Residential Buildings 22,606 17,142 16,893 17,002 19,455 18,619 24.7 New Housing 13,953 9,560 9,729 9,109 11,378 10,746 14.2 Single Family 11,914 8,523 9,052 8,358 10,350 9,639 12.8 Multi Family 2,038 1,037 677 751 1,028 1,126 1.5 Improvements 8,653 7,582 7,164 7,893 8,077 8,295 11.0
Nonresidential Buildings 12,181 5,877 4,243 4,401 6,208 6,582 8.7 Manufacturing 773 358 258 338 586 463 0.6 Office 1,553 595 290 312 500 650 0.9 Lodging 725 247 98 94 225 278 0.4 Health Care 990 638 469 459 619 635 0.8 Religious 173 116 81 58 59 97 0.1 Educational 1,784 1,183 945 846 1,165 1,185 1.6 Commercial 4,638 1,724 1,107 1,254 1,935 2,132 2.8 Miscellaneous 1,544 1,016 995 1,040 1,119 1,143 1.5
Public Utility & Other 3,513 3,118 2,745 2,105 2,427 2,782 3.7Farm Nonresidential 4,787 4,355 4,936 6,917 6,952 5,590 7.4Oil & Gas Wells 3,720 2,349 2,342 3,675 3,713 3,160 4.2
Public Construction 46,804 35,576 37,249 36,192 37,845 38,733 51.3 Buildings 3,050 1,949 1,623 1,425 1,424 1,894 2.5 Highways & Streets 31,904 24,791 26,631 26,521 28,285 27,626 36.6 Public Safety 174 193 190 134 131 164 0.2 Conservation 1,368 1,297 1,596 1,541 1,422 1,445 1.9 Sewage & Waste Disposal 3,768 2,662 2,610 2,426 2,532 2,800 3.7 Water Supply Systems 3,689 2,661 2,467 2,188 2,029 2,607 3.5 Miscellaneous 2,851 2,023 2,130 1,957 2,021 2,196 2.9Source: PCA M arket Research: Apparent Use of Port land Cement by State and M arket1 PCA is engaged in an extensive remodeling of its Apparent Use model. These numbers could be subject to signif icant revisions in 2014* Preliminary Est imates
YEARBOOK 201312CEMENT CONSUMPTION
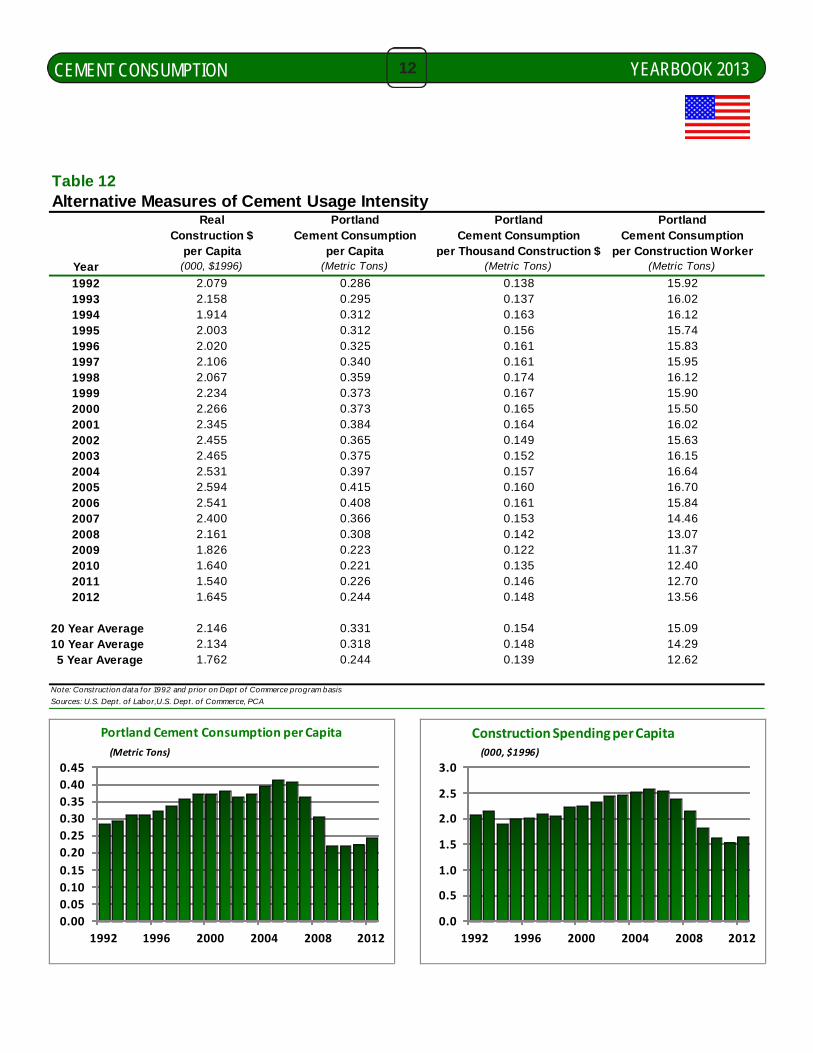
Table 12Alternative Measures of Cement Usage Intensity
Real Portland Portland PortlandConstruction $ Cement Consumption Cement Consumption Cement Consumption
per Capita per Capita per Thousand Construction $ per Construction WorkerYear (000, $1996) (Metric Tons) (Metric Tons) (Metric Tons)
1992 2.079 0.286 0.138 15.921993 2.158 0.295 0.137 16.021994 1.914 0.312 0.163 16.121995 2.003 0.312 0.156 15.741996 2.020 0.325 0.161 15.831997 2.106 0.340 0.161 15.951998 2.067 0.359 0.174 16.121999 2.234 0.373 0.167 15.902000 2.266 0.373 0.165 15.502001 2.345 0.384 0.164 16.022002 2.455 0.365 0.149 15.632003 2.465 0.375 0.152 16.152004 2.531 0.397 0.157 16.642005 2.594 0.415 0.160 16.702006 2.541 0.408 0.161 15.842007 2.400 0.366 0.153 14.462008 2.161 0.308 0.142 13.072009 1.826 0.223 0.122 11.372010 1.640 0.221 0.135 12.402011 1.540 0.226 0.146 12.702012 1.645 0.244 0.148 13.56
20 Year Average 2.146 0.331 0.154 15.0910 Year Average 2.134 0.318 0.148 14.29 5 Year Average 1.762 0.244 0.139 12.62
Note: Construct ion data for 1992 and prior on Dept of Commerce program basis
Sources: U.S. Dept . of Labor,U.S. Dept . of Commerce, PCA
0.00
0.05
0.10
0.15
0.20
0.25
0.30
0.35
0.40
0.45
1992 1996 2000 2004 2008 2012
Portland Cement Consumption per Capita
(Metric Tons)
0.0
0.5
1.0
1.5
2.0
2.5
3.0
1992 1996 2000 2004 2008 2012
Construction Spending per Capita(000, $1996)
YEARBOOK 201313CEMENT CONSUMPTION
0
500
1000
1500
2000
1992 1996 2000 2004 2008 2012
Single Family Starts(000 of Units)
10
12
14
16
18
20
1992 1996 2000 2004 2008 2012
Single Family Cement Intensity(Metric Tons Per Single Family Start)
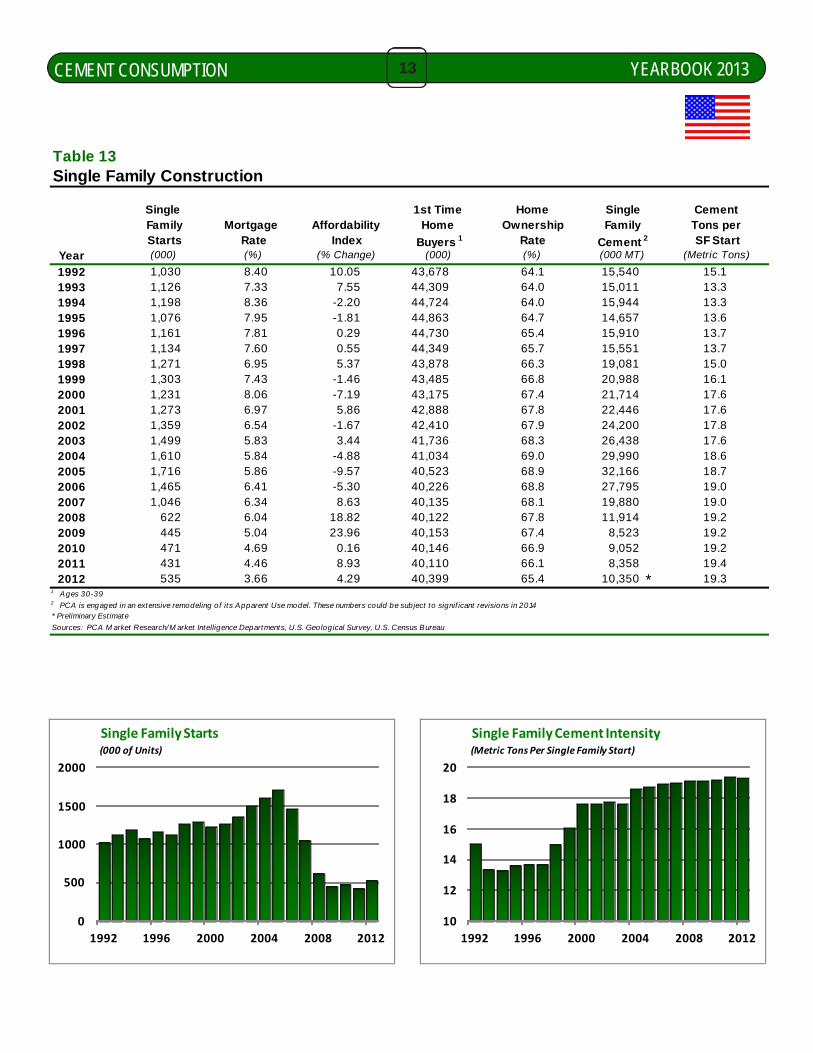
Table 13Single Family Construction
Single 1st Time Home Single Cement Family Mortgage Affordability Home Ownership Family Tons per Starts Rate Index Buyers 1 Rate Cement 2 SF Start
Year (000) (%) (% Change) (000) (%) (000 MT) (Metric Tons)
1992 1,030 8.40 10.05 43,678 64.1 15,540 15.11993 1,126 7.33 7.55 44,309 64.0 15,011 13.31994 1,198 8.36 -2.20 44,724 64.0 15,944 13.31995 1,076 7.95 -1.81 44,863 64.7 14,657 13.61996 1,161 7.81 0.29 44,730 65.4 15,910 13.71997 1,134 7.60 0.55 44,349 65.7 15,551 13.71998 1,271 6.95 5.37 43,878 66.3 19,081 15.01999 1,303 7.43 -1.46 43,485 66.8 20,988 16.12000 1,231 8.06 -7.19 43,175 67.4 21,714 17.62001 1,273 6.97 5.86 42,888 67.8 22,446 17.62002 1,359 6.54 -1.67 42,410 67.9 24,200 17.82003 1,499 5.83 3.44 41,736 68.3 26,438 17.62004 1,610 5.84 -4.88 41,034 69.0 29,990 18.62005 1,716 5.86 -9.57 40,523 68.9 32,166 18.72006 1,465 6.41 -5.30 40,226 68.8 27,795 19.02007 1,046 6.34 8.63 40,135 68.1 19,880 19.02008 622 6.04 18.82 40,122 67.8 11,914 19.22009 445 5.04 23.96 40,153 67.4 8,523 19.22010 471 4.69 0.16 40,146 66.9 9,052 19.22011 431 4.46 8.93 40,110 66.1 8,358 19.42012 535 3.66 4.29 40,399 65.4 10,350 * 19.3
1 Ages 30-392 PCA is engaged in an extensive remodeling of its Apparent Use model. These numbers could be subject to signif icant revisions in 2014* Preliminary Est imate
Sources: PCA M arket Research/M arket Intelligence Departments, U.S. Geological Survey, U.S. Census Bureau

YEARBOOK 201314CEMENT CONSUMPTION
0
50
100
150
200
250
300
350
400
1992 1996 2000 2004 2008 2012
Multifamily Starts(000 of Units)
0
2
4
6
8
10
12
1992 1996 2000 2004 2008 2012
Multifamily Cement Intensity(Metric Tons per Multifamily Start)
Table 14Multifamily Construction
Multifamily Vacancy To Rent Age Multifamily Tons per
Starts Rate Ratio Population 1 Population 2 Cement 3 MF Start
Year (000) (%) (%) (000) (000) (000 MT) (Metric Tons)
1992 169.5 9.4 2.1 39,690 32,355 1,077 6.41993 162.1 9.4 1.8 39,058 32,901 967 6.01994 258.6 9.0 2.1 38,395 33,330 1,058 4.11995 277.9 9.0 2.1 37,980 33,769 1,264 4.51996 315.9 9.2 2.1 37,740 34,142 1,329 4.21997 340.4 9.0 2.1 37,808 34,401 1,571 4.61998 345.6 9.0 2.0 37,970 34,619 2,006 5.81999 338.7 8.7 2.2 38,166 34,797 2,392 7.12000 337.7 8.6 2.4 38,397 35,070 2,390 7.12001 329.7 8.8 2.1 38,577 35,290 2,431 7.42002 346.5 9.7 1.9 38,935 35,522 2,341 6.82003 348.6 10.8 1.7 39,363 35,864 2,496 7.22004 345.1 10.9 1.9 39,953 36,203 2,738 7.92005 352.3 10.0 2.1 40,495 36,650 3,045 8.62006 335.6 9.9 2.2 41,146 37,164 3,312 9.92007 309.0 10.0 2.1 41,621 37,826 2,797 9.12008 283.5 10.5 1.8 42,083 38,778 2,038 7.22009 108.9 11.3 1.5 42,462 39,623 1,037 9.52010 115.8 10.8 1.5 42,846 40,477 677 5.82011 178.3 10.0 1.4 43,440 41,373 751 4.22012 245.3 9.0 1.4 43,982 43,145 1,028 * 4.2
1 A ges 20-292 A ges 65 and o lder3 PCA is engaged in an extensive remodeling o f it s A pparent Use model. These numbers could be sub ject to signif icant revisions in 2014* Preliminary Est imate
Sources: PCA M arket Research/M arket Intelligence Departments, U.S. Geo log ical Survey, U.S. Census B ureau
Cement Apartment RetirementMortgageAge

YEARBOOK 201315CEMENT CONSUMPTION
0
5
10
15
20
25
30
35
40
45
1992 1996 2000 2004 2008 2012
Manufacturing Construction Spending($1996 Bil )
0
20
40
60
80
100
120
1992 1996 2000 2004 2008 2012
Cement Intensity In Manufacturing(Metric Tons per Million $1996)
Table 15Manufacturing Construction
Industrial ManufacturingProduction Manufacturing Cement Tons
Index Utilization Cement 1 Per Million $Year (2007=100) (%) (%) (000 MT) (Metric Tons)
1992 63 79.6 -270 8.7 2,563 77.21993 65 80.3 -25 8.5 2,397 92.91994 69 82.9 247 7.7 2,909 94.81995 72 83.2 221 7.1 3,169 87.61996 75 82.3 -4 7.6 3,073 80.71997 80 82.9 183 8.2 3,573 98.01998 85 81.3 140 8.4 3,209 85.21999 89 80.0 -238 8.3 2,654 84.52000 92 79.3 -59 7.7 1,834 56.62001 89 73.2 -822 9.1 1,495 47.52002 89 72.5 -1,183 11.2 977 53.22003 90 73.5 -749 11.6 971 57.02004 92 75.9 -194 11.2 1,101 62.72005 95 77.9 -89 10.2 1,129 56.62006 98 78.3 -71 9.6 902 42.42007 100 78.7 -276 9.9 897 35.62008 97 74.3 -473 10.5 773 24.62009 86 65.4 -1,559 13.4 358 10.92010 91 71.4 -319 13.4 258 10.82011 94 74.4 198 13.8 338 14.22012 97 76.3 192 13.1 586 * 21.2
* Preliminary Est imate1 PCA is engaged in an extensive remodeling of its Apparent Use model. These numbers could be subject to signif icant revisions in 2014Sources: PCA M arket Research/M arket Intelligence Depts., U.S. Geological Survey, U.S. Census Bureau, CB Commercial and Bureau of Labor Stat ist ics
Capacity
38.1
19.917.617.018.431.5
36.537.731.4
27.6
Change in
($1996 Bil )
Construction Manufacturing
33.225.8
23.923.832.931.425.221.3
32.4
30.736.2
Manufacturing Employment
(000)
IndustrialVacancy Rate

YEARBOOK 201316CEMENT CONSUMPTION
0
10
20
30
40
50
60
1992 1996 2000 2004 2008 2012
Office Construction Spending($1996 Bil )
0
20
40
60
80
100
120
1992 1996 2000 2004 2008 2012
Cement Intensity in Office Construction(Metric Tons per Million $1996)
Table 16Office Construction
Change in EstimatedOffice Office Office Office Vacancy Office Cement Tons
Construction Employment Employment Capacity 1 Rate Cement 2 Per Million $
Year ($1996 Bil ) (000) (000) (000) (%) (000 MT) (Metric Tons)
1992 30.1 20,170 217 24,885 18.9 2,218 73.61993 25.2 20,904 735 25,789 17.7 1,907 75.61994 25.4 21,822 917 26,523 16.1 2,148 84.71995 27.7 22,553 732 26,889 14.6 2,282 82.51996 30.3 23,420 867 27,408 13.0 2,507 82.91997 35.3 24,674 1,253 28,344 10.8 3,213 91.01998 40.5 25,930 1,257 29,062 9.1 4,422 109.11999 43.4 27,128 1,198 29,859 9.5 4,802 110.72000 47.9 28,080 952 31,019 8.0 3,940 82.22001 43.9 28,006 -74 30,449 11.1 3,699 84.22002 31.7 27,326 -679 30,747 14.9 2,167 68.22003 28.1 27,253 -74 32,015 16.6 1,927 68.52004 29.3 27,618 365 33,125 16.4 2,020 69.02005 29.6 28,211 594 33,756 14.6 2,091 70.62006 31.5 28,971 759 33,933 13.3 2,239 71.02007 34.7 29,322 352 33,811 12.7 2,171 62.62008 34.9 28,925 -398 33,133 13.9 1,553 44.52009 23.6 27,220 -1,705 31,615 15.7 595 25.22010 16.0 27,130 -91 32,182 18.1 290 18.12011 14.7 27,702 572 33,836 17.5 312 21.22012 16.6 28,394 693 34,398 15.7 500 * 30.2
* Preliminary Est imate1 Employment Based2 PCA is engaged in an extensive remodeling of its Apparent Use model. These numbers could be subject to signif icant revisions in 2014Sources: PCA M arket Research/M arket Intelligence Depts., U.S. Geological Survey, U.S. Census Bureau, CB Commercial and Bureau of Labor Stat ist ics
Office

YEARBOOK 201317CEMENT CONSUMPTION
0
10
20
30
40
50
60
1992 1996 2000 2004 2008 2012
Retail Construction Spending($1996 Bil )
0
50
100
150
200
250
1992 1996 2000 2004 2008 2012
Cement Intensity Retail Construction(Metric Tons per Million $1996)
Table 17Retail Construction
RealConsumer Change in
Retail Spending Retail Sentiment Retail Cement Tons Construction Growth Employment Index Cement 1 Per Million $
Year ($1996 Bil ) (%) (000) ( 1985=100) (000 MT) (Metric Tons)
1992 33.4 3.7 -68 62 7,749 232.01993 34.3 3.5 190 66 7,239 211.01994 38.7 3.9 467 91 7,890 203.91995 42.0 3.0 409 100 8,367 199.11996 45.7 3.5 246 105 8,203 179.41997 48.0 3.8 249 125 8,489 176.81998 47.9 5.3 220 132 10,205 213.11999 48.7 5.5 361 135 10,712 219.82000 50.2 5.1 308 139 9,719 193.62001 48.7 2.5 -39 107 9,050 185.82002 43.1 2.5 -212 97 7,307 169.72003 41.2 3.1 -110 80 6,808 165.42004 42.5 3.8 143 96 7,001 164.62005 40.9 3.5 220 100 7,585 185.52006 42.3 3.0 75 106 7,364 174.02007 47.2 2.2 161 103 6,536 138.62008 42.2 -0.4 -232 58 4,638 110.02009 24.3 -1.6 -764 45 1,724 70.92010 17.4 2.0 -76 54 1,107 63.52011 18.5 2.5 227 58 1,254 67.82012 20.0 2.2 198 67 1,935 * 96.9
* Preliminary Est imate1 PCA is engaged in an extensive remodeling o f it s Apparent Use model. These numbers could be subject t o signif icant revisions in 2014Sources: PCA M arket Research/M arket Intelligence Depts., U.S. Geological Survey, U.S. Census Bureau, CB Commercial and Bureau of Labor Stat ist ics
Consumer

YEARBOOK 201318CEMENT CONSUMPTION
0
50
100
150
200
1992 1996 2000 2004 2008 2012
Public Construction Spending($1996 Bil )
0
50
100
150
200
250
300
350
400
1992 1996 2000 2004 2008 2012
Cement Intensity in Public Construction(Metric Tons per Million $1996)
Table 18Total Public Construction
State/Local StatePublic Share Deficit/ Government Public Cement Tons
Construction of Total Public 1 Surplus Employment Cement 2 Per Million $Year ($1996 Bil ) ( % ) ($ Bil ) (000) (000 MT) (Metric Tons)
1992 114.6 88.3 -1.4 241 37,031 323.01993 107.4 88.6 -1.0 202 35,632 331.91994 104.9 88.8 8.2 286 37,916 361.51995 118.1 88.7 9.2 157 39,305 332.71996 148.3 89.5 23.0 107 41,373 279.11997 151.6 90.8 36.3 124 44,542 293.81998 148.9 90.7 46.9 246 43,874 294.71999 156.9 91.7 41.8 398 45,776 291.72000 161.5 92.2 41.3 483 42,712 264.52001 172.5 92.5 -15.9 329 46,440 269.22002 178.4 92.2 -54.1 395 45,713 256.32003 176.4 91.7 -38.8 70 46,135 261.52004 170.1 91.7 -8.4 38 48,725 286.52005 167.8 92.6 25.9 183 51,447 306.72006 171.7 93.1 51.0 170 55,270 322.02007 182.7 92.9 12.2 244 51,950 284.32008 186.9 92.3 -72.3 291 46,804 250.42009 188.5 90.9 -72.3 45 35,576 188.82010 183.0 89.8 -25.3 -65 37,249 203.52011 165.4 89.0 -65.5 -404 36,192 218.82012 156.1 90.1 - -169 37,845 * 242.4
* Preliminary Estimate1 Based on nominal value2 PCA is engaged in an extensive remodeling of its Apparent Use model. These numbers could be subject to signif icant revisions in 2014Sources: PCA M arket Research/M arket Intelligence Depts., U.S. Geological Survey, U.S. Census Bureau, CB Commercial, Bureau of Labor Statist ics, Federal, Highway Administrat ion
Bureau of Economic Analysis
Change In

YEARBOOK 201319CEMENT CONSUMPTION
Table 19Highway Construction
EstimatedDiscretionary State
Highway Highway Deficit/ Cement Tons
Construction Spending 3 Surplus Per Million $
Year ($ Bil ) ($ Bil ) (Metric Tons)
1992 37.4 18.7 18.7 -1.4 22,702 606.91993 38.6 22.7 15.8 -1.0 22,552 584.71994 40.9 22.1 18.8 8.2 24,715 604.51995 39.0 21.1 17.9 9.2 25,810 662.61996 39.7 20.4 19.3 23.0 27,305 687.31997 40.6 19.7 20.9 36.3 29,904 736.11998 40.4 19.8 20.6 46.9 29,123 721.31999 42.9 24.5 18.4 41.8 30,582 712.42000 44.1 25.5 18.6 41.3 29,236 662.62001 47.4 25.8 21.6 -15.9 32,806 692.02002 48.3 25.9 22.4 -54.1 31,915 660.72003 47.2 22.3 24.9 -38.8 32,277 684.52004 45.6 25.6 20.0 -8.4 33,496 734.42005 45.9 26.1 19.7 25.9 35,213 767.82006 47.8 24.9 22.9 51.0 38,406 802.72007 47.8 24.6 23.2 12.2 35,069 732.92008 49.0 24.2 24.8 -72.3 31,904 651.42009 49.9 24.3 25.6 -72.3 24,791 496.52010 49.9 24.9 25.0 -25.3 26,631 533.42011 46.2 24.0 22.2 -65.5 26,521 574.62012 44.8 24.1 20.7 - 28,285 * 631.9
1 Highway Trust Fund ecompasses ISTEA/TEA/SAFETEALU and subsequent extensions following 2009 expirat ion2 Data based on planned allocat ions, not actual funding3 Includes ARRA Spending4 PCA is engaged in an extensive remodeling of its Apparent Use model. These numbers could be subject to signif icant revisions in 2014
* Preliminary Estimate
Sources: PCA M arket Research/M arket Intelligence Depts., U.S. Geological Survey, U.S. Census Bureau, U.S. Department of Transportat ion
($1996 Bil )
Trust FundHighway
Authorizations 1, 2 Cement 4Highway
(000 MT)($1996 Bil )
0
10
20
30
40
50
60
1992 1996 2000 2004 2008 2012
Highway Construction Spending($1996 Bil )
0
100
200
300
400
500
600
700
800
900
1992 1996 2000 2004 2008 2012
Cement Intensity Highway Construction(Metric Tons per Million $1996)
YEARBOOK 201320CEMENT CONSUMPTION
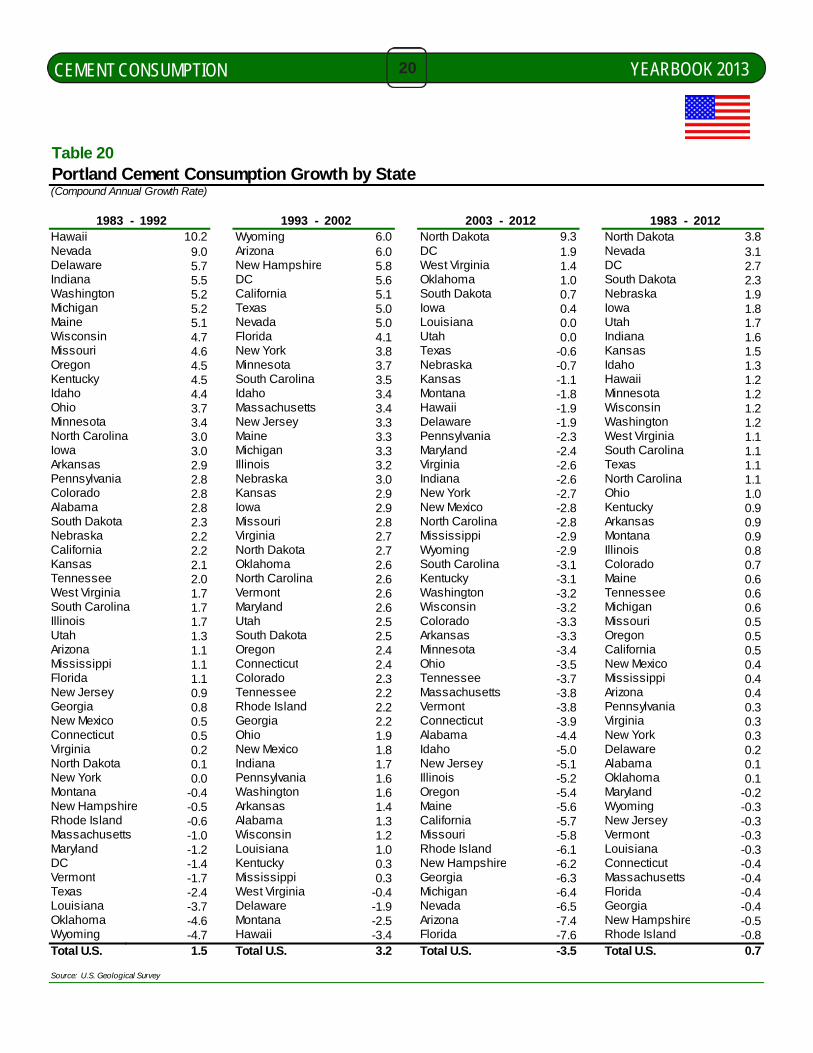
Table 20Portland Cement Consumption Growth by State(Compound Annual Growth Rate)
1983 - 1992 1993 - 2002 2003 - 2012 1983 - 2012Hawaii 10.2 Wyoming 6.0 North Dakota 9.3 North Dakota 3.8Nevada 9.0 Arizona 6.0 DC 1.9 Nevada 3.1Delaware 5.7 New Hampshire 5.8 West Virginia 1.4 DC 2.7Indiana 5.5 DC 5.6 Oklahoma 1.0 South Dakota 2.3Washington 5.2 California 5.1 South Dakota 0.7 Nebraska 1.9Michigan 5.2 Texas 5.0 Iowa 0.4 Iowa 1.8Maine 5.1 Nevada 5.0 Louisiana 0.0 Utah 1.7Wisconsin 4.7 Florida 4.1 Utah 0.0 Indiana 1.6Missouri 4.6 New York 3.8 Texas -0.6 Kansas 1.5Oregon 4.5 Minnesota 3.7 Nebraska -0.7 Idaho 1.3Kentucky 4.5 South Carolina 3.5 Kansas -1.1 Hawaii 1.2Idaho 4.4 Idaho 3.4 Montana -1.8 Minnesota 1.2Ohio 3.7 Massachusetts 3.4 Hawaii -1.9 Wisconsin 1.2Minnesota 3.4 New Jersey 3.3 Delaware -1.9 Washington 1.2North Carolina 3.0 Maine 3.3 Pennsylvania -2.3 West Virginia 1.1Iowa 3.0 Michigan 3.3 Maryland -2.4 South Carolina 1.1Arkansas 2.9 Illinois 3.2 Virginia -2.6 Texas 1.1Pennsylvania 2.8 Nebraska 3.0 Indiana -2.6 North Carolina 1.1Colorado 2.8 Kansas 2.9 New York -2.7 Ohio 1.0Alabama 2.8 Iowa 2.9 New Mexico -2.8 Kentucky 0.9South Dakota 2.3 Missouri 2.8 North Carolina -2.8 Arkansas 0.9Nebraska 2.2 Virginia 2.7 Mississippi -2.9 Montana 0.9California 2.2 North Dakota 2.7 Wyoming -2.9 Illinois 0.8Kansas 2.1 Oklahoma 2.6 South Carolina -3.1 Colorado 0.7Tennessee 2.0 North Carolina 2.6 Kentucky -3.1 Maine 0.6West Virginia 1.7 Vermont 2.6 Washington -3.2 Tennessee 0.6South Carolina 1.7 Maryland 2.6 Wisconsin -3.2 Michigan 0.6Illinois 1.7 Utah 2.5 Colorado -3.3 Missouri 0.5Utah 1.3 South Dakota 2.5 Arkansas -3.3 Oregon 0.5Arizona 1.1 Oregon 2.4 Minnesota -3.4 California 0.5Mississippi 1.1 Connecticut 2.4 Ohio -3.5 New Mexico 0.4Florida 1.1 Colorado 2.3 Tennessee -3.7 Mississippi 0.4New Jersey 0.9 Tennessee 2.2 Massachusetts -3.8 Arizona 0.4Georgia 0.8 Rhode Island 2.2 Vermont -3.8 Pennsylvania 0.3New Mexico 0.5 Georgia 2.2 Connecticut -3.9 Virginia 0.3Connecticut 0.5 Ohio 1.9 Alabama -4.4 New York 0.3Virginia 0.2 New Mexico 1.8 Idaho -5.0 Delaware 0.2North Dakota 0.1 Indiana 1.7 New Jersey -5.1 Alabama 0.1New York 0.0 Pennsylvania 1.6 Illinois -5.2 Oklahoma 0.1Montana -0.4 Washington 1.6 Oregon -5.4 Maryland -0.2New Hampshire -0.5 Arkansas 1.4 Maine -5.6 Wyoming -0.3Rhode Island -0.6 Alabama 1.3 California -5.7 New Jersey -0.3Massachusetts -1.0 Wisconsin 1.2 Missouri -5.8 Vermont -0.3Maryland -1.2 Louisiana 1.0 Rhode Island -6.1 Louisiana -0.3DC -1.4 Kentucky 0.3 New Hampshire -6.2 Connecticut -0.4Vermont -1.7 Mississippi 0.3 Georgia -6.3 Massachusetts -0.4Texas -2.4 West Virginia -0.4 Michigan -6.4 Florida -0.4Louisiana -3.7 Delaware -1.9 Nevada -6.5 Georgia -0.4Oklahoma -4.6 Montana -2.5 Arizona -7.4 New Hampshire -0.5Wyoming -4.7 Hawaii -3.4 Florida -7.6 Rhode Island -0.8Total U.S. 1.5 Total U.S. 3.2 Total U.S. -3.5 Total U.S. 0.7
Source: U.S. Geological Survey

YEARBOOK 201321CEMENT CONSUMPTION
0
5
10
15
20
25
30
35
40
1992 1996 2000 2004 2008 2012
Portland Cement Consumption(Top Three States ‐ Share of the Total U.S., % )
52%
36%
12%
Portland Cement ConsumptionShare of Total U.S.
2012
Top 10 States Mid 20 States Lower States
Table 21Top 20 States in Portland Cement Consumption¹(Thousands of Metric Tons)
State 1992 State 2002 State 2012California 7,974 California 12,633 Texas 12,445 Texas 6,934 Texas 12,438 California 7,407 Florida 4,924 Florida 7,828 Florida 3,883 Illinois 3,330 Illinois 4,544 Ohio 2,692 Pennsylvania 2,922 Ohio 3,763 Illinois 2,583 Ohio 2,894 Pennsylvania 3,320 Pennsylvania 2,469 Georgia 2,222 Arizona 3,293 New York 2,391 New York 2,197 New York 3,157 Louisiana 2,053 Michigan 2,190 Michigan 3,147 North Carolina 1,851 Missouri 1,963 Georgia 3,086 Georgia 1,795 North Carolina 1,809 Colorado 2,612 Iowa 1,781 Wisconsin 1,787 North Carolina 2,511 Arizona 1,672 Indiana 1,777 Missouri 2,500 Indiana 1,668 Colorado 1,765 Virginia 2,119 Oklahoma 1,641 Arizona 1,671 Indiana 2,081 Colorado 1,631 Washington 1,621 Wisconsin 2,054 Virginia 1,614 Louisiana 1,556 Minnesota 1,998 Wisconsin 1,606 Virginia 1,500 New Jersey 1,975 Michigan 1,570 Minnesota 1,428 Tennessee 1,921 Missouri 1,463 Tennessee 1,402 Washington 1,899 Minnesota 1,462
Total U.S. 73,354 Total U.S. 104,950 Total U.S. 76,511
¹ U.S. Total excludes AK, HI and Puerto Rico
Source: U.S. Geological Survey

YEARBOOK 201322
THT
This page intentionally left blank.

YEARBOOK 201323INFRASTRUCTURE
0
50
100
150
200
1992 1996 2000 2004 2008 2012
Gas Tax vs. Highway Construction Cost Inflation(2000=100)
Gas Tax
Cost Index
14.0
16.0
18.0
20.0
22.0
24.0
26.0
1992 1996 2000 2004 2008 2012
Average Miles Per Gallon(Total Average MPG for All Vehicle Types)
Table 22Highway Infrastructure Funding
FuelEconomy
Year (average MPG)
1992 14.1 14.4 12.6 1.5 20.8 89.11993 18.4 18.4 16.9 1.5 20.9 90.11994 18.4 18.0 16.9 1.5 20.4 92.71995 18.4 17.6 16.4 2.0 20.5 96.81996 18.3 17.2 16.3 2.0 20.4 100.01997 18.4 17.0 15.5 2.9 20.1 103.31998 18.4 16.9 15.5 2.9 20.1 105.51999 18.4 16.6 15.5 2.9 19.7 108.72000 18.4 16.3 15.5 2.9 19.8 113.62001 18.4 15.9 15.5 2.9 19.6 117.52002 18.4 15.6 15.5 2.9 19.4 120.22003 18.4 15.3 15.5 2.9 19.6 122.92004 18.4 14.9 15.5 2.9 19.3 129.92005 18.4 14.5 15.5 2.9 19.9 141.92006 18.4 14.0 15.5 2.9 20.1 152.92007 18.4 13.7 15.5 2.9 20.6 164.12008 18.4 13.4 15.5 2.9 21.0 173.02009 18.4 13.3 15.5 2.9 22.4 172.72010 18.4 13.1 15.5 2.9 22.5 172.92011 18.4 12.9 15.5 2.9 22.4 179.42012 18.4 12.7 15.5 2.9 23.8 186.1
Source: PCA Market Intelligence, U.S. Geological Survey, U.S. Census Bureau, U.S. Department of Transportation, Federal Highway Administration, U.S. Bureau of Economic Analysis (BEA)
Gas Tax (cents per gallon)
Gas TaxHighway
(1996=100)
Cost IndexConstruction
Allocation(Bil Miles)
Vehicle Miles
Traveled
Gas Tax Gas Tax
Allocation (cents per gallon)
Public TransitHighway
2,4232,3582,2972,247
(cents per gallon)
2,7472,6792,6252,5602,482
(cents per gallon)
Deflated
(1993$)
3,003
2,9402,9562,9982,9682,927
2,9992,9692,9372,8862,8562,792

YEARBOOK 201324INFRASTRUCTURE
Table 23Highway Congestion
LicensedDrivers
Year
1992 8,124,090 173,125 190,362 46.9 42.71993 8,132,196 173,149 194,063 47.0 41.91994 8,143,014 175,403 198,045 46.4 41.11995 8,158,253 176,628 201,530 46.2 40.51996 8,178,654 179,539 206,570 45.6 39.61997 8,242,437 182,709 207,754 45.1 39.71998 8,160,858 184,980 211,617 44.1 38.61999 8,177,983 187,170 216,309 43.7 37.82000 8,224,245 190,625 221,475 43.1 37.12001 8,251,847 191,276 230,428 43.1 35.82002 8,295,171 194,296 229,620 42.7 36.12003 8,315,121 196,166 231,390 42.4 35.92004 8,338,821 198,889 237,243 41.9 35.12005 8,371,718 200,665 241,194 41.7 34.72006 8,420,589 202,810 244,166 41.5 34.52007 8,457,353 205,742 247,265 41.1 34.22008 8,483,969 208,321 248,165 40.7 34.22009 8,542,163 209,618 246,283 40.8 34.72010 8,581,158 210,115 242,061 40.8 35.52011 8,567,618 211,875 244,778 40.4 35.02012 * 8,615,478 213,073 243,677 40.4 35.4
* Est imated
Source: Federal Highway Administrat ion
(per million drivers)
Fatalities Vehicles
210.6217.0215.4218.6221.0220.6220.0222.9224.5
Lane Miles
(000)
TotalVehiclesOn Road
Per Thousand
(000)
Licensed DriversPer Thousand
Lane MilesHighway
Lane Miles
Total
156.8*144.4*134.3*
226.6
200.5179.6168.7*
229.9234.3236.8232.1231.8
30
32
34
36
38
40
42
44
46
48
1992 1996 2000 2004 2008 2012
Lane Miles per Thousand Licensed Drivers
30
32
34
36
38
40
42
44
1992 1996 2000 2004 2008 2012
Lane Miles per Thousand Vehicles
YEARBOOK 201325INFRASTRUCTURE
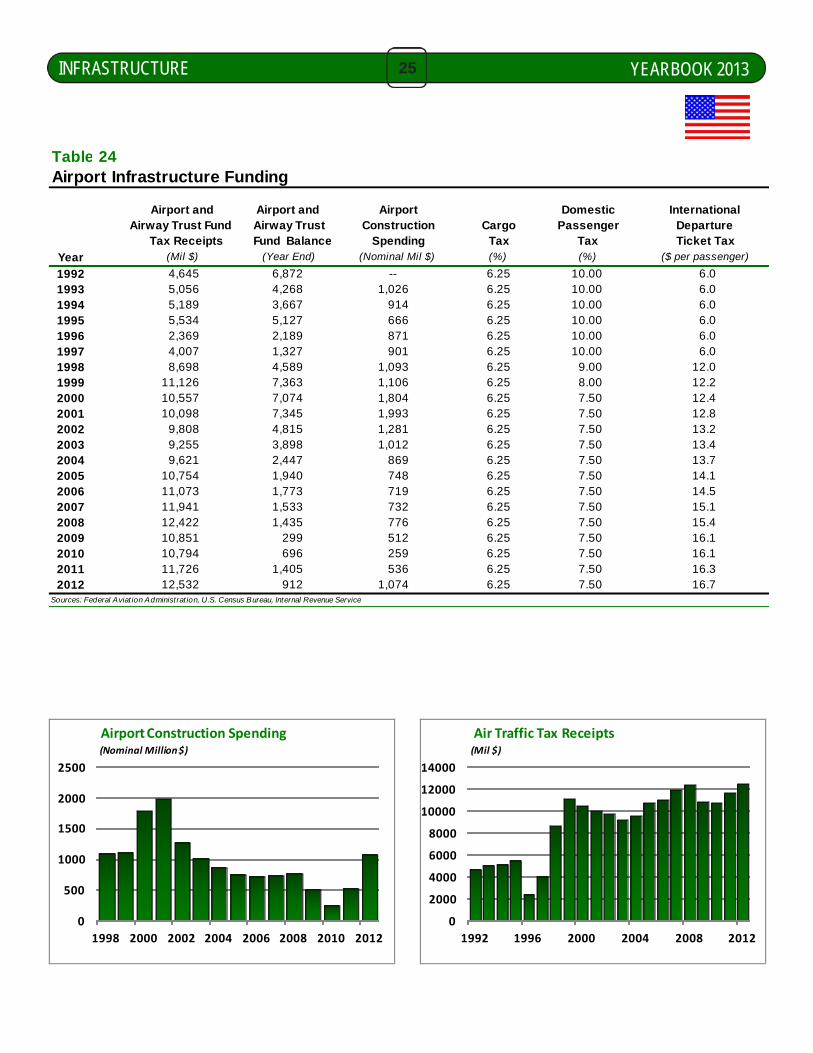
Table 24Airport Infrastructure Funding
Year
1992 4,645 6,872 -- 6.25 10.00 6.01993 5,056 4,268 1,026 6.25 10.00 6.01994 5,189 3,667 914 6.25 10.00 6.01995 5,534 5,127 666 6.25 10.00 6.01996 2,369 2,189 871 6.25 10.00 6.01997 4,007 1,327 901 6.25 10.00 6.01998 8,698 4,589 1,093 6.25 9.00 12.01999 11,126 7,363 1,106 6.25 8.00 12.22000 10,557 7,074 1,804 6.25 7.50 12.42001 10,098 7,345 1,993 6.25 7.50 12.82002 9,808 4,815 1,281 6.25 7.50 13.22003 9,255 3,898 1,012 6.25 7.50 13.42004 9,621 2,447 869 6.25 7.50 13.72005 10,754 1,940 748 6.25 7.50 14.12006 11,073 1,773 719 6.25 7.50 14.52007 11,941 1,533 732 6.25 7.50 15.12008 12,422 1,435 776 6.25 7.50 15.42009 10,851 299 512 6.25 7.50 16.12010 10,794 696 259 6.25 7.50 16.12011 11,726 1,405 536 6.25 7.50 16.32012 12,532 912 1,074 6.25 7.50 16.7
Sources: Federal Aviat ion Administrat ion, U.S. Census Bureau, Internal Revenue Service
Airport and Airway Trust Fund
Tax Receipts(Mil $) (Year End)
Airport and Airway Trust
Fund Balance(Nominal Mil $)
Construction CargoTax
Airport
($ per passenger)(%) (%)
Spending
Domestic International
TaxPassenger
Ticket TaxDeparture
0
500
1000
1500
2000
2500
1998 2000 2002 2004 2006 2008 2010 2012
Airport Construction Spending(Nominal Million $)
0
2000
4000
6000
8000
10000
12000
14000
1992 1996 2000 2004 2008 2012
Air Traffic Tax Receipts(Mil $)
YEARBOOK 201326INFRASTRUCTURE
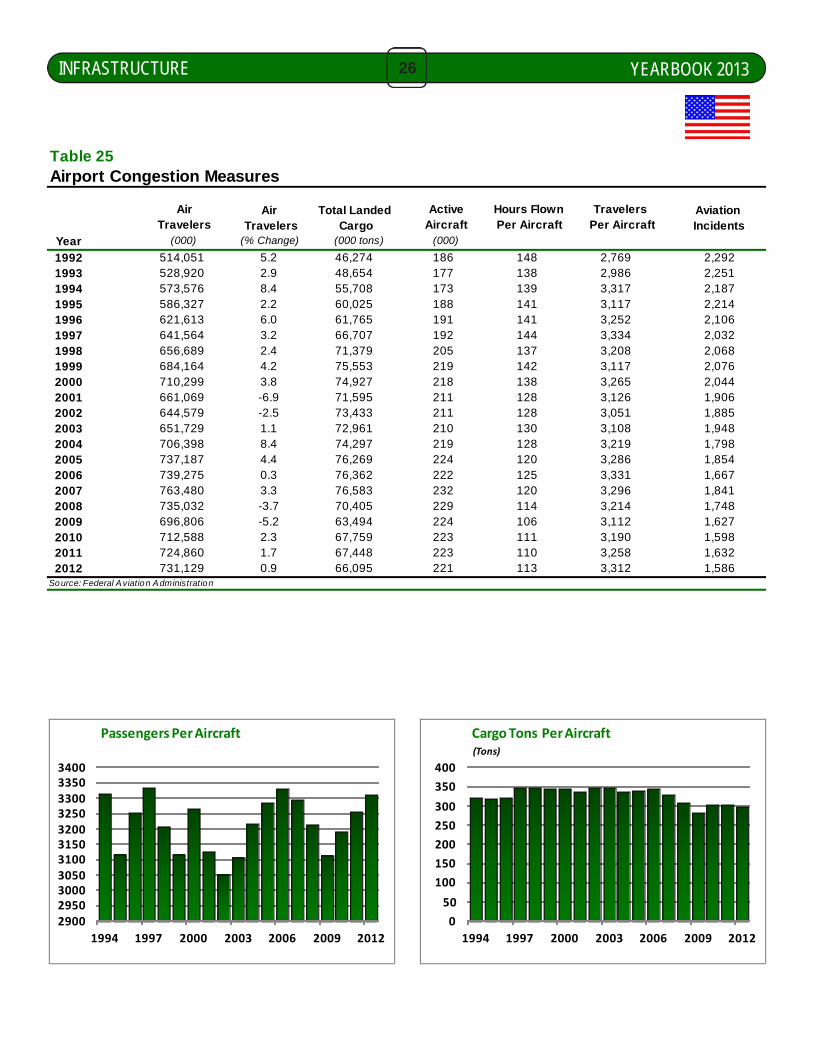
29002950300030503100315032003250330033503400
1994 1997 2000 2003 2006 2009 2012
Passengers Per Aircraft
0
50
100
150
200
250
300
350
400
1994 1997 2000 2003 2006 2009 2012
Cargo Tons Per Aircraft(Tons)
Table 25Airport Congestion Measures
Air Total Landed Aviation Travelers Cargo Incidents
Year
1992 514,051 5.2 46,274 186 148 2,769 2,2921993 528,920 2.9 48,654 177 138 2,986 2,2511994 573,576 8.4 55,708 173 139 3,317 2,1871995 586,327 2.2 60,025 188 141 3,117 2,2141996 621,613 6.0 61,765 191 141 3,252 2,1061997 641,564 3.2 66,707 192 144 3,334 2,0321998 656,689 2.4 71,379 205 137 3,208 2,0681999 684,164 4.2 75,553 219 142 3,117 2,0762000 710,299 3.8 74,927 218 138 3,265 2,0442001 661,069 -6.9 71,595 211 128 3,126 1,9062002 644,579 -2.5 73,433 211 128 3,051 1,8852003 651,729 1.1 72,961 210 130 3,108 1,9482004 706,398 8.4 74,297 219 128 3,219 1,7982005 737,187 4.4 76,269 224 120 3,286 1,8542006 739,275 0.3 76,362 222 125 3,331 1,6672007 763,480 3.3 76,583 232 120 3,296 1,8412008 735,032 -3.7 70,405 229 114 3,214 1,7482009 696,806 -5.2 63,494 224 106 3,112 1,6272010 712,588 2.3 67,759 223 111 3,190 1,5982011 724,860 1.7 67,448 223 110 3,258 1,6322012 731,129 0.9 66,095 221 113 3,312 1,586
Source: Federal Aviation Administration
Travelers Travelers Aircraft Per Aircraft Per Aircraft
(000) (% Change)
Air Active Hours Flown
(000 tons) (000)

YEARBOOK 201327INFRASTRUCTURE
Table 26Seaport Congestion Measures
RatioWater Transportation
to GDPYear (%)
1992 2,132 1.9 19,126 0.3 2.91993 2,128 -0.2 19,996 4.5 2.91994 2,215 4.1 20,433 2.2 2.81995 2,240 1.2 22,136 8.3 2.91996 2,284 1.9 23,909 8.0 3.01997 2,333 2.1 24,598 2.9 2.91998 2,340 0.3 24,820 0.9 2.71999 2,323 -0.7 26,191 5.5 2.72000 2,425 4.4 27,583 5.3 2.72001 2,393 -1.3 27,741 0.6 2.62002 2,340 -2.2 26,962 -2.8 2.52003 2,394 2.3 28,311 5.0 2.52004 2,552 6.6 30,676 8.4 2.52005 2,528 -1.0 30,527 -0.5 2.32006 2,588 2.4 30,930 1.3 2.22007 2,564 -0.9 34,407 11.2 2.42008 2,477 -3.4 37,580 9.2 2.62009 2,211 -10.8 35,471 -5.6 2.52010 2,334 5.6 37,151 4.7 2.52011 2,368 1.4 39,891 7.4 2.6
Sources: U.S. Army Corps of Engineers,M aritime Administration, Bureau of Economic Analysis
Water WaterU.S. Waterborne U.S. Waterborne Transportation Transportation
Commerce Commerce Gross Output Gross Output(Million Short Tons) (% Change) (Mil $) (% Change)
850
900
950
1000
1050
1100
1150
1993 1996 1999 2002 2005 2008 2011
Waterborne Commerce ‐Domestic(Million Short Tons)
0
200
400
600
800
1000
1200
1400
1600
1800
1993 1996 1999 2002 2005 2008 2011
Waterborne Commerce ‐ Foreign(Million Short Tons)

YEARBOOK 201328
This page intentionally left blank.
YEARBOOK 201329CEMENT SUPPLY
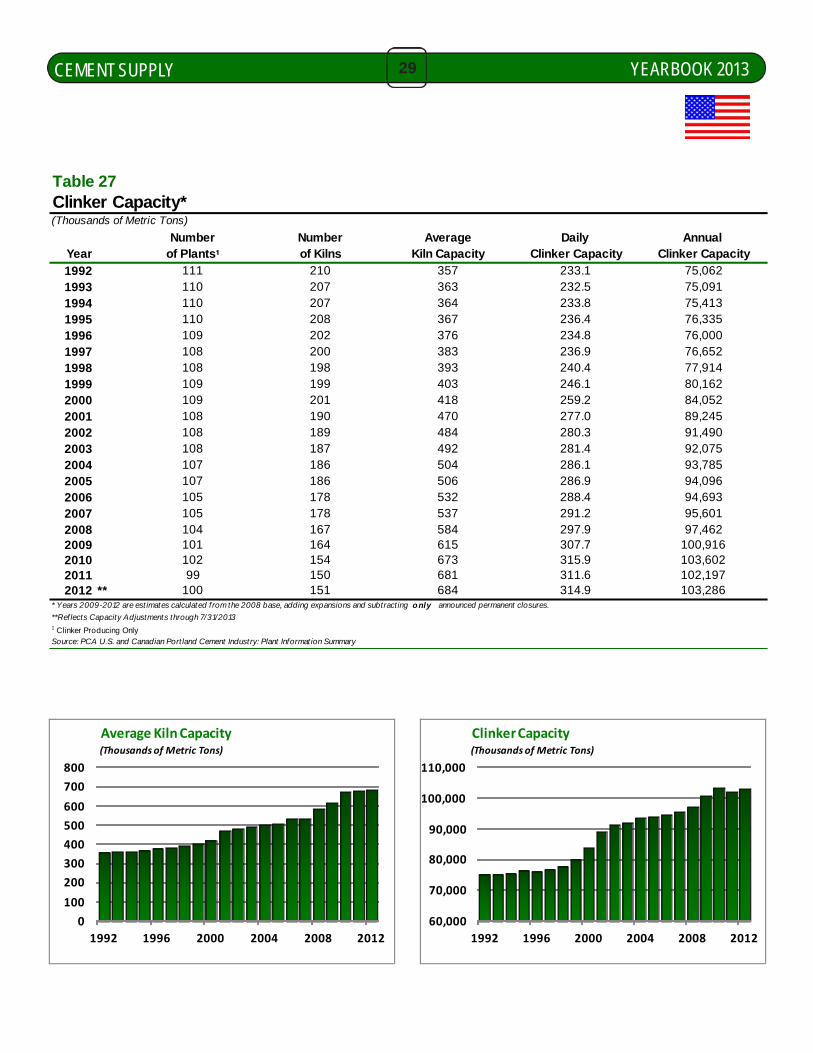
Table 27Clinker Capacity*(Thousands of Metric Tons)
Number Number Average Daily Annual Year of Plants¹ of Kilns Kiln Capacity Clinker Capacity Clinker Capacity
1992 111 210 357 233.1 75,0621993 110 207 363 232.5 75,0911994 110 207 364 233.8 75,4131995 110 208 367 236.4 76,3351996 109 202 376 234.8 76,0001997 108 200 383 236.9 76,6521998 108 198 393 240.4 77,9141999 109 199 403 246.1 80,1622000 109 201 418 259.2 84,0522001 108 190 470 277.0 89,2452002 108 189 484 280.3 91,4902003 108 187 492 281.4 92,0752004 107 186 504 286.1 93,7852005 107 186 506 286.9 94,0962006 105 178 532 288.4 94,6932007 105 178 537 291.2 95,6012008 104 167 584 297.9 97,4622009 101 164 615 307.7 100,9162010 102 154 673 315.9 103,6022011 99 150 681 311.6 102,1972012 ** 100 151 684 314.9 103,286
* Years 2009-2012 are est imates calculated from the 2008 base, adding expansions and subtracting only announced permanent closures.
**Ref lects Capacity Adjustments through 7/31/20131 Clinker Producing OnlySource: PCA U.S. and Canadian Port land Cement Industry: Plant Information Summary
0
100
200
300
400
500
600
700
800
1992 1996 2000 2004 2008 2012
Average Kiln Capacity(Thousands of Metric Tons)
60,000
70,000
80,000
90,000
100,000
110,000
1992 1996 2000 2004 2008 2012
Clinker Capacity(Thousands of Metric Tons)

YEARBOOK 201330CEMENT SUPPLY
0
20
40
60
80
100
1992 1996 2000 2004 2008 2012
Clinker Production(MillionMetric Tons)
0
20
40
60
80
100
120
1992 1996 2000 2004 2008 2012
Capacity Utilization Rate(Percent)
Table 28Clinker Production,Capacity and Capacity Utilization
Clinker UtilizationYear Production Rate
(MMT) (%)
1992 62.1 75.1 82.71993 65.7 75.1 87.51994 68.6 75.4 91.01995 70.0 76.3 91.71996 70.4 76.0 92.61997 72.7 76.7 94.81998 75.9 77.9 97.41999 77.3 80.2 96.42000 79.6 84.1 94.72001 79.9 89.2 89.52002 83.0 91.5 90.82003 83.2 92.1 90.42004 88.0 93.8 93.82005 88.7 94.1 94.32006 89.9 94.7 95.02007 87.5 95.6 91.62008 79.6 97.5 81.62009 56.9 100.9 56.42010 60.4 104.4 57.92011 62.0 104.4 59.32012 67.8 103.3 ** 65.6
* Years 2009-2012 are est imates calculated from the 2008 base, adding expansions
and subtract ing only announced permanent closures.
**Reflects Capacity Adjustments through 7/31/2013
C linker is the primary intermediate product of cement making. Kilns produce clinker which is f inely
ground to make f inished cement. Clinker comprises approximately 96% of cement's f inal weight
Source: U.S. Geological Survey
PCA U.S. and Canadian Port land Cement Industry: Plant Informat ion Summary
ClinkerCapacity*
(MMT)

YEARBOOK 201331CEMENT SUPPLY
Table 29Age Distribution of U.S. Clinker Capacity by Process, 2012**(Percent)
Age of Kilns Wet Process Dry Process Total
Before 1931 3.8 0.0 0.41931-1935 0.0 0.0 0.01936-1940 0.0 0.0 0.01941-1945 0.0 0.0 0.01946-1950 0.0 0.1 0.11951-1955 7.0 0.3 0.91956-1960 21.2 2.7 4.61961-1965 44.4 5.3 8.91966-1970 19.3 2.0 3.71971-1975 4.3 6.8 7.01976-1980 0.0 13.6 12.5After 1980 0.0 69.2 62.2
Total Clinker 8,972 94,314 103,286**Ref lects Capacity Adjustments through 7/31/2012
Source: PCA U.S. and Canadian Port land Cement Industry: Plant Informat ion Summary
0
10
20
30
40
50
60
70
< 1950 50's 60's 70's 1980 >
Age Distribution of U.S. Kilns ‐ 2012(Percent)
60
65
70
75
80
85
90
95
1992 1996 2000 2004 2008 2012
Dry Process Kilns(Percent of Total)

YEARBOOK 201332CEMENT SUPPLY
Table 30Clinker Capacity By Census District*(Thousands of Metric Tons)
East East West WestNew Mid South North South North South
Year England Atlantic Atlantic Central Central Central Central Mountain Pacific Total
1992 392 9,166 10,156 11,288 6,014 9,798 10,367 6,205 11,677 75,0621993 392 9,582 10,156 10,807 6,096 9,873 10,437 6,126 11,622 75,0911994 392 9,117 10,115 10,890 6,170 10,037 10,495 6,406 11,791 75,4131995 392 9,099 10,164 11,007 6,278 10,171 10,646 6,685 11,893 76,3351996 392 9,091 10,160 10,992 6,194 10,151 10,684 6,683 11,653 76,0001997 392 9,090 10,082 10,533 6,384 10,220 10,673 6,928 12,350 76,6521998 392 9,554 10,418 10,634 6,452 10,324 10,729 7,147 12,264 77,9141999 392 9,463 11,323 10,656 6,625 10,498 11,040 7,127 13,038 80,1622000 392 9,614 12,343 11,408 7,351 10,666 11,947 7,498 12,833 84,0522001 392 9,183 12,712 11,337 7,715 11,766 13,660 8,384 14,096 89,2452002 392 9,236 12,585 11,354 8,570 12,260 13,671 9,293 14,129 91,4902003 392 9,186 13,887 11,291 8,369 12,327 13,621 8,828 14,174 92,0752004 392 9,300 14,355 11,319 8,597 14,241 12,519 8,754 14,308 93,7852005 392 9,357 14,436 11,269 8,677 12,376 14,408 8,744 14,437 94,0962006 776 9,159 14,998 11,581 8,722 12,191 14,228 8,657 14,381 94,6932007 661 9,088 15,334 12,108 8,815 12,716 14,175 8,411 14,293 95,6012008 647 9,021 16,096 11,720 8,700 12,787 15,074 8,256 15,161 97,4622009 647 8,567 18,032 10,890 8,389 15,328 15,074 9,119 14,870 100,9162010 647 8,805 18,806 10,890 8,286 16,327 16,383 9,418 14,040 103,6022011 647 7,947 18,806 10,890 7,872 15,908 16,383 9,717 14,040 102,1972012 ** 647 7,947 18,806 10,890 7,872 15,908 17,472 9,717 14,040 103,286
* Y ears 2009-2011 are est imates calculated f rom the 2008 base, add ing expansions and subt ract ing o nly announced permanent closures.
**Ref lect s Capacity A d justments through 7/31/2012
Source: PCA U.S. and Canad ian Port land Cement Indust ry: Plant Informat ion Summary
Pacific14.2%
Mountain9.3%
West North Central15.6%
West South Central15.7%
East North Central10.4%
East South Central 7.8%
South Atlantic 17.8%
Middle Atlantic8.2%
New England0.6%
Clinker Capacity2012**
YEARBOOK 201333CEMENT SUPPLY
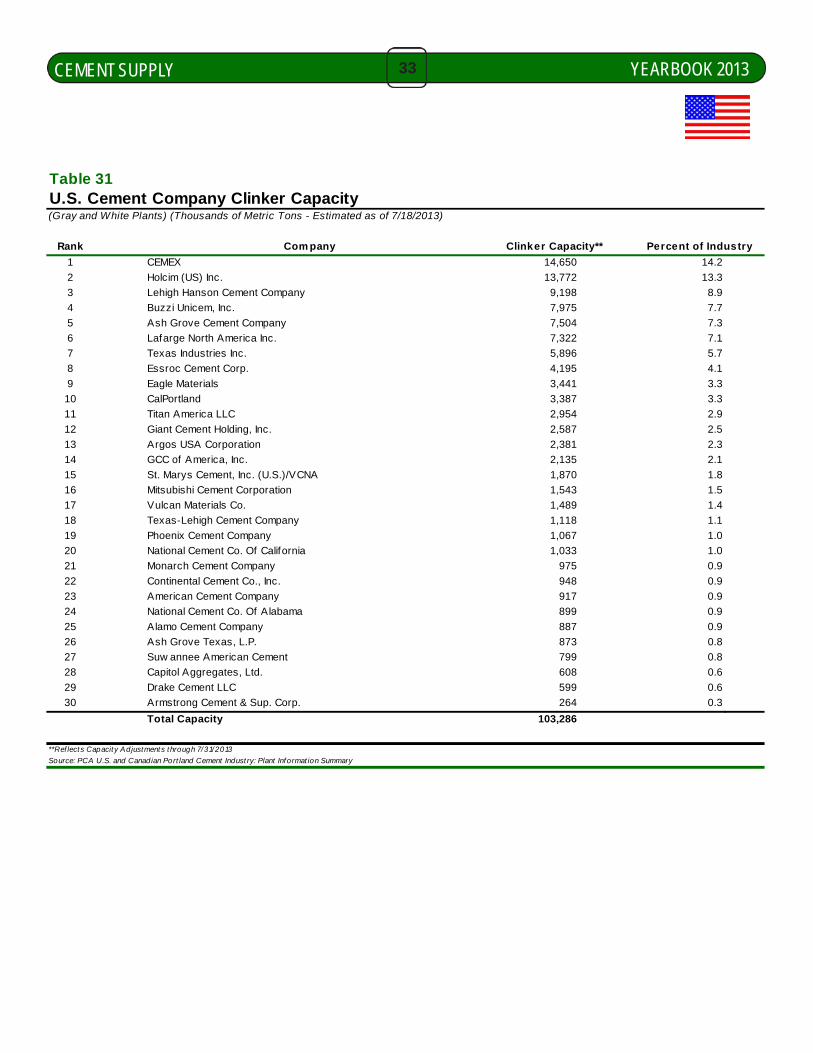
Table 31U.S. Cement Company Clinker Capacity(Gray and White Plants) (Thousands of Metric Tons - Estimated as of 7/18/2013)
Rank Com pany Clinker Capacity** Percent of Industry
1 CEMEX 14,650 14.2
2 Holcim (US) Inc. 13,772 13.3
3 Lehigh Hanson Cement Company 9,198 8.9
4 Buzzi Unicem, Inc. 7,975 7.7
5 Ash Grove Cement Company 7,504 7.3
6 Lafarge North America Inc. 7,322 7.1
7 Texas Industries Inc. 5,896 5.7
8 Essroc Cement Corp. 4,195 4.1
9 Eagle Materials 3,441 3.3
10 CalPortland 3,387 3.3
11 Titan America LLC 2,954 2.9
12 Giant Cement Holding, Inc. 2,587 2.5
13 Argos USA Corporation 2,381 2.3
14 GCC of America, Inc. 2,135 2.1
15 St. Marys Cement, Inc. (U.S.)/VCNA 1,870 1.8
16 Mitsubishi Cement Corporation 1,543 1.5
17 Vulcan Materials Co. 1,489 1.4
18 Texas-Lehigh Cement Company 1,118 1.1
19 Phoenix Cement Company 1,067 1.0
20 National Cement Co. Of California 1,033 1.0
21 Monarch Cement Company 975 0.9
22 Continental Cement Co., Inc. 948 0.9
23 American Cement Company 917 0.9
24 National Cement Co. Of Alabama 899 0.9
25 Alamo Cement Company 887 0.9
26 Ash Grove Texas, L.P. 873 0.8
27 Suw annee American Cement 799 0.8
28 Capitol Aggregates, Ltd. 608 0.6
29 Drake Cement LLC 599 0.6
30 Armstrong Cement & Sup. Corp. 264 0.3
Total Capacity 103,286
**Ref lects Capacity Adjustments through 7/31/2013
Source: PCA U.S. and Canadian Port land Cement Indust ry: Plant Informat ion Summary
YEARBOOK 201334CEMENT SUPPLY
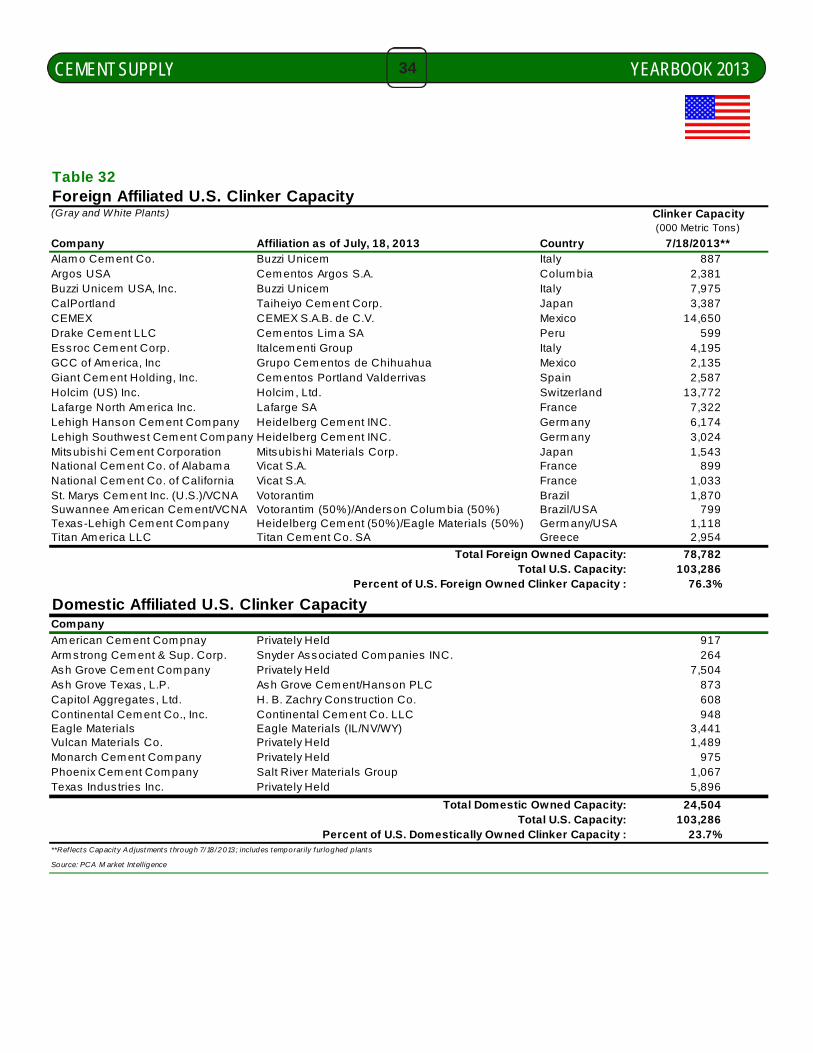
Table 32Foreign Affiliated U.S. Clinker Capacity(Gray and White Plants) Clinker Capacity
(000 Metric Tons)
Company Affiliation as of July, 18, 2013 Country 7/18/2013**Alam o Cem ent Co. Buzzi Unicem Italy 887Argos USA Cem entos Argos S.A. Colum bia 2,381Buzzi Unicem USA, Inc. Buzzi Unicem Italy 7,975CalPortland Taiheiyo Cem ent Corp. Japan 3,387CEMEX CEMEX S.A.B. de C.V. Mexico 14,650Drake Cem ent LLC Cem entos Lim a SA Peru 599Ess roc Cem ent Corp. Italcem enti Group Italy 4,195GCC of Am erica, Inc Grupo Cem entos de Chihuahua Mexico 2,135Giant Cem ent Holding, Inc. Cem entos Portland Valderrivas Spain 2,587Holcim (US) Inc. Holcim , Ltd. Switzerland 13,772Lafarge North Am erica Inc. Lafarge SA France 7,322Lehigh Hanson Cem ent Com pany Heidelberg Cem ent INC. Germ any 6,174Lehigh Southwes t Cem ent Com pany Heidelberg Cem ent INC. Germ any 3,024Mitsubishi Cem ent Corporation Mitsubishi Materials Corp. Japan 1,543National Cem ent Co. of Alabam a Vicat S.A. France 899National Cem ent Co. of California Vicat S.A. France 1,033St. Marys Cem ent Inc. (U.S.)/VCNA Votorantim Brazil 1,870Suwannee Am erican Cem ent/VCNA Votorantim (50%)/Anderson Colum bia (50%) Brazil/USA 799Texas-Lehigh Cem ent Com pany Heidelberg Cem ent (50%)/Eagle Materials (50%) Germ any/USA 1,118Titan Am erica LLC Titan Cem ent Co. SA Greece 2,954
Total Foreign Owned Capacity: 78,782Total U.S. Capacity: 103,286
Percent of U.S. Foreign Owned Clinker Capacity : 76.3%
Domestic Affiliated U.S. Clinker CapacityCompany
Am erican Cem ent Com pnay Privately Held 917Arm strong Cem ent & Sup. Corp. Snyder Associated Com panies INC. 264Ash Grove Cem ent Com pany Privately Held 7,504Ash Grove Texas , L.P. Ash Grove Cem ent/Hanson PLC 873Capitol Aggregates , Ltd. H. B. Zachry Cons truction Co. 608Continental Cem ent Co., Inc. Continental Cem ent Co. LLC 948Eagle Materials Eagle Materials (IL/NV/WY) 3,441Vulcan Materials Co. Privately Held 1,489Monarch Cem ent Com pany Privately Held 975Phoenix Cem ent Com pany Salt River Materials Group 1,067Texas Indus tries Inc. Privately Held 5,896
Total Domestic Owned Capacity: 24,504Total U.S. Capacity: 103,286
Percent of U.S. Domestically Owned Clinker Capacity : 23.7%**Ref lects Capacit y A djustments through 7/18 /2013; includes temporarily f urloghed p lants
Source: PCA M arket Intelligence

YEARBOOK 201335CEMENT SUPPLY
Table 33Capacity Expansion Estimates(Clinker, Thousands of Metric Tons)
Year OnCompany Location Stream 2012 2013 2014 2015 2016 2017 Total
Total Expansion 1,089 0 0 1,673 3,744 1,707 8,558Estimated Dollar Investment ($ Millions) $300 $0 $0 $446 $1,032 $486 $6,126
2011Sumter Cement Company Center Hill, Florida (G) P** 0 0 0 0 0 0 0
2012CalPortland Rillito, Arizona P** 0 0 0 0 0 0 0Cemex Seligman, Arizona (G) P** 0 0 0 0 0 0 0Eagle Materials Laramie, Wyoming P** 0 0 0 0 0 0 0Lehigh Mitchell, Indiana P** 0 0 0 0 0 0 0Texas Industries Inc New Braunfels, Texas 2012 1,089 0 0 0 0 0 1,089
2013Lafarge Grand Chain, Illinois 2013 0 0 0 0 1,657 0 1,657National Cement Ragland, Alabama P** 0 0 0 0 0 0 0
2015
Houston American Cement Perry, Georgia (G) 2015 0 0 0 817 0 0 817Lafarge Ravena, New York 2015 0 0 0 856 0 0 856
2016Titan America Castle Hayne, North Carolina 2016 0 0 0 0 2,087 0 2,087
2017Universal Cement Chicago, Illinois (G) 2015 0 0 0 0 0 907 907Lafarge Exshaw, Alberta (Canada) 2015 0 0 0 0 0 800 800
UnspecifiedCemex Odessa, TX - - - - - - - 345
Net North American Capacity Changes 1,089 0 0 1,673 3,744 6,506 11,923
(P**) Postponed-no additional information available
(G) Designates a greenfield plant. All other listings reflect expansions
Net Expansion

YEARBOOK 201336CEMENT SUPPLY
Table 3415 Largest States Ranked by Cement Grinding Capacity(Thousands of Metric Tons - as of 12/31/10)
1992 2002 2012Cement Percent of Cement Percent of Cement Percent ofGrinding U.S. Grinding U.S. Grinding U.S.
State Rank Capacity Total Rank Capacity Total Rank Capacity Total
Texas 2 10,850 11.9 2 12,750 10.9 1 15,064 11.7California 1 11,496 12.7 1 14,606 12.5 2 14,536 11.3Florida 5 5,054 5.6 5 7,215 6.2 3 11,801 9.2Missouri 7 4,585 5.1 6 6,448 5.5 4 10,045 7.8Alabama 6 5,010 5.5 8 5,350 4.6 5 7,084 5.5Pennsylvania 3 7,458 8.2 4 7,426 6.4 6 6,639 5.1Michigan 4 5,843 6.4 3 7,617 6.5 8 5,991 4.6South Carolina 11 2,576 2.8 7 3,779 3.2 7 4,716 3.7Arizona 12 2,136 2.4 12 3,435 2.9 9 4,169 3.2Colorado 15 1,854 2.0 14 3,185 2.7 10 4,138 3.2Maryland 14 1,885 2.1 13 3,278 2.8 11 4,061 3.1Indiana 10 2,659 2.9 9 3,952 3.4 12 3,735 2.9New York 8 3,177 3.5 10 3,861 3.3 13 3,193 2.5Illinois 9 2,667 2.9 11 3,836 3.3 14 3,482 2.7Kansas 13 1,960 2.2 15 2,964 2.5 15 3,217 2.5
Total U.S. 90,770 116,790 128,934Source: PCA U.S. and Canadian Port land Cement Industry: Plant Information Summary
Grinding Capacity2012/2010 Percent Change
Pacific
Mountain West North Central
East North CentralNewEngland
Middle Atlantic
SouthAtlantic
District of Columbia
West South Central
+5.1% and above
East South Central
.01% to +5.0%Decline No Plants No Change

YEARBOOK 201337CEMENT SUPPLY
Table 35Cement Imports(Thousands of Metric Tons)
Percent Share of Consumption
Finished U.S. Cement FinishedYear Clinker Cement Total Consumption ¹ Clinker Cement Total
1992 1,566 4,593 6,159 76,107 2.1 6.0 8.11993 1,508 5,552 7,056 79,643 1.9 7.0 8.91994 2,208 9,095 11,302 85,496 2.6 10.6 13.21995 2,858 10,990 13,848 86,269 3.3 12.7 16.11996 2,548 11,606 14,154 91,212 2.8 12.7 15.51997 3,027 14,569 17,596 96,354 3.1 15.1 18.31998 4,134 19,952 24,085 103,255 4.0 19.3 23.31999 4,570 24,781 29,321 108,427 4.2 22.9 27.02000 3,760 24,923 28,684 109,528 3.4 22.8 26.22001 1,782 24,079 25,861 113,801 1.6 21.2 22.72002 1,603 22,567 24,169 109,387 1.5 20.6 22.12003 1,838 21,403 23,241 113,494 1.6 18.9 20.52004 1,630 25,675 27,305 121,273 1.3 21.2 22.52005 2,941 30,711 33,652 128,035 2.3 24.0 26.32006 3,425 32,471 35,896 127,251 2.7 25.5 28.22007 990 21,739 22,729 114,622 0.9 19.0 19.82008 621 10,898 11,519 96,658 0.6 11.3 11.92009 556 6,338 6,894 70,566 0.8 9.0 9.82010 613 6,168 6,781 70,326 0.9 8.8 9.62011 606 5,937 6,543 72,128 0.8 8.2 9.12012 786 7,037 7,037 78,460 1.0 9.0 9.0
1 Port land and M asonry. Excludes AK, HI and Puerto RicoSource: U.S. Department of Commerce - Foreign Trade Division, U.S. Geological Survey
0
5000
10000
15000
20000
25000
30000
35000
40000
1992 1996 2000 2004 2008 2012
Total Imports(Thousands of Metric Tons)
0
5
10
15
20
25
30
1992 1996 2000 2004 2008 2012
U.S. Import Share of Consumption(Percent)

YEARBOOK 201338CEMENT SUPPLY
Table 36U.S. Cement and Clinker Imports By Port - Top Customs Districts(Thousands of Metric Tons)
2002 2003 2004 2005 2006 2007 2008 2009 2010 2011 2012Detroit 1,343 1,625 1,419 1,317 1,214 1,021 838 841 939 947 1,114Seattle 1,360 1,335 1,654 1,489 1,619 1,788 1,243 783 916 1,053 1,036Houston/Galvesto 2,137 2,025 1,969 2,619 3,371 3,350 1,876 793 612 699 813Buffalo 642 711 807 823 832 809 708 574 590 555 572Cleveland 744 698 699 792 932 766 485 494 555 488 538Columbia-Snake 516 537 655 867 1,032 1,194 788 292 332 343 335Honolulu 318 314 417 428 495 477 383 276 277 290 315Pembina 217 239 181 178 122 150 173 162 167 191 281New York City 1,192 941 839 1,265 1,207 933 291 214 213 25 276Miami 1,743 2,067 2,294 2,265 2,186 1,046 375 185 147 170 248Ogdensburg 306 361 384 336 418 460 399 248 174 184 205Philadelphia 139 239 410 494 605 316 187 140 141 158 190All Others 13,514 12,150 15,549 20,780 21,863 10,420 3,774 1,892 1,717 1,440 1,115
Total U.S. 24,169 23,241 27,305 33,652 35,896 22,729 11,519 6,894 6,781 6,543 7,037Source: U.S. Department of Commerce - Foreign Trade Division
Table 37
U.S. Cement and Clinker Imports - Country of Origin(Thousands of Metric Tons)
2002 2003 2004 2005 2006 2007 2008 2009 2010 2011 2012Canada 5,181 5,601 5,753 5,404 5,059 5,326 4,104 3,426 3,410 3,416 3,709Korea 1,625 1,745 1,729 2,672 2,745 2,686 1,283 882 1,045 1,402 1,280Greece 1,785 1,188 2,011 2,786 1,950 703 213 186 191 0 609China 2,280 2,228 3,215 4,726 10,620 5,377 2,098 608 688 578 375Mexico 1,228 891 1,439 2,185 2,276 1,700 1,088 380 382 368 316Spain 327 355 412 236 69 29 0 81 109 106 163Sweden 1,047 924 1,058 1,050 889 457 261 74 83 81 132Denmark 333 433 373 439 296 239 99 69 54 74 96Columbia 1,579 1,766 2,123 1,849 1,874 1,555 969 659 322 229 87Francy 85 90 79 74 97 111 108 65 91 72 85Egypt 0 0 0 569 275 95 57 55 44 71 84Taiwan 0 0 0 1,759 2,180 2,168 855 254 232 65 39Croatia 0 0 0 34 29 26 34 15 24 33 24Thailand 4,259 3,344 2,808 2,893 3,798 730 77 21 16 11 13Other 4,440 4,678 6,304 6,975 3,737 1,528 273 118 91 36 27
Total U.S. 24,169 23,241 27,305 33,652 35,896 22,729 11,519 6,894 6,781 6,543 7,037Source: U.S. Department of Commerce - Foreign Trade Division
YEARBOOK 201339CEMENT SUPPLY
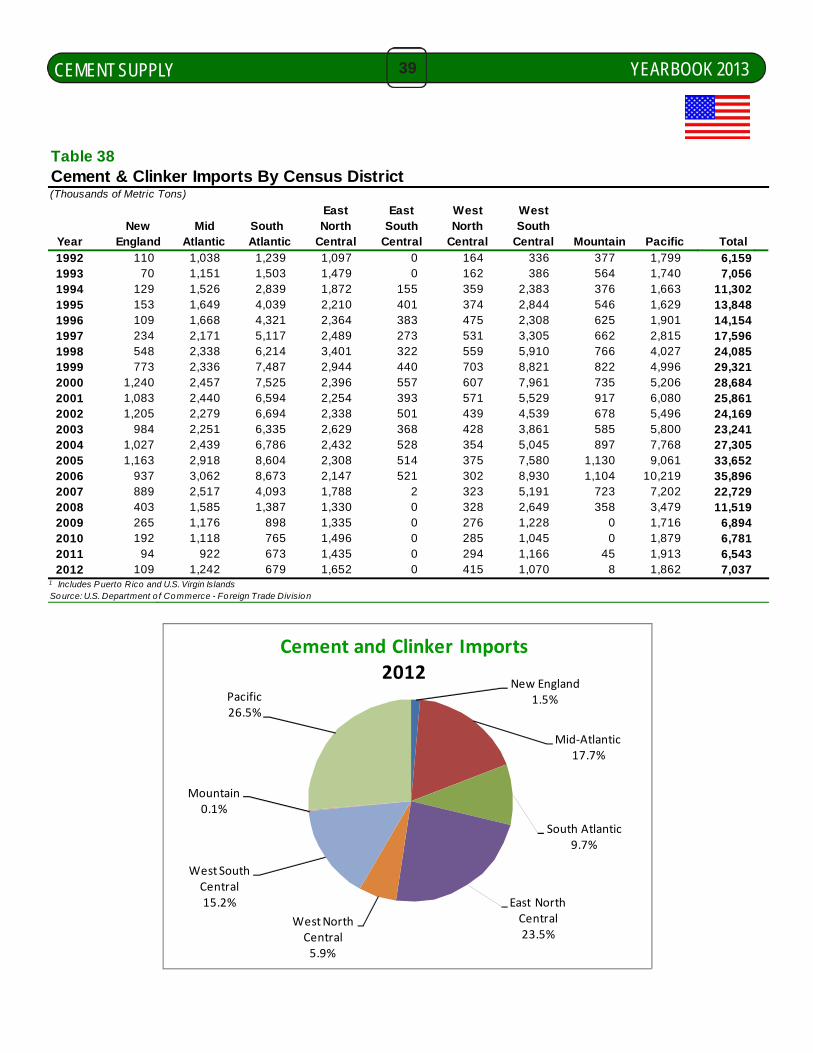
Table 38Cement & Clinker Imports By Census District(Thousands of Metric Tons)
East East West WestNew Mid South North South North South
Year England Atlantic Atlantic Central Central Central Central Mountain Pacific Total
1992 110 1,038 1,239 1,097 0 164 336 377 1,799 6,1591993 70 1,151 1,503 1,479 0 162 386 564 1,740 7,0561994 129 1,526 2,839 1,872 155 359 2,383 376 1,663 11,3021995 153 1,649 4,039 2,210 401 374 2,844 546 1,629 13,8481996 109 1,668 4,321 2,364 383 475 2,308 625 1,901 14,1541997 234 2,171 5,117 2,489 273 531 3,305 662 2,815 17,5961998 548 2,338 6,214 3,401 322 559 5,910 766 4,027 24,0851999 773 2,336 7,487 2,944 440 703 8,821 822 4,996 29,3212000 1,240 2,457 7,525 2,396 557 607 7,961 735 5,206 28,6842001 1,083 2,440 6,594 2,254 393 571 5,529 917 6,080 25,8612002 1,205 2,279 6,694 2,338 501 439 4,539 678 5,496 24,1692003 984 2,251 6,335 2,629 368 428 3,861 585 5,800 23,2412004 1,027 2,439 6,786 2,432 528 354 5,045 897 7,768 27,3052005 1,163 2,918 8,604 2,308 514 375 7,580 1,130 9,061 33,6522006 937 3,062 8,673 2,147 521 302 8,930 1,104 10,219 35,8962007 889 2,517 4,093 1,788 2 323 5,191 723 7,202 22,7292008 403 1,585 1,387 1,330 0 328 2,649 358 3,479 11,5192009 265 1,176 898 1,335 0 276 1,228 0 1,716 6,8942010 192 1,118 765 1,496 0 285 1,045 0 1,879 6,7812011 94 922 673 1,435 0 294 1,166 45 1,913 6,5432012 109 1,242 679 1,652 0 415 1,070 8 1,862 7,037
1 Includes Puerto Rico and U.S. Virgin IslandsSource: U.S. Department o f Commerce - Fo reign Trade Division
New England1.5%
Mid‐Atlantic17.7%
South Atlantic9.7%
East North Central23.5%
West North Central5.9%
West South Central15.2%
Mountain0.1%
Pacific26.5%
Cement and Clinker Imports2012
YEARBOOK 201340CEMENT SUPPLY
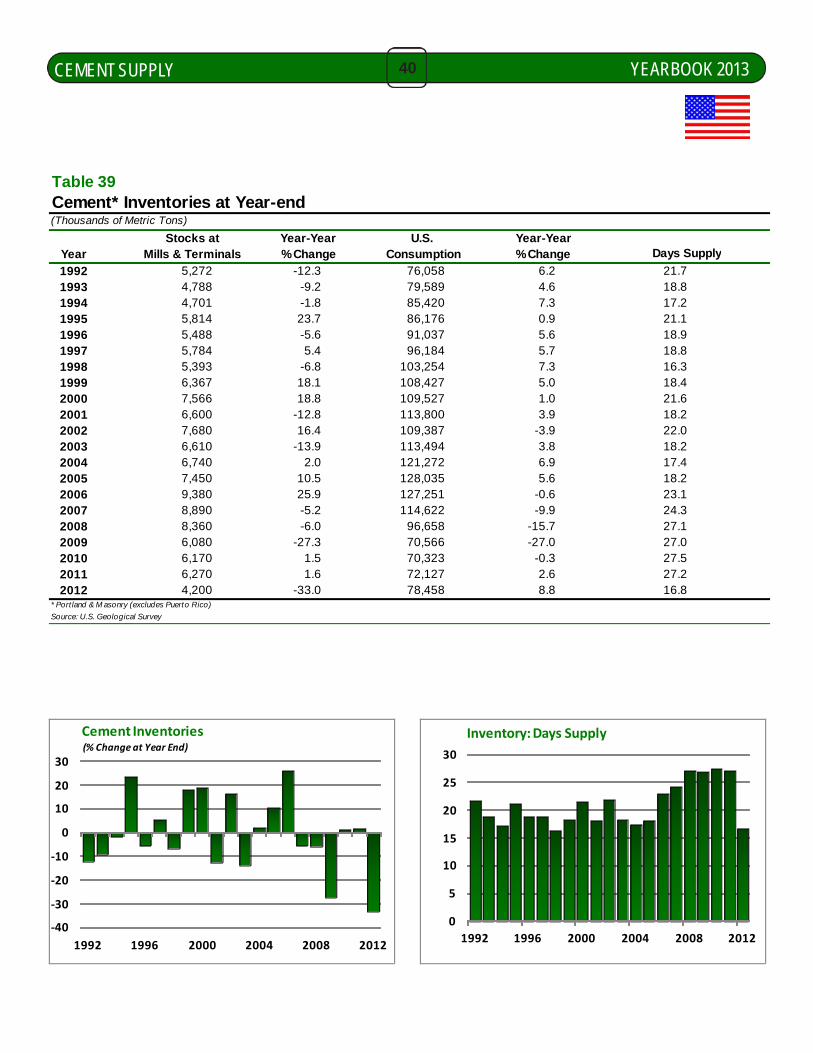
Table 39Cement* Inventories at Year-end(Thousands of Metric Tons)
Stocks at Year-Year U.S. Year-YearYear Mills & Terminals % Change Consumption % Change
1992 5,272 -12.3 76,058 6.2 21.71993 4,788 -9.2 79,589 4.6 18.81994 4,701 -1.8 85,420 7.3 17.21995 5,814 23.7 86,176 0.9 21.11996 5,488 -5.6 91,037 5.6 18.91997 5,784 5.4 96,184 5.7 18.81998 5,393 -6.8 103,254 7.3 16.31999 6,367 18.1 108,427 5.0 18.42000 7,566 18.8 109,527 1.0 21.62001 6,600 -12.8 113,800 3.9 18.22002 7,680 16.4 109,387 -3.9 22.02003 6,610 -13.9 113,494 3.8 18.22004 6,740 2.0 121,272 6.9 17.42005 7,450 10.5 128,035 5.6 18.22006 9,380 25.9 127,251 -0.6 23.12007 8,890 -5.2 114,622 -9.9 24.32008 8,360 -6.0 96,658 -15.7 27.12009 6,080 -27.3 70,566 -27.0 27.02010 6,170 1.5 70,323 -0.3 27.52011 6,270 1.6 72,127 2.6 27.22012 4,200 -33.0 78,458 8.8 16.8
* Port land & M asonry (excludes Puerto Rico)
Source: U.S. Geological Survey
Days Supply
‐40
‐30
‐20
‐10
0
10
20
30
1992 1996 2000 2004 2008 2012
Cement Inventories(% Change at Year End)
0
5
10
15
20
25
30
1992 1996 2000 2004 2008 2012
Inventory: Days Supply

YEARBOOK 201341OPERATING CHARACTERISTICS
Table 40Portland Cement Shipments by Type of Customer*(Thousands of Metric Tons)
2009 2010 2011
Quantity % of Total Quantity % of Total Quantity % of TotalReady-Mix Concrete 49,100 71.3 47,300 69.2 49,100 69.8Concrete Product Manufacturers 8,570 12.4 7,980 11.7 8,040 11.4Contractors 6,140 8.9 6,920 10.1 6,160 8.8Building Material Dealers 2,210 3.2 2,480 3.6 2,430 3.5Oil Well, Mining, and Waste 1,780 2.6 2,560 3.7 3,160 4.5Government & Misc. 1,120 1.6 1,240 1.8 1,370 1.9
Total Shipments 68,900 68,400 70,300
* Includes imported cement and cement made from imported clinker. Excludes Puerto Rico.Source: U.S. Geological Survey
Table 41Portland Cement Shipped from U.S. Plants by Type of Product(Thousands of Metric Tons)
2009 2010 2011
Quantity % of Total Quantity % of Total Quantity % of TotalGeneral Use and Moderate Heat 54,900 79.7 53,500 78.2 54,500 77.5 (Types I and II)High-Early Strength (Type III) 2,460 3.6 2,590 3.8 2,550 3.6Sulfate-Resisting (Type V) 8,610 12.5 8,630 12.6 9,340 13.3Block 167 0.2 154 0.2 147 0.2Oil Well 846 1.2 1,300 1.9 1,750 2.5White 577 0.8 638 0.9 635 0.9Blended Portland Slag and Pozzolan 614 0.9 1,001 1.5 742 1.1 Portland Fly Ash and Other 682 1.0 567 0.8 593 0.8Miscellaneous 27 0.0 30 0.0 26 0.0
Total Shipments 68,900 68,400 70,300
* Includes sales o f imported cement. Excludes Puerto Rico.Source: U.S. Geological Survey
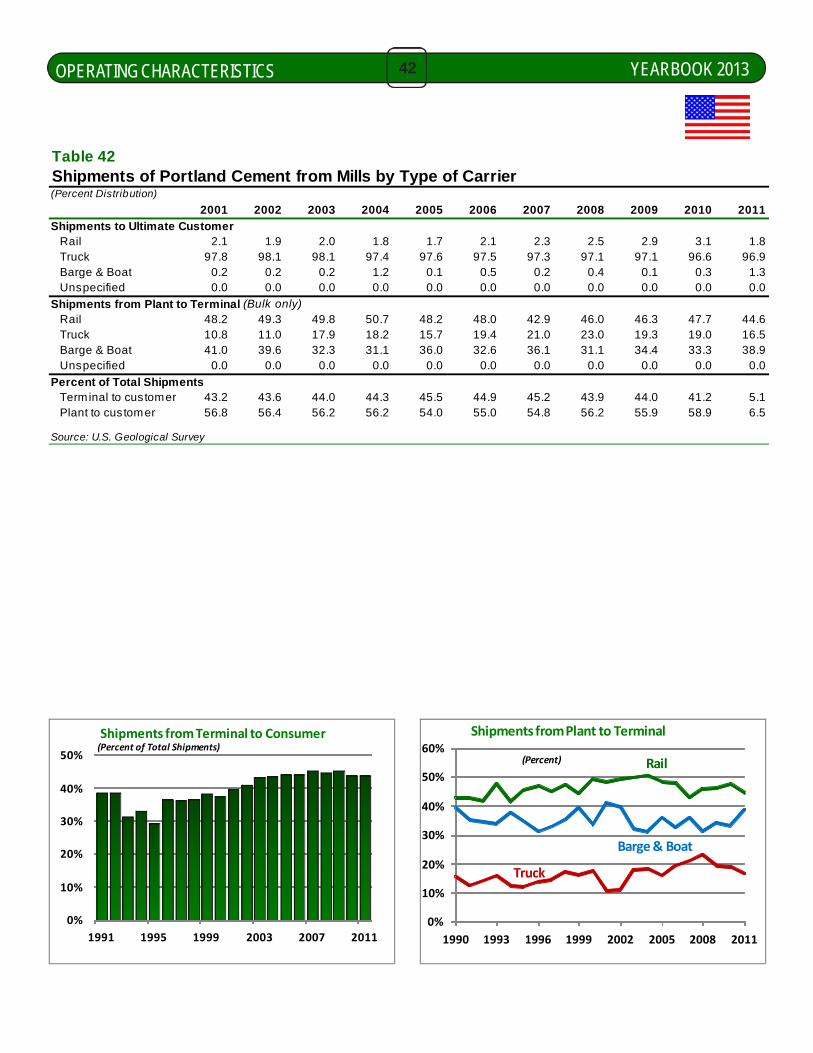
YEARBOOK 201342OPERATING CHARACTERISTICS
Table 42Shipments of Portland Cement from Mills by Type of Carrier(Percent Distribution)
2001 2002 2003 2004 2005 2006 2007 2008 2009 2010 2011
Shipments to Ultimate Customer Rail 2.1 1.9 2.0 1.8 1.7 2.1 2.3 2.5 2.9 3.1 1.8 Truck 97.8 98.1 98.1 97.4 97.6 97.5 97.3 97.1 97.1 96.6 96.9 Barge & Boat 0.2 0.2 0.2 1.2 0.1 0.5 0.2 0.4 0.1 0.3 1.3 Unspecified 0.0 0.0 0.0 0.0 0.0 0.0 0.0 0.0 0.0 0.0 0.0
Shipments from Plant to Terminal (Bulk only) Rail 48.2 49.3 49.8 50.7 48.2 48.0 42.9 46.0 46.3 47.7 44.6 Truck 10.8 11.0 17.9 18.2 15.7 19.4 21.0 23.0 19.3 19.0 16.5 Barge & Boat 41.0 39.6 32.3 31.1 36.0 32.6 36.1 31.1 34.4 33.3 38.9 Unspecified 0.0 0.0 0.0 0.0 0.0 0.0 0.0 0.0 0.0 0.0 0.0
Percent of Total Shipments Terminal to customer 43.2 43.6 44.0 44.3 45.5 44.9 45.2 43.9 44.0 41.2 5.1 Plant to customer 56.8 56.4 56.2 56.2 54.0 55.0 54.8 56.2 55.9 58.9 6.5
Source: U.S. Geological Survey
0%
10%
20%
30%
40%
50%
1991 1995 1999 2003 2007 2011
Shipments from Terminal to Consumer(Percent of Total Shipments)
0%
10%
20%
30%
40%
50%
60%
1990 1993 1996 1999 2002 2005 2008 2011
Shipments from Plant to Terminal
Rail
Barge & Boat
Truck
(Percent)

YEARBOOK 201343OPERATING CHARACTERISTICS
0.0
1.0
2.0
3.0
4.0
5.0
6.0
1991 1995 1999 2003 2007 2011
Energy Resources(Million BTU per 000 Tons Produced)
60%
62%
64%
66%
68%70%
72%
74%
76%
78%
1991 1995 1999 2003 2007 2011
U.S. Plants ‐ Energy Consumption(Coal and Coke)
Table 43Summary of Energy Consumption(Thousands of BTUs per Equivalent Metric Ton*)
1972 2007 2008 2009 2010 2011 2012¹ 11/72 11/10Gasoline 7.4 2.8 5.4 5.3 4.6 1.5 - -79.7 -67.4Middle Distillates** 88.3 36.5 41.7 44.1 40.1 42.7 - -51.6 6.5 Diesel - - - - - 32.0 - - - Fuel Oil - - - - - 10.7 - - -Residual oil 808.9 4.2 4.2 9.6 8.6 - - - -LPG 1.4 0.8 0.7 0.8 0.8 0.6 - -57.1 -25.0
Total Petroleum Products 906.0 44.3 52.0 59.8 54.1 44.8 - -95.1 -17.2Natural gas 3,347.1 140.9 120.1 170.3 129.9 173.5 - -94.8 33.6Coal 2,639.0 2,668.9 2,601.3 2,410.5 2,382.3 2,456.8 - -6.9 3.1Petroleum Coke 39.6 888.3 846.4 761.3 769.9 666.3 - 1,582.6 -13.5
Total Coal and Coke 2,678.6 3,557.2 3,447.7 3,171.8 3,152.2 3,123.1 - 16.6 -0.9Alternative Fuel ‐ 438.3 495.2 578.6 592.3 612.9 ‐ ‐ 3.5
Total Fossil Fuels 6,931.7 4,180.7 4,115.0 3,980.5 3,928.5 3,953.9 - -43.0 0.6Electricity 488.6 522.6 526.1 554.4 538.3 512.0 - 4.8 -4.9
Total Fuel and Power 7,420.3 4,703.3 4,641.1 4,534.9 4,466.8 4,465.9 - -39.8 0.0* Equivalent Metric Ton = weighted average of 92% clinker production plus 8% finished cement production
**Collection of Diesel and Fuel Oil individually commenced in 2011 1Data to be released 4Q 2013Source: PCA U.S. and Canadian Labor-Energy Input Survey
% Change
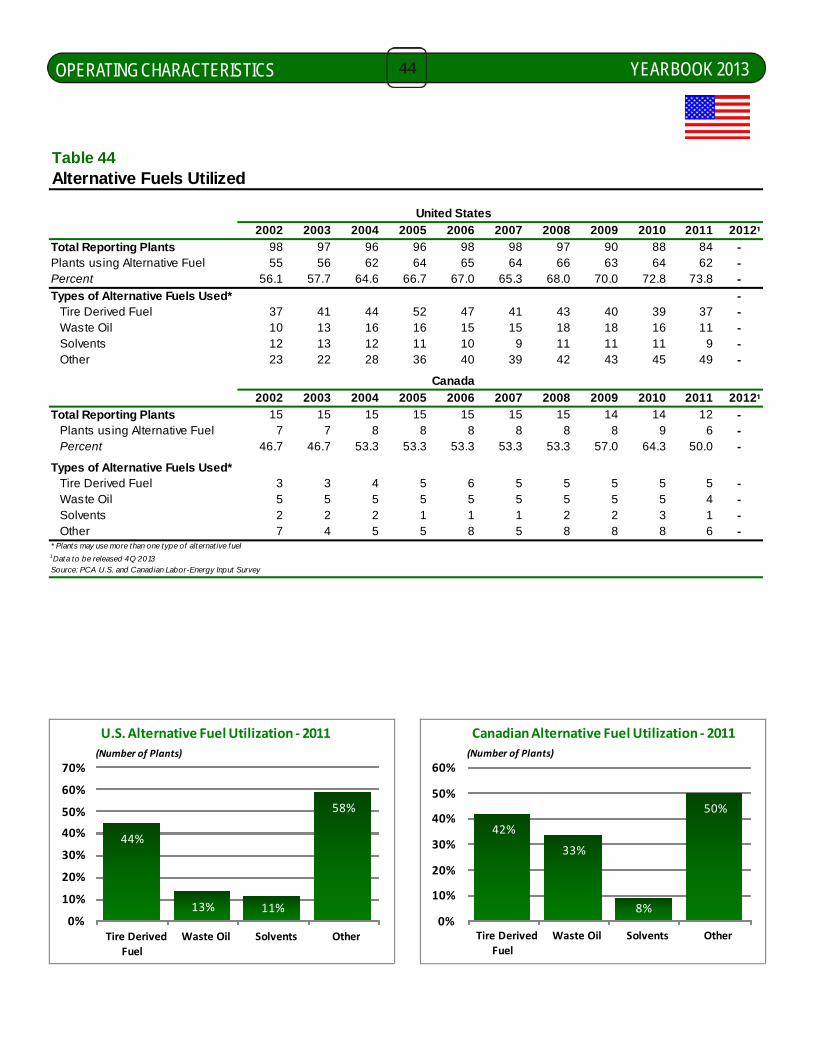
YEARBOOK 201344OPERATING CHARACTERISTICS
44%
13% 11%
58%
0%
10%
20%
30%
40%
50%
60%
70%
Tire Derived Fuel
Waste Oil Solvents Other
U.S. Alternative Fuel Utilization ‐ 2011
(Number of Plants)
42%
33%
8%
50%
0%
10%
20%
30%
40%
50%
60%
Tire Derived Fuel
Waste Oil Solvents Other
Canadian Alternative Fuel Utilization ‐ 2011
(Number of Plants)
Table 44Alternative Fuels Utilized
United States
2002 2003 2004 2005 2006 2007 2008 2009 2010 2011 2012¹Total Reporting Plants 98 97 96 96 98 98 97 90 88 84 -Plants using Alternative Fuel 55 56 62 64 65 64 66 63 64 62 -Percent 56.1 57.7 64.6 66.7 67.0 65.3 68.0 70.0 72.8 73.8 -
Types of Alternative Fuels Used* - Tire Derived Fuel 37 41 44 52 47 41 43 40 39 37 - Waste Oil 10 13 16 16 15 15 18 18 16 11 - Solvents 12 13 12 11 10 9 11 11 11 9 - Other 23 22 28 36 40 39 42 43 45 49 -
Canada
2002 2003 2004 2005 2006 2007 2008 2009 2010 2011 2012¹Total Reporting Plants 15 15 15 15 15 15 15 14 14 12 - Plants using Alternative Fuel 7 7 8 8 8 8 8 8 9 6 - Percent 46.7 46.7 53.3 53.3 53.3 53.3 53.3 57.0 64.3 50.0 -
Types of Alternative Fuels Used* Tire Derived Fuel 3 3 4 5 6 5 5 5 5 5 - Waste Oil 5 5 5 5 5 5 5 5 5 4 - Solvents 2 2 2 1 1 1 2 2 3 1 - Other 7 4 5 5 8 5 8 8 8 6 -* Plants may use more than one type of alternative fuel1Data to be released 4Q 2013Source: PCA U.S. and Canadian Labor-Energy Input Survey

YEARBOOK 201345OPERATING CHARACTERISTICS
T ab le 4 5Fossil Fuel Mix(% D is tr ib u tion of BT Us C ons um ed)
1 9 7 2 2 0 0 4 2 0 0 5 2 0 0 6 2 0 0 7 2 0 0 8 2 0 0 9 2 0 1 0 2 0 1 1 2 0 1 2 ¹
C o a l a n d C o ke 3 6 .1 7 5 .9 7 5 .4 7 5 .7 7 5 .6 7 4 .3 6 9 .9 7 0 .6 6 9 .9 -N a tu ra l G a s 4 5 .1 3 .1 3 .6 3 .3 3 .0 2 .6 3 .8 2 .9 3 .9 -P e tro le u m P ro d u cts 1 2 .2 0 .9 0 .8 0 .9 0 .9 1 .1 1 .3 1 .2 1 .0 -E le c tric ity 6 .6 1 0 .7 1 1 .0 1 1 .1 1 1 .1 1 1 .3 1 2 .8 1 2 .1 1 1 .5 -Alte rn a tive Fu e ls 0 .0 9 .4 9 .2 9 .0 9 .4 1 0 .7 1 2 .2 1 2 .2 1 3 .7 -
Tota l Fue l 1 0 0 1 0 0 1 0 0 1 0 0 1 0 0 1 0 0 1 0 0 1 0 0 1 0 0 -1D at a t o b e released 4 Q 2 0 13
So urce: PC A U .S. and C anad ian Lab o r -Energ y Inp ut Survey
Table 46Energy Consumption by Process(Thousands of BTUs per Equivalent Metric Ton*)
% Change
1972 2003 2004 2005 2006 2007 2008 2009 2010 2011 2012¹ 11/72 11/10
Fuel and ElectricityAll Plants 7,438 4,763 4,755 4,699 4,649 4,703 4,641 4,535 4,467 4,466 - -40 0Wet-Process Plants 7,998 6,647 6,807 6,387 6,464 6,485 6,448 6,359 6,714 7,042 - -12 5Dry-Process Plants 6,895 4,434 4,407 4,433 4,375 4,434 4,384 4,383 4,318 4,317 - -37 0
FuelAll Plants 6,931 4,240 4,245 4,180 4,131 4,181 4,115 3,980 3,928 3,954 - -43 1Wet-Process Plants 7,498 6,135 6,291 5,879 5,949 5,979 5,935 5,823 6,196 6,561 - -12 6Dry-Process Plants 6,393 3,909 3,899 3,913 3,856 3,909 3,856 3,827 3,779 3,804 - -40 1
Electricity (kWh per Equivalent Metric Ton)All Plants 143 153 149 152 152 153 155 162 158 150 - 5 -5Wet-Process Plants 142 150 151 149 151 148 150 157 152 141 - -1 -7Dry-Process Plants 142 154 149 153 152 154 156 163 158 151 - 6 -4*Equivalent Metric Ton = weighted average of 92% clinker production plus 8% finished cement production
1Data to be released 4Q 2013
Source: PCA U.S. and Canadian Labor-Energy Input Survey
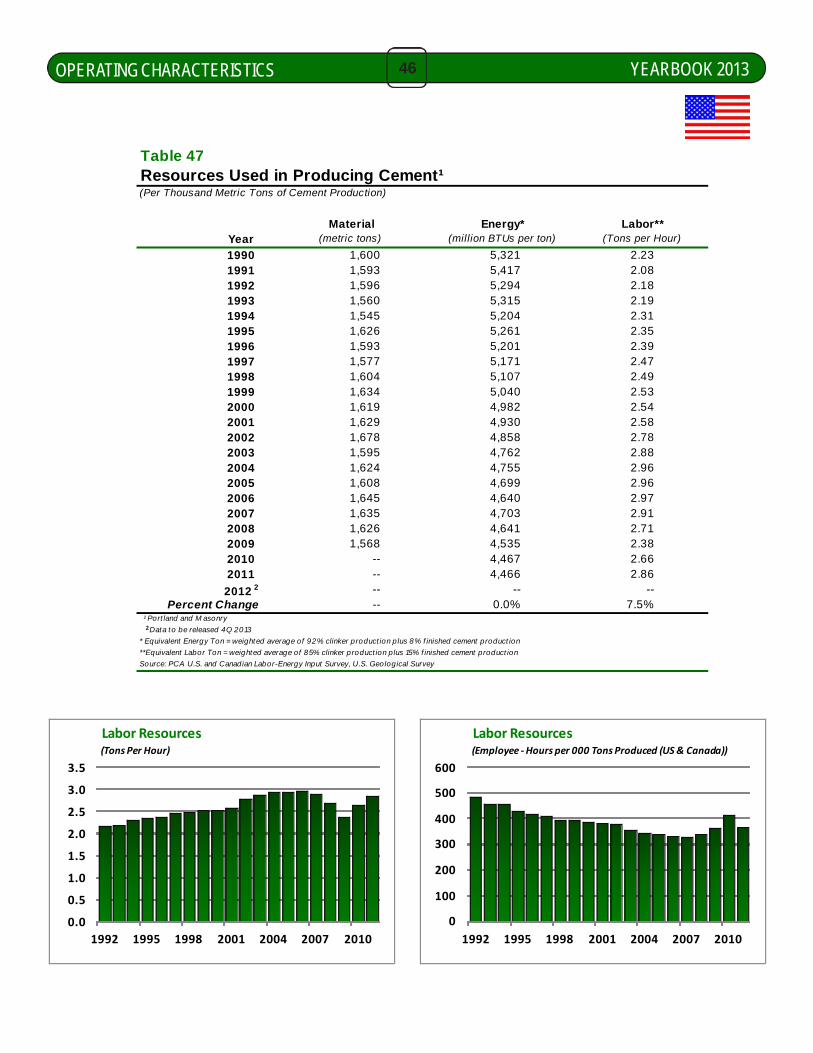
YEARBOOK 201346OPERATING CHARACTERISTICS
0.0
0.5
1.0
1.5
2.0
2.5
3.0
3.5
1992 1995 1998 2001 2004 2007 2010
Labor Resources(Tons Per Hour)
0
100
200
300
400
500
600
1992 1995 1998 2001 2004 2007 2010
Labor Resources(Employee ‐Hours per 000 Tons Produced (US & Canada))
Table 47Resources Used in Producing Cement¹(Per Thousand Metric Tons of Cement Production)
Material Energy* Labor**Year (metric tons) (million BTUs per ton) (Tons per Hour)
1990 1,600 5,321 2.231991 1,593 5,417 2.081992 1,596 5,294 2.181993 1,560 5,315 2.191994 1,545 5,204 2.311995 1,626 5,261 2.351996 1,593 5,201 2.391997 1,577 5,171 2.471998 1,604 5,107 2.491999 1,634 5,040 2.532000 1,619 4,982 2.542001 1,629 4,930 2.582002 1,678 4,858 2.782003 1,595 4,762 2.882004 1,624 4,755 2.962005 1,608 4,699 2.962006 1,645 4,640 2.972007 1,635 4,703 2.912008 1,626 4,641 2.712009 1,568 4,535 2.382010 -- 4,467 2.662011 -- 4,466 2.86
2012 2 -- -- -- Percent Change -- 0.0% 7.5%
¹ Port land and M asonry
²Data to be released 4Q 2013
* Equivalent Energy Ton = weighted average of 92% clinker product ion p lus 8% f inished cement product ion
**Equivalent Labor Ton = weighted average of 85% clinker product ion plus 15% f inished cement product ion
Source: PCA U.S. and Canadian Labor-Energy Input Survey, U.S. Geological Survey

YEARBOOK 201347OPERATING CHARACTERISTICS
Table 48U.S. Cement Industry Employment(Thousands)
Cement * Cement*Year All Employees Production Workers per Employee per Production Worker
1970 28.80 24.30 2.38 2.821975 28.70 22.80 2.21 2.781980 30.40 24.20 2.29 2.881985 21.20 15.90 3.95 5.261988 18.60 14.20 4.51 5.911989 16.90 13.00 4.86 6.321990 17.29 13.40 4.67 6.031991 16.88 12.20 4.24 5.871992 16.44 12.80 4.63 5.941993 16.40 12.50 4.85 6.371994 16.53 12.40 5.17 6.891995 16.43 12.60 5.24 6.841996 16.24 12.50 5.60 7.281997 16.20 12.50 5.94 7.691998 16.51 12.71 6.26 8.121999 16.67 12.85 6.51 8.442000 16.88 12.73 6.49 8.602001 16.82 12.73 6.76 8.942002 16.44 13.18 6.65 8.302003 16.46 12.97 6.90 8.752004 16.24 12.77 7.47 9.502005 16.86 12.68 7.60 10.102006 17.01 13.22 7.48 9.632007 17.48 13.37 6.56 8.572008 17.29 13.69 5.59 7.062009 15.44 10.81 4.57 6.532010 13.65 9.55 5.15 7.362011 13.47 9.11 5.36 7.92
* Port land + M asonry
Source: Annual Survey of M anufacturers/U.S. Census (NAICS 327310)
Table 49U.S. Cement Industry Financial Statistics(Median Results Cement Operations)
2005 2006 2007 2008 2009 2010 2011 2012Gross Margin (%) 25.5 31.4 32.1 24.7 15.8 8.5 6.7 10.5 14.3Operating Profit (%) 20.9 25.9 25.0 19.9 10.6 1.1 -3.7 5.2 7.2Operating Profit ($/ton) 18.00 26.50 26.40 20.30 10.20 1.00 -3.30 4.50 7.50Annual Capital Expenditures (% of sales) 9.3 7.2 8.2 8.0 7.4 4.2 3.9 6.2 6.7Source: PCA Financial Benchmarking Survey
2012
IndustryTotal

YEARBOOK 201348OPERATING CHARACTERISTICS
Table 50Cement Industry Operating Statistics
2000 2001 2002 2003 2004 2005 2006 2007 2008 2009 2010 2011
Value of Shipments ($ Billion) 7.16 7.57 7.41 7.78 8.72 9.25 10.34 10.67 9.25 5.75 5.21 5.34
LaborEmployment (000) 17.2 17.2 17.7 17.4 16.9 16.7 17.1 17.9 18.2 14.3 13.0 12.4Payroll ($ Million) 829.5 860.5 890.5 902.4 930.2 956.2 978.6 1081.0 1108.0 861.1 813.2 767.4
Energy ($ Million)Purchased Fuel & Power 999.7 1079.9 1114.9 1160.5 1257.1 1425.3 1608.8 1677.0 1668.5 1046.3 1098.8 1144.3 Fuel 507.7 532.2 565.9 570.3 626.2 723.2 841.3 870.3 869.1 520.9 556.7 619.2 Power 492.0 547.7 549.0 590.2 630.9 702.1 767.5 806.7 799.4 525.4 542.1 525.1NonEnergy Material 1590.0 1644.6 1806.3 1819.7 1855.5 1952.1 2146.8 2414.8 2223.3 1085.4 1326.6 1098.2
Investment ($ Million)New Capital Expenditures 1108.0 1430.0 1404.4 792.7 602.4 783.6 966.1 1347.2 1281.1 1076.1 790.3 293.4 Buildings 287.7 236.1 184.5 180.9 67.7 95.7 86.7 96.7 129.3 39.0 52.7 45.6 Equipment 820.3 1193.9 1116.4 611.8 534.8 687.9 879.4 1250.6 1151.8 1037.1 737.7 247.8
Key Ratios - Percent of Shipments (%)Payroll 11.6 11.4 12.0 11.6 10.7 10.3 9.5 10.1 11.9 14.9 15.6 14.4Purchased Fuel and Power 14.0 14.3 15.1 14.9 14.4 15.4 15.6 15.7 18.0 18.2 21.1 21.4NonEnergy Materials 22.2 21.7 24.4 23.4 21.3 21.1 20.8 22.6 24.0 18.9 25.5 20.6Source: Annual Survey of Manufacturers
0.0
0.2
0.4
0.6
0.8
1.0
1.2
1.4
1.6
1997 1999 2001 2003 2005 2007 2009 2011
U.S. Cement Industry ‐ Capital Expenditures (Billion $)
0
2
4
6
8
10
12
1997 1999 2001 2003 2005 2007 2009 2011
Value of Industry Shipments(Billion $)
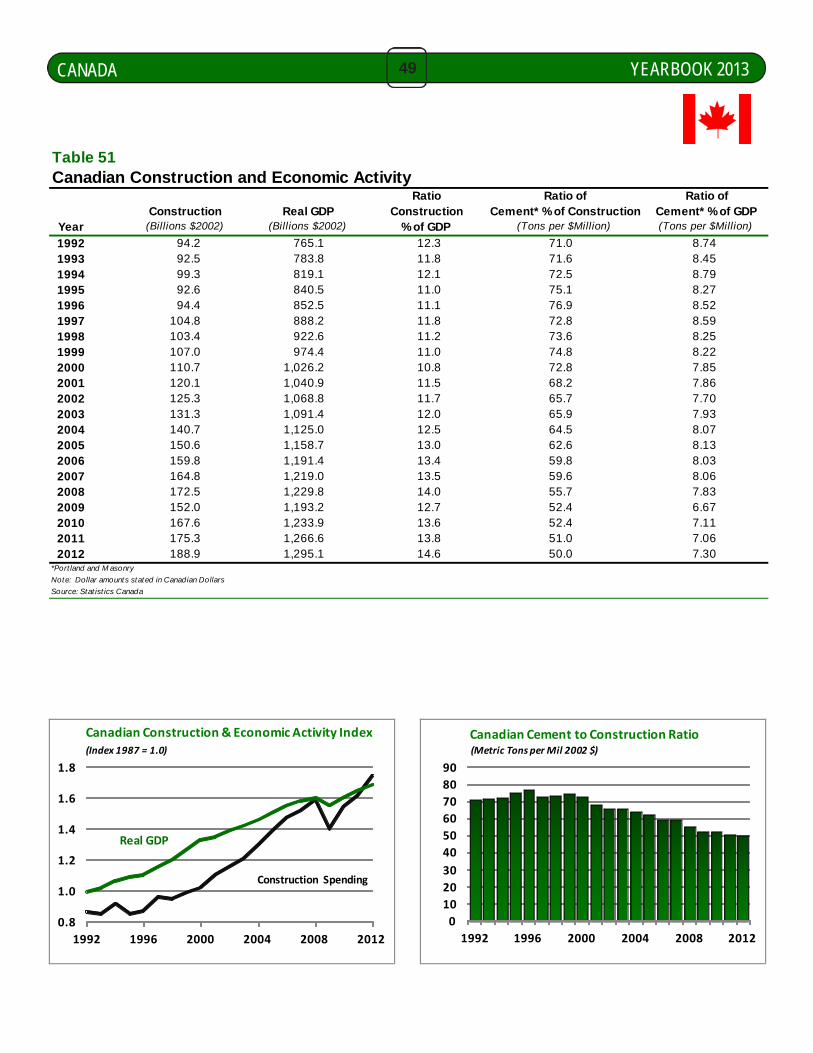
YEARBOOK 201349CANADA
Table 51Canadian Construction and Economic Activity
Ratio Ratio of Ratio ofConstruction Real GDP Construction Cement* % of Construction Cement* % of GDP
Year (Billions $2002) (Billions $2002) % of GDP (Tons per $Million) (Tons per $Million)
1992 94.2 765.1 12.3 71.0 8.741993 92.5 783.8 11.8 71.6 8.451994 99.3 819.1 12.1 72.5 8.791995 92.6 840.5 11.0 75.1 8.271996 94.4 852.5 11.1 76.9 8.521997 104.8 888.2 11.8 72.8 8.591998 103.4 922.6 11.2 73.6 8.251999 107.0 974.4 11.0 74.8 8.222000 110.7 1,026.2 10.8 72.8 7.852001 120.1 1,040.9 11.5 68.2 7.862002 125.3 1,068.8 11.7 65.7 7.702003 131.3 1,091.4 12.0 65.9 7.932004 140.7 1,125.0 12.5 64.5 8.072005 150.6 1,158.7 13.0 62.6 8.132006 159.8 1,191.4 13.4 59.8 8.032007 164.8 1,219.0 13.5 59.6 8.062008 172.5 1,229.8 14.0 55.7 7.832009 152.0 1,193.2 12.7 52.4 6.672010 167.6 1,233.9 13.6 52.4 7.112011 175.3 1,266.6 13.8 51.0 7.062012 188.9 1,295.1 14.6 50.0 7.30
*Port land and M asonry
Note: Dollar amounts stated in Canadian Dollars
Source: Stat ist ics Canada
0.8
1.0
1.2
1.4
1.6
1.8
1992 1996 2000 2004 2008 2012
Canadian Construction & Economic Activity Index
Real GDP
(Index 1987 = 1.0)
Construction Spending
Canadian Construction & Economic Activity Index
0
10
20
30
40
50
60
70
80
90
1992 1996 2000 2004 2008 2012
(Metric Tons per Mil 2002 $)
Canadian Cement to Construction Ratio
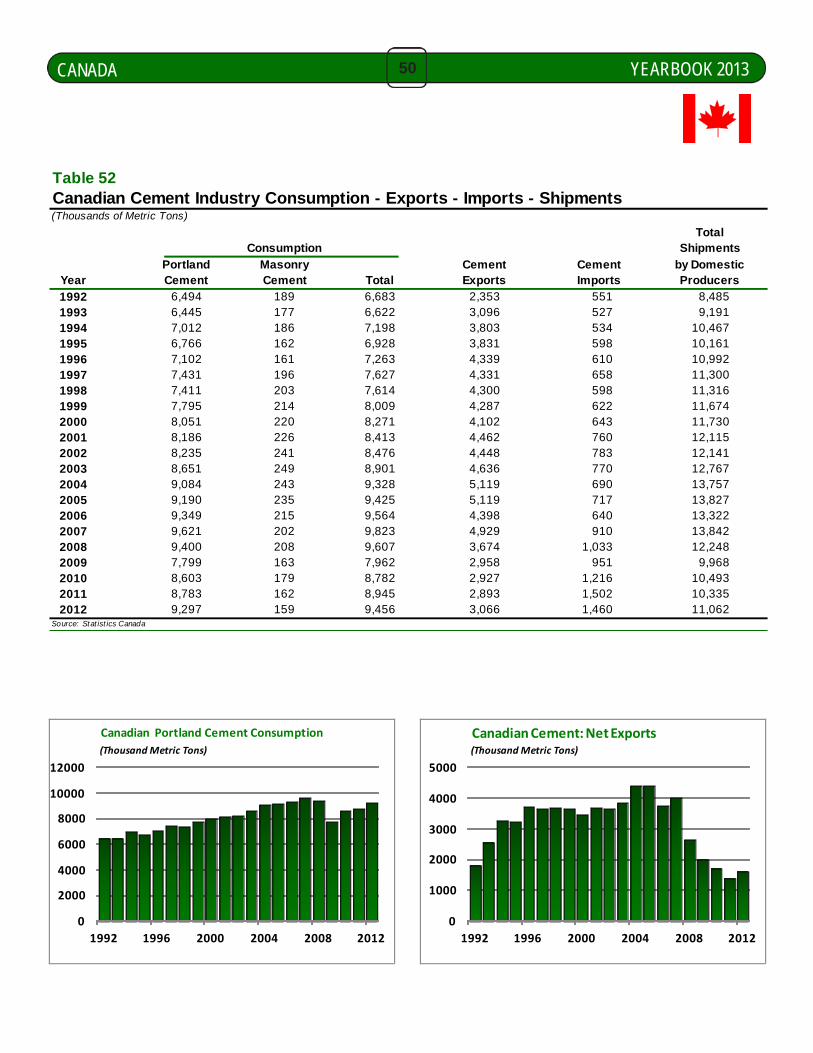
YEARBOOK 201350CANADA
Table 52Canadian Cement Industry Consumption - Exports - Imports - Shipments(Thousands of Metric Tons)
TotalConsumption Shipments
Portland Masonry Cement Cement by DomesticYear Cement Cement Total Exports Imports Producers
1992 6,494 189 6,683 2,353 551 8,4851993 6,445 177 6,622 3,096 527 9,1911994 7,012 186 7,198 3,803 534 10,4671995 6,766 162 6,928 3,831 598 10,1611996 7,102 161 7,263 4,339 610 10,9921997 7,431 196 7,627 4,331 658 11,3001998 7,411 203 7,614 4,300 598 11,3161999 7,795 214 8,009 4,287 622 11,6742000 8,051 220 8,271 4,102 643 11,7302001 8,186 226 8,413 4,462 760 12,1152002 8,235 241 8,476 4,448 783 12,1412003 8,651 249 8,901 4,636 770 12,7672004 9,084 243 9,328 5,119 690 13,7572005 9,190 235 9,425 5,119 717 13,8272006 9,349 215 9,564 4,398 640 13,3222007 9,621 202 9,823 4,929 910 13,8422008 9,400 208 9,607 3,674 1,033 12,2482009 7,799 163 7,962 2,958 951 9,9682010 8,603 179 8,782 2,927 1,216 10,4932011 8,783 162 8,945 2,893 1,502 10,3352012 9,297 159 9,456 3,066 1,460 11,062
Source: Stat ist ics Canada
0
2000
4000
6000
8000
10000
12000
1992 1996 2000 2004 2008 2012
Canadian Portland Cement Consumption
(ThousandMetric Tons)
0
1000
2000
3000
4000
5000
1992 1996 2000 2004 2008 2012
Canadian Cement: Net Exports(Thousand Metric Tons)

YEARBOOK 201351CANADA
Table 53Canadian Cement Industry Consumption - Exports - Imports - Shipments(Year-Year % Change)
TotalConsumption Shipments
Portland Masonry Cement Cement by DomesticYear Cement Cement Total Exports Imports Producers
1992 -4.1 -10.8 -4.3 -11.8 7.4 -7.11993 -0.8 -6.4 -0.9 31.6 -4.4 8.31994 8.8 4.7 8.7 22.8 1.3 13.91995 -3.5 -12.6 -3.7 0.7 12.0 -2.91996 5.0 -0.9 4.8 13.3 2.0 8.21997 4.6 22.1 5.0 -0.2 7.9 2.81998 -0.3 3.3 -0.2 -0.7 -9.1 0.11999 5.2 5.3 5.2 -0.3 4.0 3.22000 3.3 2.9 3.3 -4.3 3.4 0.52001 1.7 3.0 1.7 8.8 18.2 3.32002 0.6 6.5 0.7 -0.3 3.0 0.22003 5.1 3.3 5.0 4.2 -1.7 5.22004 5.0 -2.3 4.8 10.4 -10.4 7.82005 1.2 -3.3 1.0 0.0 3.9 0.52006 1.7 -8.5 1.5 -14.1 -10.7 -3.72007 2.9 -6.3 2.7 12.1 42.2 3.92008 -2.3 2.9 -2.2 -25.5 13.5 -11.52009 -17.0 -21.6 -17.1 -19.5 -7.9 -18.62010 10.3 10.0 10.3 -1.0 27.8 5.32011 2.1 -9.7 1.9 -1.2 23.5 -1.52012 5.9 -1.9 5.7 6.0 -2.8 7.0
Source: Stat ist ics Canada (Calculated f rom Table 52)
0
50
100
150
200
250
300
1992 1996 2000 2004 2008 2012
Canadian Masonry Cement Consumption(Thousand Metric Tons)
0.0
0.5
1.0
1.5
2.0
2.5
3.0
1992 1996 2000 2004 2008 2012
Canadian Masonry Cement Consumption(Percent Share of Total Cement Consumption)

YEARBOOK 201352CANADA
Table 54Alternative Measures of Cement Usage Intensity
Portland Portland PortlandConstruction $ Cement Consumption Cement Consumption Cement Consumption
per Capita per Capita per thousand Construction $ per Construction WorkerYear ($000) (Metric Tons) (Metric Tons) (Metric Tons)1992 3.326 0.229 0.069 9.1001993 3.230 0.225 0.070 9.3101994 3.429 0.242 0.071 9.6801995 3.163 0.231 0.073 9.3201996 3.193 0.240 0.075 10.0101997 3.508 0.249 0.071 10.3001998 3.432 0.246 0.072 10.1201999 3.525 0.257 0.073 9.9742000 3.611 0.263 0.073 9.9932001 3.878 0.264 0.068 9.5732002 4.001 0.263 0.066 9.5382003 4.157 0.274 0.066 9.5192004 4.412 0.285 0.065 9.0522005 4.675 0.285 0.061 8.7672006 4.913 0.287 0.058 8.5132007 5.010 0.293 0.058 7.6412008 5.187 0.283 0.054 7.6302009 4.515 0.232 0.051 6.7192010 4.922 0.253 0.051 7.0622011 5.090 0.255 0.050 6.9582012 5.425 0.267 0.049 7.336
Source: PCA/Stat ist ics Canada
Table 55Canadian Construction Spending(Billions $2002)
Year Total Residential Nonresidential Engineering1992 94.2 39.9 23.1 31.21993 92.5 38.6 20.8 33.11994 99.3 40.3 21.6 37.41995 92.6 34.2 20.9 37.41996 94.4 36.7 22.8 35.01997 104.8 40.9 22.9 41.01998 103.4 39.8 23.7 39.91999 107.0 41.0 26.0 40.02000 110.7 43.7 24.1 42.82001 120.1 48.1 24.9 47.12002 125.3 55.3 27.2 42.82003 131.3 58.7 26.4 46.32004 140.7 63.2 27.4 50.12005 150.6 65.3 27.0 58.32006 159.8 67.3 29.0 63.62007 164.8 69.4 28.3 67.12008 172.5 69.3 30.2 73.12009 152.0 62.7 29.2 60.12010 167.6 70.7 29.6 67.32011 175.3 71.9 29.6 73.72012 188.9 78.4 30.8 79.7
Percent Change2012 / 2011 7.8% 9.1% 3.9% 8.1%
Source: Stat ist ics Canada
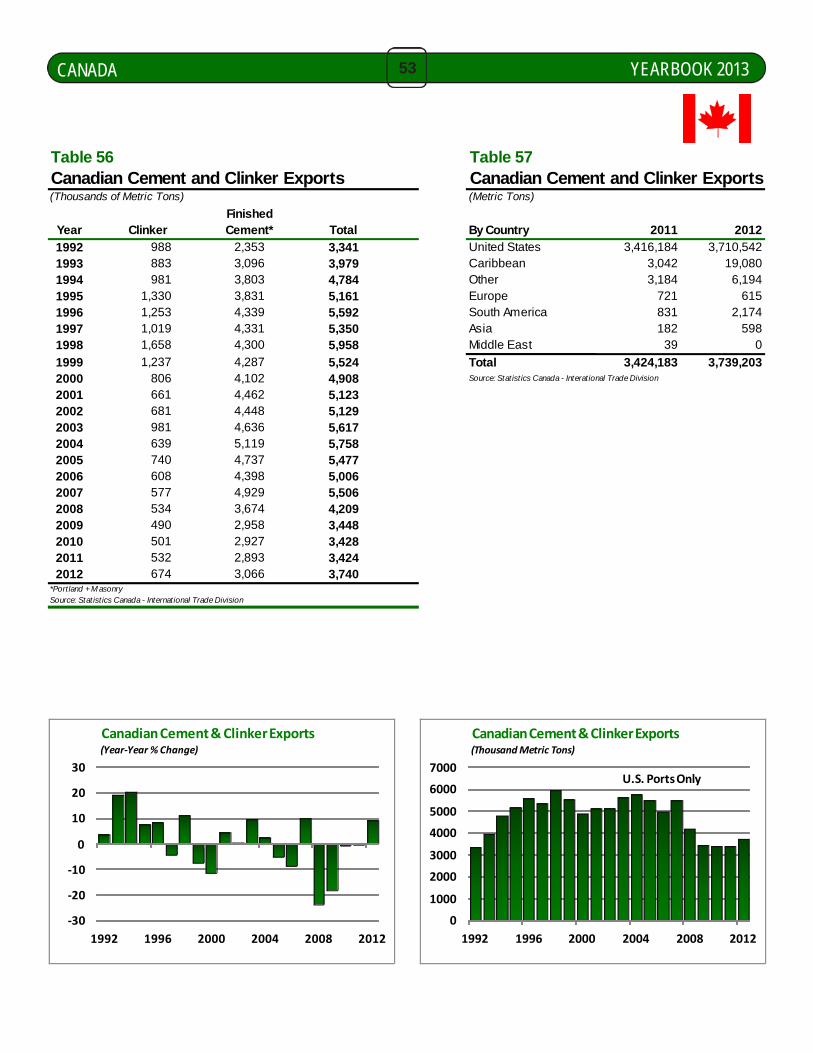
YEARBOOK 201353CANADA
‐30
‐20
‐10
0
10
20
30
1992 1996 2000 2004 2008 2012
Canadian Cement & Clinker Exports(Year‐Year % Change)
0
1000
2000
3000
4000
5000
6000
7000
1992 1996 2000 2004 2008 2012
Canadian Cement & Clinker Exports
U.S. Ports Only
(Thousand Metric Tons)
Table 56 Table 57Canadian Cement and Clinker Exports Canadian Cement and Clinker Exports(Thousands of Metric Tons) (Metric Tons)
FinishedYear Clinker Cement* Total By Country 2011 2012
1992 988 2,353 3,341 United States 3,416,184 3,710,5421993 883 3,096 3,979 Caribbean 3,042 19,0801994 981 3,803 4,784 Other 3,184 6,1941995 1,330 3,831 5,161 Europe 721 6151996 1,253 4,339 5,592 South America 831 2,1741997 1,019 4,331 5,350 Asia 182 5981998 1,658 4,300 5,958 Middle East 39 0
1999 1,237 4,287 5,524 Total 3,424,183 3,739,2032000 806 4,102 4,908 Source: Statist ics Canada - Interational Trade Division
2001 661 4,462 5,1232002 681 4,448 5,1292003 981 4,636 5,6172004 639 5,119 5,7582005 740 4,737 5,4772006 608 4,398 5,0062007 577 4,929 5,5062008 534 3,674 4,2092009 490 2,958 3,4482010 501 2,927 3,4282011 532 2,893 3,4242012 674 3,066 3,740
*Portland + MasonrySource: Statist ics Canada - International Trade Division
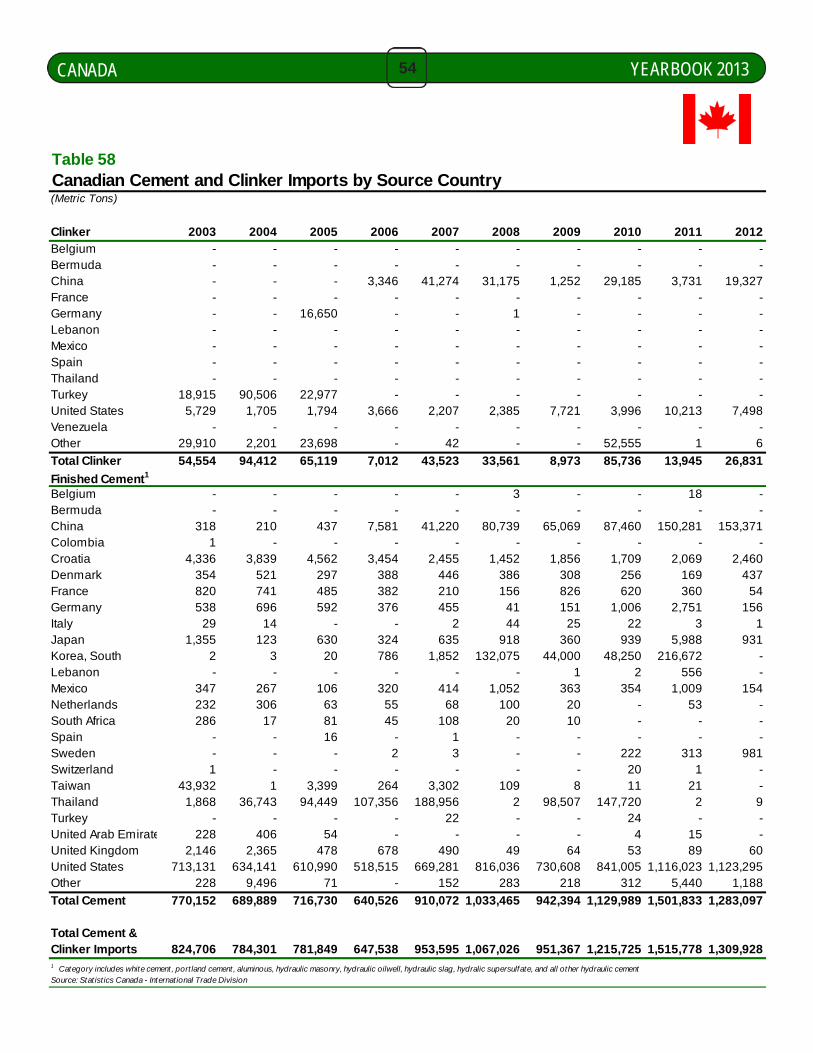
YEARBOOK 201354CANADA
Table 58Canadian Cement and Clinker Imports by Source Country(Metric Tons)
Clinker 2003 2004 2005 2006 2007 2008 2009 2010 2011 2012Belgium - - - - - - - - - -Bermuda - - - - - - - - - -China - - - 3,346 41,274 31,175 1,252 29,185 3,731 19,327France - - - - - - - - - -Germany - - 16,650 - - 1 - - - -Lebanon - - - - - - - - - -Mexico - - - - - - - - - -Spain - - - - - - - - - -Thailand - - - - - - - - - -Turkey 18,915 90,506 22,977 - - - - - - -United States 5,729 1,705 1,794 3,666 2,207 2,385 7,721 3,996 10,213 7,498Venezuela - - - - - - - - - -Other 29,910 2,201 23,698 - 42 - - 52,555 1 6
Total Clinker 54,554 94,412 65,119 7,012 43,523 33,561 8,973 85,736 13,945 26,831
Finished Cement1
Belgium - - - - - 3 - - 18 -Bermuda - - - - - - - - - -China 318 210 437 7,581 41,220 80,739 65,069 87,460 150,281 153,371Colombia 1 - - - - - - - - -Croatia 4,336 3,839 4,562 3,454 2,455 1,452 1,856 1,709 2,069 2,460Denmark 354 521 297 388 446 386 308 256 169 437France 820 741 485 382 210 156 826 620 360 54Germany 538 696 592 376 455 41 151 1,006 2,751 156Italy 29 14 - - 2 44 25 22 3 1Japan 1,355 123 630 324 635 918 360 939 5,988 931Korea, South 2 3 20 786 1,852 132,075 44,000 48,250 216,672 -Lebanon - - - - - - 1 2 556 -Mexico 347 267 106 320 414 1,052 363 354 1,009 154Netherlands 232 306 63 55 68 100 20 - 53 -South Africa 286 17 81 45 108 20 10 - - -Spain - - 16 - 1 - - - - -Sweden - - - 2 3 - - 222 313 981Switzerland 1 - - - - - - 20 1 -Taiwan 43,932 1 3,399 264 3,302 109 8 11 21 -Thailand 1,868 36,743 94,449 107,356 188,956 2 98,507 147,720 2 9Turkey - - - - 22 - - 24 - -United Arab Emirate 228 406 54 - - - - 4 15 -United Kingdom 2,146 2,365 478 678 490 49 64 53 89 60United States 713,131 634,141 610,990 518,515 669,281 816,036 730,608 841,005 1,116,023 1,123,295Other 228 9,496 71 - 152 283 218 312 5,440 1,188
Total Cement 770,152 689,889 716,730 640,526 910,072 1,033,465 942,394 1,129,989 1,501,833 1,283,097
Total Cement &Clinker Imports 824,706 784,301 781,849 647,538 953,595 1,067,026 951,367 1,215,725 1,515,778 1,309,9281 Category includes white cement, port land cement, aluminous, hydraulic masonry, hydraulic oilwell, hydraulic slag, hydralic supersulfate, and all other hydraulic cementSource: Stat ist ics Canada - International Trade Division
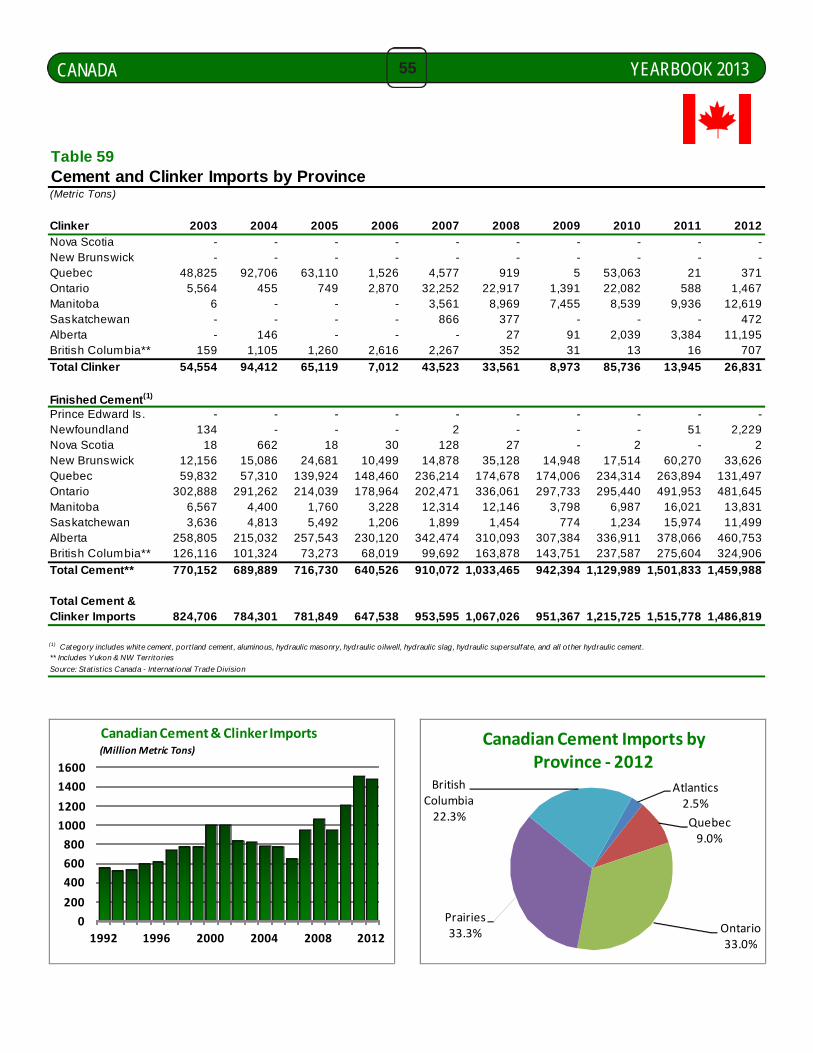
YEARBOOK 201355CANADA
Table 59Cement and Clinker Imports by Province(Metric Tons)
Clinker 2003 2004 2005 2006 2007 2008 2009 2010 2011 2012Nova Scotia - - - - - - - - - -New Brunswick - - - - - - - - - -Quebec 48,825 92,706 63,110 1,526 4,577 919 5 53,063 21 371Ontario 5,564 455 749 2,870 32,252 22,917 1,391 22,082 588 1,467Manitoba 6 - - - 3,561 8,969 7,455 8,539 9,936 12,619Saskatchewan - - - - 866 377 - - - 472Alberta - 146 - - - 27 91 2,039 3,384 11,195British Columbia** 159 1,105 1,260 2,616 2,267 352 31 13 16 707
Total Clinker 54,554 94,412 65,119 7,012 43,523 33,561 8,973 85,736 13,945 26,831
Finished Cement(1)
Prince Edward Is. - - - - - - - - - -Newfoundland 134 - - - 2 - - - 51 2,229Nova Scotia 18 662 18 30 128 27 - 2 - 2New Brunswick 12,156 15,086 24,681 10,499 14,878 35,128 14,948 17,514 60,270 33,626Quebec 59,832 57,310 139,924 148,460 236,214 174,678 174,006 234,314 263,894 131,497Ontario 302,888 291,262 214,039 178,964 202,471 336,061 297,733 295,440 491,953 481,645Manitoba 6,567 4,400 1,760 3,228 12,314 12,146 3,798 6,987 16,021 13,831Saskatchewan 3,636 4,813 5,492 1,206 1,899 1,454 774 1,234 15,974 11,499Alberta 258,805 215,032 257,543 230,120 342,474 310,093 307,384 336,911 378,066 460,753British Columbia** 126,116 101,324 73,273 68,019 99,692 163,878 143,751 237,587 275,604 324,906
Total Cement** 770,152 689,889 716,730 640,526 910,072 1,033,465 942,394 1,129,989 1,501,833 1,459,988
Total Cement &Clinker Imports 824,706 784,301 781,849 647,538 953,595 1,067,026 951,367 1,215,725 1,515,778 1,486,819
(1) Category includes white cement, port land cement, aluminous, hydraulic masonry, hydraulic oilwell, hydraulic slag, hydraulic supersulfate, and all other hydraulic cement .** Includes Yukon & NW Territories
Source: Stat ist ics Canada - Internat ional Trade Division
0
200
400
600
800
1000
1200
1400
1600
1992 1996 2000 2004 2008 2012
Canadian Cement & Clinker Imports(Million Metric Tons)
Atlantics 2.5%
Quebec9.0%
Ontario33.0%
Prairies33.3%
British Columbia22.3%
Canadian Cement Imports by Province ‐ 2012

YEARBOOK 201356CANADA
Table 60Provincial Grinding Capacity*(Thousands of Metric Tons)
Province 2001 2002 2003 2004 2005 2006 2007 2008 2009 2010 2011 2012Ontario 6,954 7,397 7,231 8,081 8,081 7,620 7,777 7,527 7,527 6,544 6,544 6,544Quebec 4,037 4,203 4,203 4,203 4,479 4,719 4,719 3,825 3,825 4,079 4,079 4,079British Columbia 2,165 2,999 2,697 2,679 2,679 3,487 3,487 3,487 3,487 2,898 2,898 2,898Alberta 2,728 2,802 2,802 2,710 2,710 2,710 2,741 2,741 2,741 2,740 2,740 2,740Nova Scotia 306 621 616 616 535 500 500 500 500 500 500 500Manitoba 0 0 0 0 0 0 0 0 0 0 0 0Newfoundland 0 0 0 0 0 0 0 0 0 0 0 0Saskatchewan 0 0 0 0 0 0 0 0 0 0 0 0New Brunswick 0 0 0 0 0 0 0 0 0 0 0 0
Total 16,190 18,022 17,549 18,289 18,484 19,036 19,224 18,080 18,080 16,761 16,761 16,761*Gray and white plants
Af ter 2004, the Plant Information Summary became a biennial publicat ion. Odd years thereafter are estimated
Source: PCA U.S. and Canadian Port land Cement Industry: Plant Informat ion Summary
Table 61 Table 62Provincial Portland Growth of ProvincialCement Consumption Portland Cement Consumption(Thousands of Metric Tons) (Compound Annual Growth Rate, 1990 - 2011)
Province 2002 Province 2012 ProvinceOntario 3,170 Ontario 3,183 Atlantic Provinces 3.3Prairie Provinces 1,784 Prairie Provinces 2,447 Ontario 0.7Quebec 1,865 Quebec 2,285 Prairie Provinces 2.0B.C. & Territories 902 B.C. & Territories 930 Quebec 1.6Atlantic Provinces 513 Atlantic Provinces 452 British Columbia -1.0
Total Canada 8,235 Total Canada 9,297 Total Canada 1.7
Source: Stat ist ics Canada Source: Statist ics Canada
12.5
13.0
13.5
14.0
14.5
15.0
15.5
16.0
16.5
17.0
1994 1997 2000 2003 2006 2009 2012
Canadian Clinker Capacity(Million Metric Tons)
0
20
40
60
80
100
1994 1997 2000 2003 2006 2009 2012
Canadian Capacity Utilization Rate(Percent)
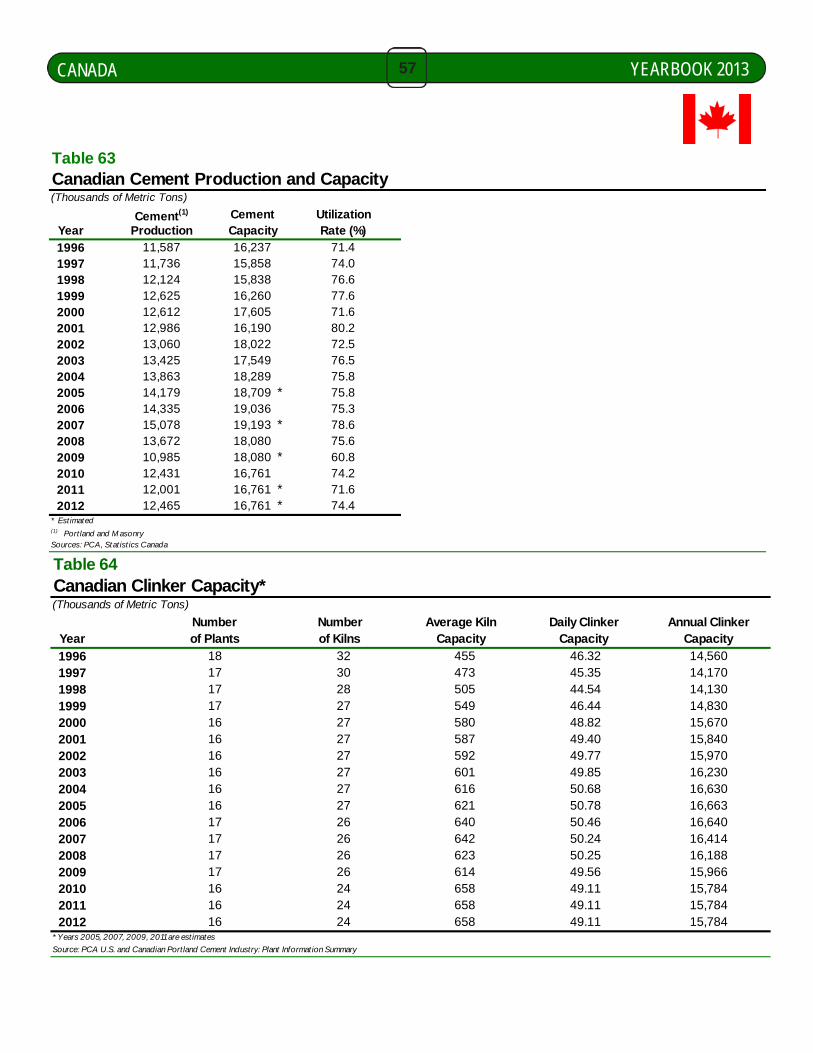
YEARBOOK 201357CANADA
Table 64Canadian Clinker Capacity*(Thousands of Metric Tons)
Number Number Average Kiln Daily Clinker Annual ClinkerYear of Plants of Kilns Capacity Capacity Capacity
1996 18 32 455 46.32 14,5601997 17 30 473 45.35 14,1701998 17 28 505 44.54 14,1301999 17 27 549 46.44 14,8302000 16 27 580 48.82 15,6702001 16 27 587 49.40 15,8402002 16 27 592 49.77 15,9702003 16 27 601 49.85 16,2302004 16 27 616 50.68 16,6302005 16 27 621 50.78 16,6632006 17 26 640 50.46 16,6402007 17 26 642 50.24 16,4142008 17 26 623 50.25 16,1882009 17 26 614 49.56 15,9662010 16 24 658 49.11 15,7842011 16 24 658 49.11 15,7842012 16 24 658 49.11 15,784
* Years 2005, 2007, 2009, 2011 are estimates
Source: PCA U.S. and Canadian Portland Cement Industry: Plant Information Summary
Table 63Canadian Cement Production and Capacity(Thousands of Metric Tons)
Cement(1) Cement UtilizationYear Production Capacity Rate (%)
1996 11,587 16,237 71.41997 11,736 15,858 74.01998 12,124 15,838 76.61999 12,625 16,260 77.62000 12,612 17,605 71.62001 12,986 16,190 80.22002 13,060 18,022 72.52003 13,425 17,549 76.52004 13,863 18,289 75.82005 14,179 18,709 * 75.82006 14,335 19,036 75.32007 15,078 19,193 * 78.62008 13,672 18,080 75.62009 10,985 18,080 * 60.82010 12,431 16,761 74.22011 12,001 16,761 * 71.62012 12,465 16,761 * 74.4
* Estimated(1) Port land and M asonry Sources: PCA, Statist ics Canada

YEARBOOK 201358CANADA
Table 65 Table 66Age Distribution of Canadian Canadian Cement CompanyClinker Capacity by Process - 2012 Clinker Capacity - 2012(Thousands of Metric Tons) (Thousands of Metric Tons)
Wet Clinker PercentAge of Kilns Process Company Capacity Industry1951 - 1955 0.0 Lafarge Canada Inc. 4,983 31.61956 - 1960 0.0 St. Marys Cement Inc. 2,459 15.61961 - 1965 0.0 Lehigh Cement Company 2,339 14.81966 - 1970 0.0 Holcim Canada Inc. 2,276 14.41971 - 1975 0.0 Essroc Canada Inc. 1,325 8.41976 - 1980 0.0 Ciment Quebec Inc. 1,139 7.2After 1980 0.0 Federal White Cement 998 6.3Total Clinker Capacity 0.0 Colacem Canada Inc. 265 1.7Source: PCA U.S. and Canadian Port land Cement Industry: Total Capacity 15,784 100.0Plant Informat ion Summary Source: PCA U.S. and Canadian Port land Cement Industry:
Plant Informat ion Summary
Table 67Foreign Affiliated Canadian Clinker Capacity
Company Affiliation as of January 1, 2012 CountryCiment Quebec Inc. Groupe Ciment Quebec Canada/ItalyColacem Canada Inc. Colacem/Simard Beaudry ItalyEssroc Canada Inc. Italcementi Group ItalyLafarge Canada Inc. Lafarge North America FranceLehigh Cement Company Heidelberg Cement GermanyHolcim Canada Inc. Holcim Group SwitzerlandSt. Marys Cement Inc. Votorantim Cimentos BrazilSource: PCA U.S. and Canadian Port land Cement Industry: Total:Plant Informat ion Summary Total Canadian Capacity:
Percent of Foreign Owned Canadian Clinker Capacity: 93.7
2,3392,2762,459
14,78615,784
4,983
on 12/31/12Clinker Capacity
(000 Metric Tons)
1,139
1,325265
20.655.015,784
DryProcess
0.00.06.25.7
12.7
0
100200
300
400500
600
700
1996 2000 2004 2008 2012
Average Canadian Kiln Capacity
(ThousandMetric Tons)
St. Marys15.6%
Holcim14.4%
Essroc8.4%
Lehigh14.8%
Lafarge31.6%
Other15.2%
Top Five Canadian Cement Companies Share of Total Clinker Capacity ‐ 2012
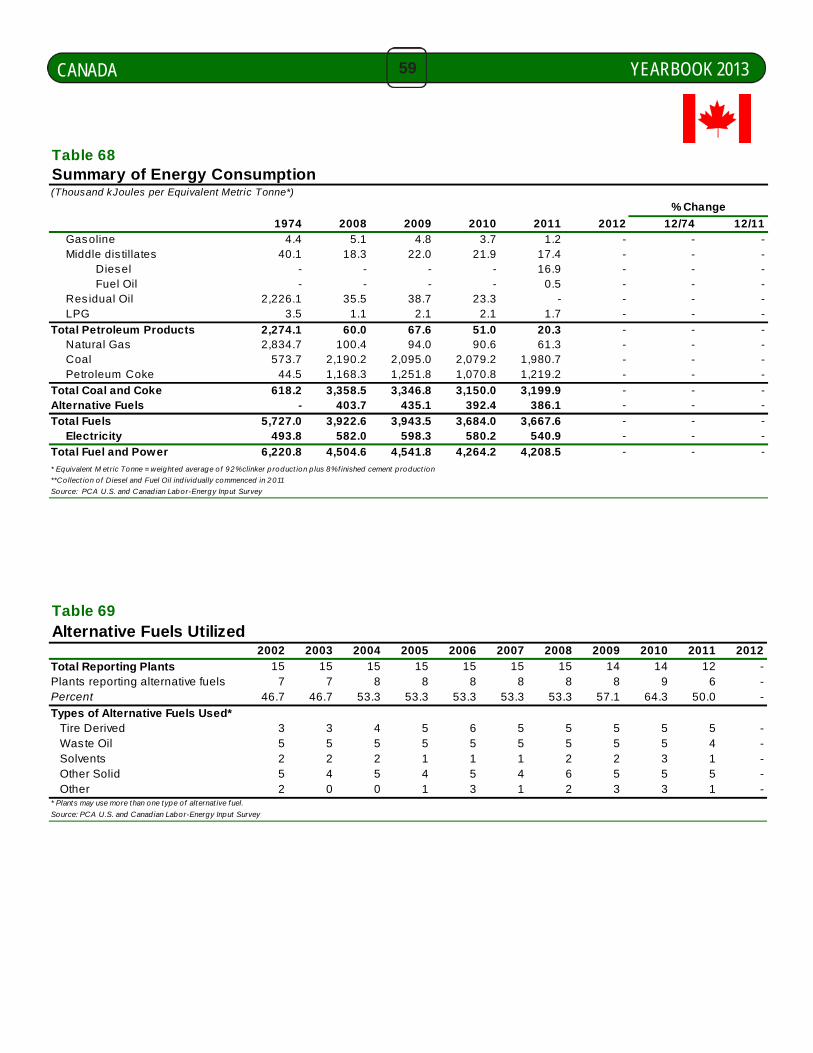
YEARBOOK 201359CANADA
Table 68Summary of Energy Consumption(Thousand kJoules per Equivalent Metric Tonne*)
1974 2008 2009 2010 2011 2012 12/74 12/11 Gasoline 4.4 5.1 4.8 3.7 1.2 - - - Middle dis tillates 40.1 18.3 22.0 21.9 17.4 - - -
Diesel - - - - 16.9 - - -Fuel Oil - - - - 0.5 - - -
Res idual Oil 2,226.1 35.5 38.7 23.3 - - - - LPG 3.5 1.1 2.1 2.1 1.7 - - -
Total Petroleum Products 2,274.1 60.0 67.6 51.0 20.3 - - - Natural Gas 2,834.7 100.4 94.0 90.6 61.3 - - - Coal 573.7 2,190.2 2,095.0 2,079.2 1,980.7 - - - Petroleum Coke 44.5 1,168.3 1,251.8 1,070.8 1,219.2 - - -
Total Coal and Coke 618.2 3,358.5 3,346.8 3,150.0 3,199.9 - - -Alternative Fuels - 403.7 435.1 392.4 386.1 - - -
Total Fuels 5,727.0 3,922.6 3,943.5 3,684.0 3,667.6 - - - Electricity 493.8 582.0 598.3 580.2 540.9 - - -
Total Fuel and Power 6,220.8 4,504.6 4,541.8 4,264.2 4,208.5 - - -
* Equivalent M et ric Tonne = weighted average o f 92% clinker p roduct ion p lus 8% f inished cement p roduct ion
**Collect ion o f Diesel and Fuel Oil ind ividually commenced in 2011
Source: PCA U.S. and Canadian Labor-Energy Input Survey
% Change
Table 69Alternative Fuels Utilized
2002 2003 2004 2005 2006 2007 2008 2009 2010 2011 2012
Total Reporting Plants 15 15 15 15 15 15 15 14 14 12 -Plants reporting alternative fuels 7 7 8 8 8 8 8 8 9 6 -Percent 46.7 46.7 53.3 53.3 53.3 53.3 53.3 57.1 64.3 50.0 -
Types of Alternative Fuels Used* Tire Derived 3 3 4 5 6 5 5 5 5 5 - Waste Oil 5 5 5 5 5 5 5 5 5 4 - Solvents 2 2 2 1 1 1 2 2 3 1 - Other Solid 5 4 5 4 5 4 6 5 5 5 - Other 2 0 0 1 3 1 2 3 3 1 -* Plants may use more than one type of alternat ive fuel.
Source: PCA U.S. and Canadian Labor-Energy Input Survey

YEARBOOK 201360CANADA
Table 70Canadian Fuel Consumption Mix(Percent Distribution of kJoules Used)
1974 2002 2003 2004 2005 2006 2007 2008 2009 2010 2011 2012Coal and Coke 9.9 68.1 69.7 73.5 76.7 77.8 76.0 74.6 73.7 73.9 76.0 -Natural Gas 45.6 9.7 8.5 4.1 3.0 1.9 2.0 2.2 2.1 2.2 1.5 -Petroleum Products 36.6 2.0 2.7 2.3 2.9 2.0 1.5 1.3 1.5 1.2 0.5 -Electricity 7.9 12.2 11.7 12.0 11.7 12.3 12.4 12.9 13.2 13.6 12.8 -Alternative Fuel 0.0 8.1 7.4 8.0 5.7 6.0 8.1 9.0 9.6 9.2 9.2 -
Total Fuel (%) 100 100 100 100 100 100 100 100 100 100 100 -
Source: PCA U.S. and Canadian Labor-Energy Input Survey
Table 71Canadian Energy Consumption by Process(Thousand kJoules per Equivalent Metric Tonne*)
% Change
1974 2008 2009 2010 2011 2012 12/74 12/11
Fuel and Electricity All Plants 6,221 4,505 4,541 4,264 4,208 - - - Wet-Process Plants 6,972 (1) (1) (1) (1)
Dry-Process Plants 5,632 4,484 4,541 4,264 4,208 - - -
Fuel All Plants 5,727 3,923 3,943 3,684 3,668 - - - Wet-Process Plants 6,481 (1) (1) (1) (1)
Dry-Process Plants 5,145 3,904 3,943 3,684 3,668 - - -
Electricity All Plants 494 582 598 580 540 - - - Wet-Process Plants 491 (1) (1) (1) (1)
Dry-Process Plants 487 580 598 580 540 - - -* Equivalent Metric Tonne= weighted average of 92% clinker production plus 8% finished cement production.(1) Not available due to disclosure restrictions.
Source: PCA U.S. and Canadian Labor-Energy Input Survey
0
10
20
30
40
50
60
70
80
90
1996 1999 2002 2005 2008 2011
Canadian Fuel Consumption Mix(Coal & Coke % Share)
‐8
‐6
‐4
‐2
0
2
4
1996 1999 2002 2005 2008 2011
Canadian Fuel & Power Consumption(Year‐Year % Change)

YEARBOOK 201361CANADA
Table 72Canadian Employment(000)
Total Construction Cement & ConcreteYear Employment % Change Employment % Change Employment* % Change
1996 13,419 0.9 712 -2.1 19.5 2.51997 13,705 2.1 725 1.8 22.0 13.01998 14,047 2.5 736 1.5 23.7 7.51999 14,408 2.6 765 3.9 24.5 3.72000 14,766 2.5 807 5.5 26.5 8.02001 14,939 1.2 819 1.5 25.2 -5.02002 15,296 2.4 860 5.0 24.1 -4.22003 15,659 2.4 907 5.5 24.9 3.22004 15,927 1.7 954 5.2 24.7 -0.72005 16,128 1.3 1,015 6.4 24.6 -0.72006 16,412 1.8 1,066 5.0 26.9 9.62007 16,803 2.4 1,130 6.0 26.6 -1.12008 17,082 1.7 1,230 8.8 27.1 1.92009 16,814 -1.6 1,161 -5.6 26.0 -4.12010 17,045 1.4 1,218 4.9 27.3 5.02011 17,309 1.5 1,262 3.6 27.8 1.92012 17,489 1.0 1,267 0.4 28.3 1.9
*Includes Cement, Ready Mix, Pipe-Brick-Block Manufacturing
Source: Statistics Canada

YEARBOOK 201362
This page intentionally left blank.
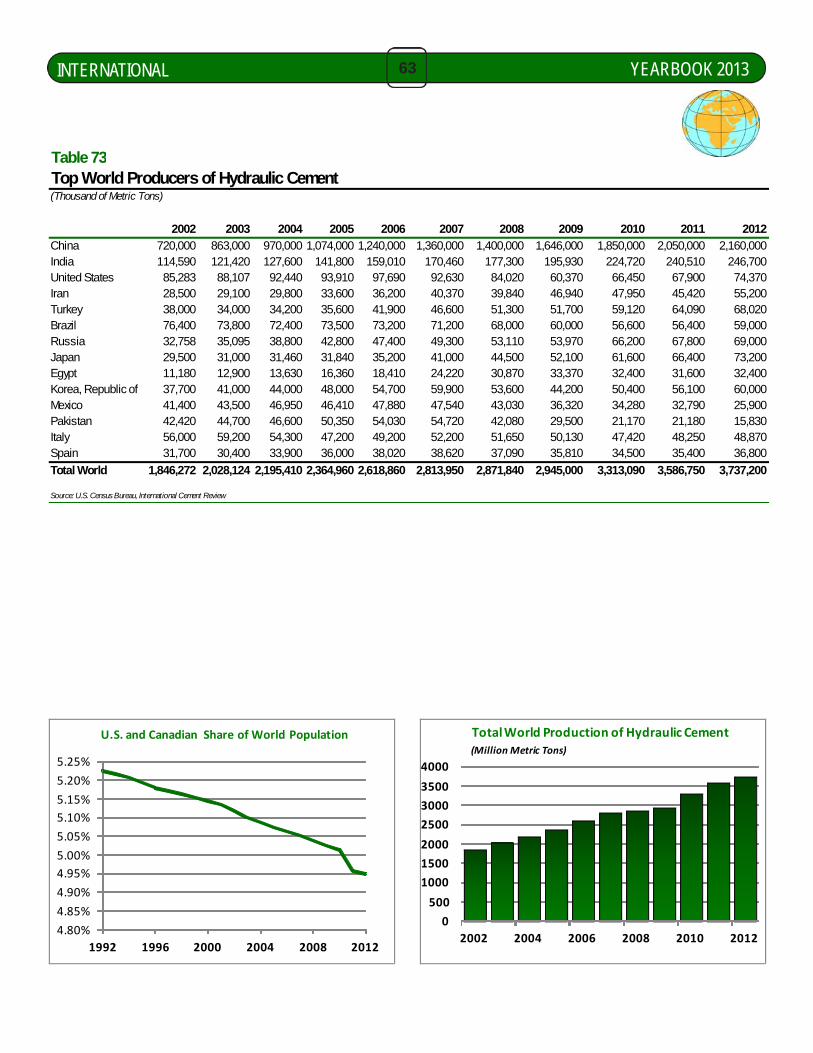
YEARBOOK 201363INTERNATIONAL
Table 73Top World Producers of Hydraulic Cement(Thousand of Metric Tons)
2002 2003 2004 2005 2006 2007 2008 2009 2010 2011 2012China 720,000 863,000 970,000 1,074,000 1,240,000 1,360,000 1,400,000 1,646,000 1,850,000 2,050,000 2,160,000India 114,590 121,420 127,600 141,800 159,010 170,460 177,300 195,930 224,720 240,510 246,700United States 85,283 88,107 92,440 93,910 97,690 92,630 84,020 60,370 66,450 67,900 74,370Iran 28,500 29,100 29,800 33,600 36,200 40,370 39,840 46,940 47,950 45,420 55,200Turkey 38,000 34,000 34,200 35,600 41,900 46,600 51,300 51,700 59,120 64,090 68,020Brazil 76,400 73,800 72,400 73,500 73,200 71,200 68,000 60,000 56,600 56,400 59,000Russia 32,758 35,095 38,800 42,800 47,400 49,300 53,110 53,970 66,200 67,800 69,000Japan 29,500 31,000 31,460 31,840 35,200 41,000 44,500 52,100 61,600 66,400 73,200Egypt 11,180 12,900 13,630 16,360 18,410 24,220 30,870 33,370 32,400 31,600 32,400Korea, Republic of 37,700 41,000 44,000 48,000 54,700 59,900 53,600 44,200 50,400 56,100 60,000Mexico 41,400 43,500 46,950 46,410 47,880 47,540 43,030 36,320 34,280 32,790 25,900Pakistan 42,420 44,700 46,600 50,350 54,030 54,720 42,080 29,500 21,170 21,180 15,830Italy 56,000 59,200 54,300 47,200 49,200 52,200 51,650 50,130 47,420 48,250 48,870Spain 31,700 30,400 33,900 36,000 38,020 38,620 37,090 35,810 34,500 35,400 36,800
Total World 1,846,272 2,028,124 2,195,410 2,364,960 2,618,860 2,813,950 2,871,840 2,945,000 3,313,090 3,586,750 3,737,200
Source: U.S. Census Bureau, International Cement Review
4.80%
4.85%
4.90%
4.95%
5.00%
5.05%
5.10%
5.15%
5.20%
5.25%
1992 1996 2000 2004 2008 2012
U.S. and Canadian Share of World Population
0
500
1000
1500
2000
2500
3000
3500
4000
2002 2004 2006 2008 2010 2012
Total World Production of Hydraulic Cement(MillionMetric Tons)

YEARBOOK 201364INTERNATIONAL
Table 74Population Growth Rates for Top World Producers of Hydraulic Cement(Year-Year % Change)
2002 2003 2004 2005 2006 2007 2008 2009 2010 2011 2012
China 0.50 0.50 0.50 0.50 0.50 0.50 0.50 0.50 0.50 0.50 0.50India 1.60 1.60 1.60 1.50 1.50 1.50 1.40 1.40 1.40 1.30 1.30United States* 0.90 0.90 0.90 0.90 1.00 1.00 0.90 0.80 0.80 0.70 0.90Japan 0.10 0.20 0.10 0.00 0.00 0.00 0.00 -0.10 -0.10 -0.10 -0.10Brazil 1.30 1.30 1.20 1.20 1.10 1.00 1.00 1.00 0.90 0.90 0.90Korea, South 0.50 0.40 0.40 0.20 0.30 0.30 0.30 0.30 0.30 0.20 0.20Turkey 1.50 1.50 1.50 1.50 1.40 1.40 1.30 1.30 1.30 1.20 1.20Iran 0.70 0.70 1.10 1.30 1.20 1.30 1.20 1.20 1.30 1.20 1.20Russ ia -0.50 -0.60 -0.50 -0.50 -0.30 -0.10 0.00 0.10 0.00 0.00 0.00Egypt 2.20 2.10 2.10 2.10 2.10 2.10 2.10 2.00 2.00 2.00 1.90Italy 0.30 0.60 0.70 0.40 0.40 0.80 0.70 0.50 0.50 0.40 0.40Mexico 1.20 1.20 1.20 1.20 1.20 1.20 1.10 1.10 1.10 1.10 1.10Spain 1.70 1.60 1.60 1.60 1.70 1.80 1.30 0.40 0.50 0.60 0.70Pakis tan 1.80 1.80 1.90 1.70 1.90 1.70 1.70 1.60 1.60 1.60 1.60
Total World 1.23 1.22 1.20 1.20 1.20 1.19 1.17 1.14 1.12 1.11 1.11
*Includes Puerto Rico.
Source: U.S. Census Bureau, Internat ional Data Base
0.0%
0.5%
1.0%
1.5%
2.0%
2.5%
U.S. Japan Italy Germany France U.K. Russia Canada
Share of G8 Countries to Total World Cement Consumption ‐ 2012(Percent)

YEARBOOK 201365INTERNATIONAL
Table 75
Cement Consumption(Million Metric Tons)
G8 CountriesG8 Share
Total G8 World of World
Year U.S. Japan Italy Germany France U.K. Russia CanadaConsumption Consumption Consumption (%)
1993 79.589 79.000 37.360 36.800 19.398 12.500 48.450 6.622 319.719 1,281.650 24.9
1994 85.420 80.200 32.690 40.850 20.055 12.600 35.900 7.198 314.913 1,363.050 23.1
1995 86.176 79.600 32.460 37.980 19.730 13.120 35.300 6.928 311.295 1,435.800 21.7
1996 91.037 82.300 33.623 35.550 18.720 14.500 26.760 7.263 309.754 1,475.145 21.0
1997 96.184 78.600 33.767 34.260 18.730 14.800 25.900 7.627 309.869 1,531.277 20.2
1998 103.254 71.591 34.700 37.260 18.980 14.700 26.000 7.614 314.099 1,527.501 20.6
1999 108.427 70.774 36.120 38.340 20.210 15.100 28.400 8.009 325.379 1,603.596 20.3
2000 109.527 72.274 38.338 35.440 20.630 14.100 30.600 8.271 329.180 1,648.885 20.0
2001 113.800 68.637 39.469 30.460 20.660 14.050 33.300 8.413 328.789 1,698.833 19.4
2002 109.387 64.592 41.300 29.020 20.727 14.620 35.900 8.476 324.022 1,815.653 17.8
2003 113.494 60.125 43.500 29.030 20.678 14.370 38.500 8.901 328.597 1,970.246 16.7
2004 121.272 58.002 46.360 29.020 21.940 14.950 41.500 9.328 342.372 2,149.551 15.9
2005 128.035 59.039 46.050 26.930 22.520 14.810 46.000 9.425 352.809 2,564.463 13.8
2006 127.251 58.616 46.880 28.920 24.090 14.730 52.200 9.564 362.251 2,568.000 14.1
2007 114.622 55.900 46.370 27.210 24.800 15.770 61.046 9.823 355.541 2,763.000 12.9
2008 96.658 50.500 43.800 27.300 24.130 13.350 61.600 9.607 326.945 2,857.000 11.4
2009 70.566 44.000 35.950 25.380 20.380 11.290 43.800 7.962 259.327 2,998.000 8.7
2010 70.323 41.800 33.930 24.690 19.790 10.510 49.400 8.782 259.225 3,311.690 7.8
2011 72.127 42.100 * 32.800 * 27.960 * 21.410 * 11.310 * 57.400 * 8.945 274.052 * 3,585.170 * 7.6 *
2012 78.458 43.000 * 26.000 * 27.400 * 20.000 * 10.600 * 63.000 * 9.456 277.914 * 3,736.080 * 7.4 *
* EstimatedSource: U.S. Census Bureau, International Cement Review, United States Geological Survey, Stat ist ics Canada
2.0%
3.0%
4.0%
5.0%
6.0%
7.0%
8.0%
2000 2002 2004 2006 2008 2010 2012
U.S. and Canadian Share Cement Consumption
0.10
0.20
0.30
0.40
0.50
0.60
1992 1996 2000 2004 2008 2012
Cement Consumption Per Capita
G8
World
US& Canada
