north american business activity statistics american business activity statistics third quarter 2014...
TRANSCRIPT
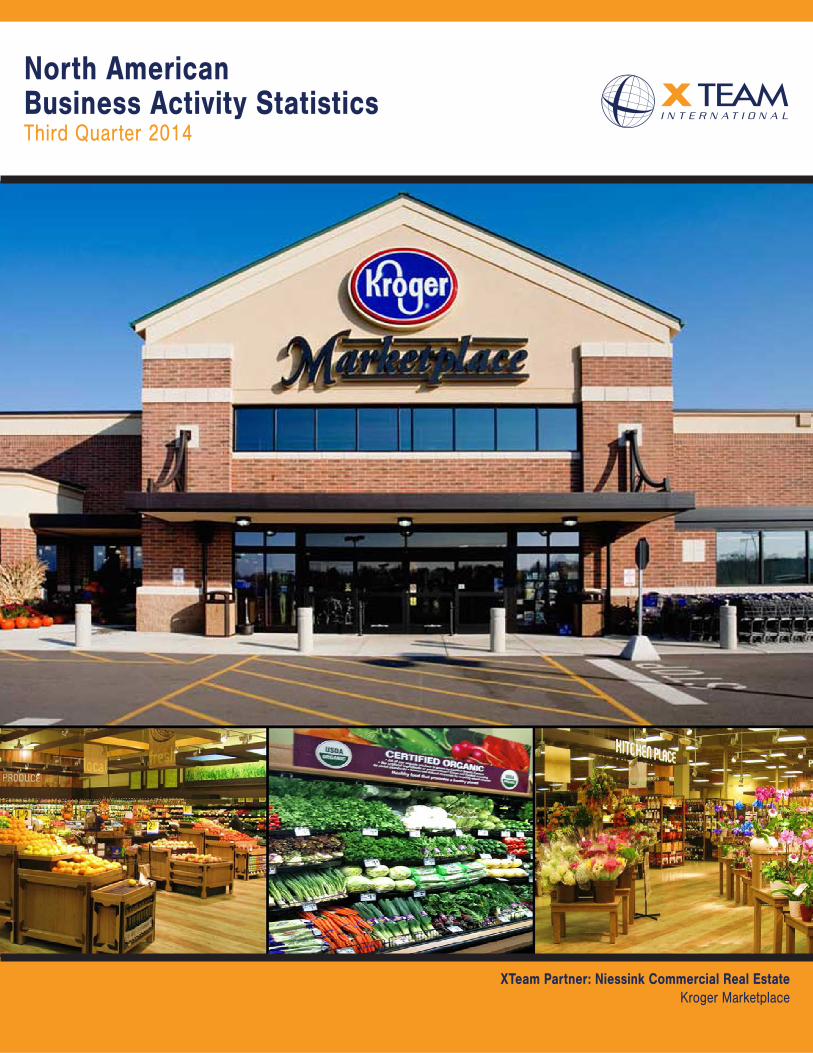
North AmericanBusiness Activity StatisticsThird Quarter 2014
XTeam Partner: Niessink Commercial Real EstateKroger Marketplace

XTeam Partner Sitings Realty LTD.High street leasing, Vancouver, Canada
Q3 2014 SummaryKey Findings from the Retail Sector:The third quarter of 2014 saw positive increases versus the prior three month period in retail
leasing and sales across North America based on data reported by X-Team International’s 34 United States and Canadian offices. Sales of retail commercial properties totaled over 6 million square feet, almost doubling the second quarter. After seeing same-quarter comparison down 35% between the first quarter of 2013 and 2014, the transaction value of those sales rebounded and is up 8.4% between the first quarter and second quarter of 2014 and remained flat through the third quarter. The Southeastern region registered the most square footage sold as well as the highest cumulative sales transaction volume.
Retail leasing activity was flat in the third quarter of 2014 against the second quarter. Based on X-Team’s data, the network leased almost 4.6 million square feet of retail space in both the second quarter and the third quarter compared to 3.9 million square feet during the first three months of the year; representing an increase of nearly 16%. Just as importantly, X-Team saw the total transaction value of those leases increase from $550 million to $557.5 million – an increase of 1.5% in total transaction value between the two most recent quarters. This nets out an uptick in average rental rates consistent with observations among industry experts.
What we’re seeing is that demand for retail space is still in high demand, especially for highly productive centers and markets. Demand in primary trade areas exceeds supply. As the net absorption rate increases, rental rates continue to increase as there is still only limited new development.
■ X-Team consummated $746 million in transaction volume in the third quarter of 2014, which is down 5.3% against the second quarter. Year-to-date, X-Team transactions exceed $2.24 billion, which is up nearly 34% from the same period in 2013.
■ Leasing transactions are actually down roughly 20% over the same period from last year but transaction values are up 10% against Q3 2013.
■ Rents continue to increase in most major markets across the United States as demand continues to out-pace supply in most of those areas. The secondary and tertiary markets are dragging the overall comps downward as landlords find alternative uses for formally traditional retail space.
WE ARE over 400 professionals in 34 offices throughout North America. We are a powerful network of partner offices that exclusively focus on first class, best in class, world class retail real estate. X Team International’s unique platform assembles the strongest and most experienced retail-only specialists in the most important metropolitan markets in North America. There are no substitutes for resume or reputation, and each X Team partner office is a recognized leader in its regional trade area. Our team has an enormous track record in the representation of Fortune 500 and emerging retailers alike. We represent North America’s premier Power Center and Specialty Center developers as well as regional and local clientele who own the high street retail and neighborhood centers where North America shops.
Extensive Experience. Exclusively Retail. X Team.

North American LeasingThe majority of new retail real estate transactions consummated each quarter are leases. In Q3 2014, leasing has represented 75% of the total value of all transactions (lease + sale). Because more consideration changes h ands and more space is moved via leases, trends in leasing activity are an extremely reliable barometer of the strength of the retail sector, and by extension, the overall commercial real estate market and economy at large.
$463
M
$483
M
$508
M
$473
M $567
M
$496
M
$550
M
$557
M
$0 M
$100 M
$200 M
$300 M
$400 M
$500 M
$600 M
2012 4Q 2013 1Q 2013 2Q 2013 3Q 2013 4Q 2014 1Q 2014 2Q 2014 3Q
Leased ($ Volume)
8.07
M
3.35
M
5.75
M
4.99
M
4.39
M
3.9 M
4.6 M
4.6 M
0. M
1. M
2. M
3. M
4. M
5. M
6. M
7. M
8. M
9. M
2012 4Q 2013 1Q 2013 2Q 2013 3Q 2013 4Q 2014 1Q 2014 2Q 2014 3Q
Leased SF (Millions of SF)
2014 Leased Volume YTD: $1.6 BILLION 2014 Leased SF YTD: $13.1 MILLION
Sales ActivityThe data described below captures all sales consummated by our Partners in a given quarter. This includes a broad mix of transactions including investment sales to investors, existing asset sales to users, redevelopment sales to developers and raw land sales to both users and developers. The breadth of transaction types captured by this data provides a more general commentary on retail real estate activity and trends from one quarter to the next.
$636
M
$334
M
$94 M
$216
M
$203
M
$219
M
$239
M
$189
M
$0 M
$100 M
$200 M
$300 M
$400 M
$500 M
$600 M
$700 M
2012 4Q 2013 1Q 2013 2Q 2013 3Q 2013 4Q 2014 1Q 2014 2Q 2014 3Q
Sales ($ Volume)
8.7 M
3.67
M
1.49
M 3.76
M
2.25
M
2.71
M
3.23
M
5.93
M
0. M
1. M
2. M
3. M
4. M
5. M
6. M
7. M
8. M
9. M
10. M
2012 4Q 2013 1Q 2013 2Q 2013 3Q 2013 4Q 2014 1Q 2014 2Q 2014 3Q
Sales (Millions of SF)
2014 Sales Volume YTD: $647 MILLION 2014 SF YTD: 11.87 MILLION
Sale & Lease Transaction TotalsNorth American
Business Activity StatisticsQ3 2014

Power Center Retail Premium Retail
$0 $10 $20 $30 $40 $50 $60 $70 $80
Dallas
Denver
Atlanta
Los Angeles
Chicago
Sea>le
Boston
San Francisco
New York, NY
Rental Rates in Top 10 Markets ($ / SF / YR)
$0 $500 $1,000 $1,500 $2,000 $2,500 $3,000 $3,500
Denver
Sea0le
Dallas
Philadelphia
Boston
San Francisco
Chicago
Los Angeles
New York, NY
Rental Rates in Top 10 Markets ($ / SF / YR)
Network Locations & Rental SurveyNorth American
Business Activity StatisticsQ3 2014
North American Partner Offices
Rental Rates in Top 10 MarketsThe survey below tracks rental rates in ten key national markets, both in the Power Center and premium High Street retail segments. The Power Center survey captures rental rates for junior boxes in the 20,000 SF range for best in class Power Centers. The adjacent survey of High Street retail captures rates for the top premium retail locations in the 2,500 SF range (excluding enclosed malls). While the New York market is the pace setter in both surveys, the disparity with other national markets is far narrower in the Power Center segment than in premium retail.
On the High Streets, New York’s 5th Avenue achieved rents greater than $2,500 per SF in 2014, roughly five times that of Los Angeles’ Rodeo Drive (which stands at $540 / SF). This significant premium above all other North American markets validates New York City as an international target for retail. However in the Power Center arena, while isolated examples of $75 / SF rents have been attained in Manhattan, New York’s $40 / SF rate for outer Boroughs narrowly outpaces Los Angeles’ and Seattle’s mid $30 rent levels. In addition to New York, Los Angeles, Boston, San Francisco, Philadelphia and Chicago are the strongest landlord markets in the current survey, commanding rents 25% to 50% higher than Dallas, Denver, Atlanta and Seattle.
Partner Profile North AmericanBusiness Activity Statistics
Q1 2014Connie NiessinkPrincipalNiessink Commercial Real EstateIndianapolis, Indiana
My faith, positive outlook and dogged
perseverance keep me from jumping
off the cliff during difficult times. Two of
my favorite sayings are “Progress always
involves risk, you can’t steal second base
with your foot on first” and “The mind is
a very powerful tool – for the most part,
things are as you perceive them to be.”
My husband is also my business partner
at Niessink Commercial. We are very
different but our strengths & weaknesses
complement one another so our skills fit
together like a puzzle. Our nephew also
works with us. It’s a tremendous blessing
to work with your loved ones. It doesn’t
work for everyone so we’re one of the lucky
few.
Business
Personal
Who She isI am a sports enthusiast, who likes to learn, is reliable and exceedingly loyal. I like to be physically active but also enjoy quiet times with my family, a close friend or with a good book (preferably a biography) or a magazine. I’m naturally inquisitive so I ask a lot of questions which can be a great trait but also annoying.
Business History
I graduated from Purdue University with a B.S. in Management. My first job was membership sales to corporations for a private tennis, athletic and fine dining club in Houston. After moving back to Indiana, I sought out the commercial real estate field. My Dad’s livelihood was residential real estate so real estate is in my genes but I preferred the dynamics of a professional business sale (experienced at the private club) over the emotional sale of an individual purchasing a home. Initially I worked at one of the large brokerage firms which I consider an alma mater as I learned a lot, both good and bad. I’m a charter member of the X Team, serving as Secretary for many years. I founded Niessink Commercial in 2002 and it’s been a terrific ride!
Top Recent
Transactions
We represented Kroger in the purchase of a large tract of ground for Indianapolis’ first 123,000 SF Kroger Marketplace store. Panera Bread has a new concept called “Panera to you”, focused on delivery and carry out only, and we represented them in opening just their second and third stores in the country with stores four and five now at lease.
Client Highlights
Niessink Commercial is unique in that all we do is Retail Tenant & Buyer Representation. We work only with those retailers that will work through us exclusively and don’t represent landlords unless it is for one of our retail clients. We are blessed with several wonderful retailers who have worked exclusively through us for many years - Panera Bread (16 years), Great Clips (20 years), TJ Maxx (12 years), and ULTA (11 years). We also represent Kroger, Party City, Jack in the Box, Chick-fil-A, Toys/Babies R Us, and Half Price Books among others.
Favorite PastimesAttending Purdue football and basketball games, playing tennis, enjoying all four seasons which is a benefit of living in Indiana – just as we tire of one season the next one emerges.
Favorite PlaceAnywhere the sun is shining, but at the end of the day, there’s no place like home with family or close friends who’ve become like family.
Favorite MovieAny that make me laugh and / or reflect in a positive way. The Pink Panther series was hilarious, God’s Not Dead was powerful, and White Christmas is mandatory holiday viewing.
Something you
wouldn’t know...
I was once on the cover of the Purdue Alumni Magazine as Captain of the Varsity Cheerleaders. I’m an avid Chicago Cubs and Peyton Manning fan. I also play the piano.

Partner Profile North AmericanBusiness Activity Statistics
Q1 2014
xteam.net