normalization of direct beam spectral irradiance data for photovoltaic cell performance analyses
TRANSCRIPT
Solar Cells, 14 (1985) 193 - 195 193
Short Communicat ion
Normalization o f direct beam spectral irradiance data for photovoltalc cell performance analyses
RICHARD BIRD, ROLAND HULSTROM and CAROL RIORDAN
Solar Energy Research Institute, 1617 Cole Boulevard, Golden, CO 80401 (U.S.A.)
(Received January 22, 1985; accepted January 25, 1985)
It has come to our a t tent ion that it is a f requent practice to normalize direct beam solar spectral irradiance to a total (integrated) irradiance value of 1000 W m -2 for photovoltaic cell performance measurements or calcula- tions. The relationship of these normalized spectra to natural (outdoor) spectral distributions and intensities should be unders tood and their impact on photovoltaic cell analyses considered. The impacts of these normalization procedures are presented here.
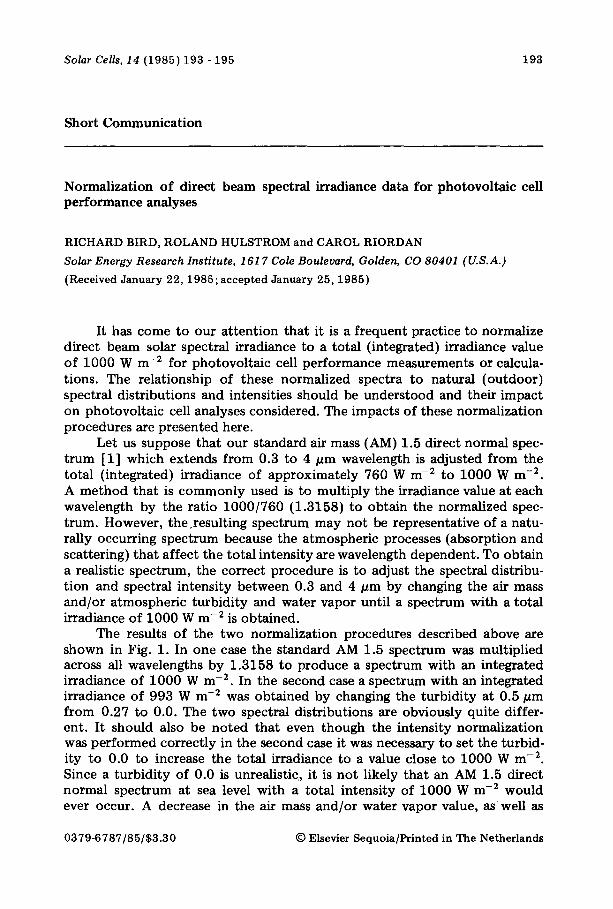
Let us suppose that our standard air mass (AM) 1.5 direct normal spec- t rum [1] which extends from 0.3 to 4 pm wavelength is adjusted from the total (integrated) irradiance of approximately 760 W m - : to 1000 W m - : . A method that is commonly used is to multiply the irradiance value at each wavelength by the ratio 1000/760 (1.3158) to obtain the normalized spec- trum. However, the.result ing spectrum may not be representative of a natu- rally occurring spectrum because the atmospheric processes (absorption and scattering) tha t affect the total intensity are wavelength dependent . To obtain a realistic spectrum, the correct procedure is to adjust the spectral distribu- t ion and spectral intensity between 0.3 and 4 pm by changing the air mass and/or atmospheric turbidi ty and water vapor until a spectrum with a total irradiance of 1000 W m -2 is obtained.
The results of the two normalization procedures described above are shown in Fig. 1. In one case the standard AM 1.5 spectrum was multiplied across all wavelengths by 1.3158 to produce a spectrum with an integrated irradiance of 1000 W m -2. In the second case a spectrum with an integrated irradiance of 993 W m - : was obtained by changing the turbidi ty at 0.5 pm from 0.27 to 0.0. The two spectral distributions are obviously quite differ- ent. It should also be noted that even though the intensity normalization was per formed correct ly in the second case it was necessary to set the turbid- ity to 0.0 to increase the total irradiance to a value close to 1000 W m -2. Since a turbidi ty of 0.0 is unrealistic, it is not likely that an AM 1.5 direCt normal spectrum at sea level with a total intensity of 1000 W m - : would ever occur. A decrease in the air mass and/or water vapor value, as well as
0379-6787/85/$3.30 © Elsevier Sequoia/Printed in The Netherlands
194
1600
i
1200
800
400
o l j V ~ 0.3 0.7 1.1 1.5 1.9 2.3 2.7
Wavelength (,urn)
Fig. 1. Normalization of the standard AM 1.5 direct normal spectrum to 1000 W m -2 by two methods: . . . . , turbidity c h a n g e ; - - , constant multiplier across all wavelengths.
200O
1800
1600 970 W m 2 - - 8 6 9 W m 2
~ 1 4 0 0 ~ 8 0 4 W m-2
6 0 0
,oo ',i/ 200 ;'
"0 0.3 0.5 0.7 0.9 1.1 1.3 1.5 1.7 1.9 2.1 2.3 2.5
Wavelength (pm)
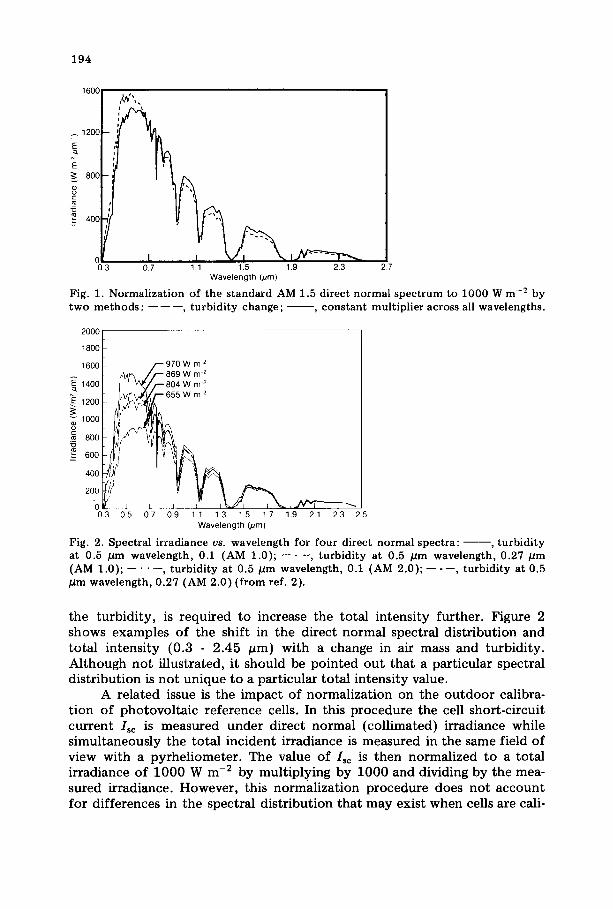
Fig. 2. Spectral irradiance vs . wavelength for four direct normal s p e c t r a : - - , turbidity at 0.5 /~m wavelength, 0.1 (AM 1.0); - - . - - , turbidity at 0.5 pm wavelength, 0.27 pm (AM 1.0); . . . . , turbidity at 0.5 ~um wavelength, 0.1 (AM 2.0); -- - --, turbidity at 0.5 pm wavelength, 0.27 (AM 2.0) (from ref. 2).
the turb id i ty , is required to increase the tota l in tensi ty fur ther . Figure 2 shows examples o f the shift in the direct normal spectral dis t r ibut ion and to ta l intensi ty (0.3 - 2 .45 #m ) with a change in air mass and turb id i ty . Al though no t illustrated, it should be po in ted ou t tha t a part icular spectral dis t r ibut ion is no t unique to a part icular tota l intensi ty value.
A related issue is the impac t of normal iza t ion on the o u t d o o r calibra- t ion of pho tovo l ta ic reference cells. In this p rocedure the cell short-circui t cu r ren t Ise is measured under direct normal (col l imated) irradiance while s imul taneously the to ta l incident irradiance is measured in the same field o f view with a pyrhe l iometer . The value o f Isc is then normal ized to a to ta l irradiance o f 1000 W m -2 by mul t ip ly ing by 1000 and dividing by the mea- sured irradiance. However , this normal iza t ion p rocedure does no t accoun t for differences in the spectral dis t r ibut ion tha t may exist when cells are cali-
195
b ra t ed at d i f f e ren t solar intensi t ies . Since the response of var ious cell ma te - rials is spec t ra l ly d e p e n d e n t , the d i f fe rence in solar spect ra l d i s t r ibu t ion , as well as t o t a l in tens i ty , m a y a f f ec t the Isc o f the cell. Our mode l ing w o r k [ 3 ] has s h o w n t h a t d i f fe rences as large as 8% in the n o r m a l i z e d Isc are possible wi th in the l imits: AM 1.0 - 2.0; w a t e r vapor , 1 - 4 cm; tu rb id i ty , 0.1 - 0 .27 a t 0.5 p m wave length . Even larger d i f fe rences in no rma l i zed Is¢ owing to spec t ra l e f fec t s have been r e p o r t e d by C annon e t al. [4] depend ing on the cell mater ia l . Cor rec t ion curves are requ i red to r educe the er rors in the no rma l i ze d I~c (used in r e fe rence cell ca l ibra t ion n u m b e r s ) t h a t are due to spec t ra l e f fec ts . These c o r r e c t i o n curves m u s t be der ived for all cells wi th d i f f e ren t spec t ra l re- sponses (d i f fe ren t mater ia l s , f ab r i ca t ion processes etc . ) and for d i f f e ren t com- b ina t ions o f air mass , t u r b i d i t y and wa te r vapor .
In s u m m a r y , careful cons ide ra t ion m u s t be given to spect ra l i r radiance n o r m a l i z a t i o n p r o c e d u r e s to assure realist ic resul ts conce rn ing cell pe r fo r - m a n c e analyses . Spec t ra l d i s t r ibu t ion and to t a l in tens i ty are re la ted and b o t h d e p e n d on air mass and a t m o s p h e r i c cond i t ions . T h e r e f o r e no rma l i za t i on of spec t r a using a c o n s t a n t mul t ip l i e r across all wave leng ths can resul t in unreal- istic spec t ra l d i s t r ibu t ions t h a t cou ld resu l t in unreal is t ic cell p e r f o r m a n c e character is t ics .
1 R. E. Bird, R. L. Hulstrom and L. J. Lewis, Terrestrial solar spectral data sets, Sol. Energy, 30 (1983) 563 - 573.
2 R. E. Bird and R. L. Hulstrom, Additional solar spectral data sets, Sol. Cells, 8 (1983) 85 - 95.
3 R. E. Bird and R. L. Hulstrom, Extensive modeled terrestrial solar spectral data sets with solar cell analysis, SERI Tech. Rep. TR-215-1598, 1982 (Solar Energy Research Institute, Golden, CO).
4 T. W. Cannon, C. J. Riordan and R. L. Hulstrom, PV device performance calculations from measured indoor and outdoor spectra, Proc. 17th Photovoltaic Specialists' Conf., IEEE, New York, 1984, pp. 705 - 708.