normalization detection scheme for high-speed optical frequency-domain imaging and reflectometry
TRANSCRIPT

Normalization detection scheme for high-speed optical frequency-domain imaging and
reflectometry Sucbei Moon and Dug Young Kim
Department of Information and Communications, Gwangju Institute of Science and Technology, Buk-gu, Gwangju, Republic of Korea 500-712
Abstract: We introduce a new signal detection method that can effectively suppress the effect of relative intensity noise (RIN) in optical frequency-domain reflectometry or imaging (OFDR/OFDI) schemes to enhance the sensitivity and dynamic range. In this method, spectral interferogram signal is normalized digitally by a spectral reference signal that contains the real-time spectrum and the RIN information of the frequency-swept source. Unlike the conventional balanced detection method that suppresses only additive intensity noises, we found that our proposed scheme removes both the additive and convolutional contributions of the RINs in the final interferogram signals. Experimental demonstrations were performed using a stretched-pulse optical coherence tomography (SP-OCT) system where the high RIN of a supercontinuum source had been a serious drawback. We have experimentally verified the superiority of our proposed scheme in terms of its improved dynamic range in comparison to the balanced detection method. In addition, we have shown that the noise suppression performance is immune to the spectral imbalance characteristics of the optical components used in the system, whereas the common-mode noise rejection of the conventional balanced detection method is influenced by them.
©2007 Optical Society of America OCIS code: (170.4500) Optical coherence tomography; (110.4500) Optical coherence tomography; (120.3180) Interferometry, (030.4280) Noise in imaging systems.
References and links
1. C. C. Rosa and A. Gh. Podoleanu, “Limitation of the achievable signal-to-noise ratio in optical coherence tomography due to mismatch of the balanced receiver,” Appl. Opt. 43, 4802-4815 (2004).
2. A. Rollins and J. Izatt, “Optimal interferometer designs for optical coherence tomography,” Opt. Lett. 24, 1484-1486 (1999).
3. A. Gh. Podoleanu, “Unbalanced versus balanced operation in an optical coherence tomography system,” Appl. Opt. 39, 173-182 (2000).
4. S. H. Yun, B. J. Tearney, J. F. de Boer, N. Iftimia and B. E. Bouma, “High-speed optical frequency-domain imaging,” Opt. Express 11, 2953-2963 (2003).
5. R. Huber, M. Wojtkowski and J. G. Fujimoto, “Three-dimensional and C-mode OCT imaging with a compact, frequency swept laser source at 1300 nm,” Opt. Express 13, 10523-10538 (2005).
6. R. Huber, M. Wojtkowski and J. G. Fujimoto, “Fourier Domain Mode Locking (FDML): A new laser operating regime and applications for optical coherence tomography,” Opt. Express 14, 3225-3237 (2006).
7. R. Huber, Desmond C. Adler and J. G. Fujimoto, “Buffered Fourier domain mode locking: unidirectional swept laser sources for optical coherence tomography imaging at 370,000 lines/s,” Opt. Lett. 31, 2975-2977 (2006).
8. D. C. Adler, R. Huber and J. G. Fujimoto, “Phase-sensitive optical coherence tomography at up to 370,000 lines per second using buffered Fourier domain mode-locked lasers,” Opt. Lett. 32, 626-628 (2007).
9. Y. Zhang, B. Cense, J. Rha, R. S. Jonnal, W. Gao, R. J. Zawadzki, J. S. Werner, S. Jones, S. Olivier, and D. T. Miller, “High-speed volumetric imaging of cone photoreceptors with adaptive optics spectral-domain optical coherence tomography,” Opt. Express 14, 4380-4394 (2006).
#85595 - $15.00 USD Received 23 Jul 2007; revised 14 Oct 2007; accepted 28 Oct 2007; published 31 Oct 2007
(C) 2007 OSA 12 November 2007 / Vol. 15, No. 23 / OPTICS EXPRESS 15129

10. B. Povazay, K. Bizheva, A. Unterhuber, B. Hermann, H. Sattmann, A. F. Fercher, W. Drexler, A. Apolonski, W. J. Wadsworth, J. C. Knight, P. St. Russell, M. Vetterlein and E. Scherzer, “Submicrometer axial resolution optical coherence tomography,” Opt. Lett. 27, 1800-1802 (2002).
11. R. Leitgeb, C. K. Hitzenberger and A. F. Fercher, “Performance of Fourier domain vs. time domain optical coherence tomography,” Opt. Express 11, 889-894 (2003).
12. M. Choma, M. Sarunic, C. Yang, and J. Izatt, “Sensitivity advantage of swept source and Fourier domain optical coherence tomography,” Opt. Express 11, 2183-2189 (2003).
13. J. F. de Boer, B. Cense, B. H. Park, M. C. Pierce, G. J. Tearney and B. E. Bouma, “Improved signal-to-noise ratio in spectral-domain compared with time-domain optical coherence tomography,” Opt. Lett. 28, 2067-2069 (2003).
14. S. Moon and D. Y. Kim, “Ultra-high-speed optical coherence tomography with a stretched pulse supercontinuum source,” Opt. Express 14, 11575-11584 (2006).
15. K. Takada, K. Yukimatsu, M. Kobayashi and J. Noda, “Rayleigh backscattering measurement of single-mode fibers by low coherence optical time-domain reflectometer with 14 μm spatial resolution,” Appl. Phys. Lett. 59, 143-145 (1991).
16. M. Bashkansky, M. D. Duncan, J. Reintjes and P. R. Battle, “Signal processing for improving field cross-correlation function in optical coherence tomography,” Appl. Opt. 37, 8137-8138 (1998).
17. J. F. de Boer, C. E. Saxer, and J. S. Nelson, “Stable Carrier Generation and Phase-Resolved Digital Data Processing in Optical Coherence Tomography,” Appl. Opt. 40, 5787-5790 (2001).
18. R. Tripathi, N. Nassif, J. S. Nelson, B. H. Park and J. F. de Boer, “Spectral shaping for non-Gaussian source spectra in optical coherence tomography,” Opt. Lett. 27, 406-408 (2002).
19. M. Szkulmowski, M. Wojtkowski, T. Bajraszewski, I. Gorczynska, P. Targowski, W. Wasilenwski, A. Kowalczyk, C. Radzewicz, “Quality improvement for high resolution in vivo images by spectral domain optical coherence tomography with supercontinuum source,” Opt. Commun. 246, 569-578 (2005).
20. S. Moon and D. Y. Kim, “Generation of octave-spanning supercontinuum with 1550-nm amplified diode-laser pulses and a dispersion-shifted fiber,” Opt. Express 14, 270-278 (2006).
21. M. Kunt, “Chapter 3. The discrete Fourier transformation” in Digital signal processing (Artech House, Inc., Massachusetts, 1986).
22. Y. Park, T. -J. Ahn, J. -C. Kieffer, and J. Azaña, “Optical frequency domain reflectometry based on real-time Fourier transformation,” Opt. Express 15, 4597-4616 (2007).
1. Introduction
Sensitive optical measurement techniques demand stable light sources or effective signal processing methods to avoid noise effects in the final measurement results. Like other optical measurement methods based on interferometry techniques, the optical coherence tomography (OCT) frequently relies on a conventional noise suppression method of balanced detection when the relative intensity noise (RIN) of the light source is high [1-7]. In balanced detection, the RIN is rejected selectively by balancing a pair of signals with ease due to its common-mode nature. However, it is well known that balanced detection has technical limitations in terms of its wavelength-dependent RIN rejection performance, which is observed when the optical components or optoelectronics exhibit significantly non-flat spectral responses within the spectral band of the measurements [1]. Besides, the RIN cannot be completely removed by balanced detectors even under perfect implementation conditions. It is involved with the so-called cross-beating noise that originates from the incoherent interference between the RIN of the reference arm light and that of the sample signal, which are not given in the common mode to the two photodetectors under balancing [4]. The cross beating noise does not influence the system sensitivity but can degrade the dynamic range of the measurement system. These problems of the conventional method have not received much attention so far, because light sources with low RINs are usually used in relatively narrow optical bandwidths. Therefore, the technique of balanced detection technique has been widely adopted due to its sufficient performance of noise suppression and implementation simplicity, which is supported by the availability of commercial balanced photodetectors.
The demand for higher measurement speeds and finer resolutions has driven motivation in the OCT research field for the last few years [5-10]. In particular, it is very important in some OCT applications to obtain high imaging speeds to increase the diagnosis capability with real-time 3-D analysis or the capability of capturing fast dynamics [5-9]. Extreme acquisition speeds in the order of hundreds of thousands of A-lines per second are required for real-time 3D imaging applications. It has been demonstrated that high-speed OCT imaging can be
#85595 - $15.00 USD Received 23 Jul 2007; revised 14 Oct 2007; accepted 28 Oct 2007; published 31 Oct 2007
(C) 2007 OSA 12 November 2007 / Vol. 15, No. 23 / OPTICS EXPRESS 15130

obtained by using the recently developed technique of optical frequency-domain imaging (OFDI), which is also known as swept-source OCT (SS-OCT) [4-8]. OFDI is basically a scanning version of optical frequency-domain reflectometry (OFDR) that uses a frequency-swept light source for the Fourier-domain (i.e. optical frequency-domain) measurements of the interferometric responses. This scheme makes extremely high-speed OCT possible, while the conventional time-domain OCT and spectral-domain OCT suffer from the speed limitations of the variable optical delay and the read-out rate of the array photodetector, respectively [9,10]. It also takes advantages of the higher sensitivity and wider dynamic range as a Fourier-domain OCT methodology [11-13]. R. Huber et al. demonstrated that a very high A-line rate, up to 370 kHz, can be obtained by increasing the sweeping rate of a swept laser. By using the Fourier-domain mode-locking (FDML) technique, they avoided the problems caused by the limited build-up time of laser light, which had been observed for normal swept lasers in high sweeping rates [6-8]. Recently, a totally different approach known as stretched-pulse OCT (SP-OCT) has been proposed for extremely high-speed OCT imaging, using a stretched-pulse source that replaces the swept laser sources based on rapidly tunable filters [14]. In this new scheme, a wide-band pulse stretched by a highly dispersive medium is used as a frequency-swept light for OFDI/OFDR. It was successfully demonstrated that using this method, it is feasible to obtain extremely high acquisition speeds of more than one-million A-lines per second.
It has been observed that the relatively high RINs of such high-speed swept sources, including FDML lasers and stretched-pulse sources, may limit the sensitivity and dynamic range. Even though a dual-balanced photodetector was used to suppress the RIN effect, R. Huber et al. observed that the dynamic range was still influenced by the RIN for their OCT system using an FDML laser [7]. They have developed the buffered FDML technique that utilizes selectively the backward (longer to shorter wavelength) sweeping pulses of lower RIN properties to obtain a better dynamic range without sacrificing the measurement speed. This problem of RIN-limited dynamic range has not, yet, been fundamentally solved and may limit further improvements. In SP-OCT, the RIN can be minimized potentially by using a stable mode-locked laser pulse source instead of a supercontinuum source [22]. However, using a supercontinuum pulse is more attractive in terms of the optical bandwidth, and consequently the axial resolution. But it produces a high RIN that degrades the system sensitivity and dynamic range. In our previous experiments [14], we obtained a low sensitivity of –40 dB without using a balanced detector. The balanced detection was not expected to be effective enough in that system, because the optical power transfer characteristics of the fiber-optic components are hardly uniform for a wide optical band (>200 nm in wavelength bandwidth), and consequently limit the performance of the balanced detector. Therefore, for high-speed OCT systems, it is evident that the conventional method of balanced detection is insufficient because of its technical and fundamental limitations. A more effective and smarter noise suppression method is highly desired for these high-speed OCT systems to obtain better performances with the attractive but noisy light sources.
In this paper, we propose a new noise-suppressing signal detection method to avoid the RIN effect on the system performance for high-speed OFDI/OFDR. In this method, the interferogram signal is normalized by a spectral reference signal that contains the real-time spectrum information of the source. Because the RIN of the source is common in both the interferogram and the spectral reference signal, this normalization detection can eliminate the effect of the RIN completely. Both theoretical and experimental investigations were performed to verify the various beneficial features of the proposed normalization detection method in comparison with the conventional balanced detection method. It was found that the normalization detection scheme provides superior noise suppression performance to enhance the dynamic range, as well as the sensitivity, while the balanced detection method eliminates only the noise that is involved with the sensitivity degradation. It was also verified that the proposed scheme has various additional benefits of more tolerance to the spectral imbalance and a deconvolution effect that maximizes the axial resolution for a given optical bandwidth. Because of these advantages, the normalization detection method is expected to more useful,
#85595 - $15.00 USD Received 23 Jul 2007; revised 14 Oct 2007; accepted 28 Oct 2007; published 31 Oct 2007
(C) 2007 OSA 12 November 2007 / Vol. 15, No. 23 / OPTICS EXPRESS 15131

especially for the high-speed OFDI/OFDR systems that suffer from high RINs. In this research, we have also developed an advanced method of digital balanced detection additionally, to overcome the problem of wavelength dependence in common-mode rejection, which is a serious obstacle in the conventional balanced detection method based on analog electronics.
2. Theory
In this section, we will present a theoretical framework to analyze the effect of RIN in spectral interferometry, and will describe our proposed suppression methods. After describing the RIN-related OCT noise sources, we will introduce two different digital-domain approaches to suppress them: digital balancing and digital normalization. By comparing these two approaches, we will conclude that the normalization method is superior in various aspects. The theoretical descriptions provided in this section are not limited to high-speed OFDI/OFDR systems but may be generalized to most optical frequency-domain interferometric techniques.
2.1 Signals and noises in spectral interferometry
Fig. 1. Schematic diagram of a model OFDI/OFDR system utilizing a frequency-swept light source. Photodetectors, PD1 and PD2, detect the complementary spectral interferograms while PD0 detects the spectral reference signal.
Figure 1 shows a schematic diagram of a model OFDI/OFDR system utilizing a frequency-swept light source. A small amount of the source output is tapped and directly detected by a photodetector, PD0. The remainder of the source output is fed into the sample arm and the reference arm of a Michelson interferometer constructed by a fiber coupler. The optical signals reflected by a sample and fixed reference mirror are recombined and as a result of interference, form spectral interferograms that can be detected by a photodetector at the transmitted port, PD1 or a photodetector at the reflected port, PD2. The backward propagating interferogram signal at the reflected port is selectively extracted by using an optical circulator located at the port without any significant loss. Photocurrent signals detected by PD0, PD1 and PD2 are digitized independently in this system. The reflection power of the reference arm is usually adjusted to maximize the sensitivity [4]. Optical reflectometry or OCT based on a Mach-Zehnder interferometer with an optical circulator is also popular, because of its high sensitivity owing to the power-saving nature of a Mach-Zehnder interferometer [2, 4]. Here, we consider a measurement system with a Michelson interferometer, but the same description can be applied to a system based on a Mach-Zehnder interferometer.
In OFDI/OFDR, a time-domain interferogram detected by a photodetector is transformed into frequency-domain data, using the frequency-sweeping characteristics of the swept source. Thus, the properties of the signal and noise in the time domain coincide with those in the spectral domain or optical frequency domain. The photocurrent, i0 of the spectral signal detected by PD0 can be written as
#85595 - $15.00 USD Received 23 Jul 2007; revised 14 Oct 2007; accepted 28 Oct 2007; published 31 Oct 2007
(C) 2007 OSA 12 November 2007 / Vol. 15, No. 23 / OPTICS EXPRESS 15132

)()()(
)()( 0
00 λλ
λνλη
PTh
qti ⋅= (1)
where η0 is the quantum efficiency of the photodetector, q is the electron charge, h is Planck’s constant, ν = c / λ is the optical frequency, T0(λ) is the optical power transfer function that measures optical power delivery from the source to PD0, and P(λ) is the optical power spectrum of the source as a function of wavelength λ. The sweeping characteristic, λ = S(t) as a function of time, t, needs to be calibrated for the time-to-wavelength conversion. The signal of i0 is termed the spectral reference because it contains the spectral information of the source to be referred. Assuming that there is a single reflection point in a sample for simplicity, PD1 and PD2 simultaneously detect the sinusoidal spectral fringes. The reflection point can be characterized by its complex reflectance, r⋅exp(jϕ) and its axial position or single-pass optical path length difference, z0 with respect to the path length of the reference arm. Then, the photocurrents of the spectral signals detected by PD1 and PD2, respectively, can be written as
⎥⎦
⎤⎢⎣
⎡ +⋅++= )2cos()()()(2)()()()()( 0112
111
1 ϕλλλλλλλν
ηkzrPTTrPTPT
h
qti srsr (2)
⎥⎦
⎤⎢⎣
⎡ +⋅−+= )2cos()()()(2)()()()()( 0222
222
2 ϕλλλλλλλν
ηkzrPTTrPTPT
h
qti srsr (3)
where η1 is the quantum efficiency of PD1, η2 is the efficiency of PD2, Tr1 is the power transfer function from the source to the PD1 via the reference arm, Ts1 is the transfer function to the PD1 via the sample arm, Tr2 is the transfer function to the PD2 via the reference arm, Ts2 is transfer function to the PD2 via the sample arm, and k=2π/λ is the radial wave-number, respectively. The cosine fringes in the above equations have opposite sign so that these two signals are complementary to each other. The first and second terms in Eq. (2) and Eq. (3) correspond to the spectral amplitudes that come from the reference mirror and the sample without cross interference, respectively. The third terms correspond to the cross-beating interference pattern between the two signals, which contains the desired information of reflectance and position of the reflection point. After Fourier-transforming the acquired spectral data from the wave-number (k) domain to the length (z) domain, the reflection information can be explicitly plotted in the length domain. Thus, the significant parts of Eq. (2) and Eq. (3) are commonly ±r⋅cos(2kz0+ϕ), which form a single point at a position of z=2⋅z0 with a complex amplitude of r⋅exp(jϕ) after the transformation.
The noise of the spectral interferometer appears as spectral fine structures of the source spectrum, P(λ), before the Fourier transformation. Whether it is deterministic or random, the non-smoothness of the source spectrum plays a role of a noise source. These spectral fine structures also appear to be a RIN in the time domain for a frequency-swept source. Notice that any RIN is interpreted as a spectral noise after the coordinate conversion of λ = S(t), even when a part of the RIN is not physically involved with the spectral properties. A swept source generates frequency-swept optical pulses repeatedly, and measurement of an A-line is completed during a pulse period (sweep period). Thus, the spectral noise is the variation in intensity within a pulse for the swept source. The spectrum of a single swept pulse can be divided into two parts and expressed as P(λ)={P0(λ)+δ(λ)P0(λ)}, where P0(λ) is the fixed average spectrum and δ(λ) is the randomly varying relative spectral noise. In the time domain before the time-to-wavelength conversion, P0(λ) appears as the average intensity, and δ(λ) appears as the RIN. Notice that the non-smoothness of P0(λ) also contributes to generating noisy patterns as a fixed deterministic noise. In this paper, the RIN often refers to all the intensity variations inside a single sweep, including this fixed noise. Therefore, it should be stressed that the appearance of P(λ) in the terms of Eqs. (1), (2), and (3) suggests that it acts
#85595 - $15.00 USD Received 23 Jul 2007; revised 14 Oct 2007; accepted 28 Oct 2007; published 31 Oct 2007
(C) 2007 OSA 12 November 2007 / Vol. 15, No. 23 / OPTICS EXPRESS 15133

as a RIN-involved noise source, because the RIN resides inside P(λ). The noise profile pattern that P(λ) makes after the transformation is simply F{P(λ)} where F{~} denotes the Fourier transformation (k(λ) → z). Thus, the key point in the noise suppression method is how to eliminate the contribution of P(λ) in preserving the desired part of ±r⋅cos(2kz0+ϕ) in the measured interferogram data.
For the detected spectral signals expressed as Eq. (2) and Eq. (3), the noise sources can be classified term-by-term into three different types: (i) additive static, (ii) additive dynamic and (iii) convolutional dynamic. For example, when η1, η2, Tr1, Tr2, Ts1 and Ts2 are assumed to be constant functions of k(λ) for simplicity, the Fourier transformations of the detected photocurrent signals of Eqs. (2) and (3) can be represented as
{ } 211 1 1 1 1 0( ) ( ) 2 ( ) ( 2 )j
r s r sk z
qF i T P z T r P z T T re P z z z
hϕη δ
ν→⎡ ⎤= ⋅ + ⋅ + ⋅ ⊗ −⎣ ⎦
� � � (4)
{ } 222 2 2 2 2 0( ) ( ) 2 ( ) ( 2 )j
r s r sk z
qF i T P z T r P z T T re P z z z
hϕη δ
ν→⎡ ⎤= ⋅ + ⋅ − ⋅ ⊗ −⎣ ⎦
� � � (5)
where ⊗ and ( )P z� denote the convolution operator and F{P(k)}, respectively. Notice that
( )P z� contributions in Eqs. (4) and (5) generate fake reflectivity patterns in the length domain and can be regarded as noise sources that originate from the intensity noise of the source. Because the Fourier transformation is a linear process, the additive contributions of the RIN of P(λ) in the first and second terms of Eq. (2) and Eq. (3) also appear to be additive to the desired reflectance profile after the transformations as shown in Eq. (4) and (5). The noise generated by the first term is static, in that its amplitude is independent of the sample reflection. This static noise determines the minimum observable sample reflectivity i.e. the sensitivity of the system, when the RIN is the dominant noise source of the system. On the other hand, the noise generated by the second term is dynamic, in that its amplitude is proportional to the sample reflectivity, r2. This dynamic noise can influence the dynamic range of the system as weak reflection points become invisible in the presence of strong reflection points. The noise amplitudes generated by the second terms of Eq. (2) and (3) are usually small, compared to the amplitude of the fringe patterns, because the reflectivity of a typical sample is low enough in most cases. These two additive noise sources (additive static and additive dynamic) of the first and second terms in Eq. (2) and (3) have been called self-beating RINs in that they are generated by the individually automatic beating effects of the sample-reflected field and the reference field [4]. On the other hand, the noises originating from the third terms of Eq. (2) and (3) have a different nature from that of the additive noises. Because the source spectrum, P(λ) is multiplied by the desired significant part of r⋅cos(2kz0+ϕ), the product of these two appears to be a convolution of F{P(λ)} and F{r⋅cos(2kz0+ϕ)} after the transformation. This convolutional noise is also a dynamic noise and only affects the dynamic range of the system. The noise pattern generated by this convolutional noise source is shifted by the sample position in the length domain (
0 0( ) ( 2 ) ( 2 )P z z z P z zδ⊗ − = −� � ), as the convolution relationship implies. This noise source
has been called cross-beating RIN in that it is produced by the mutual interference of the sample-reflected field and the reference field [4].
2.2 Digital balanced detection
Since the raw signal detected by PD1 or PD2 contains such various RIN-related noise sources, a signal processing method for noise subtraction is required to be applied before the Fourier transformation to minimize the resultant noise. A popular conventional method is to balance the two complementarily fringed photocurrent signals by using analog electronics before being digitized. The common-mode nature of the additive noises enables noise
#85595 - $15.00 USD Received 23 Jul 2007; revised 14 Oct 2007; accepted 28 Oct 2007; published 31 Oct 2007
(C) 2007 OSA 12 November 2007 / Vol. 15, No. 23 / OPTICS EXPRESS 15134

suppression by subtracting the two photocurrent signals. In this method, a differential signal of Δi={i1(λ)−i2(λ)} is obtained from the photodetector signals, i1(λ) and i2(λ). When η1⋅Tr1 ≅ η2⋅Tr2 holds for the full optical band, only the spectral interferogram fringes of the third terms in Eq. (2) and (3) remain effectively after being balanced, neglecting the additive dynamic noise of the second term. However, there is a technical problem in achieving a high common-mode rejection ratio because optical components usually exhibit wavelength-dependent transfer characteristics (η1⋅Tr1 / η2⋅Tr2 ≠ 1) and cause a spectral imbalance between the two complementary interferogram signals [1]. We have considered a digital processing technique to overcome this problem by calibrating the spectral imbalance characteristics. The problem associated with the spectral imbalance in balanced detection can be effectively eliminated by using a spectral imbalance function, defined as C12(λ) ≡ (η1⋅Tr1 ) / (η2⋅Tr2). A digitally balanced signal with the complementary interferograms (Balancing I), Sc
balanc, is defined as
222
1112121 )()()( i
T
TiiCiS
r
rcbalanc ⋅⎟⎟
⎠
⎞⎜⎜⎝
⎛−=⋅−≡
ηηλλλ . (6)
For a single reflection point, this balanced signal can be expressed as
⎥⎥⎦
⎤
⎢⎢⎣
⎡+⋅⎟⎟
⎠
⎞⎜⎜⎝
⎛++⋅⎟⎟
⎠
⎞⎜⎜⎝
⎛−= )2cos(2 0
2
2111
2
2
211
1 ϕν
ηkzrP
T
TTTTrP
T
TTT
h
qS
r
srsr
r
srs
cbalanc (7)
from Eq. (2) and Eq. (3). For a weakly reflecting point, the first term of the additive dynamic noise in Eq. (7) can be neglected because r2 <<r holds as well as (Ts1 — Tr1Ts2/Tr2) is usually small. The spectral imbalance function of C12(λ) can be calibrated by using a simple relation of
02
112 )(
=
=r
i
iC λ (8)
which denotes the ratio of the photocurrents under no reflection from the sample arm. This suggests that the imbalance function can be calibrated frequently without any additional cost.
Unlike the dual-balanced detection scheme, where both the interferometer and the photodetector are balanced together, signal balancing can be also carried out by acquiring the spectral reference signal, i0(λ). By introducing another spectral imbalance function, defined as C10(λ)≡(η1⋅Tr1 )/(η0⋅Tr0), a digitally balanced signal with the spectral reference (Balancing II) can be obtained as
000
1110101 )()()( i
T
TiiCiS
r
rsrbalanc ⋅⎟⎟
⎠
⎞⎜⎜⎝
⎛−=⋅−≡
ηηλλλ . (9)
From Eq. (1) and Eq. (2), this can be expressed as
⎥⎦
⎤⎢⎣
⎡ +⋅+= )2cos(2 0112
11 ϕν
ηkzrPTTrPT
h
qS srs
srbalanc (10)
for a single reflection point. The spectral imbalance function of C10(λ) can also be easily calibrated as
00
110 )(
=
=r
i
iC λ . (11)
#85595 - $15.00 USD Received 23 Jul 2007; revised 14 Oct 2007; accepted 28 Oct 2007; published 31 Oct 2007
(C) 2007 OSA 12 November 2007 / Vol. 15, No. 23 / OPTICS EXPRESS 15135

For a weakly reflecting point, the first term in Eq. (10) is also very small, because r2 <<r. Even though the reduction in the dynamic range due to the additive dynamic noise source of the first term is not always negligible, the convolutional noise due to the second term in Eq. (10) is always even higher than the additive noise for a weakly reflecting point. Therefore, the dynamic range must be determined by the convolutional noise sources in those two methods of digital signal balancing (Balancing I and Balancing II). When a 3-dB coupler is used in the interferometer, the amplitude of the cosine fringe is twice as high in the dual-balanced detection method (Balancing I) than in the simple balanced detection method (Balancing II). However, there is no difference between the two methods in terms of their dynamic ranges, because the amplitude of the convolutional noise that determines the dynamic range in most cases, is proportional to the fringe amplitude.
The digital balancing methods show a fundamental upper limit in noise suppression performance for all types of noise suppression methods based on signal subtraction techniques. If the quantization noise in the digitizing process is negligible, the digital balancing methods can provide nearly ideal characteristics, regardless of problems associated with the spectral imbalances. However, such subtraction processes can suppress only the common-mode additive noise, leaving the convolutional dynamic noise unaffected.
2.3 Digital normalization detection
Since the convolutional noise is multiplied to the desired fringe signal in the spectral domain, normalizing (i.e. numerically dividing) the measured signal by the spectral noise can eliminate the convolutional noise. Spectral normalization can be accomplished by measuring the spectral reference that contains the RIN. We introduce a normalized signal, Snorm (Normalization I) as
0
1
11
00
0
1
10
1i
i
T
T
i
i
CS
rnorm ⋅⎟⎟
⎠
⎞⎜⎜⎝
⎛=⋅⎟⎟
⎠
⎞⎜⎜⎝
⎛≡
ηη
. (12)
For a single sample reflection point, the normalized signal can be written as
)2cos(21 01
12
1
1 ϕ+⋅++= kzrT
Tr
T
TS
r
s
r
snorm (13)
from Eq. (1) and Eq. (2). This normalized signal is a dimensionless signal without any P(λ) contribution to it. Therefore, the RIN does not affect this normalized signal. For a weakly reflecting point with r2<<r, the normalized signal, itself is the cosine fringe biased by a value of one. The normalized signal can be redefined as
)2cos(21 01
1 ϕ+⋅≈−≡′ kzrT
TSS
r
snormnorm (14)
to remove the bias that generates a fixed fake signal at the zero-depth point after the Fourier transformation. Note that the optical transfer functions of Ts1 and Tr1 are usually slowly varying functions of wavelength and have nearly identical characteristics due to the symmetric coupling properties of a fiber coupler. Thus, Ts1 /Tr1 can be considered to be nearly constant in most cases. Because only a small portion of the source power is required for measuring the spectral reference, the sensitivity of the system is not degraded significantly by the spectral reference acquisitions for the normalization detection. On the other hand, there are additional benefits of the normalization detection method over the digital balanced detection methods. The noise suppression performance of the normalization detection method is not subject to the accuracy of the spectral imbalance calibration, unlike the digital balanced detection is. Inaccurate calibration only makes a fixed fake signal in the vicinity of the zero-depth point, because the spectral imbalance functions are also slowly varying (low-frequency)
#85595 - $15.00 USD Received 23 Jul 2007; revised 14 Oct 2007; accepted 28 Oct 2007; published 31 Oct 2007
(C) 2007 OSA 12 November 2007 / Vol. 15, No. 23 / OPTICS EXPRESS 15136

functions in most cases. In addition, there is no effect of the variation in the signal amplitude (reflectivity) that originates from the slowly varying (pulse-to-pulse) changes in the source power. This feature may be important in some quantitative analysis applications where high precision is required in measuring a sample’s reflectivity quantitatively. Therefore, it can be said that the normalization detection presents a nearly ideal signal that we can obtain from the spectral interferometer in principle.
This technique of digital normalization detection is similar to the digital spectral shaping methods that had been developed previously for time-domain OCT [16-18] and Fourier-domain OCT [19]. In these digital spectral shaping methods, the detected signals are normalized by the source spectrum obtained as calibration data. Whether the spectral information of the source is obtained in advance of the sample measurements [16-17] or whether it is obtained simultaneously [18], these methods rely on the time-averaged or adjacent-point-averaged data of the spectral information. The random noise should either be minimized in the calibration data by the averaging processes or the source spectrum should be extremely stable and repeated. Thus, these kinds of spectral shaping processes do not suppress any random noise, but eliminates the spurious structures, i.e. the deterministic sidelobes caused by the fixed spectral structure of a source spectrum. In contrast, our proposed scheme of normalization detection is a noise suppression technique. In this method, the spectral signals should be normalized by the real-time spectra of the source that contains RIN, or namely, the randomly varying spectral fine structures. This method can be understood as an active digital spectral shaping that is based on real-time reference spectrum measurements. Of course, the proposed digital normalization scheme gives the effect of spectral shaping as well as suppressing the RIN-involved noise. This feature suggests that the normalization detection scheme also eliminates the demands of Gaussian-like spectra for the sources.
Our normalization detection scheme can cooperate with the conventional dual-balanced detection scheme. There are many advantages of using dual-balanced signals in a normalization detection scheme. The fringe amplitude is amplified up to 200% by subtracting two complementary interferograms in the dual-balanced detection. A sensitivity gain of up to 3 dB is expected because of the power-saving nature. Besides, the self-interference noise, which is also known as autocorrelation noise in OCT, can be reduced by the dual-balanced detection. Multiple reflection points of a sample can produce cross-beating interferences between reflected signals of the sample by themselves. So-called ghost images are frequently observed due to strong signal reflection at the interface between air (n = 1) and a sample (n ≈ 1.4). Thus, it appears to be attractive to take advantages of both balanced detection and normalization detection in a hybrid way. This can be accomplished by digitally normalizing the analog dual-balanced signal by the spectral reference. In this hybrid (analog plus digital) approach (Normalization II), a normalization signal can be expressed as
010
1
i
i
CS hybrid
norm
Δ⋅⎟⎟⎠
⎞⎜⎜⎝
⎛≡ (15)
where Δi≡[i1-i2]analog represents the differential photocurrent obtained by an analog dual-balanced photodetector. Even though the spectral imbalance characteristics may limit the performance of the analog balanced detection, the RIN-related noise can be suppressed successfully by digital normalization, while still keeping the benefits of the dual-balanced detection of the 3-dB SNR gain and self-interference suppression.
2.4 Comparison between balancing and normalization
In the previous subsections, we have introduced two digital balanced detection methods and two normalization detection methods using a theoretical approach. While the balanced detection schemes suppress only common-mode noise, the normalization detection schemes suppress both the additive noise and the convolutional noise. When the RIN of a light source limits the dynamic range of the system, the normalization detection schemes must be more
#85595 - $15.00 USD Received 23 Jul 2007; revised 14 Oct 2007; accepted 28 Oct 2007; published 31 Oct 2007
(C) 2007 OSA 12 November 2007 / Vol. 15, No. 23 / OPTICS EXPRESS 15137
suitable for an improved dynamic range. We have shown that the balanced detection schemes cannot completely suppress the RIN-related effects even in an ideal implementation. Our signal processing method of normalization detection provides a powerful way to alleviate the problem of RIN, and must be more suitable for high-speed OFDI/OFDR.
There are the other kinds of noise sources that are not related to the RIN of a light source. Among them, dark-current noise, shot noise and quantization noise are important in most cases. For the Fourier-domain detection, the quantization noise of a digitizer can be neglected in most cases owing to the natural benefit of the frequency-domain schemes in SNR and the dynamic range [7, 11-13]. Notice that the quantization noise can be increased significantly in digital noise suppression methods and may limit the dynamic range of the system, especially. In the analog balanced detection, only the spectral fringe without a DC component can be acquired by the digitizer to obtain a wider digitizing dynamic range, while the full waveform should be digitized in the digital-domain methods. However, in the analog balanced detection, a sinusoidal fixed waveform originating from the source’s spectrum shape still remains after being balanced in most cases due to the spectral imbalance [4]. Thus the actual difference between the analog and digital methods in terms of dynamic range of digitization is not thought to be quite large. Moreover, the reduction of dynamic range is not found in the hybrid method (Normalization II) case. However, processing two or three separately detected photocurrents may inevitably degrade the SNR by adding the dark-current and shot noises inside them. Let us assume that all the individual photodetectors in the system are identical to each other in responsivity and noise performance. Balancing two photocurrents leads to an addition of the noise power, because there is no correlation between the dark-current noises of the two photocurrents as well as the shot noises. Therefore, balancing results in a noise power gain of 3 dB. On the other hand, it is possible to make the SNR of the spectral-reference measurements even higher than that of the interferogram measurements. Because measuring the spectral reference usually requires only a small portion of the total source power, the power of the spectral reference can be even higher than that of the interferogram signals. In the shot-noise limited regime, the SNR is proportional to the optical power for the spectral-reference measurements, whereas the power of the interferogram should be optimized to obtain the maximum SNR for a given source power. Therefore, we can presume that the SNR of the spectral reference can be even higher so that the noise can be neglected in processing with the interferogram signal of a finite SNR.
In Table 1, we compare the noise suppression methods proposed in this paper. The ideal SNR stands for the relative SNR in reflectivity profile under the assumption that the RIN is completely eliminated by the suppression method, hypothetically. The methods based on balancing two complementary interferograms (Balancing I and Normalization II) have the advantage of a 3-dB net SNR gain, because the fringe amplitude is doubled (+6 dB) and the noise power is also doubled (−3 dB). Both of these methods suppress the self-interference effects as well. The normalization schemes always take advantage of the improved dynamic range. So, the normalization detection techniques must be more preferable when the RIN limits the dynamic range significantly. In addition, the normalization detection methods tolerate inaccurate calibration of the spectral imbalance function (C10 or C12). After all, the hybrid method of balanced normalization (Normalization II) gives the best performance, but it requires higher cost from using three photodetectors and processing devices.
So far, we have surveyed various digital-domain noise suppression methods from a theoretical viewpoint. It is evident that the balanced detection methods cannot completely suppress the RIN-related effects, even for an ideal implementation of little or compensated spectral imbalance. Adopting a different signal processing method of the normalization detection can easily solve this problem. The normalization detection method provides with a smarter and more powerful way to alleviate the problem of high RIN and must be more suitable for high-speed OFDI/OFDR. Because Balancing II and Normalization I are based on the same raw data (i1 and i0), they can be compared directly and would show more clearly the difference between the balanced detection and normalization detection methods in terms of
#85595 - $15.00 USD Received 23 Jul 2007; revised 14 Oct 2007; accepted 28 Oct 2007; published 31 Oct 2007
(C) 2007 OSA 12 November 2007 / Vol. 15, No. 23 / OPTICS EXPRESS 15138

their fundamental performance. An experimental comparison was made between these two methods and will be described in the following sections.
Table 1. Comparison of noise suppression methods.
3. Stretched-pulse OCT system
A stretched-pulse optical coherence tomography (SP-OCT) system was constructed to evaluate the noise suppression performances of our proposed digital-domain methods. Figure 2 shows a schematic diagram of the SP-OCT system used in our experiments. A supercontinuum source, whose output spanned a wide band from 1.1 μm to more than 1.7 μm in the wavelength domain, was used as a wide-band pulsed light source. The supercontinuum generation method was the same as that in our previous reports [14, 20], in which the supercontinuum was generated by an amplified diode-laser pulse source operating at a wavelength of 1,550 nm, utilizing a dispersion-shifted fiber as a nonlinear medium. By using a short-wavelength pass filter, the supercontinuum was optically filtered to remove the long-wavelength part beyond a wavelength of 1.5 μm. The filtered supercontinuum pulse was stretched by using a 20-km long dispersion-shifted fiber (DSF) to obtain the frequency-swept properties. More detailed description of the operation principle and a technical explanation of the SP-OCT scheme can be found in our previous reports.
Additional optical parts for the spectral-reference measurements were added to our SP-OCT system in this research. A small portion of the stretched pulse’s power was tapped by using a 70:30 fiber-optic coupler, and this was used as the spectral reference, as shown in Fig. 2. The OCT interferometer was constructed by using a 50:50 fiber coupler (optimized at 1,310 nm). The spectral interferogram output of the interferometer was launched into a high-speed photodetector (PD) via another 50:50 coupler. This coupler combined the spectral interferogram and the spectral reference to be detected by the single photodetector. Because the spectral reference pulse was fiber-optically delayed by a period of 131.0 ns with respect to the interferogram pulse from the OCT interferometer, this photodetector could acquire those two signals in a time-domain multiplexing manner. In other words, the single detector played the role of two detectors, one after the other. This method of interleaved signaling saved the need for a set of photodetection sub-system composed of a trans-impedance amplifier (TIA), electric amplifier (AMP), anti-aliasing low-pass filter (LPF) and a high-speed digitizer. As a penalty, the effective measurement speed was reduced to half the maximum speed and the combining coupler abandoned half the optical power. Using more efficient combining optics, this loss could be minimized for better sensitivity. The power of the spectral reference was attenuated to ~10 dB by an optical attenuator (ATT) to maximize the digitizing dynamic range
#85595 - $15.00 USD Received 23 Jul 2007; revised 14 Oct 2007; accepted 28 Oct 2007; published 31 Oct 2007
(C) 2007 OSA 12 November 2007 / Vol. 15, No. 23 / OPTICS EXPRESS 15139

by matching the amplitude with that of the interferogram. This means that a smaller amount of power was actually required for measuring the spectral reference.
Fig. 2. Schematic diagram of the stretched-pulse OCT (SP-OCT) system used in our experiments.
Figure 3 shows the optical spectrum of the stretched-pulse source output that was
measured immediately after the 20-km DSF and the time-to-wavelength conversion function of the swept source. The time-to-wavelength conversion map was measured by inserting a monochromator in front of the photodetection sub-system. As the center wavelength of the monochromator’s pass band was tuned discretely, the relative temporal delay was measured as a function of wavelength. Thus, the chromatic dispersion of the OCT interferometer was also added to the final group-delay data as the measurement was performed for the entire system. The origin point of the time coordinate, ‘0 ns’ was set to be the temporal delay of the 1,550-nm component in Fig. 3(b). The blue solid line shows the fourth-order polynomial fit result. This fitted curve was used as the time-to-wavelength conversion function of the source for all the signal processes of this research. Owing to the nature of the chromatic dispersion of an optical fiber, the frequency-sweeping characteristics are truly stable and monotonic (of a smooth function) so that they can be easily calibrated and do not require any re-calibration in SP-OCT [14]. In our experiments, only the 200-nm wide wavelength band from 1,165 to 1,365 nm was used in the OCT signal processing for mapping accuracy, even though we could have utilized the wider optical bandwidth of the source. It should be noted that the splitting ratios of the fiber-optic couplers used in the system could not be considered to be constant over the 200-nm wide measurement band. For example, the splitting ratio of the 50:50 coupler used in our OCT interferometer was measured to deviate to 70:30 at the short-wavelength edge (1,165 nm). In this case, the spectral imbalance must have limited the common-mode rejection ratio in the balanced detection method. It provided a good opportunity for us to determine the capability of the digital noise suppression methods that are less subject to the spectral imbalance.
The repetition rate of the pulse source was 3.7 MHz (270 ns in period), which was also the A-line rate of our system. The average power of the supercontinuum was measured to be 9.1 mW after the short-wavelength pass filter and 1.1 mW after the DSF, respectively. Because of the technical loss associated with the optical components, only a low power of 0.34 mW for the full spectrum (0.24 mW for the measurement band from 1,165 to 1,365 nm) reached the sample. Considering the low duty cycle of 27% (72 ns/270 ns), the pulse peak power was estimated to be 0.89 mW for the measurement band of 1,165 to 1,365 nm. For the photodetection sub-system (PD-TIA-AMP-LPF-Digitizer), the electrical bandwidth was measured to be 1.37 GHz for the 6-dB electric power bandwidth (3-dB amplitude bandwidth).
#85595 - $15.00 USD Received 23 Jul 2007; revised 14 Oct 2007; accepted 28 Oct 2007; published 31 Oct 2007
(C) 2007 OSA 12 November 2007 / Vol. 15, No. 23 / OPTICS EXPRESS 15140

The total transimpedance of the photocurrent-voltage conversion was ~20,000 V/A. The sampling speed and the sampling depth of the digitizer (MSO-6104A, Agilent Technologies) were 4 giga-samples per second (GS/s) and 8 bits (256 levels), respectively. The reference-arm reflection power was adjusted to a few tens of microwatts by partially blocking the beam to optimize the sensitivity.
(a) (b)
Fig. 3. (a). Optical spectrum of the stretched-pulse output and (b) the time-to-wavelength conversion map. Only the 200-nm wide wavelength band from 1,165 to 1,365 nm was used in the OCT signal processing.
4. Experimental results
For digital balancing and normalization detection processing, the spectral imbalance function of C10 was calibrated carefully in advance by using Eq. (11). When there was no reflection from the sample arm, we measured the ratio of the two photocurrents: one from the reference mirror and the other from the spectral reference. Because we used an interleaved signaling technique for signal acquisition, the spectral reference data were captured after the spectral spectrogram data being acquired by the same photodetection system.
After calibrating C10(λ), or equivalently, C10(t), the basic performance of the digital signal processing method was examined. In the special case of no sample reflection (r = 0), a single-shot interferogram signal could be retrieved by using a single-shot spectral reference data. The retrieved interferogram, i′1(t) can be denoted as i′1(t) = C10(t)i0(t), and should be the same with the corresponding single-shot interferogram i1(t) for r = 0 as Eqs. (1), (2), and (11) imply. Figure 4 shows the single-shot temporal waveform captured directly by the photodetector (green) and the corresponding retrieved (i′1=C10 i0) waveform (black) when there was no reflection from the sample arm. The difference i.e. the retrieval error, δ i={i1 − i′1} is also shown (blue). For the green waveform in Fig. 4, there were two interleaved signals: one from the interferometer and the other from the attenuated spectral reference. The foregoing pulse from 0 to 110 ns corresponds to the interferogram, i1(t), described in Eq. (2) when there was no reflected power from the sample arm (r = 0). In real SP-OCT measurement data with r ≠ 0, a spectral interference term would appear here as a fringed pattern. The trailing pulse of the waveform from 130 to 240 ns corresponds to the spectral reference signal, i0(t), measured by the same photodetection sub-system. The temporal delay between the foregoing pulse and the trailing pulse was 131.0 ns. The origin of the time coordinate was set to the arrival time of the 1,550-nm wavelength component in the foregoing pulse for each interferogram and spectral reference signal pulse pair. This wavelength component appeared as a small peak at the first rising edge. For the foregoing pulse, the instantaneous center wavelength could be recognized directly by referring to the time-to-wavelength conversion function of Fig. 3(b). For the trailing pulse, the time coordinate needed to be shifted to –131.0 ns for mapping.
#85595 - $15.00 USD Received 23 Jul 2007; revised 14 Oct 2007; accepted 28 Oct 2007; published 31 Oct 2007
(C) 2007 OSA 12 November 2007 / Vol. 15, No. 23 / OPTICS EXPRESS 15141

Fig. 4. Single-shot temporal waveform (i1 and i0) captured directly by the photodetector (green) and the corresponding retrieved (i′1=C10 i0) waveform (black) when there was no reflection from the sample arm i.e. r = 0. The difference, or retrieval error, δ i={i1 − i′1} is also shown (blue). For the measured waveform (green), the foregoing pulse (from 0 to 110 ns) and the trailing pulse (from 130 to 240 ns) correspond to the interferogram signal, i1(r=0) and spectral reference signal, i0, respectively.
As can be clearly seen in Fig. 4, the single-shot stretched supercontinuum pulse contained
a high intra-pulse RIN. The random amplitude variations in the temporal waveform correspond to the spectral variations that would generate random-pattern noise in the final OCT reflection profiles. The success of the digital noise suppression methods could be examined prior to the main experiment from the accuracy of retrieving the reference-arm contribution in the detected photocurrent from the measured single-shot spectral reference data. As demonstrated in Fig. 4, the partial waveform of the foregoing pulse, i1(t = 20~92 ns) was successfully predicted by i′1=C10 i0 with that of the trailing spectral reference, i0(t = 151~223 ns). The difference in amplitude, δ i={i1 − i′1}, or namely, the remaining static noise was found to be small as the blue line in Fig. 4 shows.
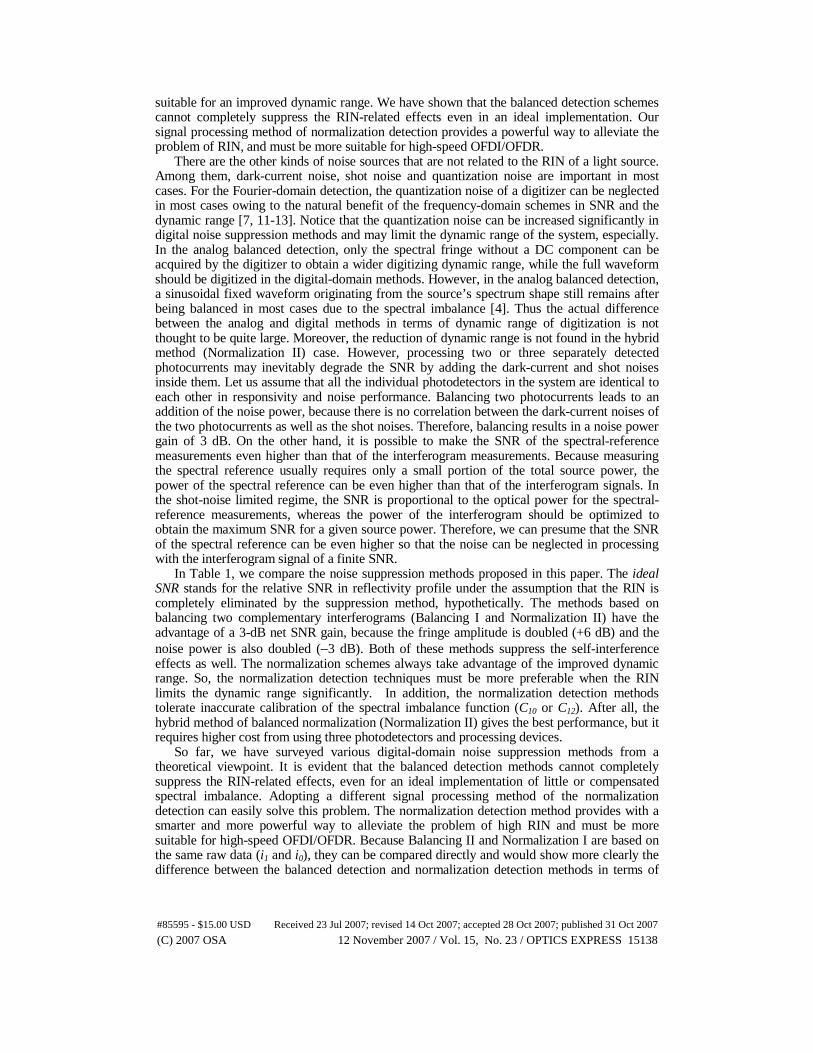
The effectiveness of the digital domain methods was also examined in detail by a modulation frequency-domain analysis. The waveforms of the raw photocurrent signal (i1) such as the first half of the green waveform in Fig. 4, the digital balanced signal (i1−C10⋅i0) and the dark current (i1 with no light input) were examined. Another signal, (i1−α⋅i0), was generated and transformed, where α is a constant that had been chosen to obtain the maximum common-mode rejection performance. This was carried out to simulate a conventional analog balanced detection signal, in which the spectral imbalance is not compensated. Figure 5 shows the power spectra of the raw current signal (i1), analog-equivalent balanced signal (i1−α⋅i0), digital balanced signal (i1−C10⋅i0) and dark current. Each spectrum was obtained by a discrete Fourier transformation (t → f=1/t), and 20 power spectra were averaged for each spectrum to evaluate the noise properties accurately. All the spectra were normalized by the zero-frequency power of the time-average photocurrent, <i1(t)>, to translate them to RIN spectra. At 500 MHz, the RIN of the stretched pulse (i1) was estimated to be –108 dB/Hz. The analog-equivalent balanced signal (i1−α⋅i0) shown by the blue dotted line exhibited a RIN suppressed by 11 dB in comparison with the raw photocurrent (i1), while the digital balanced detection (i1−C10⋅i0) suppressed the RIN by about 17 dB. This difference of 6 dB between the analog-equivalent and digital balancing schemes originated from the spectral imbalance of the interferometer and showed that the digital method can compensate for it effectively. The dark-current noise floor was just 5 dB below the noise level of the digital balanced detection. We believe that the reason why our digital balanced scheme could not obtain a better noise rejection performance is because there were some other noises sources, such as dark-current noise and shot noise in i1. Note that processing two photocurrents results in the addition of the
#85595 - $15.00 USD Received 23 Jul 2007; revised 14 Oct 2007; accepted 28 Oct 2007; published 31 Oct 2007
(C) 2007 OSA 12 November 2007 / Vol. 15, No. 23 / OPTICS EXPRESS 15142
noise power (+3 dB). This implies the actual dark-current noise floor was only 2 dB below the remaining noise for the digital balanced detection. Therefore, the obtained RIN suppression performance of the digital balanced detection is believed to be almost ideal.
Fig. 5. Modulation frequency-domain power spectra of the raw current signal (i1), analog-equivalent balanced signal (i1−α⋅i0), digital balanced signal (i1−C10⋅i0) and dark current of the photodetector. Each power spectrum was obtained by a discrete Fourier transformation and 20 spectra were averaged for each spectrum to evaluate the noise properties accurately.
As discussed theoretically in Section 2, the normalization detection methods suppress all
the RIN-involved SNR degradation effects in the spectral interferometry. In contrast, the balancing methods eliminate only the additive contribution of the RIN. We could directly compare the performances of the balancing and the normalization methods because the two signal-processing methods, the Balancing II scheme based on Eq. (9) and the Normalization I scheme based on Eq. (12), use the same raw data of the spectral reference, i0 and the spectral imbalance function, C10.
A single reflection surface of –41-dB reflectivity was used as a reference sample for the axial point-spread function (PSF) measurements. Without a noise suppression method, a single-shot interferogram for the sample was very noisy due to the high RIN of the stretched-pulse source. The noise floor was too high to determine the correct noise characteristics. To increase the SNR, 16 interferograms were taken and averaged to obtain a single axial PSF. Because of the random nature of the noise, we could expect that this waveform averaging decreased the noise by 12 dB (3 dB × log216). This averaged interferogram was converted into a function in the spectral domain by using the time-to-wavelength conversion function, and the spectral interferogram in the wavenumber domain was Fourier-transformed into the length domain after being multiplied by a window function. We used a Welch window function (parabolic window) for this purpose [21]. The length scale was divided by two, and the transformed amplitude was squared to obtain the reflectivity profile of the sample. The noise floor was also measured by removing the sample. The SNR was estimated by the ratio between the measured peak reflectivity and the noise floor as functions of the axial position.
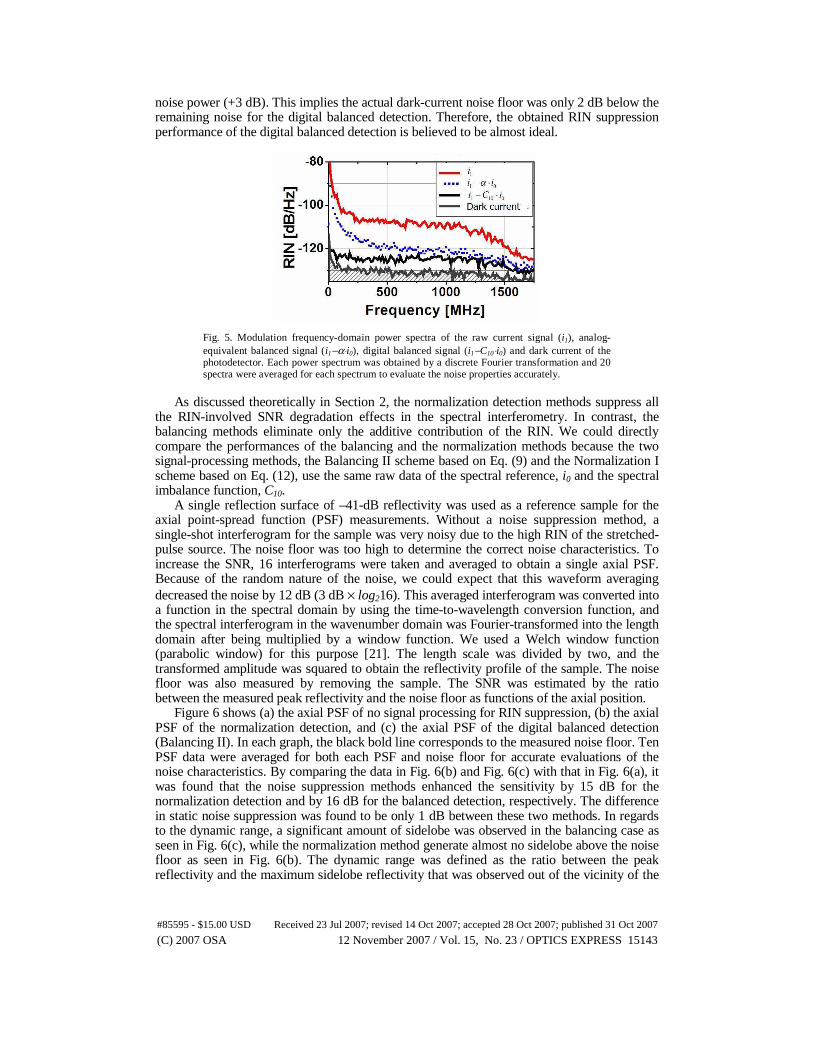
Figure 6 shows (a) the axial PSF of no signal processing for RIN suppression, (b) the axial PSF of the normalization detection, and (c) the axial PSF of the digital balanced detection (Balancing II). In each graph, the black bold line corresponds to the measured noise floor. Ten PSF data were averaged for both each PSF and noise floor for accurate evaluations of the noise characteristics. By comparing the data in Fig. 6(b) and Fig. 6(c) with that in Fig. 6(a), it was found that the noise suppression methods enhanced the sensitivity by 15 dB for the normalization detection and by 16 dB for the balanced detection, respectively. The difference in static noise suppression was found to be only 1 dB between these two methods. In regards to the dynamic range, a significant amount of sidelobe was observed in the balancing case as seen in Fig. 6(c), while the normalization method generate almost no sidelobe above the noise floor as seen in Fig. 6(b). The dynamic range was defined as the ratio between the peak reflectivity and the maximum sidelobe reflectivity that was observed out of the vicinity of the
#85595 - $15.00 USD Received 23 Jul 2007; revised 14 Oct 2007; accepted 28 Oct 2007; published 31 Oct 2007
(C) 2007 OSA 12 November 2007 / Vol. 15, No. 23 / OPTICS EXPRESS 15143

peak (>50 μm far from the peak). The dynamic range was estimated to be 30 dB for the digital balanced detection as seen in Fig. 6(c). For the normalization, the results in Fig. 6(b) were obviously limited by the static noise, and were not suitable for determining the dynamic range. We examined the dynamic range of the normalization detection by measuring a PSF of another reference sample with a higher reflectivity of –21 dB. The dynamic range was measured to be –47 dB for the normalization detection scheme. These results clearly verify that the normalization detection method exhibits superior performance in terms of its dynamic range.
Fig. 6. (a). Axial PSF of no signal processing for RIN suppression, (b) that of the normalization detection, and (c) that of the digital balanced detection (Balancing II). In each graph, the black bold line corresponds to the measured noise floor.
In addition, the effect of possible errors associated with calibrating the spectral imbalance
function was also investigated. After changing the imbalance function to an incorrect function, C10(λ) = 1 for all the wavelengths, the same signal processing was performed to the data. The SNR degraded to –4 dB in the balanced detection scheme and to –1 dB in the normalization detection case, respectively. It showed that the normalization detection is less subject to the calibration accuracy of the spectral imbalance in contrast to the digital balanced detection scheme. Therefore, calibration of the spectral imbalance function is not always necessary for normalization detection.
More properties and performance characteristics of the normalization detection were investigated further. We obtained axial PSFs with single-shot data to find the OCT performances in ultra-high speed measurements. Figure 7 shows (a) the PSFs based on single-shot data obtained without averaging for an A-line rate of 3.7 MHz and (b) the SNR/resolution performance along the axial position, using the normalization detection method. Each PSF was taken with a single reflection surface of –41-dB reflectivity, which was translated discretely along the axial direction by ~50 μm, step by step. The normalized signal was multiplied by a Welch window function before discrete Fourier transformations. As shown in Fig. 7, both the SNR and resolution were functions of the axial position. The SNR was significantly decreased after a certain depth point. Because of the finite bandwidth i.e. the considerably long response time of the photodetection sub-system used in our SP-OCT system, the fringes of the high modulation frequencies for the deep reflection points could not be acquired effectively by our system. The 6-dB SNR range was estimated to be 0.42 mm as seen in Fig. 7(b). The depth range can be improved by either increasing the bandwidth of the photodetection sub-system or using a dispersive medium with a higher group-velocity dispersion, such as a long chirped fiber Bragg grating device, as Y. Park et al. has demonstrated recently [22].
#85595 - $15.00 USD Received 23 Jul 2007; revised 14 Oct 2007; accepted 28 Oct 2007; published 31 Oct 2007
(C) 2007 OSA 12 November 2007 / Vol. 15, No. 23 / OPTICS EXPRESS 15144

Fig. 7. (a). PSFs based on single-shot data obtained without averaging for an A-line rate of 3.7 MHz and (b) the SNR/resolution performance along the axial depth, using the normalization detection method. The black bold line in the left-hand side graph corresponds to the noise floor.
The peak sensitivity was measured to be –68 dB at z = 180 μm. The theoretical sensitivity
limit was calculated to be –86 dB, when the effective sweep rate was 1/(72 ns)= 13.1 MHz, the sample-arm power was 0.89 mW, and the optical frequency was 237 THz [4]. We have assumed that the quantum efficiency of the photodetector was 100% in our calculations. The actual difference between the measured sensitivity value and the theoretical limit was estimated to be just 10 dB, considering the measured technical loss of 8 dB from the sample to the detector. Even though the measured sensitivity may not be considered to be sufficient for imaging biological samples, it is expected that we can obtain higher sensitivities by simply increasing the optical power and averaging the A-line data i.e. lowering the effective sweep rate. For example, the measured sensitivity of –68 dB is theoretically equivalent to –95 dB for the conditions (A-line rate and optical power) of R. Huber et al.’s experiments reported in Ref. 7. They obtained a sensitivity of –98 dB with a buffered FDML laser of a 370-kHz sweep rate with 12 mW incident average power. This suggests that the noise performance of an SP-OCT can become potentially comparable to that of a conventional OCT in terms of its sensitivity and dynamic range by adopting the digital normalization method.
The axial resolution was also degraded for the deep regions due to the same cause of the SNR degradation. The axial resolution, defined as a full width at the half maximum (FWHM, 6-dB width) in the axial position, was increased significantly as shown in Fig. 7(b). As mentioned in Section 2, the normalization detection provides an effect of spectral shaping and plays a role of deconvolution processing. The shape of the PSF does not reflect the spectral shape of the source but depends mostly on the window function used for the discrete Fourier transformation. It can be said that the spectrum was re-shaped to the window function by the detection scheme. Thus, the window function determines the measurement resolution for a given spectral bandwidth. The axial resolution was measured to be 5.0 μm for a rectangular window (i.e. no windowing) and 6.2 μm for a Welch window, respectively, for a single reflection point at z = 30 μm. For the optical bandwidth utilized in our experiments (200-nm wavelength span centered at 1,265 nm), the theoretical resolution limit was calculated to be 4.2 μm with the rectangular window and 5.5 μm with the Welch window, respectively. These results show that nearly transform-limited performance was obtained in terms of axial resolution. This implies that the normalization detection scheme makes the optical bandwidth fully utilizable owing to its deconvolution capability.
5. Conclusion
We have proposed a digital-domain noise suppression method of normalization detection to suppress RIN-involved effects on the sensitivity and dynamic range, especially for high-speed OFDI. In addition, we have also introduced a digital version of the conventional balanced detection scheme to overcome the problems involved with spectral imbalance. In a careful theoretical and experimental analysis, we have compared the normalization detection scheme
0 100 200 300 400 5008
12
16
20
24
28
5
8
11
13
16
19
Res
olut
ion
[μm
]
SN
R [d
B]
Depth [μm]
#85595 - $15.00 USD Received 23 Jul 2007; revised 14 Oct 2007; accepted 28 Oct 2007; published 31 Oct 2007
(C) 2007 OSA 12 November 2007 / Vol. 15, No. 23 / OPTICS EXPRESS 15145
with the digital balanced detection scheme that can be regarded as being the best of the suppression techniques based on signal balancing. The results have shown that the normalization detection scheme exhibits many beneficial features in various aspects, and is more suitable for high-speed OFDI/OFDR systems that use high-RIN sources. This detection scheme suppresses both the additive noise and convolutional noise simultaneously, and enhances the dynamic range as well as the system sensitivity. The noise suppression performance is not subject to the spectral imbalance and does not require a perfect calibration of the imbalance characteristics. It also plays a role of the deconvolution process so that the system can fully utilize the optical bandwidth for better axial resolution, regardless of the spectrum shape. After all, the normalization detection scheme provides improved performance in terms of sensitivity, dynamic range and axial resolution, overcoming the drawbacks of an imperfect light source and OCT interferometer. This technique will be useful in high-speed OCT systems that usually suffer from high RIN of the source as well as in high-resolution OCT systems in which wide optical bandwidths are used and, consequently, the spectral imbalance characteristics limit the performance of the conventional dual-balanced detectors. It should be noted that this technique of normalization detection can be effectively applied only to the Fourier-domain reflectometry or FD-OCT where signal detection is accomplished in the optical frequency domain. The Fourier-domain schemes are advantageous, again, in that they can adopt our proposed normalization detection technique with ease.
Acknowledgments
This work was supported by the Creative Research Initiatives (CRI) Program of Korea Science and Engineering Foundation (KOSEF) / Ministry of Science and Technology (MOST).
#85595 - $15.00 USD Received 23 Jul 2007; revised 14 Oct 2007; accepted 28 Oct 2007; published 31 Oct 2007
(C) 2007 OSA 12 November 2007 / Vol. 15, No. 23 / OPTICS EXPRESS 15146