norges bank 1 executive board meeting 15 december 2004
TRANSCRIPT

Norges Bank
1
Executive Board meeting15 December 2004

Norges Bank
2
-1
-0,5
0
0,5
1
1,5
2
2002 2003 2004
-1
-0,5
0
0,5
1
1,5
2
US
UK
Japan Euro area
GDP. Growth in volume on previous quarterPer cent. Seasonally adjusted. 02 Q1 – 04 Q3
Sources: EcoWin, Statistics Japan, National Statistics (UK), EUR-OP/Eurostat, Consensus Economics and Bureau of Economic Analysis (US)

Norges Bank
3
0
1
2
3
4
5
6
2003 2004 2005 2006
0
1
2
3
4
5
6
US
Euro area
UK
Interest rate expectationsActual developments and expected key rate at 28 October and 13 December
28 October13 December
Sources: Reuters and Norges Bank

Norges Bank
4
Core CPI/HICP in the US, the euro area and the UK12-month rise. Per cent. Jan 01 - Oct 04
0
1
2
3
4
2001 2002 2003 2004
0
1
2
3
4
UK
US1)
Euro areaUS2)
1)CPI 2) Personal consumption expenditure deflator, excluding food and energy
Sources: EcoWin/National statistics

Norges Bank
5
International effective exchange ratesIndex. 1999 = 100. Daily figures. 1 Jan 03 – 13 Dec 04
75
85
95
105
115
jan 03 mai 03 sep 03 jan 04 mai 04 sep 04 jan 05
75
85
95
105
115
Norway
UK
1)A rising curve denotes a stronger exchange rate
Sources: Bank of England/EcoWin
US
Euro area
Sweden

Norges Bank
6
Oil price Brent Blend USD per barrel. Daily figures
15
20
25
30
35
40
45
50
55
jan 02 okt 02 jul 03 apr 04 jan 05 okt 05 jul 06 apr 0715
20
25
30
35
40
45
50
55
Sources: Norges Bank, Telerate and IPE
Futures price 28 Oct (IR 3/04)
13 Dec

Norges Bank
7
Oil futures pricesUSD per barrel light crude (West Texas). Daily figures. 1 Jan 01 – 13 Dec 04
15
25
35
45
55
jan 01 aug 01 mar 02 okt 02 mai 03 des 03 jul 0415
25
35
45
55
Sources: Norges Bank and EcoWin/NYMEX
Delivery in 6-7 years
Delivery in 1 month

Norges Bank
8
-4,5
-2,5
-0,5
1,5
3,5
jul 03 okt 03 jan 04 apr 04 jul 04 okt 04 jan 05
-4,5
-2,5
-0,5
1,5
3,5
CPI-ATETotal and broken down into imported and domestically produced goods and services1). Historical price inflation and projections IR 3/04 (broken line).12-month rise. Per cent
Sources: Statistics Norway and Norges Bank
Domestically produced goods and services (0.7)
1) Norges Bank's estimates.
Imported consumer goods (0.3)
CPI-ATE

Norges Bank
9
0
1
2
3
4
jun 02 des 02 jun 03 des 03 jun 04 des 04
0
1
2
3
4
Experts' expectations of consumer price inflation 2 and 5 years aheadPer cent. Quarterly figures. 02 Q2 – 04 Q4
2 years ahead
5 years ahead
Source: TNS Gallup

Norges Bank
10
85
90
95
100
105
jan 02 jul 02 jan 03 jul 03 jan 04 jul 04
85
90
95
100
105
Since previous monetary policy meeting
1)A rising curve denotes a stronger krone exchange rate
Source: Norges Bank
Developments in the krone exchange rate1) (I-44)Daily figures. 1 Jan 02 – 14 Dec 04
Stronger exchange rate
Weaker exchange rate
Norges Bank
11
-1
0
1
2
3
4
5
6
7
jan 03 jul 03 jan 04 jul 04 jan 05 jul 05 jan 06 jul 06
-1
0
1
2
3
4
5
6
7
Sources: Reuters and Norges Bank
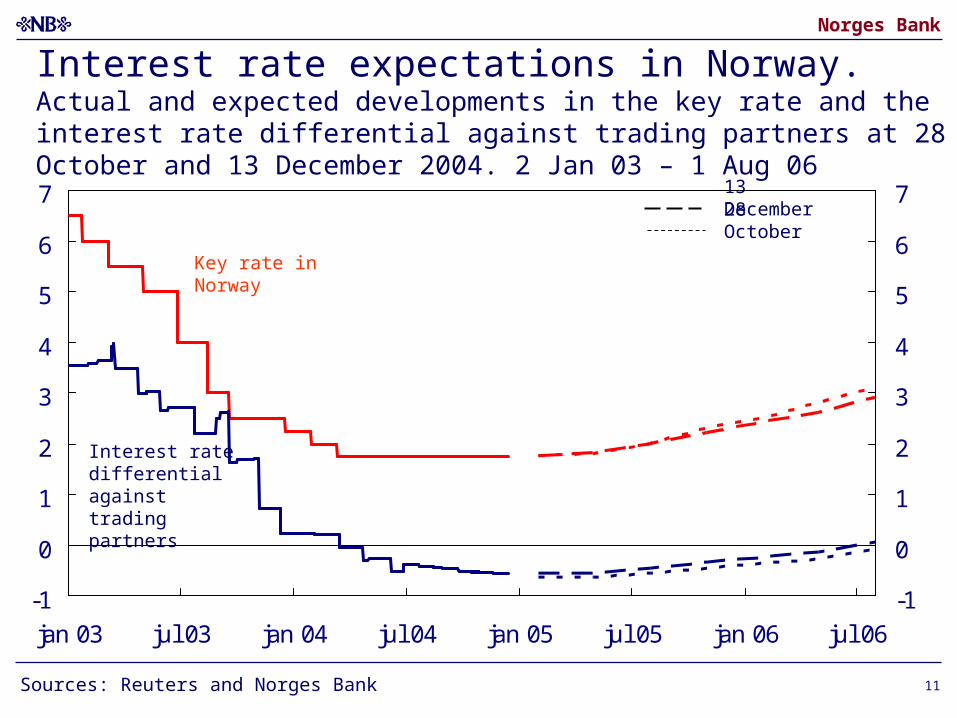
Interest rate expectations in Norway. Actual and expected developments in the key rate and the interest rate differential against trading partners at 28 October and 13 December 2004. 2 Jan 03 – 1 Aug 06
Key rate in Norway
Interest rate differential against trading partners
28 October13 December

Norges Bank
12
118
122
126
130
134
138
142
146
Jan Feb Mar Apr May June July Aug Sept Oct Nov Dec
118
122
126
130
134
138
142
146
Source: Statistics Norway
2003
2002
2004
Index of commodity consumption1995 = 100. Seasonally adjusted volume. Jan 02 - Oct 04

Norges Bank
13
-30
-15
0
15
30
45
1999 2000 2001 2002 2003 2004 2005
-30
-15
0
15
30
45
Total
Sources: TNS Gallup and Norges Bank
Consumer confidence indicatorUnadjusted figures. 99 Q1 – 04 Q4
Personal financial situation
Norwegian economy

Norges Bank
14
Overnight stays at hotelsMonthly figures. Seasonally adjusted 3-month average. Jan 01 - Sep 04
900
1000
1100
1200
1300
1400
1500
jan 86 jan 89 jan 92 jan 95 jan 98 jan 01 jan 04
900
1000
1100
1200
1300
1400
1500
Source: Statistics Norway

Norges Bank
15
Estimated and actual investment in oil and gas extraction and pipeline transport Value. In millions of NOK
20000
30000
40000
50000
60000
70000
80000
90000
100000
May Aug Nov Feb May Aug Nov Actual
20000
30000
40000
50000
60000
70000
80000
90000
100000
2002
2003
20042005
Previous year Same year Final figures
Source: Statistics Norway

Norges Bank
16
Total debt mainland Norway (C3) and domestic debt distributed between households and non-financial enterprises (C2). 12-month rise. Aug 01 – Oct 04
-3
0
3
6
9
12
15
aug.01 jan.02 jun.02 nov.02 apr.03 sep.03 feb.04 jul.04
-3
0
3
6
9
12
15
C2 non-financial enterprises
Source: Norges Bank
C3 Mainland-Norway
C2 households

Norges Bank
17
Main aggregates in quarterly national accounts and projected main macroeconomic aggregates in Inflation Report 3/04
Annual growth in 2004
Projections in IR 3/2004
Growth from first three quarters in 2003 to first three quarters in 2004
Mainland GDP 3¾ 3.5
Private consumption 5 4.5
Mainland gross investment 5¾ 3.8
Petroleum investment 12½ 9.3
Traditional exports 4 2.7
Imports 8½ 8.1
Sources: Statistics Norway and Norges Bank

Norges Bank
18
2250
2260
2270
2280
2290
2300
2310
2320
Jan Feb Mar Apr May June July Aug Sept Oct Nov Dec
2250
2260
2270
2280
2290
2300
2310
2320
2003
2002
2004
Employment (LFS)Seasonally adjusted. In 1000s
Source: Statistics Norway

Norges Bank
19
House pricesNEF/ECON (January 1998–November 2004) and Statistics Norway (98 Q1– 04 Q3). Percentage rise on same period previous year
-5
0
5
10
15
20
25
30
1998 1999 2000 2001 2002 2003 2004
-5
0
5
10
15
20
25
30
SN
NEF
Sources: Statistics Norway, Norwegian Association of Real Estate Agents (NEF) and Association of Real Estate Agency Firms (EFF)

Norges Bank
20
Projections for the output gap1)
Annual figures. Per cent. 1980 – 2004. Graph from Inflation Report 3/04
-6
-4
-2
0
2
4
6
1980 1985 1990 1995 2000
-6
-4
-2
0
2
4
6
1) The output gap measures the difference between actual and potential mainland GDP.
Sources: Statistics Norway and Norges Bank

Norges Bank
21
80
90
100
110
jan 01 jan 03 jan 05 jan 07
80
90
100
110
Assumptions for the money market rate and the krone exchange rate (I-44)
0
2
4
6
8
10
jan 01 jan 03 jan 05 jan 07
Source: Norges Bank
Forward interest rate28 October (IR 3/04)
3-month money market rate
Import-weighted exchange rate, I-441)Forward interest rate
14 December
1)A rising curve denotes a weaker krone exchange rate.
Forward exchange rate 28 October (IR 3/04)
Forward exchange rate14 December

Norges Bank
22
1
1,1
1,2
1,3
1,4
jan 03 mai 03 sep 03 jan 04 mai 04 sep 04
1
1,1
1,2
1,3
1,4
Source: EcoWin
Movements in EUR/USD1)
Daily figures. 1 Jan 03 – 13 Dec 04
1)A rising curve denotes a weaker dollar exchange rate.
Dollar per euro

Norges Bank
23
Interest rate increases in this business cycle
Sources: Reuters, Bloomberg and Norges Bank
First interest rate increase
Key rate at lowest point
Current key rate
Change since lowest point
Iceland 06.05.2004 5.30 8.25 2.95
New Zealand 29.01.2004 5.00 6.50 1.50
UK 06.11.2003 3.50 4.75 1.25
US 30.06.2004 1.00 2.25 1.25
Australia 08.05.2002 4.25 5.25 1.00
Canada 08.09.2004 2.00 2.50 0.50
Switzerland 17.06.2004 0.00-0.75 0.25-1.25 0.50
Euro area 2.00 2.00 0.00
Sweden 2.00 2.00 0.00
Denmark 2.15 2.15 0.00
Japan Towards zero Towards zero 0.00
Trading partners1) 06.05.2004 2.14 2.33 0.19
1) Calculated as a weighted average of EUR, SEK, GBP and USD. On 31 December 2003 this interest rate was 2.31 per cent.