nordea presentation for investors, 22 aug 2001 filesuperior and profitable growth in every market...
TRANSCRIPT


Contents
� Nordea
� Key figures and trends
� Group P&L
� Business areas
� Balance sheet
� Asset quality
� Appendix
Nordea statement - vision
We shall be valued as the leading financialservices group in the Nordic and Baltic financialmarkets with a substantial growth potential
Nordea statement - ambition
We shall be number one or number two or show superior and profitable growth in every market and product area in which we choose to compete.
We shall have the leading multichannel distribution with a top world ranking in e-based financial solutions

Strategic focus
Nordea is dedicated to deliver financial solutions in partnership with customers. The broader theproduct portfolio, the competence and the investment base are, the better products and services we can develop.

Nordea shall create value for shareholders in line with the best among European listed financial services companies
�Profitability
�Cost control
�Realising synergies
�Risk control
�Optimal capital structure
�AuM
Value drivers
19.4 %21.6 %Return on equity excl.goodwill……………………….
TargetsRealised
20 % p.a.18 %-3.8 %AuM growth………………….
>6.5%6.8 %7.0 %Tier 1 ratio…………..............
<100%110 %103 %Combined ratio, general insurance…………………….
<0.4%0.08 %0.16 %Average loan losses………...
<50%55 %55 %Cost/Income ratio, banking..
>40%40 %-Dividend payout ratio……….
>Euro rfr+8%16.1 %15.6 %Return on equity…………….
46.5 %Total shareholder return……
20032000H1/01Performance indicators
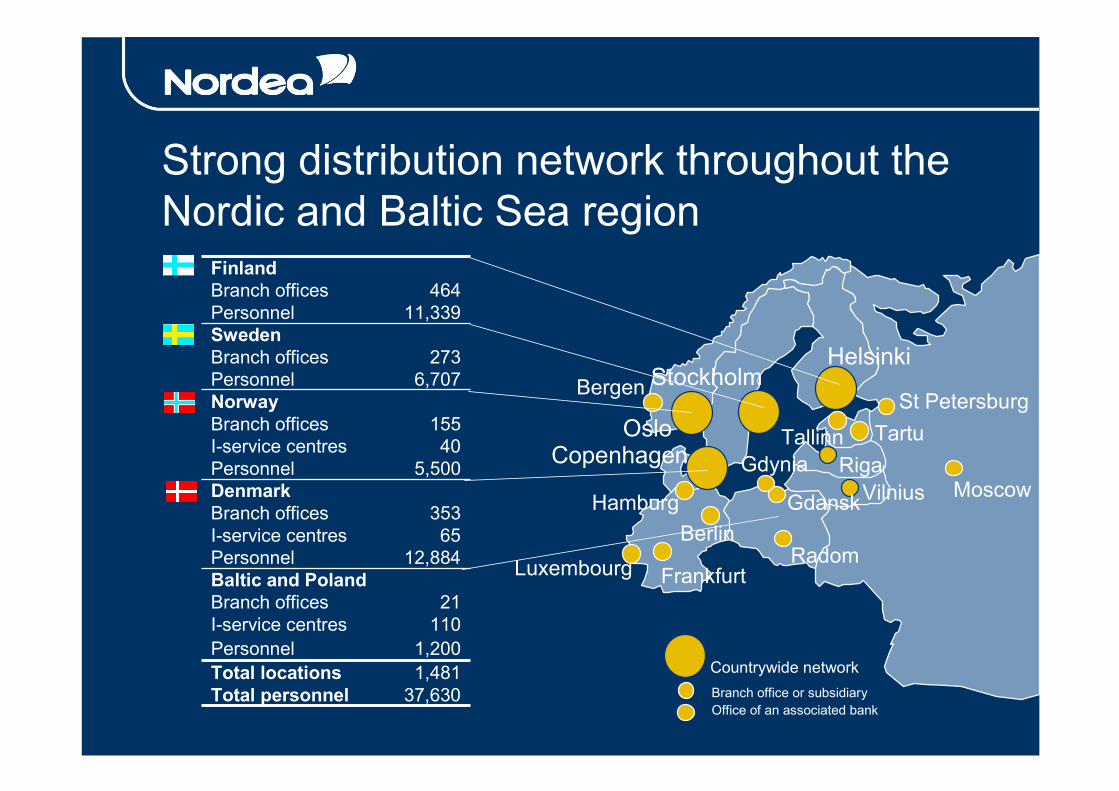
Strong distribution network throughout the Nordic and Baltic Sea region
RigaVilnius
Tallinn
Helsinki
Luxembourg
StockholmSt Petersburg
Tartu
Gdansk
Gdynia
Frankfurt
BerlinHamburg
Radom
Oslo
Countrywide networkBranch office or subsidiaryOffice of an associated bank
Moscow
Bergen
Copenhagen
37,630Total personnel1,481Total locations1,200Personnel
110I-service centres21Branch offices
Baltic and Poland12,884Personnel
65I-service centres353Branch offices
Denmark5,500Personnel
40I-service centres155Branch offices
Norway6,707Personnel
273Branch officesSweden
11,339Personnel464Branch offices
Finland

Large customer base with high penetration innet banking
2,38568611651,048305Net banking customers (1,000)
1,56468440200256600Life Insurance and Pensions1,587242-400-945General Insurance
Insurance customers (1,000)
593-102202149140Large Nordic corporate customers²
590101306033060Corporate customers8,900403,6005003,0001,700Household customers
Retail banking customers (1,000)Total
Baltic Sea
RegionSENOFIDK
Note 1: Figures as per June 30 2001Note 2: Shipping, Offshore and Oil Services customers (375) are not included.

Group Staffs
Nordea
Corporate and Institutional
Banking
InvestmentBanking
Asset Management Retail Banking Life Insurance
and Pensions
Business structure
General Insurance
Group Corporate Centre

The merger process to date -establishing the pan-Nordic platform
NorwayCHRISTIANIA BANK OG KREDITKASSE
Denmark
Finland
Sweden
1995-1996 1997 1998 1999 2000

0 10 20 30 40 50 60 70 80 90 100 110 120 130
Std CharteredDexia
Bank of ScotlandNordea
San-Paulo-IMIBanca Intesa
UnicreditoDresdnerSoc Gen
AbbeyHypoVHalifax
ABNFortis
BNP ParibasBBVABSCH
DeutscheCS
BarclaysLloyds
UBSRBSING
HSBC
Top 25 European banks by market cap
Source: Nordea Securities, August 2001 EUR bn

Profit and volume growth
� Highest profit ever excluding investment earnings, EUR 604m
� Operating profit EUR 677m, up 22% compared to the first quarter 2001
� Return on equity excluding goodwill 23.4%
� Net interest income continued to show stable progress
� Net loan losses 0.18% (0.14% in the first quarter), annualised
� Deposits increased by 5% and lending by 3%
� Earnings per share EUR 0.16, up from EUR 0.13 in the first quarter

Strategic progress
� Acquisition of Postgirot strengthens market position
� E-banking shows all time high in number off log-ons (18.4m) and payments (21.0m)
� Ratings – several upgradings
� All banks in the Group to be branded Nordea from December
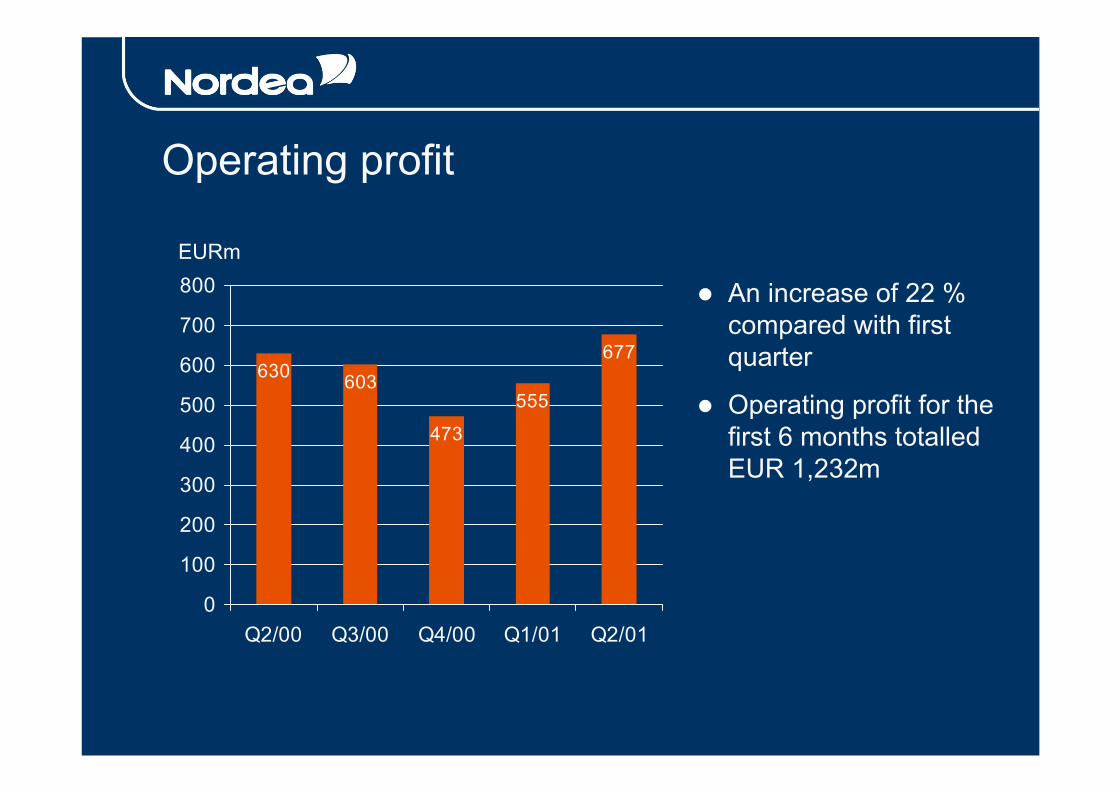
Operating profit
630 603677
555
473
0
100
200
300
400
500
600
700
800
Q2/00 Q3/00 Q4/00 Q1/01 Q2/01
� An increase of 22 % compared with firstquarter
� Operating profit for the first 6 months totalledEUR 1,232m
EURm

Strong core earnings
495 524454
570 604
162100 42 21 110
630 603
473555
677
0100200300400500600700800
Q2/00 Q3/00 Q4/00 Q1/01 Q2/01
Profit excluding investment earningsInvestment earningsOperating profit
� Strong financialgrowth
� Maintained customer focus
� Realisation of merger synergies
EURm
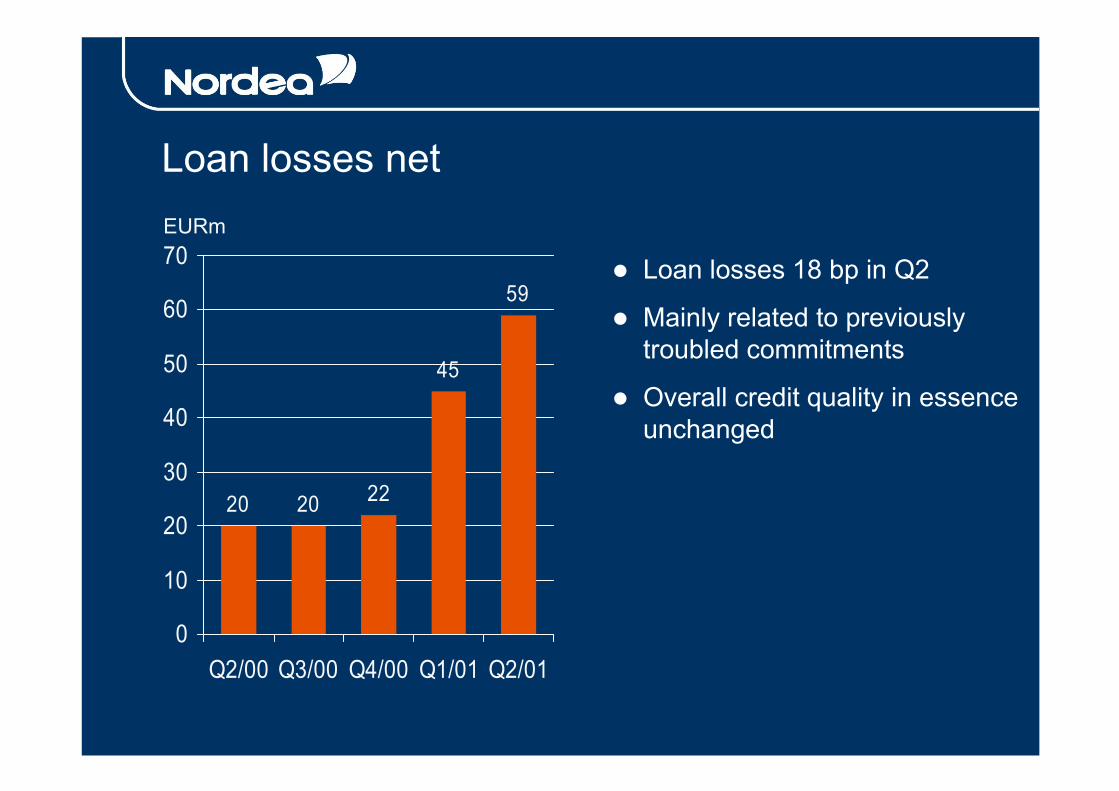
Loan losses net
20 20 22
45
59
0
10
20
30
40
50
60
70
Q2/00 Q3/00 Q4/00 Q1/01 Q2/01
� Loan losses 18 bp in Q2
� Mainly related to previouslytroubled commitments
� Overall credit quality in essence unchanged
EURm

55 55
0
10
20
30
40
50
60
70
Q1/01 Q2/01
Key figuresCombined ratio, general
insurance**C/I Ratio, banking*% %
106100
0
20
40
60
80
100
120
Q1/01 Q2/01* Operating expenses excluding goodwill as a percentage of operating income and share of P/L from companies accounted for under the equity method
** Claims and expenses as a percentage of net premium income. Change in equalisation provision is not included in claims

0.16
0.13
0
0,05
0,1
0,15
0,2
Q1/01 Q2/01
Key figuresReturn on EquityEarnings per shareEUR %
17.0
14.1
23.4
19.7
0
5
10
15
20
25
Q1/01 Q2/01
Return on equity Excl. goodwill

� Strengthened competitiveness in domestic payments in Sweden -better and more efficient solutions for the customers
� Increased business volumes through cross-selling to the large customer base of Postgirot Bank
� Strengthened competitiveness in international payments through the network of Postgirot Bank
Acquisition of Postgirot Bank

� Nordea agreement with the Swedish Post to acquire 100 percent of Postgirot Bank AB (31 August 2001)
� The purchase price is SEK 4.1bn (EUR 440m) in cash, plus accrued profits from 1 January 2001 up until completion
� The acquisition is conditional upon approval by
• Swedish Financial Supervisory Authority
• EU Commission
� Closing is expected within 6 months, depending on necessary approvals
� Net synergies EUR 20m after three years
The transaction

� Postgirot Bank has a large customer base
• 425,000 corporate customers
• 850,000 personal customers
• Includes all major corporate and public sector customers
• About 70% of the customers is not currently Nordea customers
� Significant opportunities for cross-selling of the wide range of Nordea products and services
Cross-selling opportunities
Integration progress - branding
� All retail banking operations will change branding to Nordea in December
• Decision is based on careful commercial analyses
• Integration is progressing ahead of schedule
� Asset Management and Corporate and Institutional Banking adoptedthe Nordea brand early this year
� Investment Banking changed its name to Nordea Securities in May

Integration progress – synergies
Announced total synergies 360
Expected by the end of 2001 145
Achieved by Q2 2001 75


Income statement summary
3637Goodwill
821120Equity method
22555677Operating profit
21110Investment earnings
6570604Profit excl. investment earnings
314559Loan losses
2955977Expenses
41,5591,620Income
Change, %Q1/01Q2/01EURm

Income statement summary
4973Goodwill
3231Equity method
-9
20
181
19
22
Change, %
-101,3591,232Operating profit
431131Investment earnings
149771,174Profit excl. investment earnings
37104Loan losses
31,6281,932Expenses
92,6103,179Income
Adj. forCBK, %H1/00H1/01EURm

Income
707 733 757872 885
625 565 627687 735
0
200
400
600
800
1000
1200
1400
1600
1800
Q2/00 Q3/00 Q4/00 Q1/01 Q2/01
Net interest income Non-interest income
EURm

Net interest income
707 733
885872
757
0100200300400500600700800900
1000
Q2/00 Q3/00 Q4/00 Q1/01 Q2/01
� Stable progress
� Growth in lending and deposits
� Overall stable margins
EURm

Commission income
386
320
368 361 370
0
50100
150200
250300
350400
450
Q2/00 Q3/00 Q4/00 Q1/01 Q2/01
� Maintained commissions despiteturbulent markets
� Sustainedcommissions from Asset Management
� Increased payment and lending commissions
EURm

Commission income
128 122 130 113 116
111 103 117 129 127
87
-66 -64 -74 -73 -73
5568 79 60
81 917573
68
5556 48 4244
-100
0
100
200
300
400
500
Q2/00 Q3/00 Q4/00 Q1/01 Q2/01
Asset management Payments & deposits Brokerage Lending Other Expenses
EURm
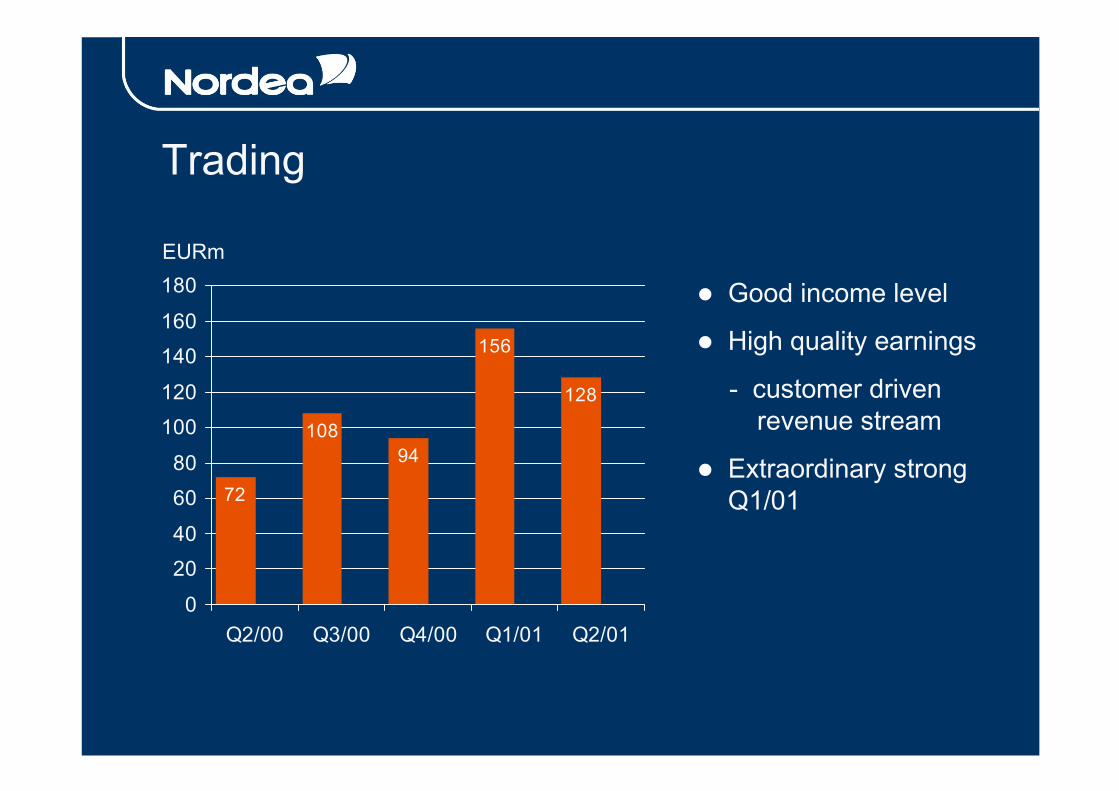
Trading
72
10894
156
128
0
2040
6080
100120
140160
180
Q2/00 Q3/00 Q4/00 Q1/01 Q2/01
� Good income level
� High quality earnings
- customer driven revenue stream
� Extraordinary strong Q1/01
EURm
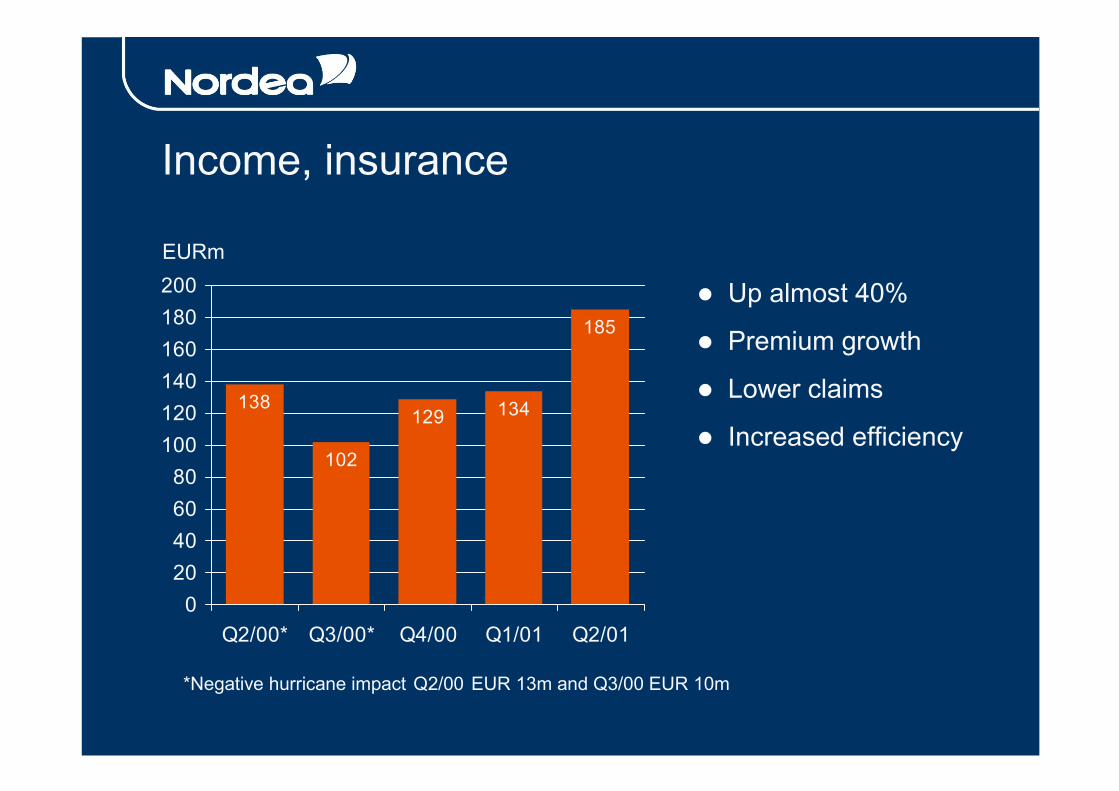
Income, insurance
138
102
129 134
185
020406080
100120140160180200
Q2/00* Q3/00* Q4/00 Q1/01 Q2/01
EURm
� Up almost 40%
� Premium growth
� Lower claims
� Increased efficiency
*Negative hurricane impact Q2/00 EUR 13m and Q3/00 EUR 10m

460 459 482545 560
380326
425410 417
0
200
400
600
800
1000
Q2/00 Q3/00 Q4/00 Q1/01 Q2/01
Personnel Other
EURm
Expenses
� High activity in Q2
- customer-related
- integration process
� H1/01 up 3% on H1/00 adjusted for CBK
� Profit-related personnel expenses in the first half EUR 70m

Total IT-related expenses*
395
670
0
100
200
300
400
500
600
700
800
2000 H1/01
EURm
*Computer operations, service expenses, consultants and personnel
20.4%H1/01
22.7%2000
As % of total expenses

Loan losses
145 135
303
183 193
-125 -115
-281
-138 -134
20 20 22 45 59
-300
-200
-100
0
100
200
300
400
Q2/00 Q3/00 Q4/00 Q1/01 Q2/01
Gross Reversals Net
EURm
� Loan losses 18 bp in Q2
� Mainly related to previously troubled commitments
� Increase in country risk reserve
� Overall credit quality in essence unchanged

Investment earnings
10530346825Treasury
1621004221110Investment earnings
711720255Other
-1738-10-3211General insurance
315-2-1719Life insurance
Q2/00Q3/00Q4/00Q1/01Q2/01EURm


458
140
5
479
93
136 35
80
-31
75
-14
65
42
-100
0
100
200
300
400
500
Retail CIB AssetMgmt*
IB Life* General Treasury
Q1/01 Q2/01
Results by business areaEURm
*Product result for Asset Management and Life

Retail Banking operating profit
351
423
345
458479
050
100150200250300350400450500
Q2/00 Q3/00 Q4/00 Q1/01 Q2/01
EURm
� Operating profit up 5%
� C/I-ratio improved to 54%
� ROE 26%
� Volume increase for lendingand deposits

Retail Banking operating profit by market Q2
62316392426Return on equity %
695759485654Cost/income ratio %
113252158136479Operating profit-2-2-4-9-5-23Loan losses313456167141502Profit before loan losses
-7-180-77-157-178-599Total expenses103141333243191,101Total income
4102397484303Non-interest income621294250235798Net interest income
RetailP&B
RetailSE
RetailNO
Retail FI
Retail DK
Retail BankingEURm

33.9
14.8
25.7
20.4
34.4
15.5
20.9
26.2
0
5
10
15
20
25
30
35
Denmark Finland Norway Sweden
31-03-01 30-06-01
Retail Banking lending
EURbn
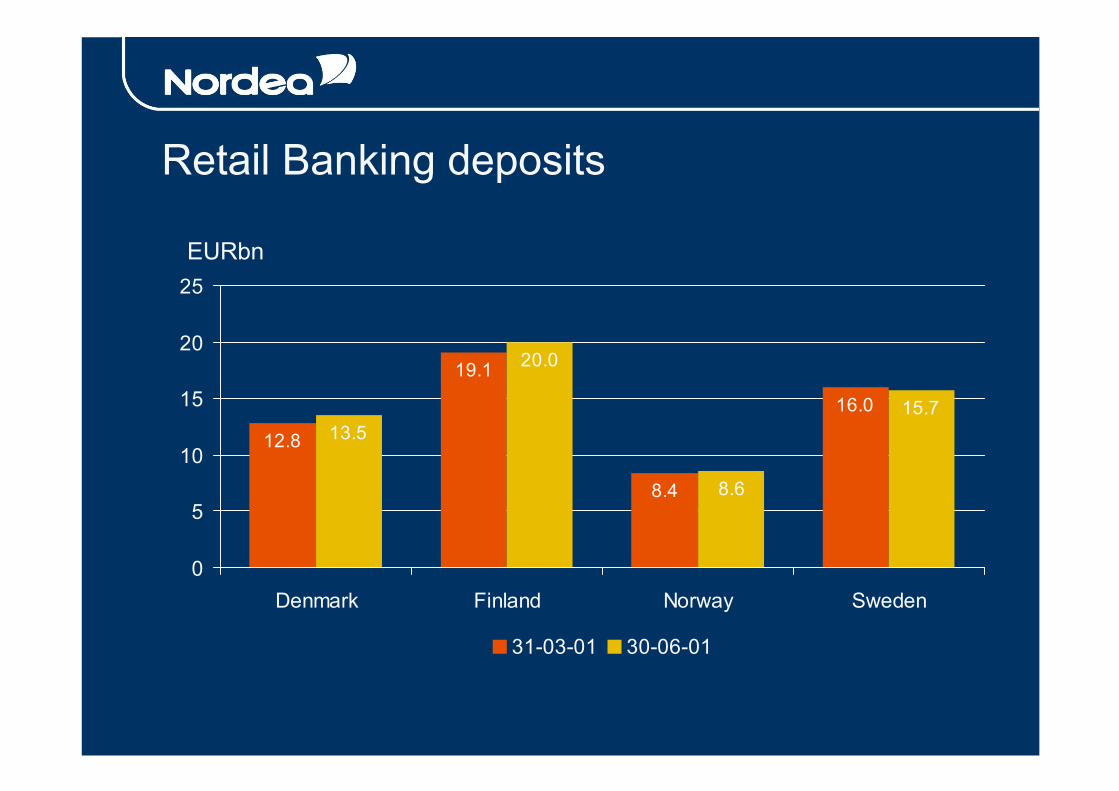
16.0
19.1
8.4
12.8 13.515.7
8.6
20.0
0
5
10
15
20
25
Denmark Finland Norway Sweden
31-03-01 30-06-01
Retail Banking deposits
EURbn


114 119
74
140
93
0
20
40
60
80
100
120
140
160
Q2/00 Q3/00 Q4/00 Q1/01 Q2/01
CIB operating profitEURm
� Stable underlying development
� Income from Markets lower compared with exceptional Q1
� Increased provisions for certain previously recognised troubled commitments
� ROE 12%
� C/I-ratio 46%

CIB, Q2 2001
44Equity method-10-10Country risk
28
-1240
-747
Shipping and
Offshore
89
-291
-55146
Corporate Division
12Return on equity %
46Cost/income ratio %
491393Operating profit
--11-50Loan losses4930149Profit before loan losses
-47-22-126Total expenses9652275Total income
Markets*Inter-
nationalCIBEURm
*Product result: revenues and expenses allocated to customer responsible units

CIB lending volume
30.2
5.17.5
17.5
31.6
4.57.3
18.8
0
5
10
15
20
25
30
35
Corporate Division Shipping andoffshore
International Total
31-03-01 30-06-01
EURbn

CIB net loan losses
610Country risk
3060Total
2450
4825Acquisition finance
011International division
-1612Shipping division
-82Corporate division
Q1/01Q2/01EURm


Asset Management, product result
6975
6875
65
2925 27 28
20
0
10
20
30
40
50
60
70
80
Q2/00 Q3/00 Q4/00 Q1/01 Q2/01
-of which operating profit
EURm
� Continued voltility in financialmarkets affected AuM and result
� AuM up 4% to EUR 101bn in Q2
� Net inflow limited and dominated by fixed income

Assets under management, volumes
36 33.2 36
26.8 22.321.7
42,241.642
0
20
40
60
80
100
120
Q4/00 Q1/01 Q2/01
Mutual funds Private banking Investment management
EURbn
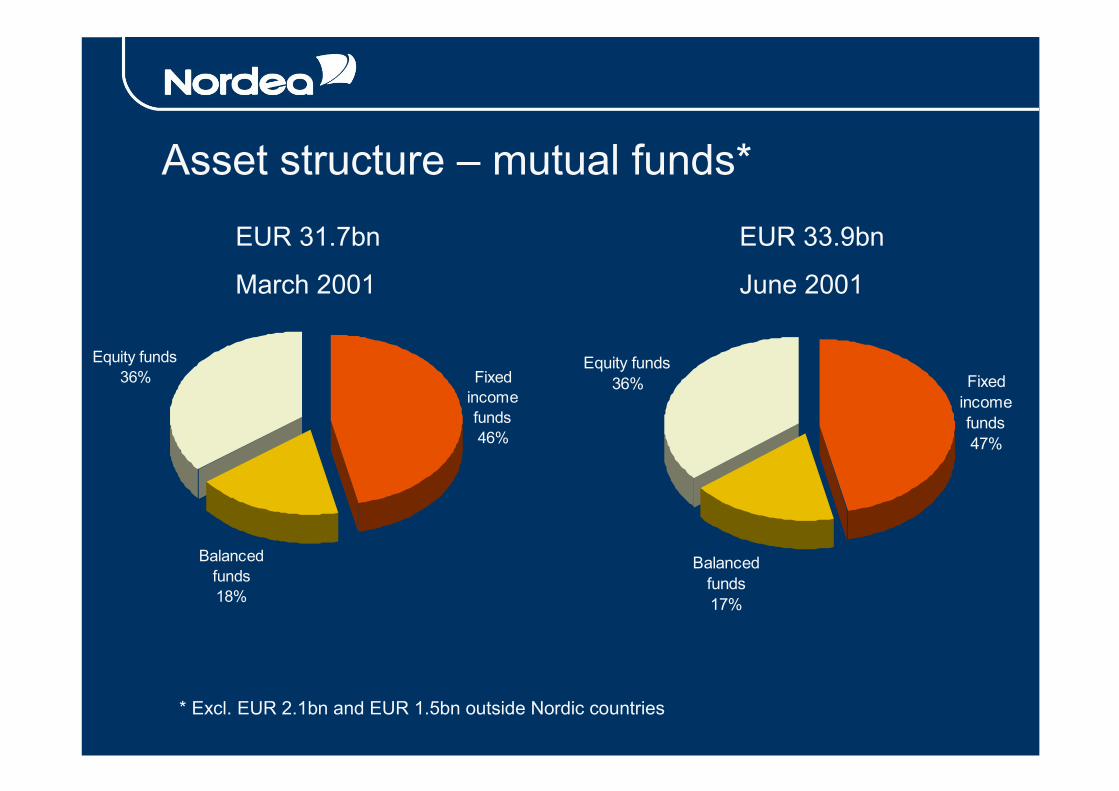
Asset structure – mutual funds*
Fixed income funds46%
Balanced funds18%
Equity funds36% Fixed
income funds47%
Balanced funds17%
Equity funds36%
EUR 33.9bn
June 2001
EUR 31.7bn
March 2001
* Excl. EUR 2.1bn and EUR 1.5bn outside Nordic countries
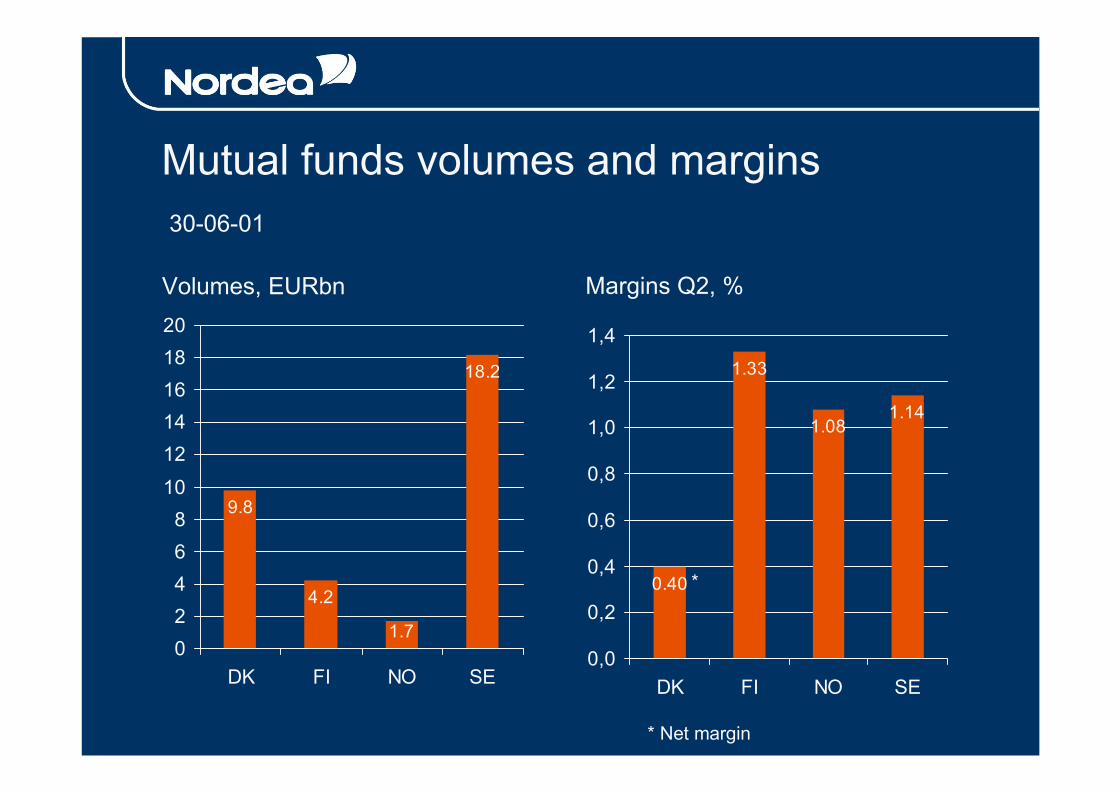
Mutual funds volumes and margins
18.2
1.7
9.8
4.2
02468
101214161820
DK FI NO SE
1.141.08
1.33
0.40
0,0
0,2
0,4
0,6
0,8
1,0
1,2
1,4
DK FI NO SE
Volumes, EURbn Margins Q2, %
30-06-01
*
* Net margin

Investment Banking operating profit
22
2
12
510
5
10
15
20
25
Q2/00 Q3/00 Q4/00 Q1/01 Q2/01
EURm
� Equities commission income reduced
� High level of activity in Nordic M&A business
� Leading positions by marketshares on the Helsinki and Copenhagen stock exchanges

Nordea Securities
51Operating profit
-34-41Total expenses
3942Total revenues
-12Other
921Corporate Finance
3119Equities
Q1/01Q2/01EURm

5 0
23
3
15
-2
19
3
-17
-20-15-10
-505
10152025
Q2/00 Q3/00 Q4/00 Q1/01 Q2/01
Technical result Investment earnings
EURm
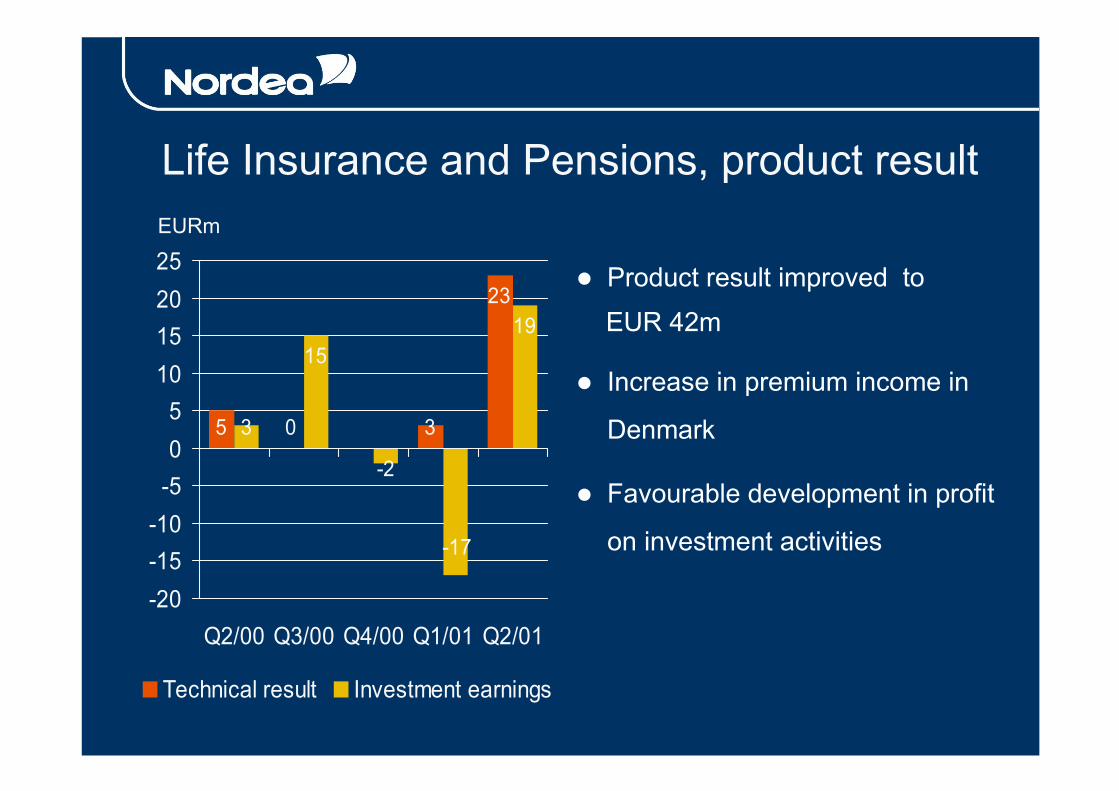
Life Insurance and Pensions, product result
� Product result improved toEUR 42m
� Increase in premium income in
Denmark
� Favourable development in profit
on investment activities
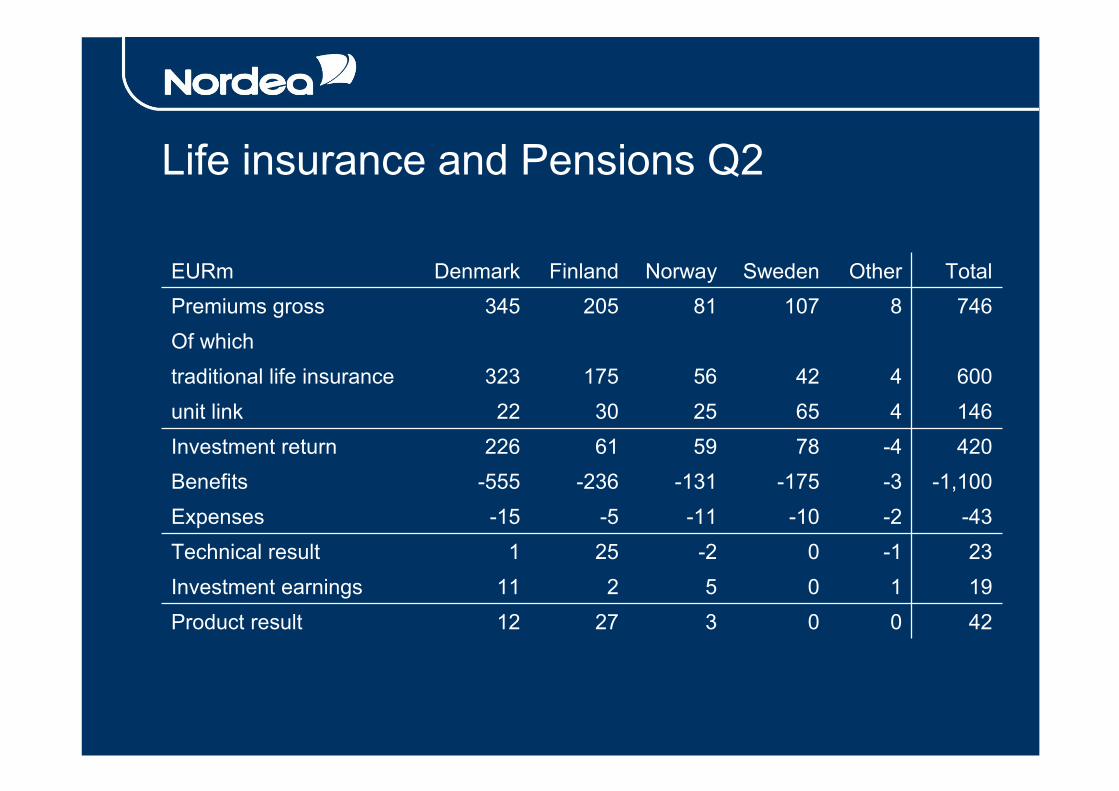
Life insurance and Pensions Q2
272
25-5
-2366130
175
205Finland
35
-2-11
-131592556
81Norway
420012Product result191011Investment earnings23-101Technical result
-43-2-10-15Expenses-1,100-3-175-555Benefits
420-478226Investment return14646522unit link600442323traditional life insurance
Of which7468107345Premiums gross
TotalOtherSwedenDenmarkEURm

Life and Pensions - investments
6 6,4 5,9 5 5,5
8,4 9 8,8 10,5 10,6
1,2 1,2 1,2 1,5 1,52,4 2,6 3,13,1 3,4
0
5
10
15
20
25
30-06-00 30-09-00 31-12-00 31-03-01 30-06-01
Shares Bonds Property Unit linked
EURbn


7
-13-17
-10
11
2522
1
-32
38
-40-30-20-10
01020304050
Q2/00* Q3/00* Q4/00 Q1/01 Q2/01
Technical result Investment earnings
General Insurance, operating profitEURm
� Growth in gross premiums
� Lower claims
� Increased efficiency
� Combined ratio improved to 100%
* Negative hurricane impact Q2/00 EUR 13m and Q3/00 EUR 10m

92101
106100 101103 107 107
115
96
0
20
40
60
80
100
120
Q2/00 Q3/00 Q4/00 Q1/01 Q2/01
Denmark Norway
Combined ratio by market
%

General insurance
-3136Operating profit
-3211Investment earnings
125Technical result
-97-96Expenses
-287-285Claims
2731Technical interest
358375Premiums net
428453Premiums gross
Q1/01Q2/01EURm

General Insurance Q2
Premiums, netTechnical interestClaims
Investment earnings
EURm
Expenses
Premiums gross 197
14-152
14
-50
Denmark
12514
-99
-1
-23
Norway219 165
533
-34
-2
-23
Other
37531
-285
11
-96
Total69 453
Operating profit 23 16 -3 36
Technical result 9 17 -1 25
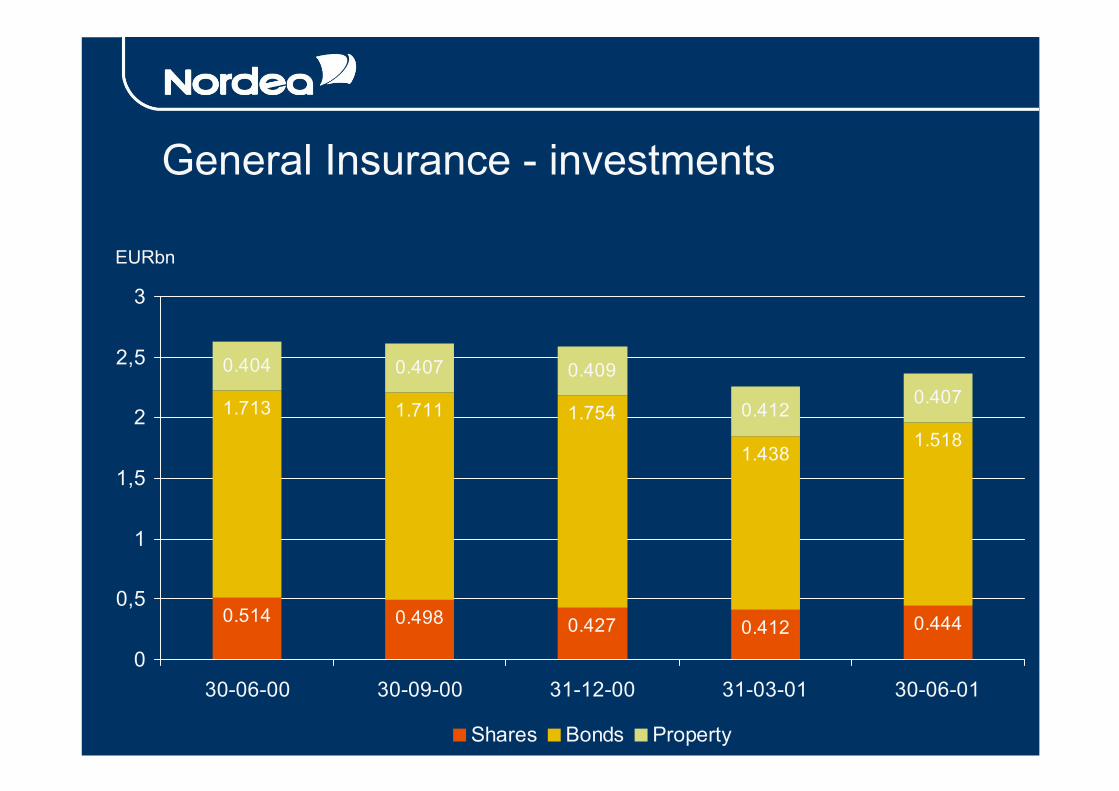
0.4440.4120.4270.4980.514
1.5181.438
1.7541.7111.713 0.4070.412
0.4090.4070.404
0
0,5
1
1,5
2
2,5
3
30-06-00 30-09-00 31-12-00 31-03-01 30-06-01
Shares Bonds Property
General Insurance - investments
EURbn


Treasury operating profit
� Volatile financial markets
� Fixed income earnings negative
- partly balanced by equity gains
� Gain on Atle shares EUR 57m
� Reduced risk exposure
99
34 34
12
35
68
0
20
40
60
80
100
120
Q2/00 Q3/00 Q4/00 Q1/01 Q2/01
Reclassification effect Q1/01
EURm
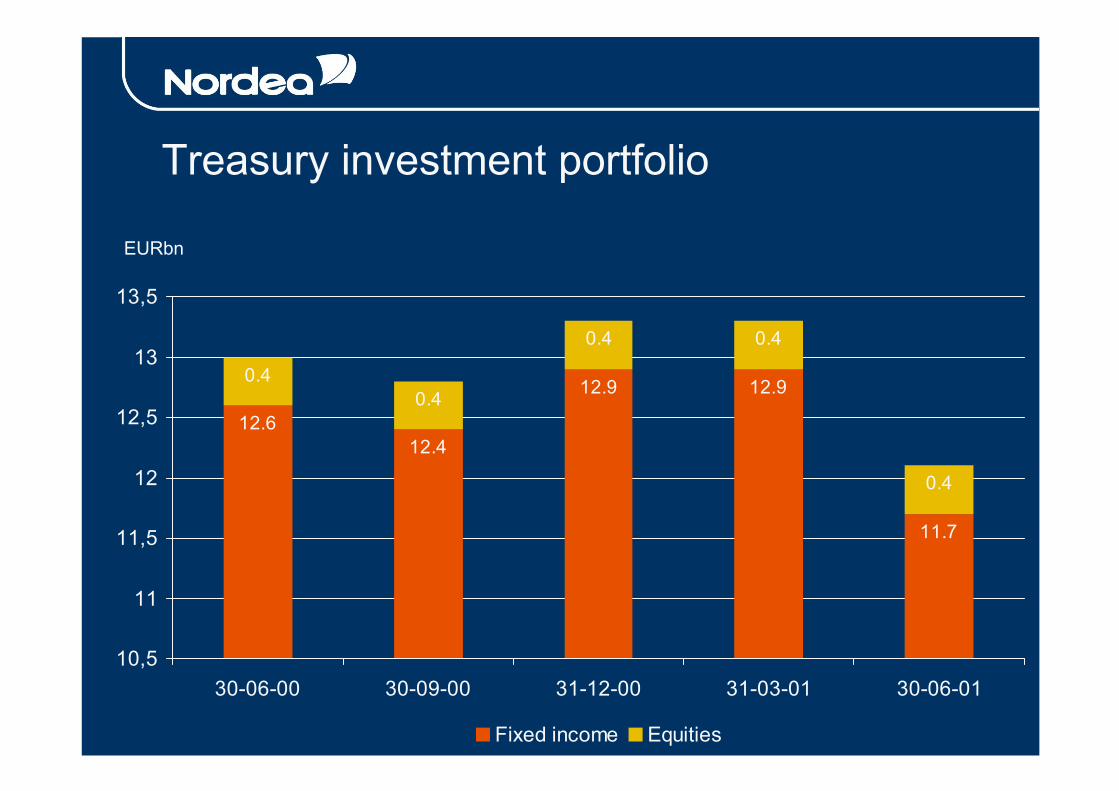
11.7
12.912.9
12.412.6
0.4
0.40.4
0.40.4
10,5
11
11,5
12
12,5
13
13,5
30-06-00 30-09-00 31-12-00 31-03-01 30-06-01
Fixed income Equities
Treasury investment portfolio
EURbn


Balance sheet - key items
132136135Risk-weighted assets
224233233Total assets
111111Shareholders’ equity
797781Deposits
129131135Lending
Dec 00March 01June 01EURbn, end of period

129
28 23 2215 7
135
2821 23 21 5
0
20
40
60
80
100
120
140
Lending Interestbearing
securities
Loans andadvances tocredit inst.
Assets,insurance
Other assets,banking
Other
31-12-00 30-06-01
Balance sheet structure - assets
EURbn
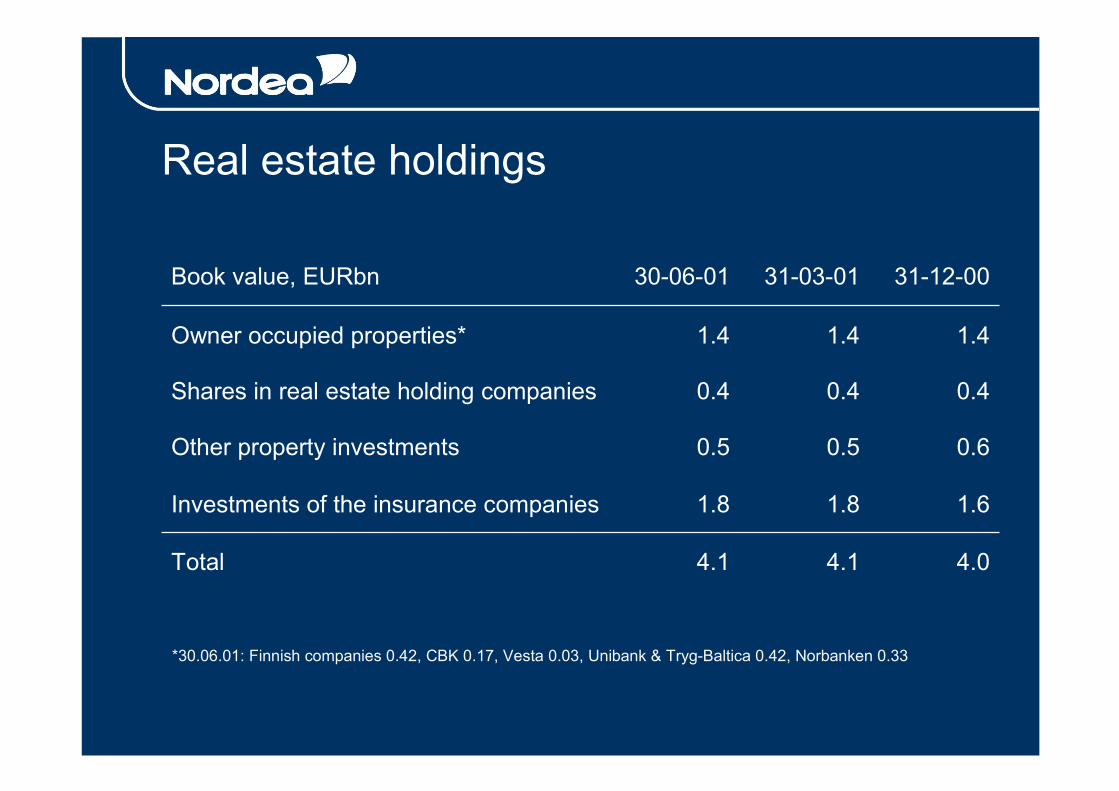
Real estate holdings
4.04.14.1Total
1.61.81.8Investments of the insurance companies
0.60.50.5Other property investments
0.40.40.4Shares in real estate holding companies
1.41.41.4Owner occupied properties*
31-12-0031-03-0130-06-01Book value, EURbn
*30.06.01: Finnish companies 0.42, CBK 0.17, Vesta 0.03, Unibank & Tryg-Baltica 0.42, Norbanken 0.33

79
56
29
19 21
11 9
81
56
34
20 22
11 90
10
20
30
40
50
60
70
80
90
Deposits Debt securitiesin issue
Deposits bycredit inst.
Other liabilities,banking
Liabilities,insurance
Shareholder´sequity
Other
31-12-00 30-06-01
Balance sheet structure – liabilities and equity
EURbn

65 67
79 7781
0
20
40
60
80
100
30-06-00
30-09-00
31-12-00
31-03-01
30-06-01
Lending and deposits
Lending
109 110
129 131 135
0
20
40
60
80
100
120
140
30-06-00
30-09-00
31-12-00
31-03-01
30-06-01
DepositsEURbnEURbn

Total capital ratio
9.69.2
0123456789
10
31-03-01 30-06-01
Tier1 ratio
7.06.6
0123456789
10
31-03-01 30-06-01
Capital adequacy
%%

Capital base EURm
Calculated dividend (40% of net profit)
Group goodwill
30-06 -01
Companies not included in the financial group
Shareholder´s equity in the capital base
Shareholder´s equity
Minority interests
Hybrid capital
TIER 1 CAPITAL
11,136
-352
-23
10,761
9,446
811
311
-2,065
Other deductions -92
Deductions for other investments -177
TIER 2 CAPITAL (subordinated debt) 5,177
CAPITAL BASE
Deductions for investments in insurance companies
12,973
-1,473

Companies61%
Public sector2%
Households37%
Loan portfolio by customer group(30-06-01)
EUR 135bn

Real estate22%
Finance11%
Business service6%
Shipping8%
Manufacturing19%
Agriculture4%
Other companies10%Construction
4%
Transport, communication
5%
Commerce and services
11%
Lending to companies by industry (30-06-01)
EUR 83bn

Mortgages 75%
Other loans25%
Lending to households(30-06-01)
EUR 50bn

Loan portfolio
5129131135Total0787Shipping0333Agriculture
-17121010Other companies25455Business service80569Finance
7151516Manufacturing13899Commerce and services
0444Transport, communication0333Construction0191919Real estate2494950Households
Chg Y/Y, %31-12-0031-03-0130-06-01EUR bn

Problem loans
747370Provisions/doubtful loans, gross (%)
826876953Problem loans, total
0.60.60.7Doubtful loans,net/lending (%)
293535Loans with interest deferments
797841918Doubtful loans, net
-2,256-2,218-2,122Provisions
3,0533,0593,040Doubtful loans, gross
31-12-0031-03-0130-06-01EURm

� Market shares
� Financials
� Nordea share
� Netbanking
� Other
� Macro statistics

� Market shares
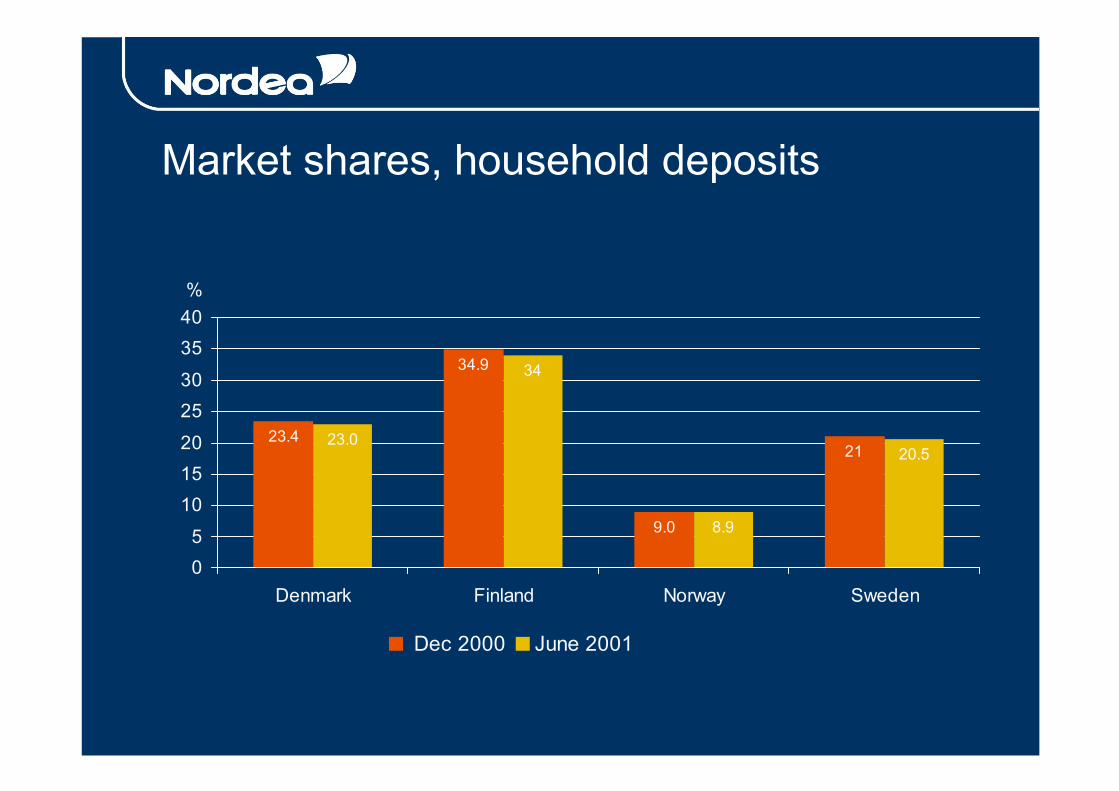
Market shares, household deposits
21
3434.9
23.4
9.0
20.5
8.9
23.0
05
10152025303540
Denmark Finland Norway Sweden
Dec 2000 June 2001
%
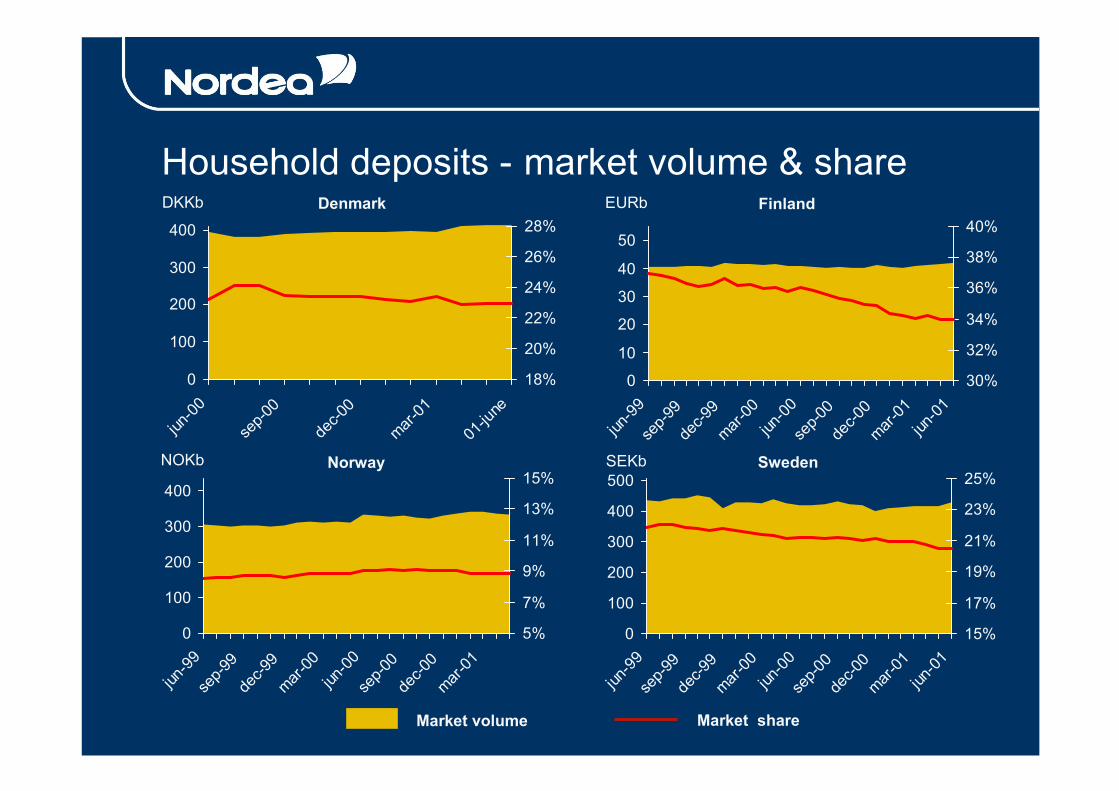
Household deposits - market volume & share
0
10
20
30
40
50
jun-99
sep-9
9de
c-99
mar-00
jun-00
sep-0
0de
c-00
mar-01
jun-01
30%
32%
34%
36%
38%
40%
0
100
200
300
400
jun-00
sep-0
0
dec-0
0
mar-01
01-ju
ne18%
20%
22%
24%
26%
28%
0
100
200
300
400
500jun
-99se
p-99
dec-9
9mar-
00jun
-00se
p-00
dec-0
0mar-
01jun
-01
15%
17%
19%
21%
23%
25%
0
100
200
300
400
jun-99
sep-9
9de
c-99
mar-00
jun-00
sep-0
0de
c-00
mar-01
5%
7%
9%
11%
13%
15%
EURb FinlandDKKb Denmark
SEKb SwedenNOKb Norway
Market volume Market share

Market shares, corporate deposits
50
14.5
48.1
17.823.7
14.716.9
25.4
0
10
20
30
40
50
60
Denmark Finland Norway Sweden
Dec 2000 June 2001
%

Corporate deposits - market volume & share
0
5
10
15
20
jun-99
sep-9
9de
c-99
mar-00
jun-00
sep-0
0de
c-00
mar-01
jun-01
40%
43%
46%
49%
52%
55%
0
100
200
300
jun-00
sep-00
dec-00
mar-01
01-june
19%
21%
23%
25%
27%
29%
0
100
200
300
400jun
-99se
p-99
dec-9
9mar-
00jun
-00se
p-00
dec-0
0mar-
01jun
-01
10%
12%
14%
16%
18%
20%
0
100
200
300
jun-99
sep-9
9de
c-99
mar-00
jun-00
sep-0
0de
c-00
mar-01
4%
6%
8%
10%
12%
14%
EURbn FinlandDKKbn Denmark
SEKbn SwedenNOKbn Norway
Market volume Market share

Market shares, household lending
32
14.6
9.8
18.4
31.6
14.39.9
18.1
0
5
10
15
20
25
30
35
Denmark Finland Norway Sweden
Dec 2000 June 2001
%

Finland
010203040
1-6-991-9-99
1-12-991-3-00
1-6-001-9-00
1-12-001-3-01
1-6-01
27%29%31%33%35%37%
Market volume Market share
Norway
0
100
200
300
400
500
1-6-99
1-8-99
1-10-9
91-1
2-99
1-2-00
1-4-00
1-6-00
1-8-00
1-10-0
01-1
2-00
1-2-01
1-4-01
6%
7%
8%
9%
10%
11%
Market volume Market share
NOKbn
EURbn
SEKbn Sweden
0
250
500
750
1 000
1-6-99
1-8-99
1-10-9
91-1
2-99
1-2-00
1-4-00
1-6-00
1-8-00
1-10-0
01-1
2-00
1-2-01
1-4-01
10%
12%
14%
16%
18%
20%
Market volume Market share
Household lending - market volume & shareDenmark
180200220240
1-6-00
1-7-00
1-8-00
1-9-00
1-10-0
01-1
1-00
1-12-0
01-1
-011-2
-011-3
-011-4
-011-5
-011-6
-01
15%17%19%21%
Market volume Market share
DKKbn

Market shares, corporate lending
28,2
45.3
16.516.5
26.8
42.9
17.217.2
05
101520253035404550
Denmark Finland Norway Sweden
Dec 2000 June 2001
%

Finland
0
10
20
30
1-6-991-9-99
1-12-991-3-00
1-6-001-9-00
1-12-001-3-01
1-6-01
40%42%44%46%48%50%52%
Market volume Market share
Norway
0100200300400500
1-6-991-9-99
1-12-991-3-00
1-6-001-9-00
1-12-001-3-01
12%14%16%18%20%
Market volume Market share
NOKbn
EURbn
SEKbn Sweden
0250500750
1 0001 2501 5001 750
1-6-99
1-8-99
1-10-9
91-1
2-99
1-2-00
1-4-00
1-6-00
1-8-00
1-10-0
01-1
2-00
1-2-01
1-4-01
1-6-01
10%
12%
14%
16%
18%
20%
Market volume Market share
Corporate lending - market volume & share
Denmark
050
100150200250300
1-6-991-9-99
1-12-991-3-00
1-6-001-9-00
1-12-001-3-01
1-6-01
22%24%26%28%30%32%
Market volume Market share
DKKbn
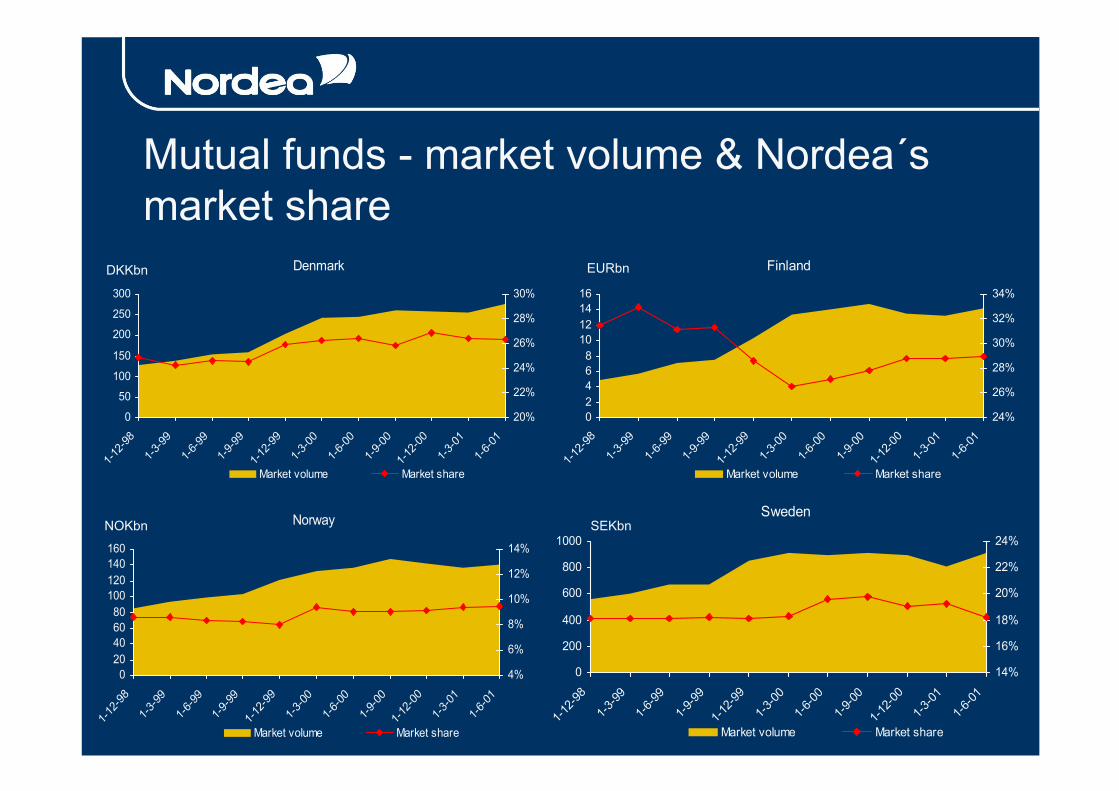
Mutual funds - market volume & Nordea´s market share
Finland
02468
10121416
1-12-9
81-3
-991-6
-991-9
-991-1
2-99
1-3-00
1-6-00
1-9-00
1-12-0
01-3
-011-6
-01
24%
26%
28%
30%
32%
34%
Market volume Market share
Norway
020406080
100120140160
1-12-9
81-3
-991-6
-991-9
-991-1
2-99
1-3-00
1-6-00
1-9-00
1-12-0
01-3
-011-6
-01
4%
6%
8%
10%
12%
14%
Market volume Market share
NOKbn
EURbnDKKbn
SEKbnSweden
0
200
400
600
800
10001-1
2-98
1-3-99
1-6-99
1-9-99
1-12-9
91-3
-001-6
-001-9
-001-1
2-00
1-3-01
1-6-01
14%
16%
18%
20%
22%
24%
Market volume Market share
Denmark
0
50
100
150
200
250
300
1-12-9
81-3
-991-6
-991-9
-991-1
2-99
1-3-00
1-6-00
1-9-00
1-12-0
01-3
-011-6
-01
20%
22%
24%
26%
28%
30%
Market volume Market share

020406080
100120140160180
1-12-9
8
1-3-99
1-6-99
1-9-99
1-12-9
9
1-3-00
1-6-00
1-9-00
1-12-0
0
1-3-01
1-6-01
15%
17%
19%
21%
23%
25%
Market volume Market share, Nordea
Mutual funds, Nordic regionMarket volume and Nordea's market share

Mutual funds, net inflow, Norway Market volume, Nordea volume, and accumulated market share ytd
-1500-1000
-5000
500100015002000250030003500
1-6-99
1-8-99
1-10-9
91-1
2-99
1-2-00
1-4-00
1-6-00
1-8-00
1-10-0
01-1
2-00
1-2-01
1-4-01
1-6-01
-30-20-10010203040506070
Market net inflow Nordea net inflow Nordea %
%NOKm

Mutual funds, net inflow, FinlandMarket volume, Nordea volume, and accumulated market share ytd
-400
-200
0
200
400
600
800
1000
1-6-
991-
8-99
1-10
-99
1-12
-99
1-2-
001-
4-00
1-6-
001-
8-00
1-10
-00
1-12
-00
1-2-
011-
4-01
1-6-
01
-16
-8
0
8
16
24
32
40
Market net inflow Nordea net inflow Nordea %
%EURm
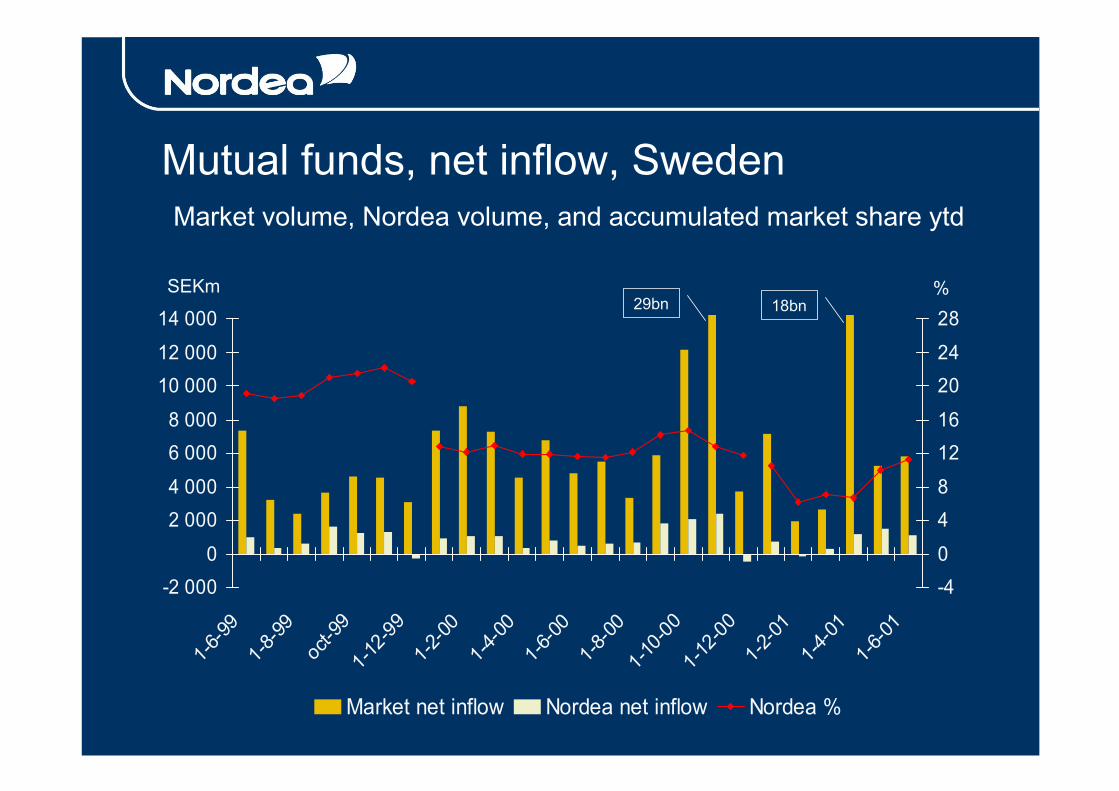
Mutual funds, net inflow, SwedenMarket volume, Nordea volume, and accumulated market share ytd
-2 0000
2 0004 0006 0008 000
10 00012 00014 000
1-6-99
1-8-99
oct-9
91-1
2-99
1-2-00
1-4-00
1-6-00
1-8-00
1-10-0
01-1
2-00
1-2-01
1-4-01
1-6-01
-40481216202428
Market net inflow Nordea net inflow Nordea %
%SEKm18bn29bn

8.1
4.4
15.717.0
3.3
5.7
13.1
17.1
0
2
4
6
8
10
12
14
16
18
Copen
hage
n
Helsink
i
Oslo
Stockh
olm
Jan-Dec 2000 Jan-June 2001
%
Market share equity trading - Nordea Securities
Equity market, volume Q2/01 EURbnDenmark 23
Norway 20
Finland 51
Sweden 116

� Financials

Operational income statement
2935363652Other
315-2-1719Life insurance10530346825Treasury495524454570604Operating profit excl. investment earnings2331-11120Equity method
-20-20-22-45-59Loan losses492513477604643Profit before loan losses
630603473555677Operating profit-27-21-23-36-37Goodwill depreciation1621004221110Investment earnings711720255Other
-1738-10-3211General insurance
-840-785-907-955-977Expenses382331429414421Other expenses458454478541556Personnel expenses
1,3321,2981,3841,5591,620Income
138102129134185Net income from insurance7210894156128Trading
386320368361370Commission income707733757872885Net interest income
Q2/00Q3/00Q4/00Q1/01Q2/01EURm
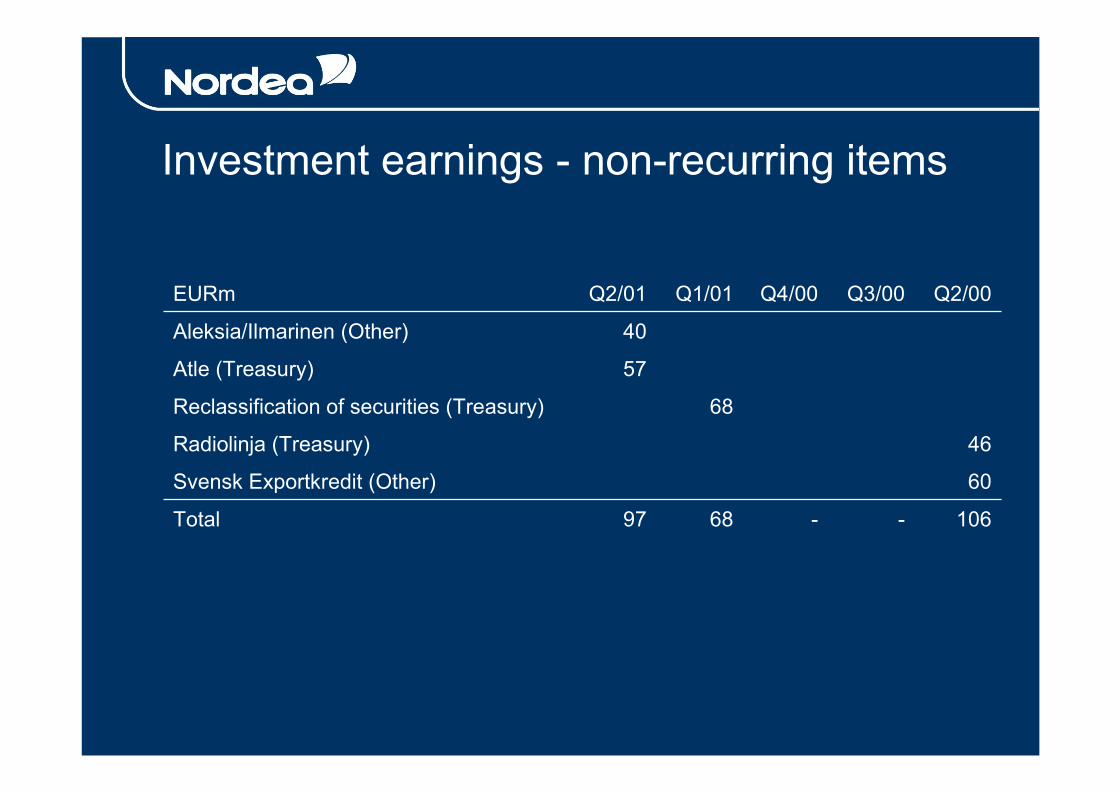
Investment earnings - non-recurring items
60Svensk Exportkredit (Other)
106--6897Total
46Radiolinja (Treasury)
68Reclassification of securities (Treasury)
57Atle (Treasury)
40Aleksia/Ilmarinen (Other)
Q2/00Q3/00Q4/00Q1/01Q2/01EURm

Synergies under delivery
+ 5031012019014523Total
75Realised end Q2
13-131-Other group functions
2121-21-Group treasury
55-5512-IT
573720153Other business areas
+ 504030105-Retail banking
12432929120CIB
TotalRevenueCostTargetActualEURmTarget 200320012000
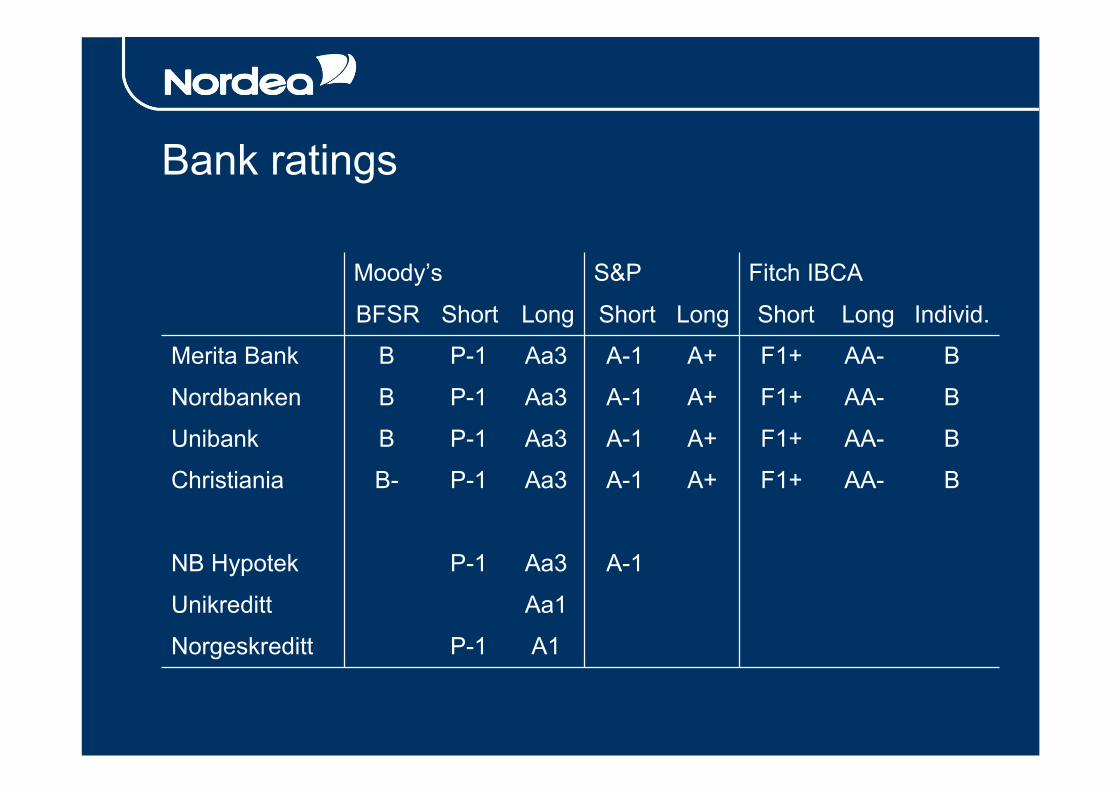
Bank ratings
Individ.LongShortLongShortLongShortBFSR
A1P-1Norgeskreditt
Aa1Unikreditt
A-1Aa3P-1NB Hypotek
BAA-F1+A+A-1Aa3P-1B-Christiania
BAA-F1+A+A-1Aa3P-1BUnibank
BAA-F1+A+A-1Aa3P-1BNordbanken
BAA-F1+A+A-1Aa3P-1BMerita Bank
Fitch IBCAS&PMoody’s

Insurance ratings
A1Tryg-Baltica Forsikring A/S
A- (excellent)A-Tryg-Baltica Forsikring, internationaltForsikringsselskab A/S
A- (excellent)A*Dansk Kautionsforsikrings-Aktieselskab
A.M.BestS&PMoody’s
*positive outlook

� Nordea share
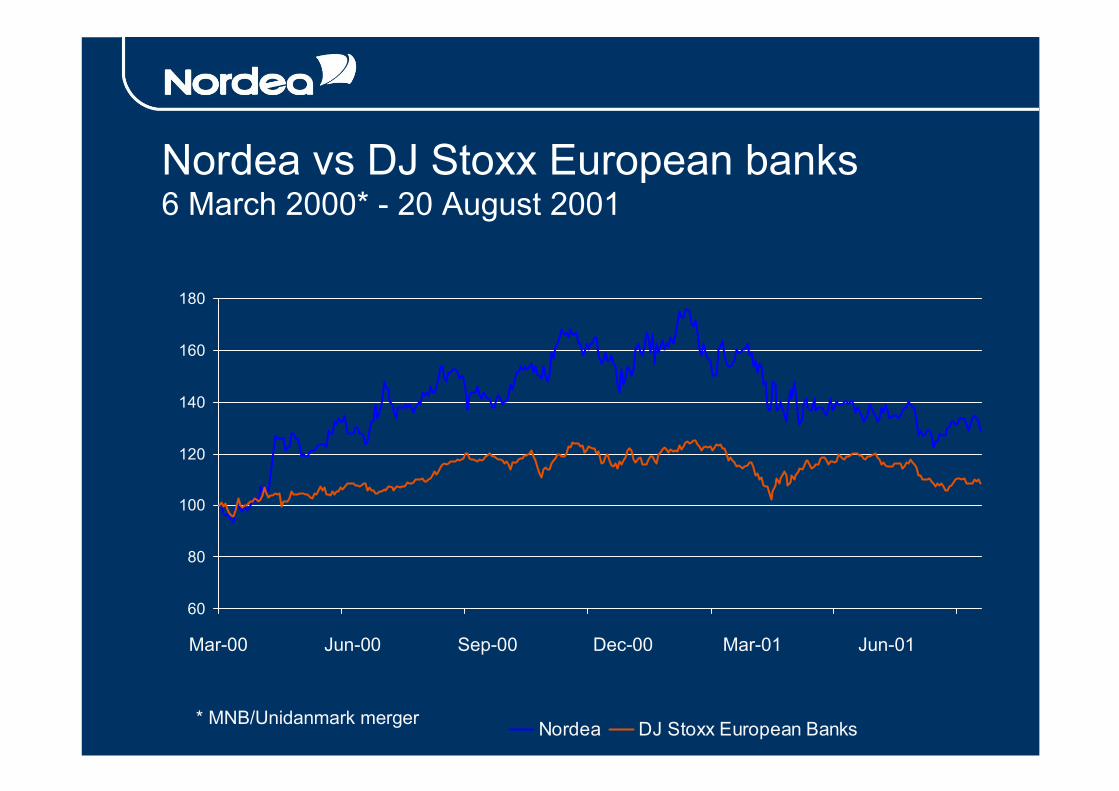
Nordea vs DJ Stoxx European banks6 March 2000* - 20 August 2001
60
80
100
120
140
160
180
Nordea DJ Stoxx European Banks
Jun-01Mar-01Jun-00Mar-00 Dec-00Sep-00
* MNB/Unidanmark merger

0
500
1000
1500
2000
2500
January February March April May June
Danske Bank SEB FSPB Handelsbanken Nordea
Nordic bank shares, liquidity H1 2001EURm
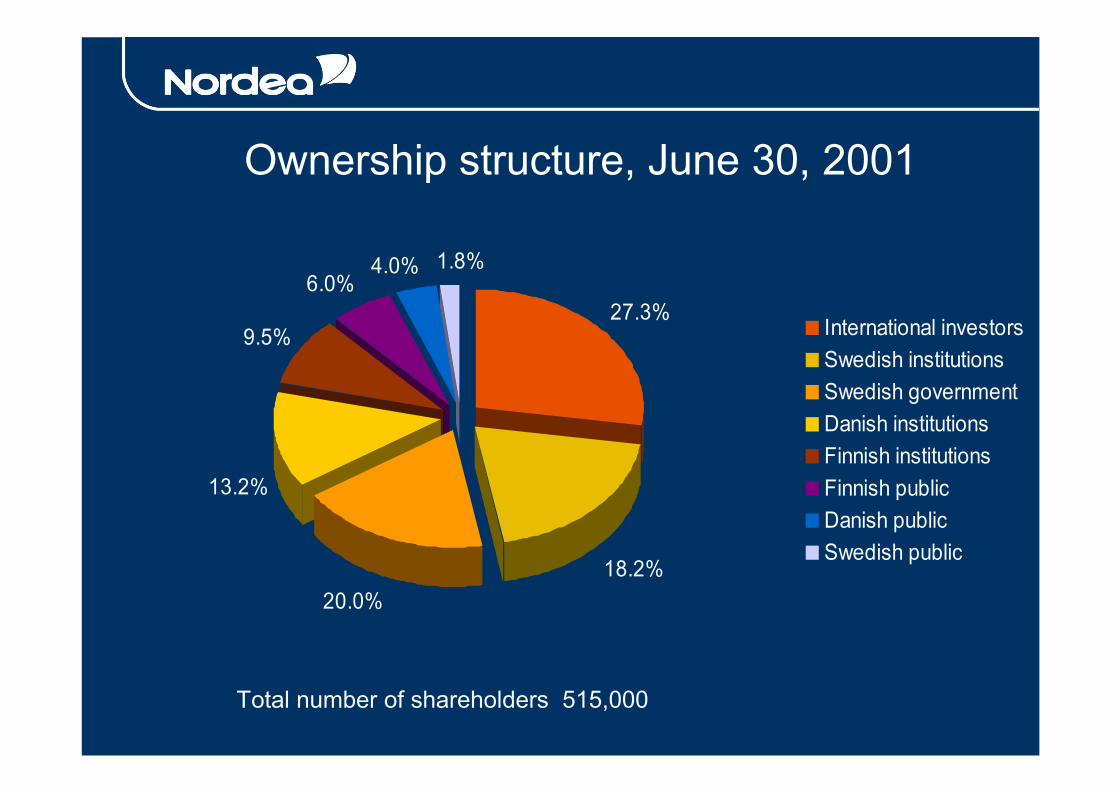
Ownership structure, June 30, 2001
20.0%
13.2%
9.5%
6.0%4.0%
27.3%
1.8%
18.2%
International investorsSwedish institutionsSwedish governmentDanish institutionsFinnish institutionsFinnish publicDanish publicSwedish public
Total number of shareholders 515,000
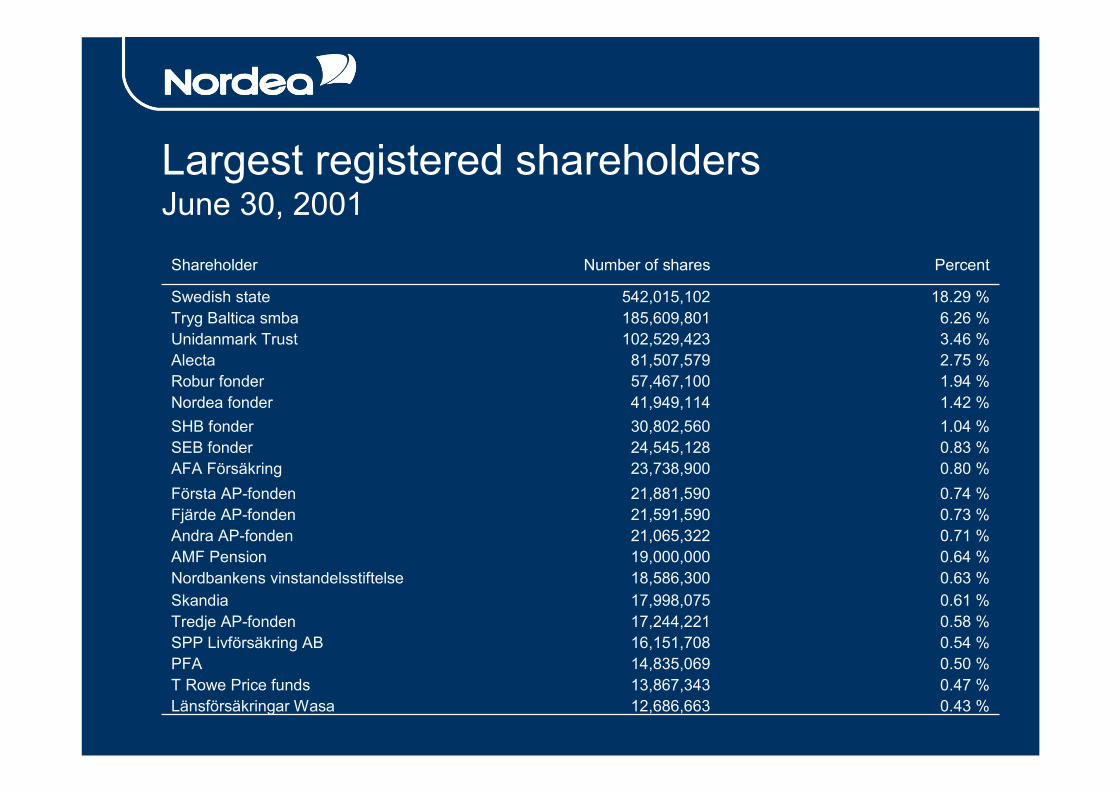
Largest registered shareholdersJune 30, 2001
18.29 %542,015,102Swedish state6.26 %185,609,801Tryg Baltica smba3.46 %102,529,423Unidanmark Trust2.75 %81,507,579Alecta1.94 %57,467,100Robur fonder1.42 %41,949,114Nordea fonder1.04 %30,802,560SHB fonder0.83 %24,545,128SEB fonder0.80 %23,738,900AFA Försäkring0.74 %21,881,590Första AP-fonden
0.43 %12,686,663Länsförsäkringar Wasa0.47 %13,867,343T Rowe Price funds0.50 %14,835,069PFA0.54 %16,151,708SPP Livförsäkring AB0.58 %17,244,221Tredje AP-fonden0.61 %17,998,075Skandia0.63 %18,586,300Nordbankens vinstandelsstiftelse0.64 %19,000,000AMF Pension0.71 %21,065,322Andra AP-fonden0.73 %21,591,590Fjärde AP-fonden
Percent Number of sharesShareholder

Number of shares
2,965,269,64917,000,000BuybackMarketApril, 2001
2.963.775.1541.494.495Other holdings of own shares
2,982,269,6493,076,932Conversion*New issues2000 -2001
2,979,192,71718,348,501UnidanmarkNew issueJune, 2000
2,960,844,216869,776,488UnidanmarkNew issueApril, 2000
2,091,067,728 815,800,287MeritaNew issueJan, 2000
Outstanding shares
Number ofshares issued
SubjectType oftransaction
Date
*Convertible bond conversions Aug 29, 2000 – June 30, 2001
Fully diluted average number of shares Jan- June 2001 2,994,766,002

Data per share
H1/01 2000 1999* 1998
Dividend, SEK - 2.00 1.75 1.64
Shareholders equity per share, EUR 3.76 3.74 3.43 2.68
Earnings per share, EUR 0.29 0.58 0.55 0.53
P/E ratio 11.6 14.0 10.6 11.0
* Pro forma incl. Unidanmark

� Netbanking
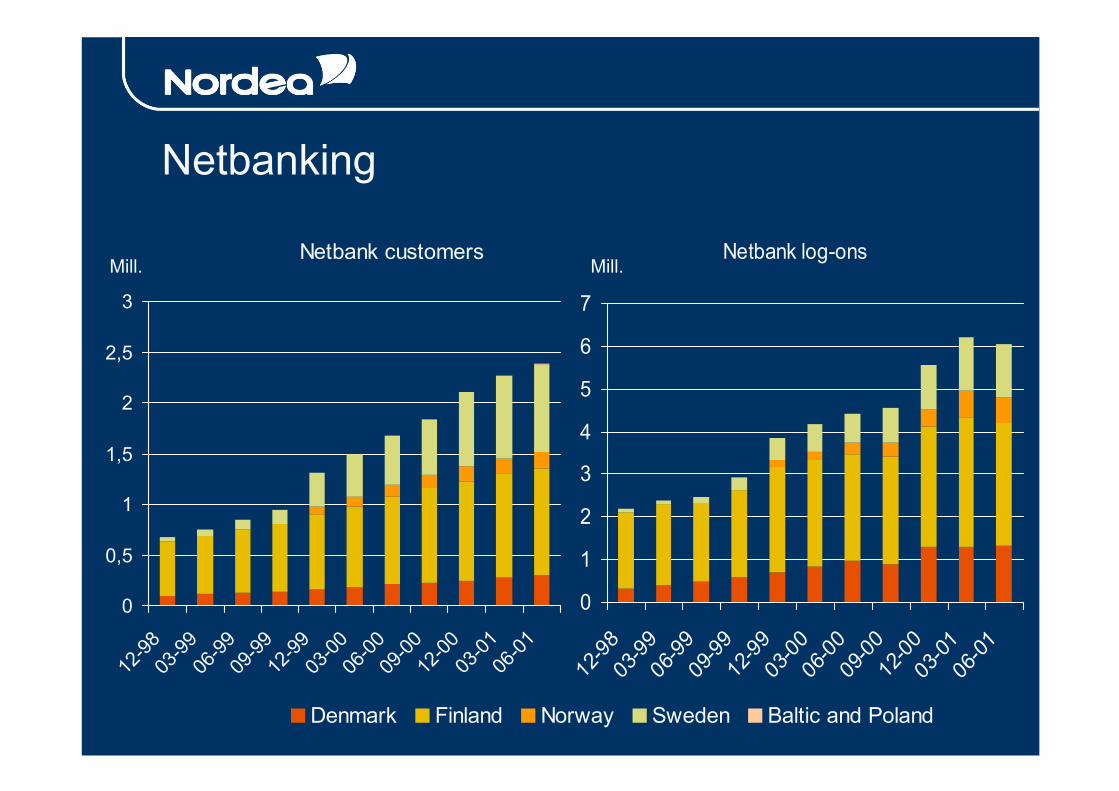
Netbanking
Netbank log-ons
0
1
2
3
4
5
6
7
12-98
03-99
06-99
09-99
12-99
03-00
06-00
09-00
12-00
03-01
06-01
Netbank customers
0
0,5
1
1,5
2
2,5
3
12-98
03-99
06-99
09-99
12-99
03-00
06-00
09-00
12-00
03-01
06-01
Denmark Finland Norway Sweden Baltic and Poland
Mill.Mill.

0
1
2
3
4
5
6
7
8
12-9803-99
06-9909-99
12-9903-00
06-0009-00
12-00 03-01
06-01
Denmark Finland Norway Sweden
Netbanking, bill-payments
Mill.
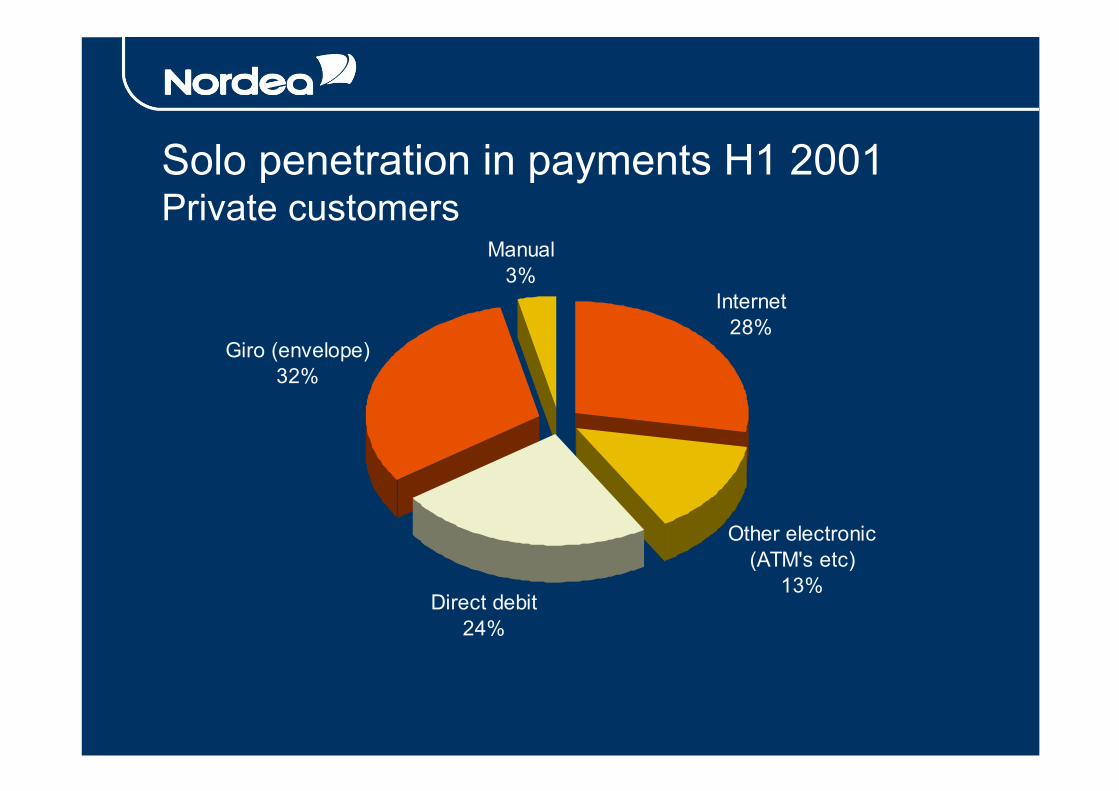
Solo penetration in payments H1 2001Private customers
Internet28%
Other electronic (ATM's etc)
13%Direct debit
24%
Giro (envelope)32%
Manual3%

58.258.6
55.055.3
50.2
46
48
50
52
54
56
58
60
Q2/00 Q3/00 Q4/00 Q1/01 Q2/01
Net equity trading penetration rate
Solo penetration in equity trading,executed trades
%

� Other
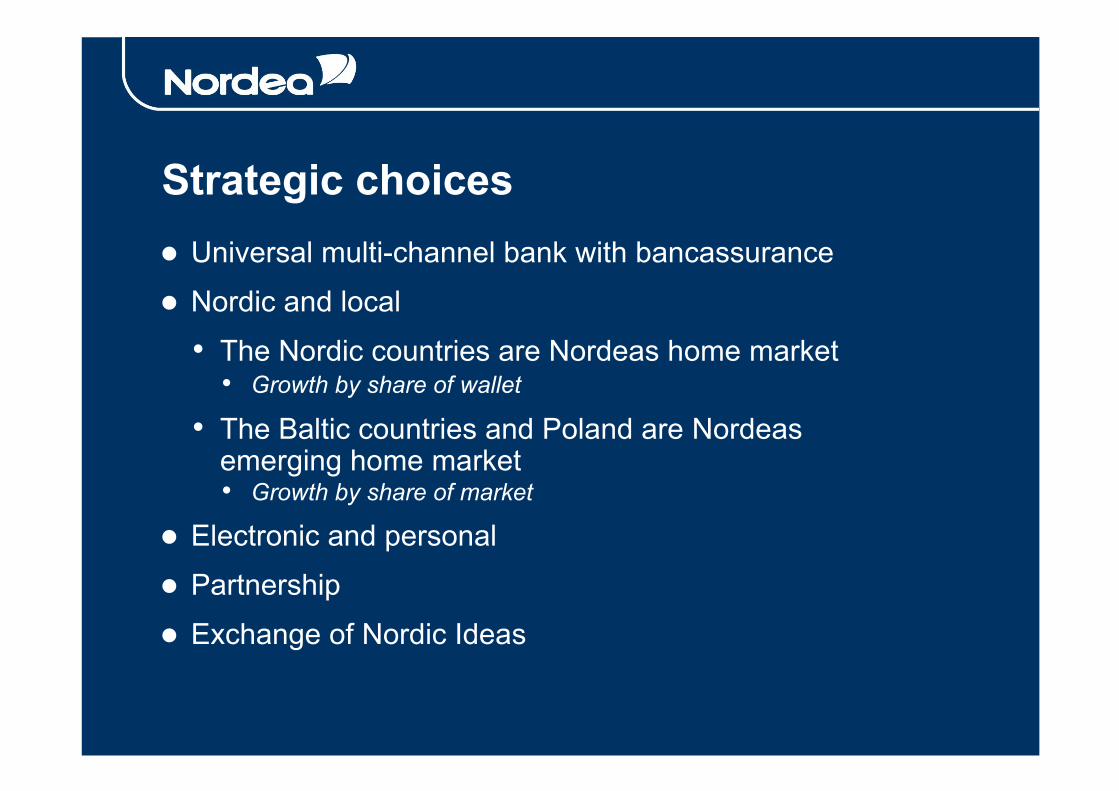
Strategic choices� Universal multi-channel bank with bancassurance� Nordic and local
• The Nordic countries are Nordeas home market• Growth by share of wallet
• The Baltic countries and Poland are Nordeasemerging home market• Growth by share of market
� Electronic and personal� Partnership� Exchange of Nordic Ideas

Retail Banking
• Nordic household customer strategy• Streamlining corporate customer concepts• Establishing long-term savings and life and private banking organisations• Implementing best practice e-banking capabilities in all countries, 2.3 million e-customers• Optimising multi-channel distribution
Denmark Finland Norway Sweden
Market position today
# 2 # 1 # 2 # 3
Leading retail bank in the Nordic and Baltic financial markets with substantial growth potential
Vision
Strategic initiatives
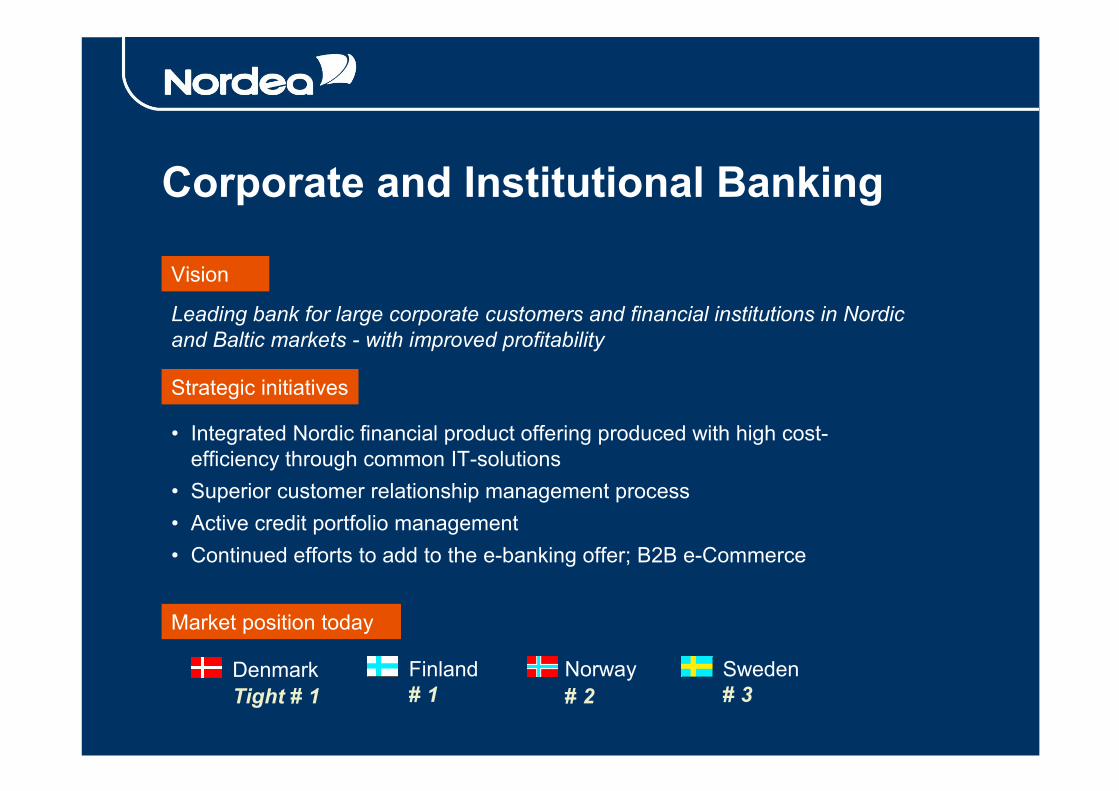
Corporate and Institutional Banking
• Integrated Nordic financial product offering produced with high cost-efficiency through common IT-solutions
• Superior customer relationship management process • Active credit portfolio management• Continued efforts to add to the e-banking offer; B2B e-Commerce
Market position today
Vision
Leading bank for large corporate customers and financial institutions in Nordic and Baltic markets - with improved profitability
Denmark Finland Norway SwedenTight # 1 # 1 # 2 # 3
Strategic initiatives
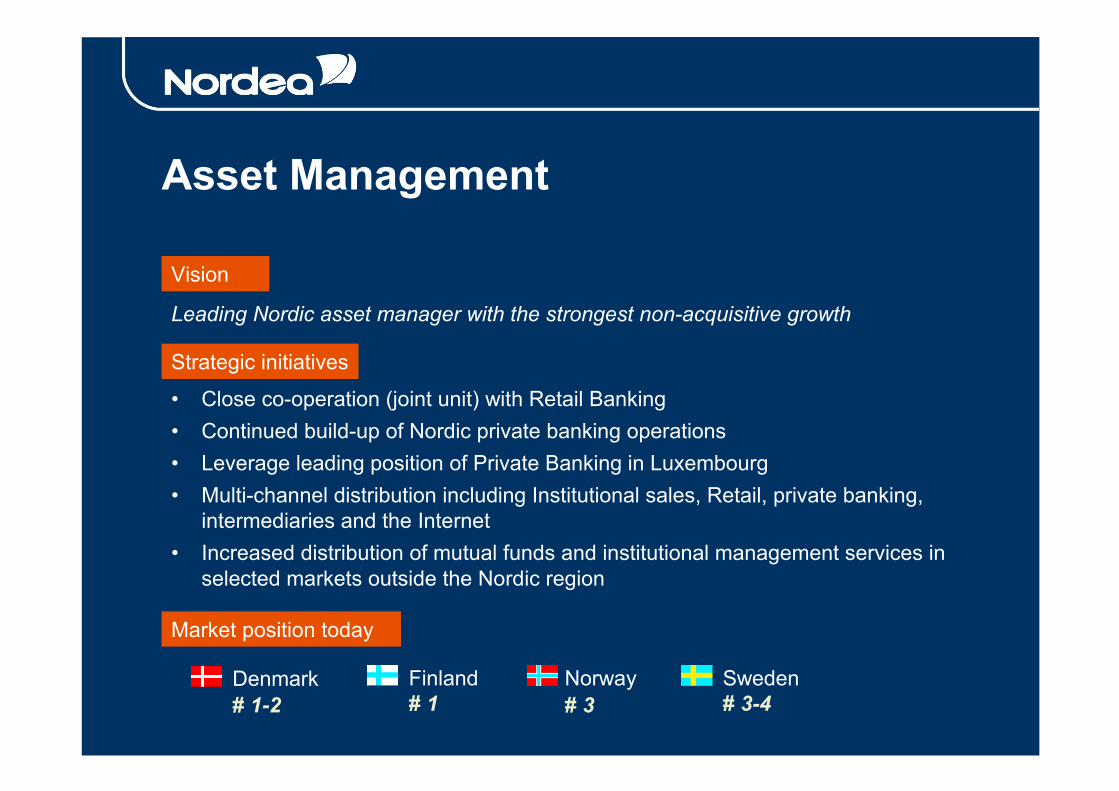
Asset Management
• Close co-operation (joint unit) with Retail Banking• Continued build-up of Nordic private banking operations• Leverage leading position of Private Banking in Luxembourg• Multi-channel distribution including Institutional sales, Retail, private banking,
intermediaries and the Internet• Increased distribution of mutual funds and institutional management services in
selected markets outside the Nordic region
Market position today
Vision
Leading Nordic asset manager with the strongest non-acquisitive growth
Denmark Finland Norway Sweden# 1-2 # 1 # 3 # 3-4
Strategic initiatives

Investment Banking
• Independent pan Nordic investment bank concept• Consolidating and further building an integrated Nordic business operation• Implementing UK and US operations with strong Nordic business focus• Focus on pan-Nordic transactions and integrated Nordic business
operations
Market position today
Vision
Leading advisory investment bank
Denmark Finland Norway# 2 # 1 # 5 # 8
Sweden
Strategic initiatives

Life Insurance and Pensions
• Sales of unit-linked life and pensions products• Development and sales of defined contribution pensions products in Sweden,
Norway and Finland• Starting up of life and pensions operations in Poland• Integration of business operations in Norway• Pan-Nordic e-insurance
Market position today
Vision
Major supplier of life insurance, pension plans and unit-linked in the Nordic region
Denmark Finland Norway# 2 # 1 # 5 # 8
Sweden
Strategic initiatives

General Insurance
• Bancassurance in Finland• Bancassurance in Norway• Combined ratio target 100 for all activities by use of TB’s experience from
Danish market• Continue strict underwriting control
Strategic initiatives
Market position today
Vision
Major supplier of general insurance in the Nordic region - aiming at profit before volumes
Denmark Finland Norway# 1 Start in
spring 2001# 3

Legal structure
Merita BankFinland
NordbankenSweden
CBKNorway
Nordea Companies Finland (NCF)
Vesta ForsikringNorway
Tryg-BalticaDenmark
UnibankDenmark
Nordea Companies Denmark (NCD)
Nordea Plc

Nordea
Christiania Bank og Kreditkasse
AssetManagement Life Insurance
InvestmentBanking
GeneralInsurance
Insurance Holding
Future legal structure
Unibank
Merita Bank
Nordbanken

� Macro statistics
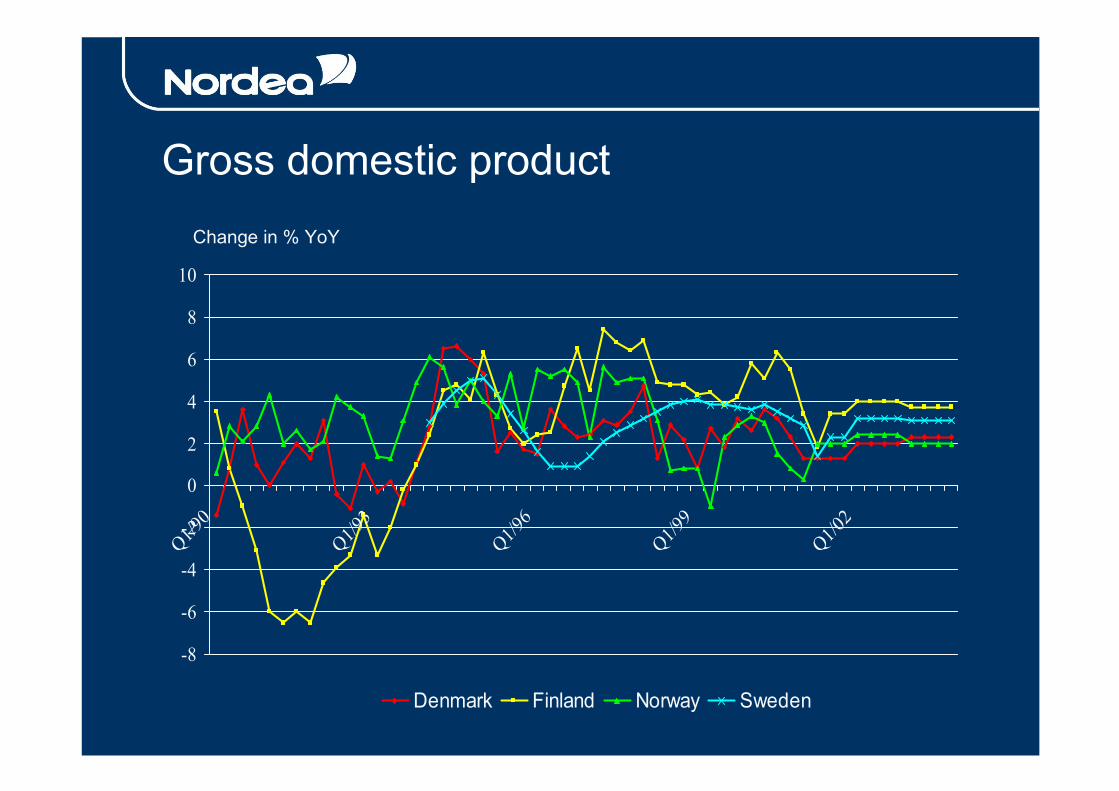
Gross domestic product
-8
-6
-4
-2
0
2
4
6
8
10
Q1/90
Q1/93
Q1/96
Q1/99
Q1/02
Denmark Finland Norway Sweden
Change in % YoY

Inflation
-2
0
2
4
6
8
10
12
14
1990
1993
1996
1999
2002
Denmark Finland Norway Sweden
%

Private consumption
-8
-6
-4
-2
0
2
4
6
8
10
Q1/90
Q1/93
Q1/96
Q1/99
Q1/02
Denmark Finland Norway Sweden
Change in % YoY

Household savings ratio
0
2
4
6
8
10
12
1993 1994 1995 1996 1997 1998 1999 2000
Denmark Finland Norway Sweden
%

Unemployment
0
2
4
6
8
10
12
14
16
18
20
Q1/90Q1
/91Q1
/92Q1
/93Q1
/94Q1
/95Q1
/96Q1
/97Q1
/98Q1
/99Q1
/00Q1
/01Q1
/02Q1
/03
Denmark Finland Norway Sweden
% of labour force

Bankruptcies
0
200
400
600
800
1000
1200
1400
1600
1800
Q1/94
Q1/95
Q1/96
Q1/97
Q1/98
Q1/99
Q1/00
Q1/01
Denmark Finland Norway Sweden
Number of bankruptcies per month

Exchange rate, Euro/USD
0,8
0,85
0,9
0,95
1
1,05
1,1
1,15
1,2
2-1 -9
82-3
-98
2-5 -9
82-7
-98
2-9 -9
82-1
1 -98
2-1 -9
92-3
-99
2-5 -9
92-7
-99
2-9 -9
92-1
1 -99
2-1 -0
02-3
-00
2-5 -0
02-7
-00
2-9 -0
02-1
1 -00
2-1 -0
12-3
-01
2-5 -0
12-7
-01
Euro/USD

Exchange rate, Euro/SEK
8
8,4
8,8
9,2
9,6
10
1-1 -9
81-3
-98
1-5 -9
81-7
-98
1-9 -9
81-1
1 -98
1-1 -9
91-3
-99
1-5 -9
91-7
-99
1-9 -9
91-1
1 -99
1-1 -0
01-3
-00
1-5 -0
01-7
-00
1-9 -0
01-1
1 -00
1-1 -0
11-3
-01
1-5 -0
11-7
-01
EUR/SEK
SEK
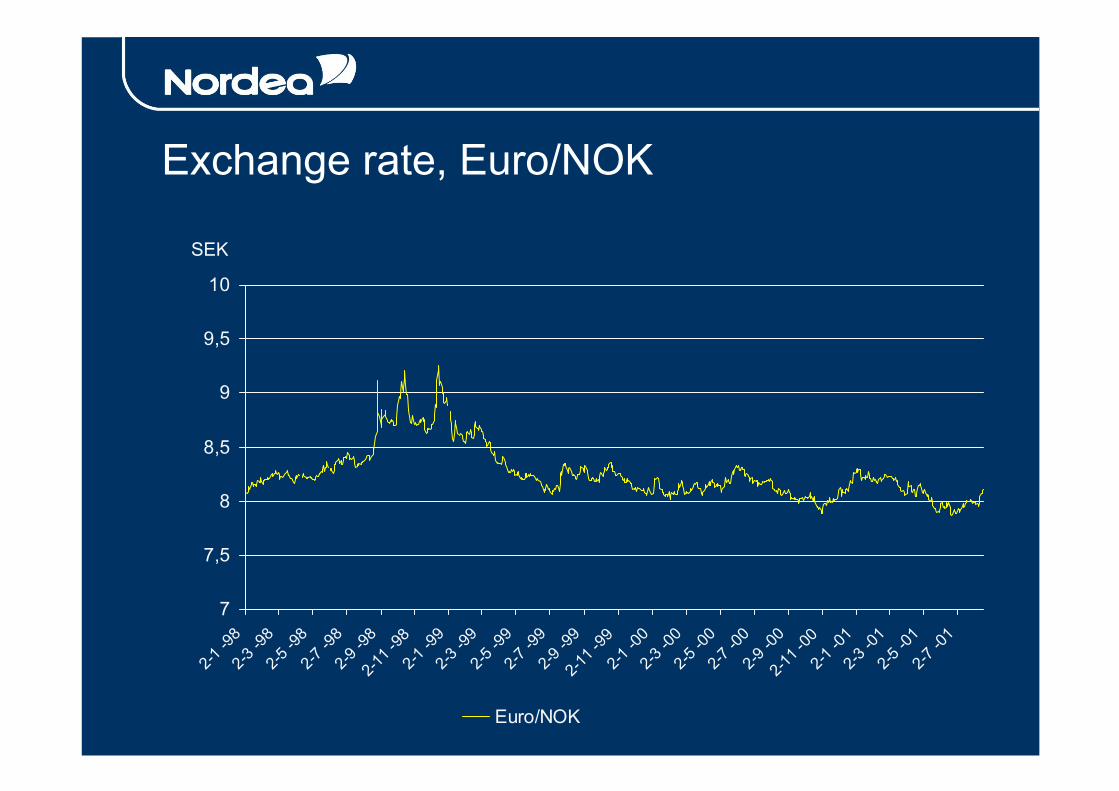
Exchange rate, Euro/NOK
7
7,5
8
8,5
9
9,5
10
2-1 -9
82-3
-98
2-5 -9
82-7
-98
2-9 -9
82-1
1 -98
2-1 -9
92-3
-99
2-5 -9
92-7
-99
2-9 -9
92-1
1 -99
2-1 -0
02-3
-00
2-5 -0
02-7
-00
2-9 -0
02-1
1 -00
2-1 -0
12-3
-01
2-5 -0
12-7
-01
Euro/NOK
SEK

Stock exchange indices
0
500
1000
1500
2000
2500
31-1
-97
30-4
-97
31-7
-97
31-10
-97
31-1
-98
30-4
-98
31-7
-98
31-10
-98
31-1
-99
30-4
-99
31-7
-99
31-10
-99
31-1
-00
30-4
-00
31-7
-00
31-10
-00
31-1
-01
30-4
-01
HEX Index Affärsvärldens General IndexOslo Total Index KFX Index
970131 = 100

Government bond, 10 year
3
3,5
4
4,5
5
5,5
6
6,5
7
1-1 -9
81-3
-98
1-5 -9
81-7
-98
1-9 -9
81-1
1 -98
1-1 -9
91-3
-99
1-5 -9
91-7
-99
1-9 -9
91-1
1 -99
1-1 -0
01-3
-00
1-5 -0
01-7
-00
1-9 -0
01-1
1 -00
1-1 -0
11-3
-01
1-5 -0
11-7
-01
Denmark Finland Norway Sweden
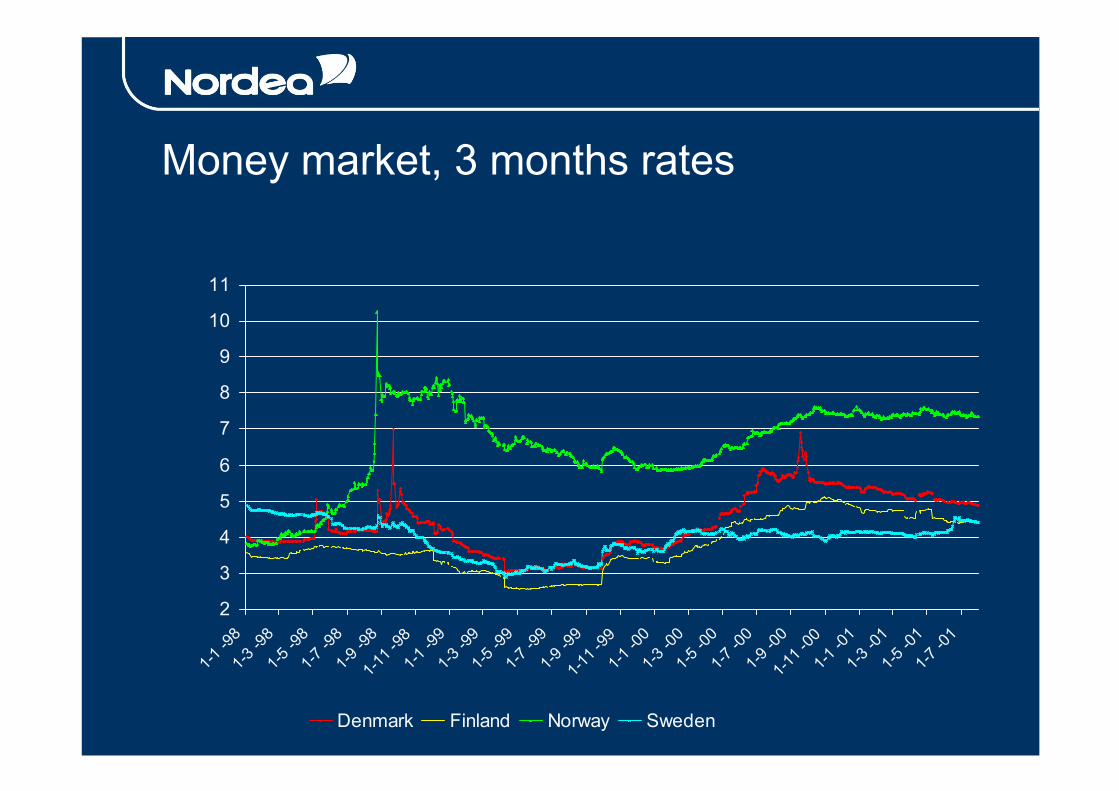
Money market, 3 months rates
2
3
4
5
6
7
8
9
10
11
1-1 -9
81-3
-98
1-5 -9
81-7
-98
1-9 -9
81-1
1 -98
1-1 -9
91-3
-99
1-5 -9
91-7
-99
1-9 -9
91-1
1 -99
1-1 -0
01-3
-00
1-5 -0
01-7
-00
1-9 -0
01-1
1 -00
1-1 -0
11-3
-01
1-5 -0
11-7
-01
Denmark Finland Norway Sweden