nordea 1 alpha 15 ma fund
TRANSCRIPT

Nordea 1 – Alpha 15 MA FundLU0607983383, BI-EUR
Advertising Material for professional investors only, investing for their own account – according to MiFID definition
Any investment decision in the sub-funds should be made on the basis of the current prospectus and the Key Investor Information Document (KIID).
January 2022

Open
22
NordeaA stable bank among the largest European players
Ratings:
• Standard & Poor's
• Moody's
• Fitch
AA-
Aa3
AA-
Common Equity Tier 1 capital
ratio17%
Market Capitalisation €46bn
Total assets €614bn
AuM (Asset & Wealth Management) €393bn
Source: Nordea Bank Abp. As of date: 30.09.2021
Nordea is the largest financial institution in the Nordic region
The 4 business areas are:
• Personal Banking;
• Business Banking;
• Large Corporate & Institutions; and
• Asset & Wealth Management
Personal
Customers
~9.2m
Corporate
customers
~540,000
Number of
employees
~27,000
Total operating
income YTD Sep
2021
€7,182m

Open
3
Nordea Asset ManagementAt a glance
Source: Nordea Investment Funds S.A. and Nordea Investment Management AB. Date: 30.09.2021. * © 2021 Morningstar, Inc. All Rights Reserved as of 30.09.2021. The Morningstar Rating is an assessment of a fund’s past performance —
based on both return and risk — which shows how similar investments compare with their competitors. A high rating alone is insufficient basis for an investment decision. Past performance is no guarantee of future results.
NAM in numbers Multi-boutique approach Key facts
€ 281bn
In assets under management (AUM) One platform, many specialists: alpha and outcome
solutions in one platform to serve clients in all
weather
90% AUM managed by internal boutiques
10% AUM managed by best of breed external
boutiques
12 internal boutiques covering alpha, ESG
and outcome
Nearly 50% of AUM are from third party clients
Servicing clients in 55 countries across the globe
34 Nordea 1 funds with a Morningstar rating
of 4 or 5 stars*
19 Nordea 1 funds with more than € 1bn of AUM
32 Nordea 1 funds with more than € 500m of AUM
44 Nordea 1 funds with more than € 250m of AUM
A pioneer in ESG/SRI since 1988 currently
managing € 177bn
1932
44

Open
Nordea Asset ManagementOne platform, many specialists
The Nordea multi-boutique approach
allows us to propose some of the best
investment solutions to our clients by
combining internal strengths with
exclusive external competences.
4
Open
5
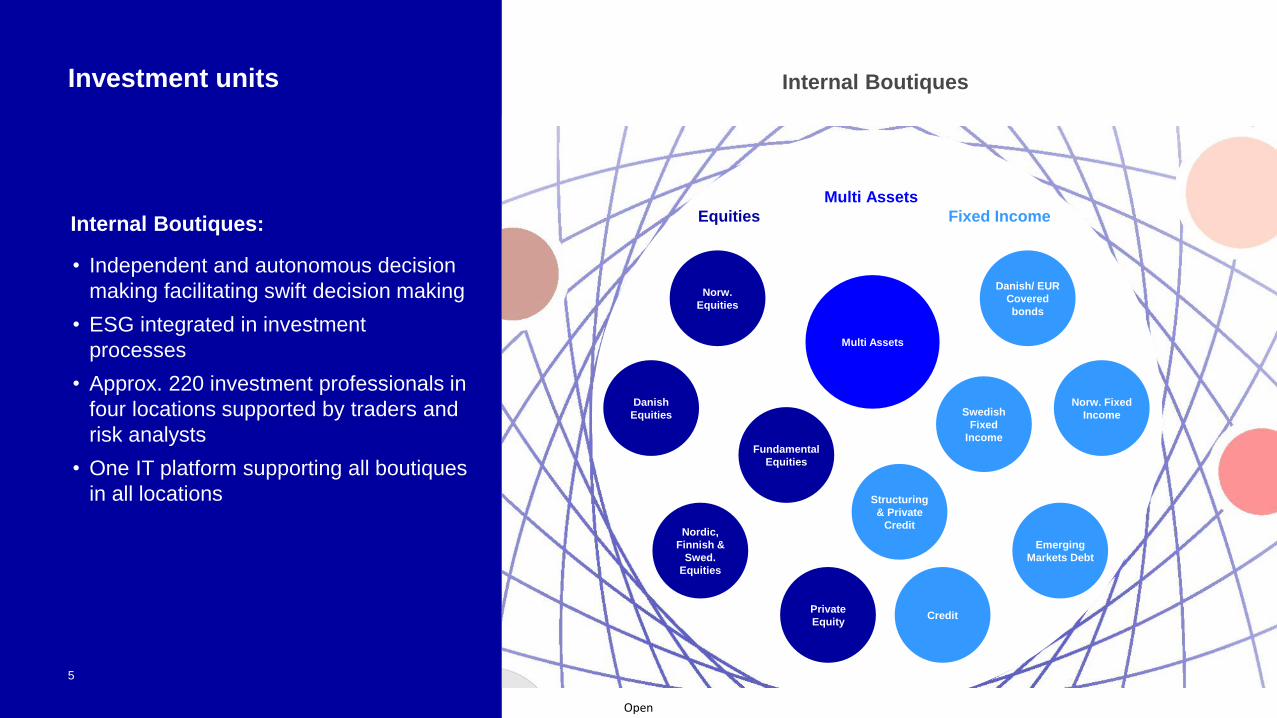
Investment units
Internal Boutiques:
• Independent and autonomous decision
making facilitating swift decision making
• ESG integrated in investment
processes
• Approx. 220 investment professionals in
four locations supported by traders and
risk analysts
• One IT platform supporting all boutiques
in all locations
Equities
Multi Assets
Fixed Income
Internal Boutiques
Multi Assets
Fundamental
Equities
Nordic,
Finnish &
Swed.
Equities
Norw.
Equities
Danish
Equities
Private
Equity
Danish/ EUR
Covered
bonds
Swedish
Fixed
Income
Norw. Fixed
Income
Credit
Emerging
Markets Debt
Structuring
& Private
Credit

Open
6
Nordea Asset ManagementSelected Nordea solutions to meet your needs
Note that some of the strategies listed above are only available as a sub-fund vehicle within the Nordea 1, SICAV. The Nordea 1, SICAV consists of 76 sub-funds covering the full asset spectrum out of which 58 products have more than
€100m AuM and 49 products have more than €200m AuM. Source: Nordea Investment Funds S.A. Date: 30.09.2021.

Why Liquid Alternatives and why us?

Open
8
Why liquid alternatives today?Historical vs. expected returns and risk from EUR based investor’s perspective
Source: Nordea Investment Management AB, on the basis of analyses carried out by the Multi Assets Team. Period under consideration: 31.12.2011 – 31.12.2021. Past and expected returns are unhedged, in base currency and from EUR based investor’s stance. The performance represented is historical; past performance is not a reliable indicator of future results and investors may not recover the full amount invested. The value of your investment can go up and down, and you could lose some or all of your invested money. Expected numbers are only targets. There can be no warranty that an investment objective, targeted returns and results of an investment structure is achieved.

Open
9
Source: Bloomberg. Note: The Chicago Board Options Exchange Volatility Index reflects a market estimate of future volatility, based on the weighted average of the implied volatilities for a wide range of strikes.
• Low Vol has been a key benefit in the last
years and was stemming from the strong
growth-driven market environment
• But: Macro data are worsening rapidly and
market uncertainties increase: Covid-19,
growth outlook, central bank interventions
• Net result: Market sell-offs, bumpier
markets, less calm market environment
→ Liquid alternatives are needed
to add diversification without
sacrificing returns!
Volatility is coming back to the market with forceDiversify your portfolio with liquid alternatives!

Open
Equity-like returns with limited correlations to traditional asset classes
Alpha 15 MA Strategy proposition
• An innovate, alternative solution:
‒ Objective A15 MA: cash +7-10% p.a. (gross), vol. 10-15% over
a cycle1
‒ Process: Quantitative, bottom-up risk premia approach with a
fundamental overlay
• Employs a diversified universe of risk premia:
‒ To face the low expected returns offered by traditional asset
classes and unlock additional sources of return
• Delivers true diversification:
‒Combines traditional and alternative risk premia to offer low
correlation to traditional asset classes
10
1) There can be no warranty that an investment objective, targeted returns and results of an investment structure is achieved. The value of your investment can go up and down, and you could lose some or all of your invested
money. During adverse market environments, the volatility can reach around 15% in the A15MAS. 2) Source: Nordea Investment Management AB. Based on monthly observations. The product performance represents the Alpha 15 Multi
Asset Strategy, gross of fees and in EUR. Period under consideration: 01.01.2017 - 31.12.2021. The performance represented is historical; past performance is not a reliable indicator of future results and investors may not recover
the full amount invested. The value of your investment can go up and down, and you could lose some or all of your invested money. 3) The equity index used is the MSCI World 100% Hedged to EUR NDR. 4) The bond returns are
based on the Bloomberg Barclays Series-E Germany Govt 7-10 YR in EUR. Please note the Alpha 15 MA Strategy does not have any official benchmarks and the indices are used for comparison purposes only. Internally calculated by the
investment team and produced on a best effort basis.
Attractive risk-adjusted returns and
low correlation to traditional asset classes
5 year p.a. A15MA Strategy
Return2 11.20%
Volatility 8.51%
Sharpe Ratio 1.37
Equity Correlation3,4 0.45
Bond Correlation3 0.16
Open
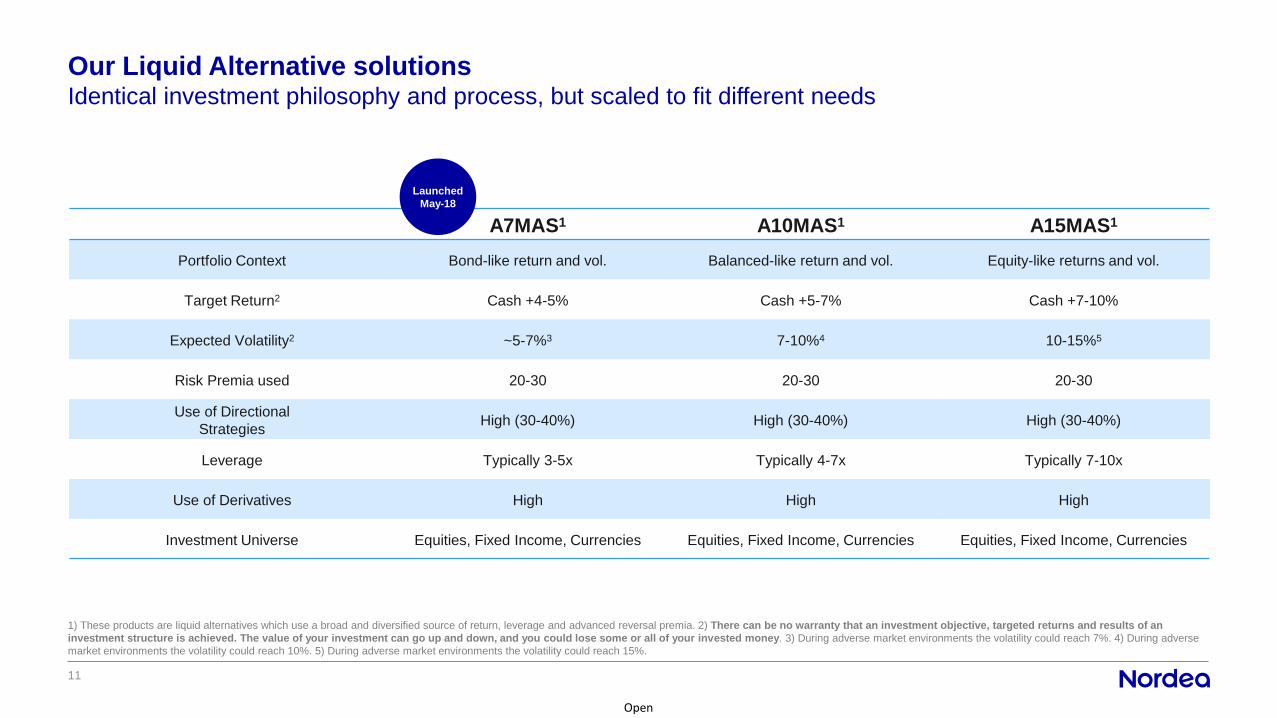
Identical investment philosophy and process, but scaled to fit different needs
Our Liquid Alternative solutions
11
1) These products are liquid alternatives which use a broad and diversified source of return, leverage and advanced reversal premia. 2) There can be no warranty that an investment objective, targeted returns and results of an
investment structure is achieved. The value of your investment can go up and down, and you could lose some or all of your invested money. 3) During adverse market environments the volatility could reach 7%. 4) During adverse
market environments the volatility could reach 10%. 5) During adverse market environments the volatility could reach 15%.
A7MAS1 A10MAS1 A15MAS1
Portfolio Context Bond-like return and vol. Balanced-like return and vol. Equity-like returns and vol.
Target Return2 Cash +4-5% Cash +5-7% Cash +7-10%
Expected Volatility2 ~5-7%3 7-10%4 10-15%5
Risk Premia used 20-30 20-30 20-30
Use of Directional
StrategiesHigh (30-40%) High (30-40%) High (30-40%)
Leverage Typically 3-5x Typically 4-7x Typically 7-10x
Use of Derivatives High High High
Investment Universe Equities, Fixed Income, Currencies Equities, Fixed Income, Currencies Equities, Fixed Income, Currencies
Launched
May-18

Multi Assets Team
Investment philosophy + process
Open
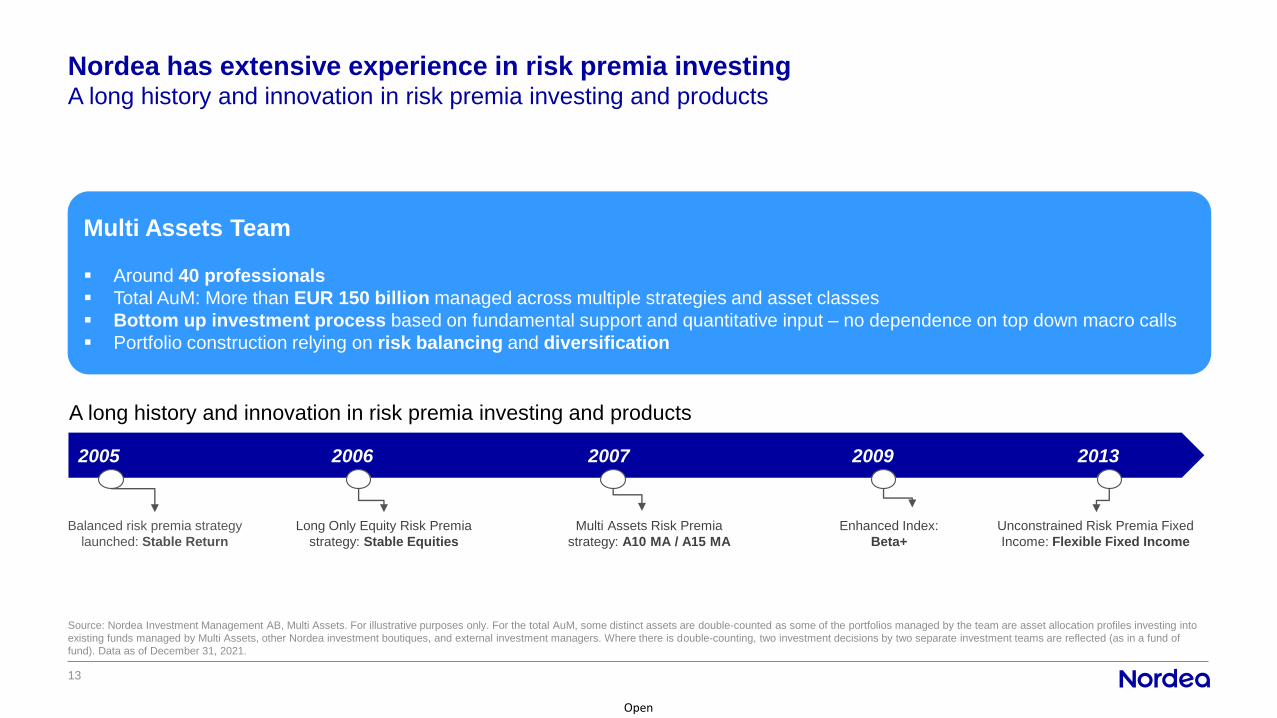
A long history and innovation in risk premia investing and products
Nordea has extensive experience in risk premia investing
13
Source: Nordea Investment Management AB, Multi Assets. For illustrative purposes only. For the total AuM, some distinct assets are double-counted as some of the portfolios managed by the team are asset allocation profiles investing into
existing funds managed by Multi Assets, other Nordea investment boutiques, and external investment managers. Where there is double-counting, two investment decisions by two separate investment teams are reflected (as in a fund of
fund). Data as of December 31, 2021.
2005 2006 2007 2009 2013
Long Only Equity Risk Premia
strategy: Stable Equities
Multi Assets Risk Premia
strategy: A10 MA / A15 MA
Unconstrained Risk Premia Fixed
Income: Flexible Fixed Income
Enhanced Index:
Beta+
Balanced risk premia strategy
launched: Stable Return
Multi Assets Team
▪ Around 40 professionals
▪ Total AuM: More than EUR 150 billion managed across multiple strategies and asset classes
▪ Bottom up investment process based on fundamental support and quantitative input – no dependence on top down macro calls
▪ Portfolio construction relying on risk balancing and diversification
A long history and innovation in risk premia investing and products

Open
14
Understanding asset class behaviour with Traditional risk premia
Example: European Corporate Bonds
Focus on returns from duration and credit risk rather than total return
• Definition of a risk premium: Excess
return required for taking a certain risk
• Risk is easier to identify when focusing
on risk premiums rather than asset classes
• Correlation analysis is more robust for
risk premiums than for asset classes
Example: European Corporate Bonds
Note: For illustrative purposes only.
Focus on risk premia rather than asset classes
Risk Free Rate
German Duration
Risk Premium
Europe IG Credit Spreads
European Corporate Bonds Total Return

Open
Note: For illustrative purposes only.
15
No need to make the correct macroeconomic call to achieve a positive total return in all periods of the
economic cycle
The Economic Cycle
Return drivers working
in periods of recession
Return drivers working
in periods of recovery
Total performance
Illustrative performance
What is unique about Nordea’s MAT Risk Premia approach?Macro-call’s independent
Open
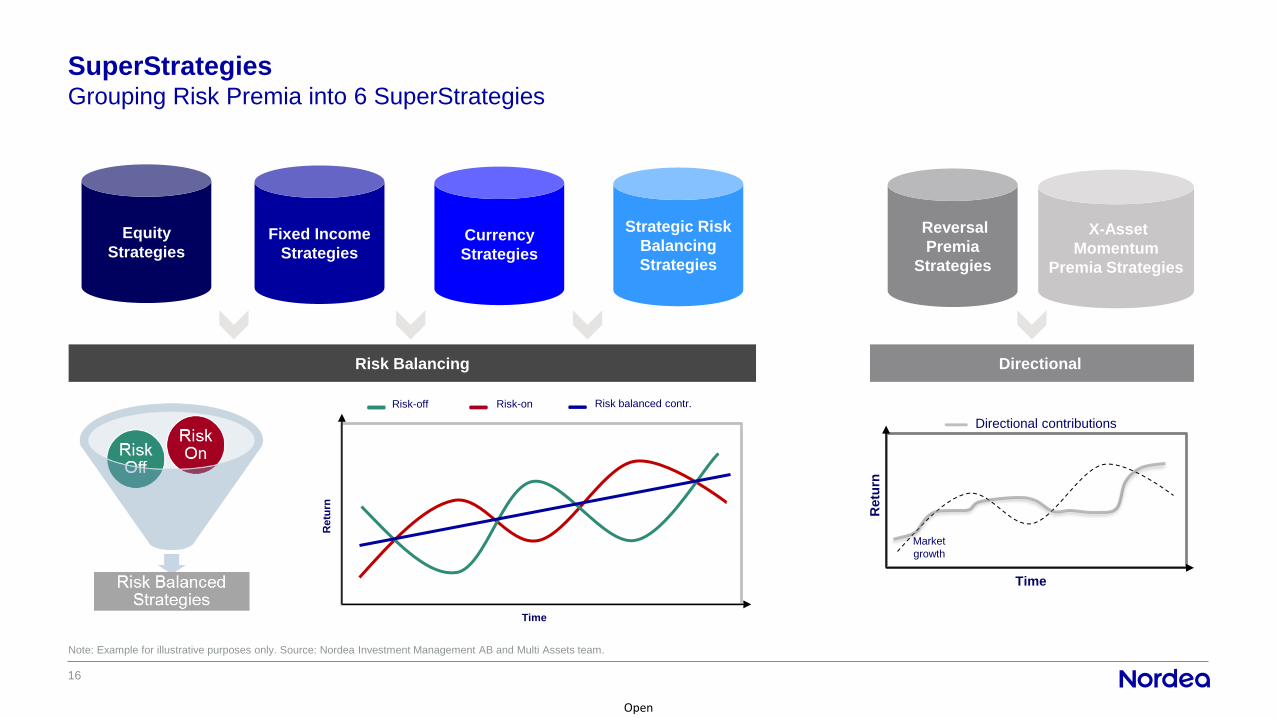
Note: Example for illustrative purposes only. Source: Nordea Investment Management AB and Multi Assets team.
SuperStrategiesGrouping Risk Premia into 6 SuperStrategies
Risk Balancing Directional
X-Asset
Momentum
Premia Strategies
Reversal
Premia
Strategies
Strategic Risk
Balancing
Strategies
Currency
Strategies
Fixed Income
Strategies
Equity
Strategies
Time
Retu
rn
Directional contributions
Market
growth
Time
Retu
rn
Risk-off Risk-on Risk balanced contr.
16
Open
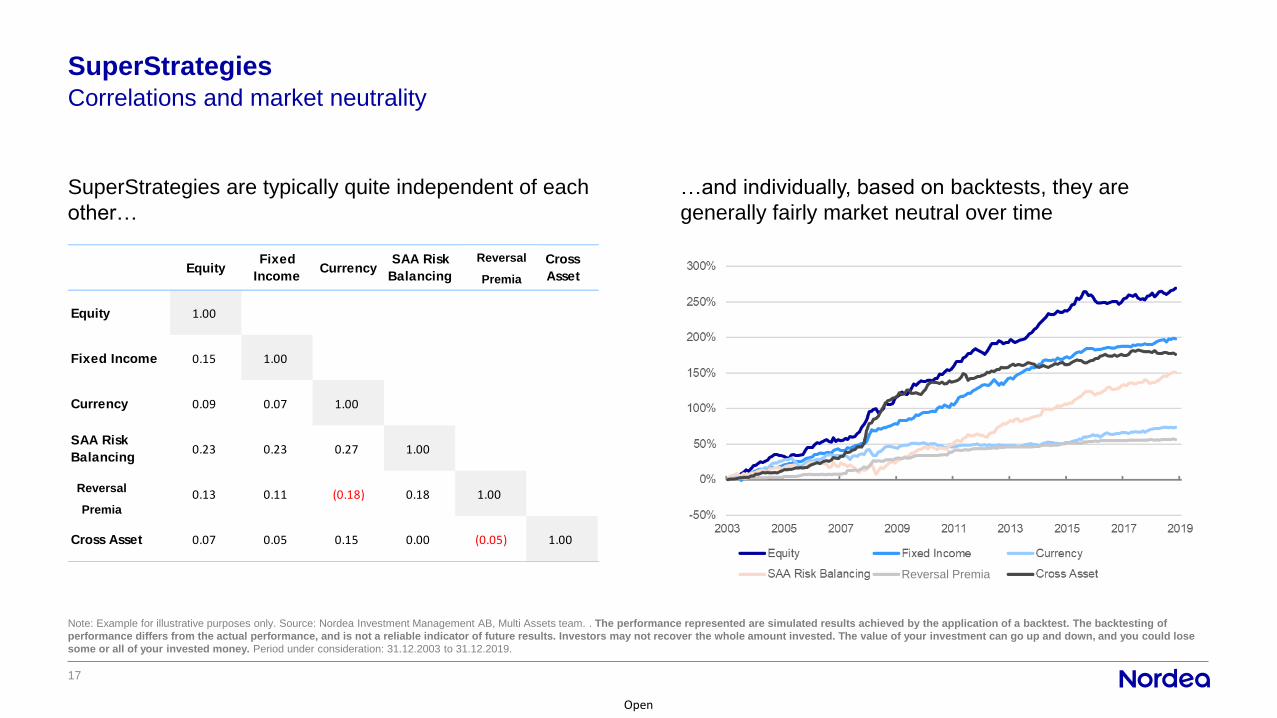
Correlations and market neutrality
SuperStrategies
17
Note: Example for illustrative purposes only. Source: Nordea Investment Management AB, Multi Assets team. . The performance represented are simulated results achieved by the application of a backtest. The backtesting of
performance differs from the actual performance, and is not a reliable indicator of future results. Investors may not recover the whole amount invested. The value of your investment can go up and down, and you could lose
some or all of your invested money. Period under consideration: 31.12.2003 to 31.12.2019.
…and individually, based on backtests, they are
generally fairly market neutral over time
SuperStrategies are typically quite independent of each
other…
EquityFixed
IncomeCurrency
SAA Risk
BalancingTrading
Cross
Asset
Equity 1.00
Fixed Income 0.15 1.00
Currency 0.09 0.07 1.00
SAA Risk
Balancing0.23 0.23 0.27 1.00
Trading 0.13 0.11 (0.18) 0.18 1.00
Cross Asset 0.07 0.05 0.15 0.00 (0.05) 1.00
Reversal Premia
Reversal
Premia
Reversal
Premia
Open
18
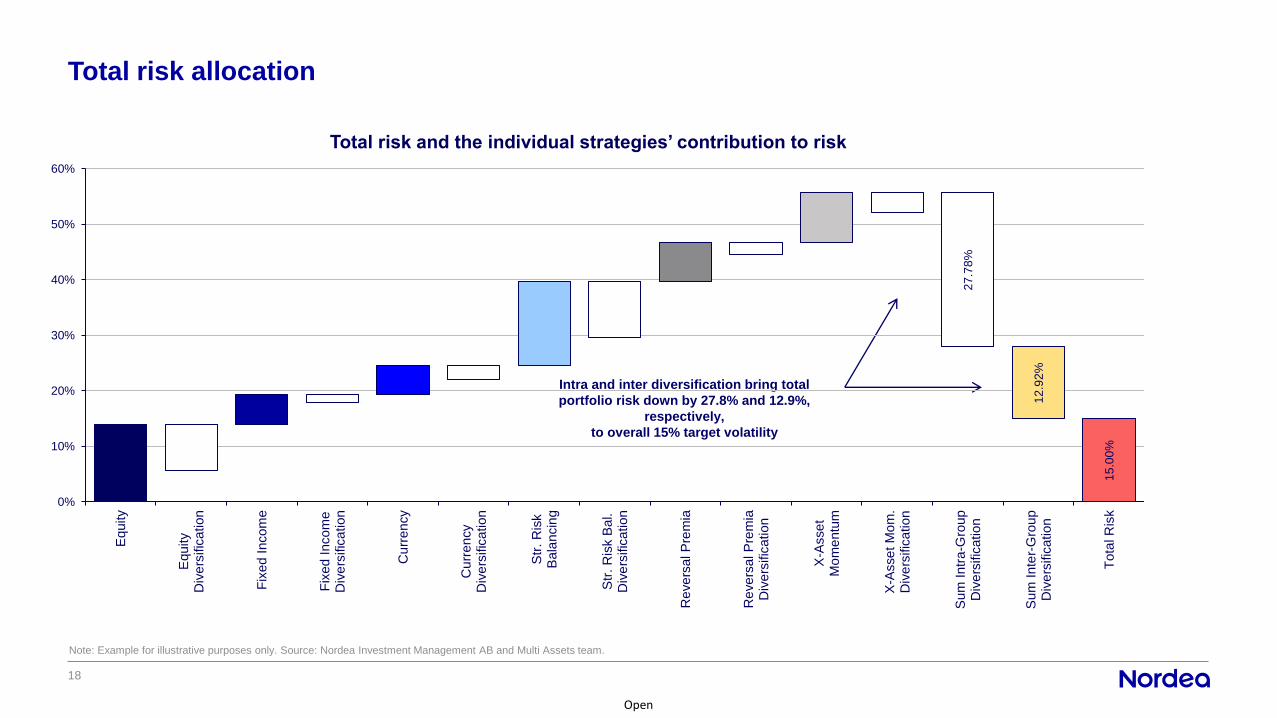
Total risk allocation
Note: Example for illustrative purposes only. Source: Nordea Investment Management AB and Multi Assets team.
Intra and inter diversification bring total
portfolio risk down by 27.8% and 12.9%,
respectively,
to overall 15% target volatility
27
.78
%
12
.92
%
15
.00
%
0%
10%
20%
30%
40%
50%
60%
Equity
Equity
Div
ers
ific
ation
Fix
ed
Incom
e
Fix
ed
Incom
eD
ive
rsific
ation
Cu
rren
cy
Cu
rren
cy
Div
ers
ific
ation
Str
. R
isk
Bala
ncin
g
Str
. R
isk B
al.
Div
ers
ific
ation
Re
ve
rsal P
rem
ia
Re
ve
rsal P
rem
iaD
ive
rsific
ation
X-A
sse
tM
om
entu
m
X-A
sse
t M
om
.D
ive
rsific
ation
Sum
Intr
a-G
roup
Div
ers
ific
ation
Sum
Inte
r-G
roup
Div
ers
ific
ation
Tota
l R
isk
Total risk and the individual strategies’ contribution to risk
Open
19
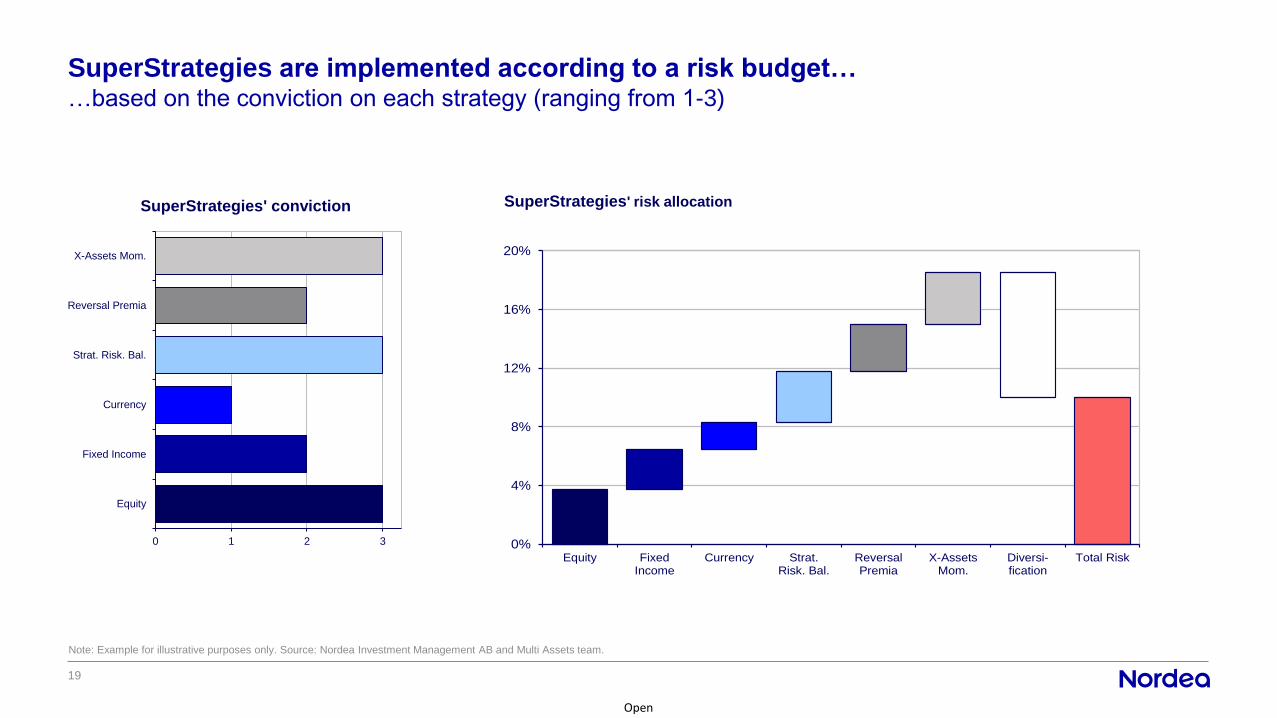
SuperStrategies are implemented according to a risk budget……based on the conviction on each strategy (ranging from 1-3)
Note: Example for illustrative purposes only. Source: Nordea Investment Management AB and Multi Assets team.
SuperStrategies' risk allocation
0 1 2 3
Equity
Fixed Income
Currency
Strat. Risk. Bal.
Reversal Premia
X-Assets Mom.
SuperStrategies' conviction
0%
4%
8%
12%
16%
20%
Equity FixedIncome
Currency Strat.Risk. Bal.
ReversalPremia
X-AssetsMom.
Diversi-fication
Total Risk

Nordea 1 – Alpha 15 MA Fund
Why invest?
Open
21
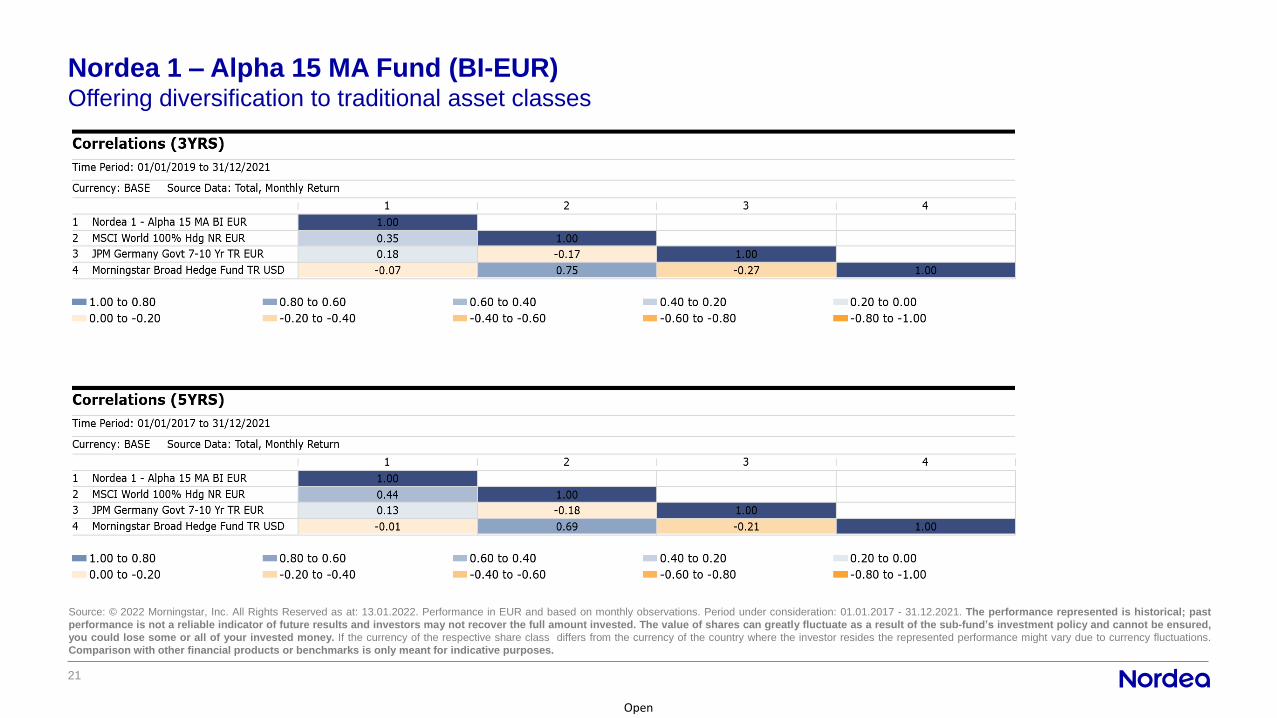
Nordea 1 – Alpha 15 MA Fund (BI-EUR)Offering diversification to traditional asset classes
Source: © 2022 Morningstar, Inc. All Rights Reserved as at: 13.01.2022. Performance in EUR and based on monthly observations. Period under consideration: 01.01.2017 - 31.12.2021. The performance represented is historical; past
performance is not a reliable indicator of future results and investors may not recover the full amount invested. The value of shares can greatly fluctuate as a result of the sub-fund’s investment policy and cannot be ensured,
you could lose some or all of your invested money. If the currency of the respective share class differs from the currency of the country where the investor resides the represented performance might vary due to currency fluctuations.
Comparison with other financial products or benchmarks is only meant for indicative purposes.
Open
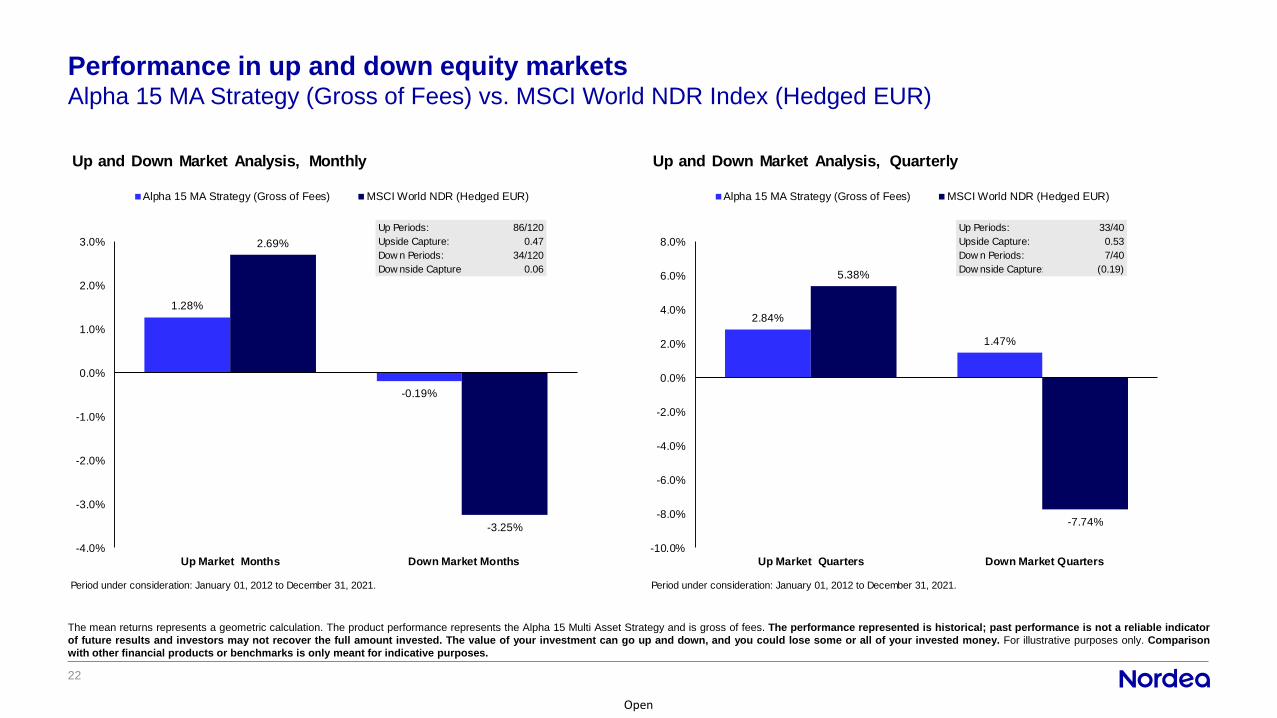
Performance in up and down equity markets
22
The mean returns represents a geometric calculation. The product performance represents the Alpha 15 Multi Asset Strategy and is gross of fees. The performance represented is historical; past performance is not a reliable indicator
of future results and investors may not recover the full amount invested. The value of your investment can go up and down, and you could lose some or all of your invested money. For illustrative purposes only. Comparison
with other financial products or benchmarks is only meant for indicative purposes.
Alpha 15 MA Strategy (Gross of Fees) vs. MSCI World NDR Index (Hedged EUR)
Up Periods: 86/120
Upside Capture: 0.47
Dow n Periods: 34/120
Dow nside Capture: 0.06
Period under consideration: January 01, 2012 to December 31, 2021.
1.28%
-0.19%
2.69%
-3.25%
-4.0%
-3.0%
-2.0%
-1.0%
0.0%
1.0%
2.0%
3.0%
Up Market Months Down Market Months
Up and Down Market Analysis, Monthly
Alpha 15 MA Strategy (Gross of Fees) MSCI World NDR (Hedged EUR)
Up Periods: 33/40
Upside Capture: 0.53
Dow n Periods: 7/40
Dow nside Capture: (0.19)
Period under consideration: January 01, 2012 to December 31, 2021.
2.84%
1.47%
5.38%
-7.74%
-10.0%
-8.0%
-6.0%
-4.0%
-2.0%
0.0%
2.0%
4.0%
6.0%
8.0%
Up Market Quarters Down Market Quarters
Up and Down Market Analysis, Quarterly
Alpha 15 MA Strategy (Gross of Fees) MSCI World NDR (Hedged EUR)

Open
Performance in up and down bond markets
23
The mean returns represents a geometric calculation. The product performance represents the Alpha 15 Multi Asset Strategy and is gross of fees. The performance represented is historical; past performance is not a reliable indicator
of future results and investors may not recover the full amount invested. The value of your investment can go up and down, and you could lose some or all of your invested money. For illustrative purposes only. Comparison
with other financial products or benchmarks is only meant for indicative purposes.
Alpha 15 MA Strategy (Gross of Fees) vs. 7-10 YR GER Bunds
Up Periods: 70/120
Upside Capture: 1.09
Dow n Periods: 50/120
Dow nside Capture: (0.42)
Period under consideration: January 01, 2012 to December 31, 2021.
1.19%
0.40%
1.09%
-0.96%
-1.5%
-1.0%
-0.5%
0.0%
0.5%
1.0%
1.5%
Up Market Months Down Market Months
Up and Down Market Analysis, Monthly
Alpha 15 MA Strategy (Gross of Fees) BB Germany Govt 7-10 YR
Up Periods: 27/40
Upside Capture: 1.77
Dow n Periods: 13/40
Dow nside Capture: (1.28)
Period under consideration: January 01, 2012 to December 31, 2021.
3.00%
1.77%1.70%
-1.38%
-2.0%
-1.0%
0.0%
1.0%
2.0%
3.0%
4.0%
Up Market Quarters Down Market Quarters
Up and Down Market Analysis, Quarterly
Alpha 15 MA Strategy (Gross of Fees) BB Germany Govt 7-10 YR
Open
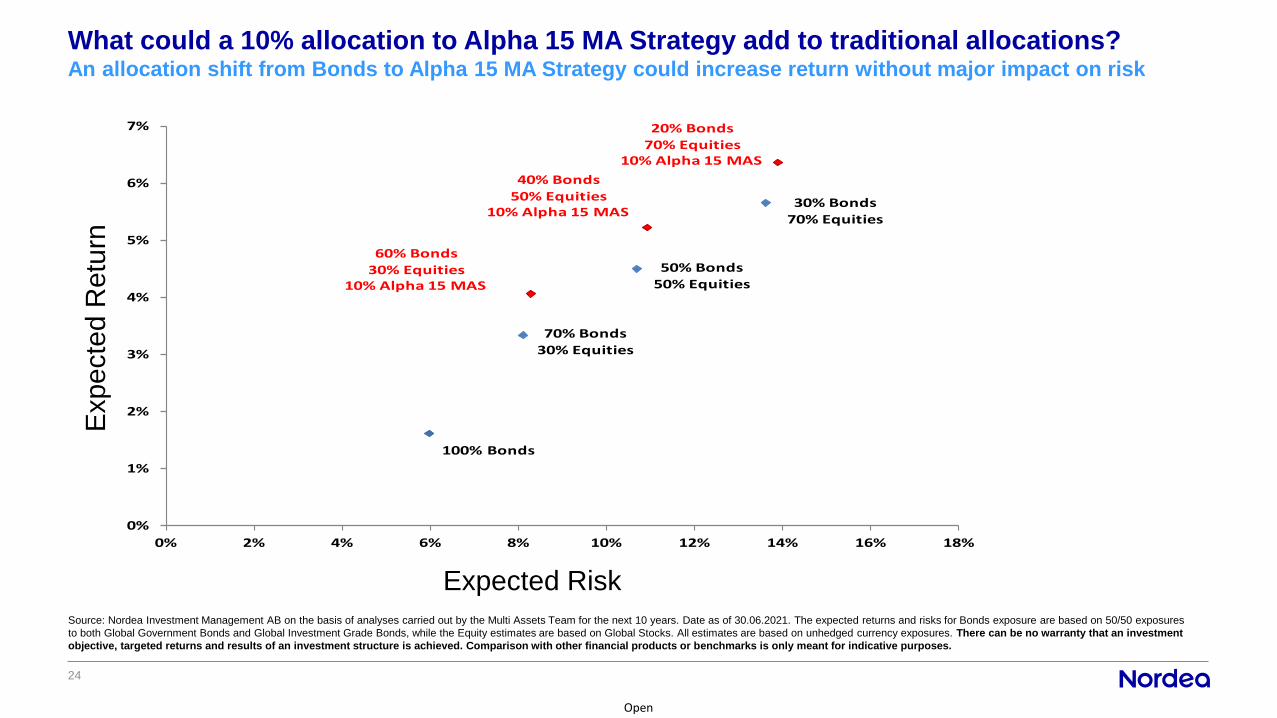
What could a 10% allocation to Alpha 15 MA Strategy add to traditional allocations?An allocation shift from Bonds to Alpha 15 MA Strategy could increase return without major impact on risk
24
Expected Risk
Expe
cte
d R
etu
rn
Source: Nordea Investment Management AB on the basis of analyses carried out by the Multi Assets Team for the next 10 years. Date as of 30.06.2021. The expected returns and risks for Bonds exposure are based on 50/50 exposures
to both Global Government Bonds and Global Investment Grade Bonds, while the Equity estimates are based on Global Stocks. All estimates are based on unhedged currency exposures. There can be no warranty that an investment
objective, targeted returns and results of an investment structure is achieved. Comparison with other financial products or benchmarks is only meant for indicative purposes.
100% Bonds
70% Bonds
30% Equities
50% Bonds50% Equities
30% Bonds70% Equities
60% Bonds30% Equities
10% Alpha 15 MAS
40% Bonds
50% Equities10% Alpha 15 MAS
20% Bonds70% Equities
10% Alpha 15 MAS
0%
1%
2%
3%
4%
5%
6%
7%
0% 2% 4% 6% 8% 10% 12% 14% 16% 18%

Open
25
Why invest in the Nordea Alpha 10 MA Strategy?Attractive returns with a limited correlation to equities
1) Expected return numbers are only targets. There can be no warranty that an investment objective, targeted returns or results of an investment structure are achieved. The value of shares can greatly fluctuate as a
result of the sub-fund’s investment policy and cannot be ensured, you could lose some or all of your invested money. Source: Nordea Investment Management AB, on the basis of analyses carried out by the Multi Assets
Team. Data as of 30.06.2021. 2) Sources: Nordea Investments Fund S.A. and Datastream. Period under consideration: 01.07.2016 – 30.06.2021.
Cash
European Govies
US Treasuries
EU IG
US IGEU HY
US HY
EM Govies
EM Equities
Global Equities
A15 MAS
A10 MAS
A7 MAS (Since May 2018)
-2.0%
0.0%
2.0%
4.0%
6.0%
8.0%
10.0%
-0.50 -0.30 -0.10 0.10 0.30 0.50 0.70 0.90
Ex
pe
cte
d r
etu
rns o
ve
r 1
0 y
ea
rs1
Historical Correlation vs Global Equities2
Open
26
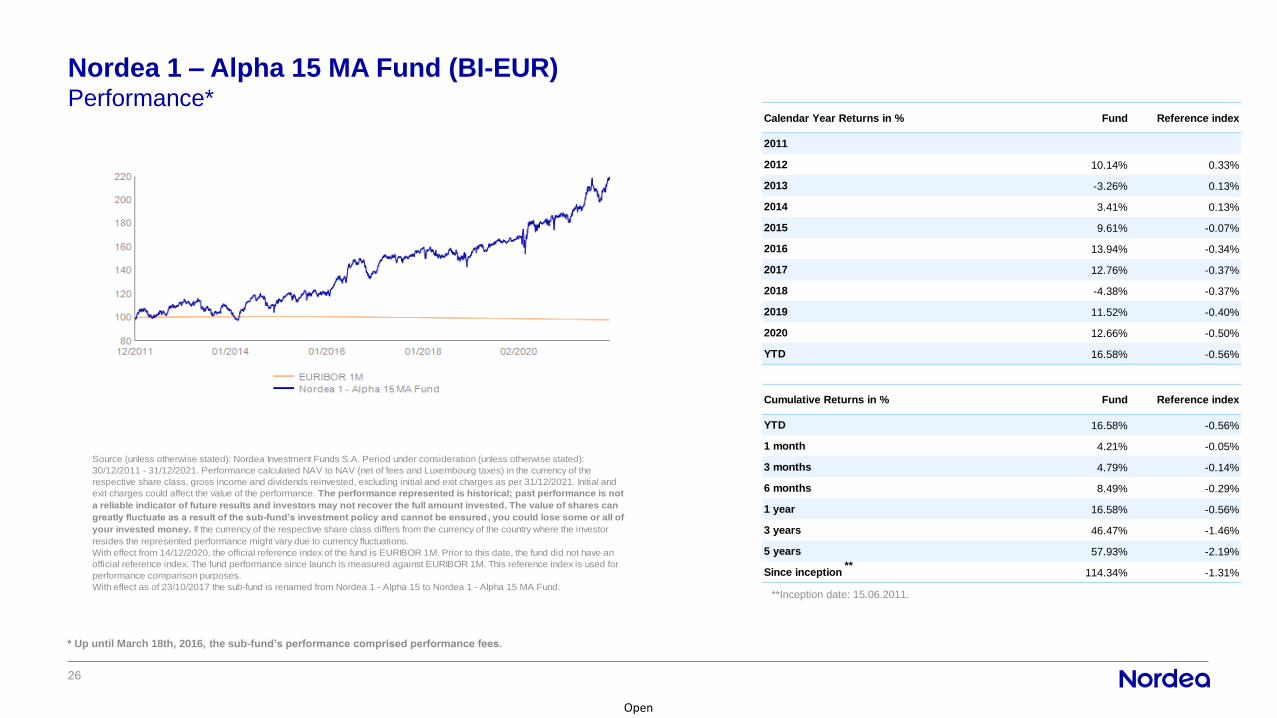
Nordea 1 – Alpha 15 MA Fund (BI-EUR)Performance*
* Up until March 18th, 2016, the sub-fund’s performance comprised performance fees.
Source (unless otherwise stated): Nordea Investment Funds S.A. Period under consideration (unless otherwise stated):
30/12/2011 - 31/12/2021. Performance calculated NAV to NAV (net of fees and Luxembourg taxes) in the currency of the
respective share class, gross income and dividends reinvested, excluding initial and exit charges as per 31/12/2021. Initial and
exit charges could affect the value of the performance. The performance represented is historical; past performance is not
a reliable indicator of future results and investors may not recover the full amount invested. The value of shares can
greatly fluctuate as a result of the sub-fund’s investment policy and cannot be ensured , you could lose some or all of
your invested money. If the currency of the respective share class differs from the currency of the country where the investor
resides the represented performance might vary due to currency fluctuations.
With effect from 14/12/2020, the official reference index of the fund is EURIBOR 1M. Prior to this date, the fund did not have an
official reference index. The fund performance since launch is measured against EURIBOR 1M. This reference index is used for
performance comparison purposes.
With effect as of 23/10/2017 the sub-fund is renamed from Nordea 1 - Alpha 15 to Nordea 1 - Alpha 15 MA Fund.**Inception date: 15.06.2011.
Calendar Year Returns in % Fund Reference index
2011
2012 10.14% 0.33%
2013 -3.26% 0.13%
2014 3.41% 0.13%
2015 9.61% -0.07%
2016 13.94% -0.34%
2017 12.76% -0.37%
2018 -4.38% -0.37%
2019 11.52% -0.40%
2020 12.66% -0.50%
YTD 16.58% -0.56%
Cumulative Returns in % Fund Reference index
YTD 16.58% -0.56%
1 month 4.21% -0.05%
3 months 4.79% -0.14%
6 months 8.49% -0.29%
1 year 16.58% -0.56%
3 years 46.47% -1.46%
5 years 57.93% -2.19%
Since inception 114.34% -1.31%**
Open
27
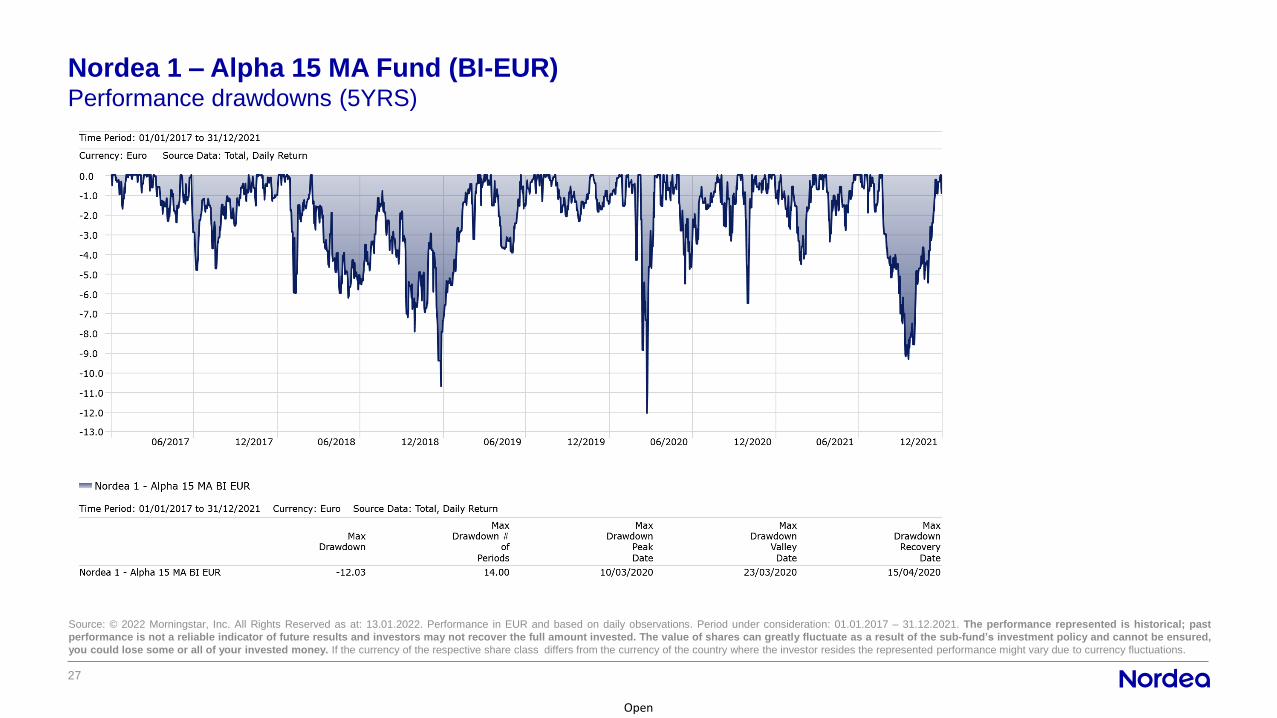
Nordea 1 – Alpha 15 MA Fund (BI-EUR)Performance drawdowns (5YRS)
Source: © 2022 Morningstar, Inc. All Rights Reserved as at: 13.01.2022. Performance in EUR and based on daily observations. Period under consideration: 01.01.2017 – 31.12.2021. The performance represented is historical; past
performance is not a reliable indicator of future results and investors may not recover the full amount invested. The value of shares can greatly fluctuate as a result of the sub-fund’s investment policy and cannot be ensured,
you could lose some or all of your invested money. If the currency of the respective share class differs from the currency of the country where the investor resides the represented performance might vary due to currency fluctuations.

Open
28
Key takeaways
• Extensive research: Relies on MAT’s
extensive research capabilities and experience
• Diversified source of returns: To offer higher
returns with lower risk than traditional asset
classes
• Risk Management: At the center of and
starting point for asset allocation
• Diversification: Low correlation to traditional
asset classes
• Liquid alternative with no performance fees
There can be no warranty that an investment objective, targeted returns and results of an investment structure is achieved. The value of your investment can go up and down, and you could lose some or all of your invested
money.

Appendix
Open
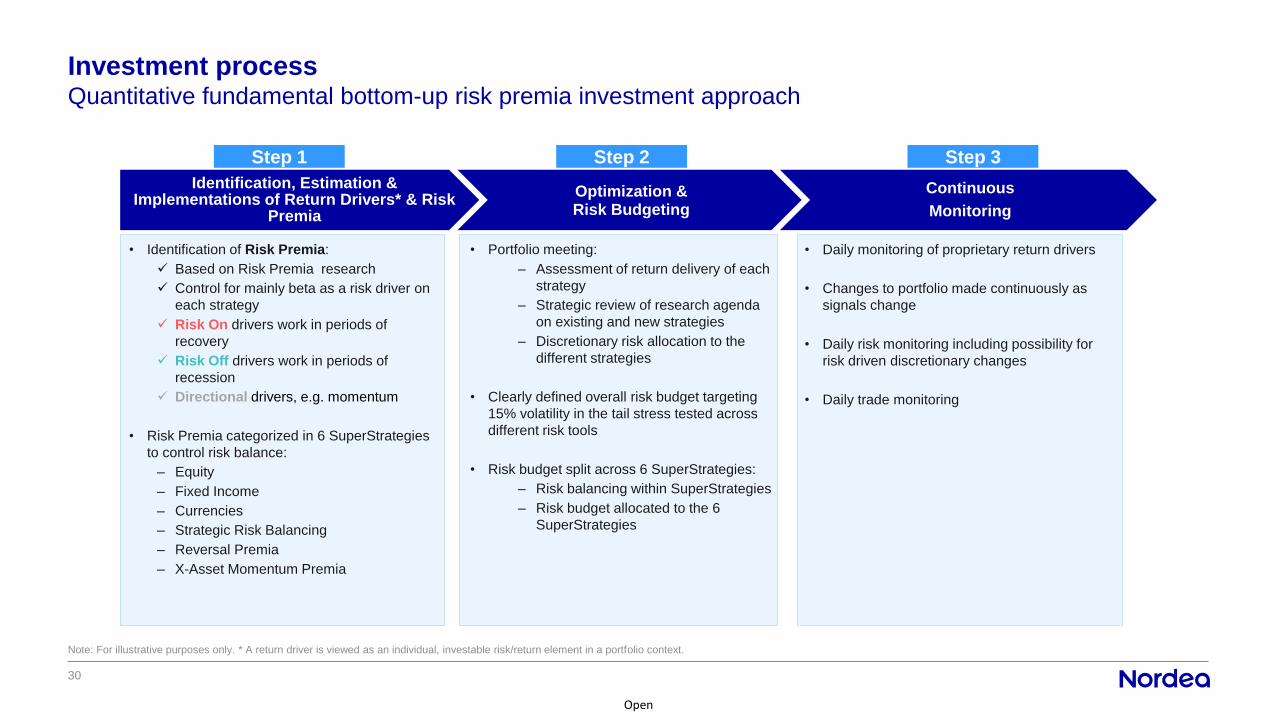
Quantitative fundamental bottom-up risk premia investment approach
Investment process
30
Note: For illustrative purposes only. * A return driver is viewed as an individual, investable risk/return element in a portfolio context.
Identification, Estimation & Implementations of Return Drivers* & Risk
Premia
Optimization & Risk Budgeting
Continuous
Monitoring
Step 1 Step 2 Step 3
• Portfolio meeting:
– Assessment of return delivery of each
strategy
– Strategic review of research agenda
on existing and new strategies
– Discretionary risk allocation to the
different strategies
• Clearly defined overall risk budget targeting
15% volatility in the tail stress tested across
different risk tools
• Risk budget split across 6 SuperStrategies:
– Risk balancing within SuperStrategies
– Risk budget allocated to the 6
SuperStrategies
• Daily monitoring of proprietary return drivers
• Changes to portfolio made continuously as
signals change
• Daily risk monitoring including possibility for
risk driven discretionary changes
• Daily trade monitoring
• Identification of Risk Premia:
✓ Based on Risk Premia research
✓ Control for mainly beta as a risk driver on
each strategy
✓ Risk On drivers work in periods of
recovery
✓ Risk Off drivers work in periods of
recession
✓ Directional drivers, e.g. momentum
• Risk Premia categorized in 6 SuperStrategies
to control risk balance:
– Equity
– Fixed Income
– Currencies
– Strategic Risk Balancing
– Reversal Premia
– X-Asset Momentum Premia
Open
31
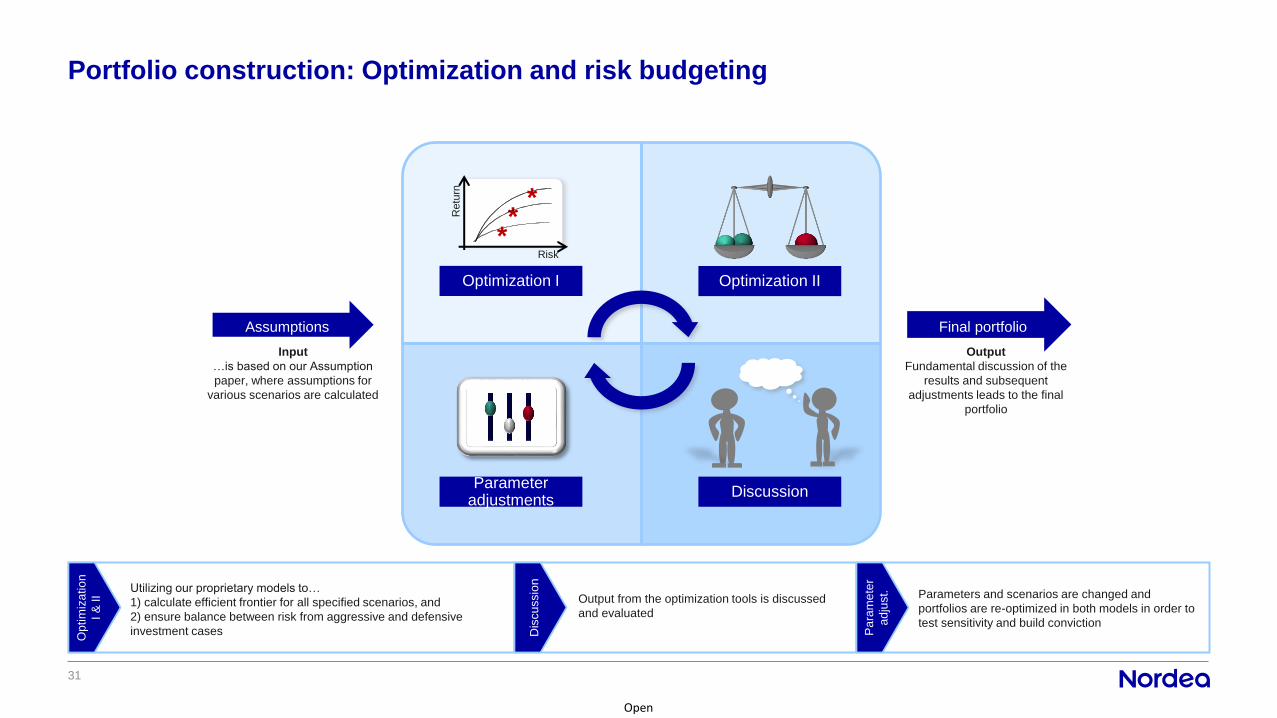
Portfolio construction: Optimization and risk budgeting
Assumptions
Input
…is based on our Assumption
paper, where assumptions for
various scenarios are calculated
Final portfolio
Output
Fundamental discussion of the
results and subsequent
adjustments leads to the final
portfolio
*
Risk
Retu
rn
*
*
Optimization IIOptimization I
Parameter adjustments
Discussion
Utilizing our proprietary models to…
1) calculate efficient frontier for all specified scenarios, and
2) ensure balance between risk from aggressive and defensive
investment cases
Output from the optimization tools is discussed
and evaluated
Parameters and scenarios are changed and
portfolios are re-optimized in both models in order to
test sensitivity and build conviction
Dis
cu
ssio
n
Op
tim
iza
tio
n
I &
II
Pa
ram
ete
r
ad
just.

Open
SuperStrategy example – Equity strategiesBalancing risk on and risk off equity strategies
-30%
-20%
-10%
0%
10%
20%
30%
2006 2007 2008 2009 2010 2011 2012 2013 2014 2015 2016
Risk free rate Equity Beta Premium Low. Vol. Premium
▪ Premium: Equity country
▪ Trade: Long high Risk Premia equity country indices and sell low Risk Premia
equity country indices
▪ Risk/Return Control: Earnings momentum, sector deviation
▪ Instruments used: Equity Index Futures
Equity country strategy Low risk anomaly strategy
Beta positive: Exploiting relative equity risk premiums based on country
valuation and fundamental support; going long cheap and shorting expensive.
Anti-Beta: Isolating and exploiting the low risk anomaly premia; buying
relatively stable/low risk equities and hedging out the equity beta.
Low Risk Anomaly
premium
Equity Beta
premium
(0.7 beta)
Risk free rate
Low Risk
Equities
Sources: Nordea Investment Management AB. The performance for this composite represents all portfoliosmanaged as Global Stable Equities. Period under consideration: 01.01.2006 – 31.12.2016. There can be nowarranty that an investment objective, targeted returns and results of an investment structure is achieved.The value of your investment can go up and down, and you could lose some or all of your invested money.
Example of trades:
Sources: Nordea Investment Management AB. Date: 24.02.2016.
Largest Longs Largest Shorts
DAX INDEX FUTURE 3/2016 AMSTERDAM IDX FUT 3/2016
HANG SENG IDX FUT 3/2016 OMXS30 IND FUTURE 3/2016
CAC40 10 EURO FUT 3/2016 SPI 200 FUTURES 3/2016
2/24/2016
32
Open
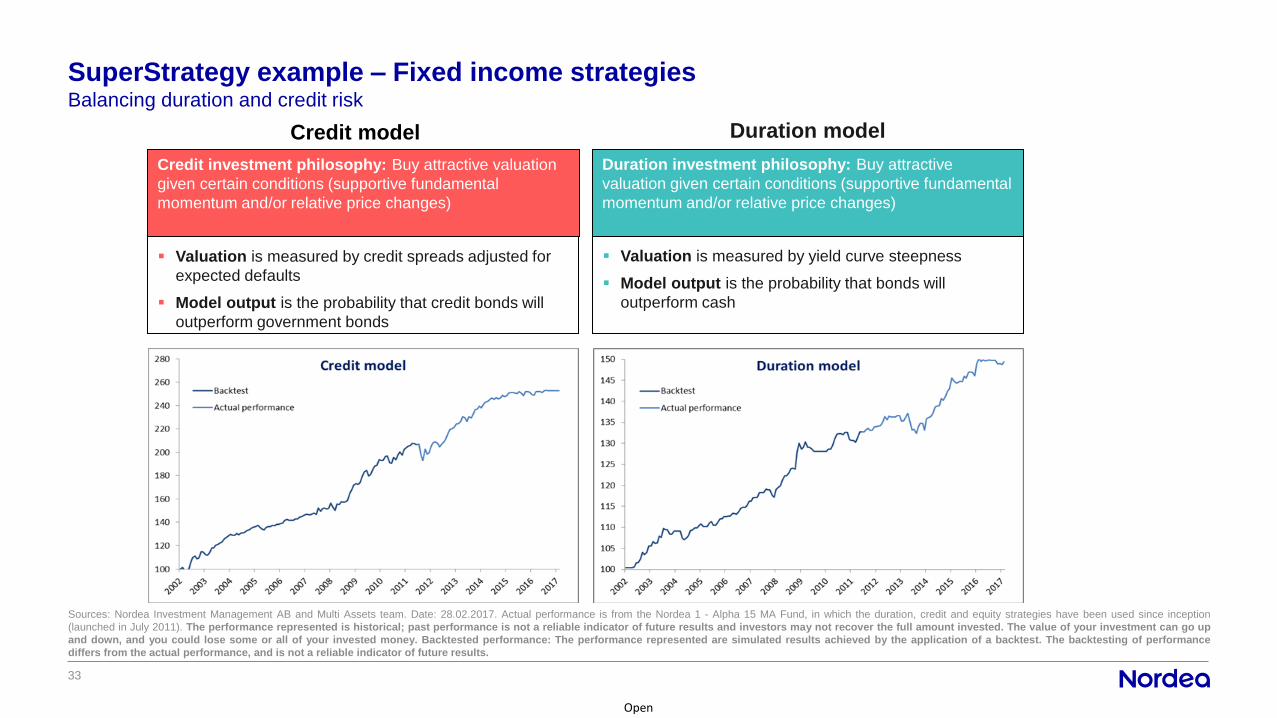
33
SuperStrategy example – Fixed income strategiesBalancing duration and credit risk
Sources: Nordea Investment Management AB and Multi Assets team. Date: 28.02.2017. Actual performance is from the Nordea 1 - Alpha 15 MA Fund, in which the duration, credit and equity strategies have been used since inception
(launched in July 2011). The performance represented is historical; past performance is not a reliable indicator of future results and investors may not recover the full amount invested. The value of your investment can go up
and down, and you could lose some or all of your invested money. Backtested performance: The performance represented are simulated results achieved by the application of a backtest. The backtesting of performance
differs from the actual performance, and is not a reliable indicator of future results.
▪ Valuation is measured by yield curve steepness
▪ Model output is the probability that bonds will
outperform cash
▪ Valuation is measured by credit spreads adjusted for
expected defaults
▪ Model output is the probability that credit bonds will
outperform government bonds
Credit model Duration model
Credit investment philosophy: Buy attractive valuation
given certain conditions (supportive fundamental
momentum and/or relative price changes)
Duration investment philosophy: Buy attractive
valuation given certain conditions (supportive fundamental
momentum and/or relative price changes)

Open
34
SuperStrategy example – Currency strategiesBalancing FX carry and valuation
Sources: Nordea Investment Management AB. Date: 24.02.2016.
Beta positive: Relative yield; borrowing in a lower rate currency and
investing in a higher rate currency
Carry trade strategy FX valuation strategy
Anti-Beta: Benefiting from the relative FX valuation premiums based on the
fair value of currency crosses; going long cheap and shorting expensive
▪ Premium: Currency carry (attractive differential
between lower and higher rate currencies)
▪ Trade: Long high yield currencies and short low yield
currencies
▪ Risk/Return Control: Country fundamentals
▪ Instruments used: FX forwards
▪ Premium: Currency pairs exhibiting anti-beta
behavior (provides protection in stressed
market conditions)
▪ Trade: Long undervalued currencies and short
overvalued currencies that are negatively
correlated to equity markets
▪ Instruments used: FX forwards
▪ Typically performs well when risky assets are
struggling
Example of trades:
Largest Long
MXN
CLP
ZAR
Largest Short
ILS
CAD
CHF
Example of trades:
Largest Long
JPY
SEK
CAD
Largest Short
CHF
NZD
AUD

Open
35
SuperStrategy example – Strategic Risk Balancing strategiesRisk balancing the premia of the Assumption Paper
SAA Research & Analysis
Return Drivers & Risk Characteristics
Risk On DriversRisk Off Drivers
• Equity low volatility
• Duration region
• Covered bonds
• Credit low risk
• FX valuation (Purchasing
Power Parity principles)
• Equity beta
• Equity region
• Equity industry
• Equity size
• Equity style
• Credit risk premium
(EM, IG, HY)
Identification of all Return Drivers
Factor Risk Screening
Selection of relevant
Return Drivers
Note: For illustrative purposes only.
Open
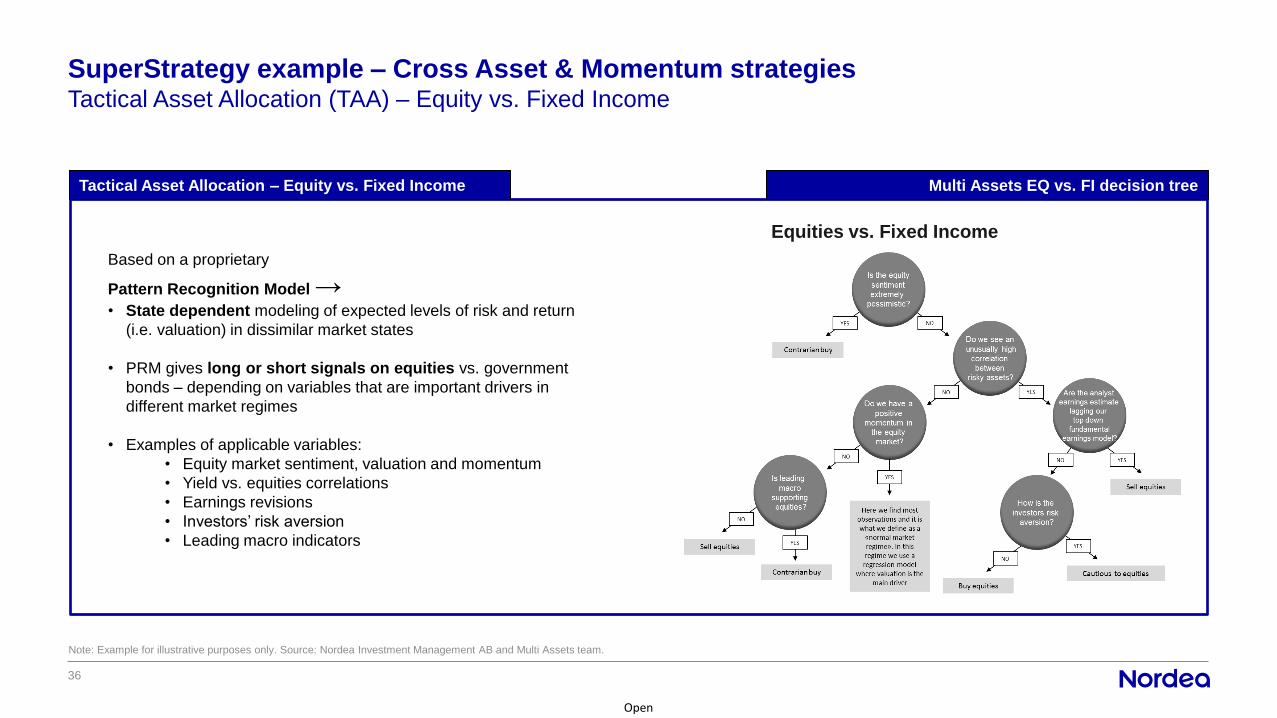
36
SuperStrategy example – Cross Asset & Momentum strategiesTactical Asset Allocation (TAA) – Equity vs. Fixed Income
Note: Example for illustrative purposes only. Source: Nordea Investment Management AB and Multi Assets team.
Tactical Asset Allocation – Equity vs. Fixed Income Multi Assets EQ vs. FI decision tree
Equities vs. Fixed Income
Based on a proprietary
Pattern Recognition Model →• State dependent modeling of expected levels of risk and return
(i.e. valuation) in dissimilar market states
• PRM gives long or short signals on equities vs. government
bonds – depending on variables that are important drivers in
different market regimes
• Examples of applicable variables:
• Equity market sentiment, valuation and momentum
• Yield vs. equities correlations
• Earnings revisions
• Investors’ risk aversion
• Leading macro indicators
Open
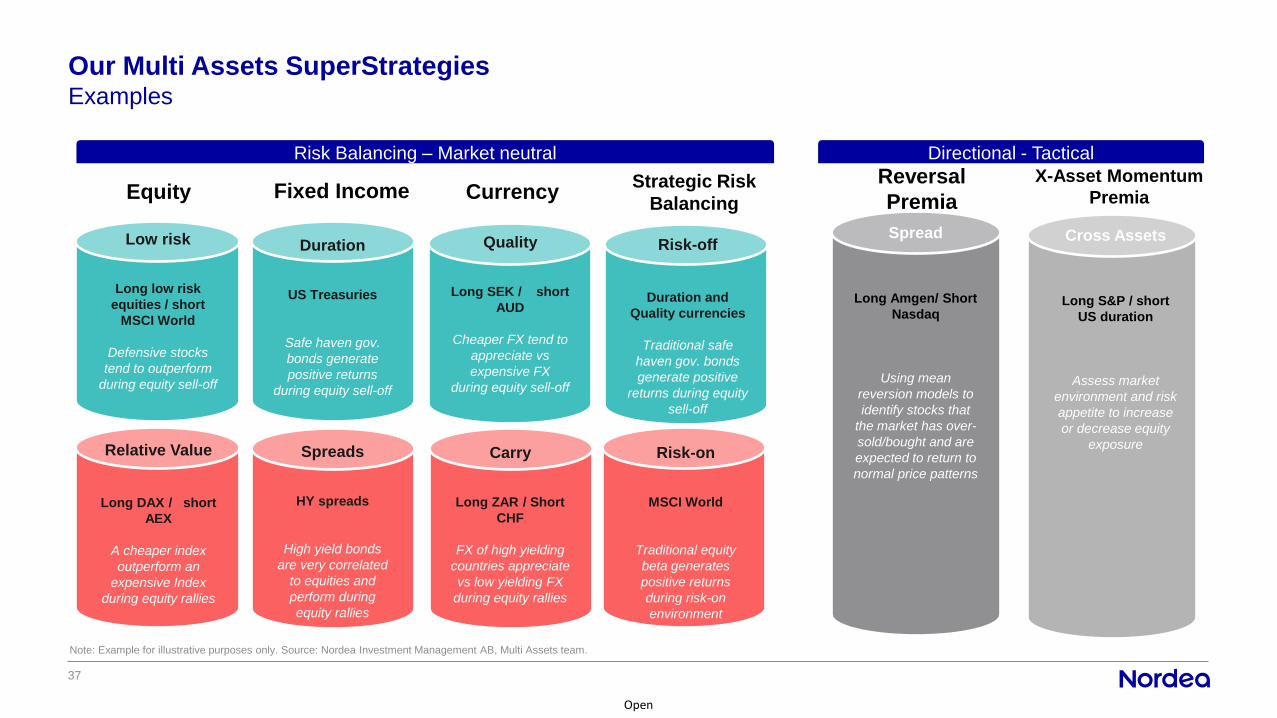
37
Our Multi Assets SuperStrategiesExamples
Note: Example for illustrative purposes only. Source: Nordea Investment Management AB, Multi Assets team.
Directional - TacticalRisk Balancing – Market neutral
Trading
Equity
Low risk
Long low risk
equities / short
MSCI World
Defensive stocks
tend to outperform
during equity sell-off
Fixed Income
Duration
US Treasuries
Safe haven gov.
bonds generate
positive returns
during equity sell-off
Currency
Quality
Long SEK / short
AUD
Cheaper FX tend to
appreciate vs
expensive FX
during equity sell-off
Strategic Risk
Balancing
Risk-off
Duration and
Quality currencies
Traditional safe
haven gov. bonds
generate positive
returns during equity
sell-off
Relative Value
Long DAX / short
AEX
A cheaper index
outperform an
expensive Index
during equity rallies
Spreads
HY spreads
High yield bonds
are very correlated
to equities and
perform during
equity rallies
Carry
Long ZAR / Short
CHF
FX of high yielding
countries appreciate
vs low yielding FX
during equity rallies
Risk-on
MSCI World
Traditional equity
beta generates
positive returns
during risk-on
environment
Reversal
Premia
Spread
Long Amgen/ Short
Nasdaq
Using mean
reversion models to
identify stocks that
the market has over-
sold/bought and are
expected to return to
normal price patterns
X-Asset Momentum
Premia
Cross Assets
Long S&P / short
US duration
Assess market
environment and risk
appetite to increase
or decrease equity
exposure
Open
38
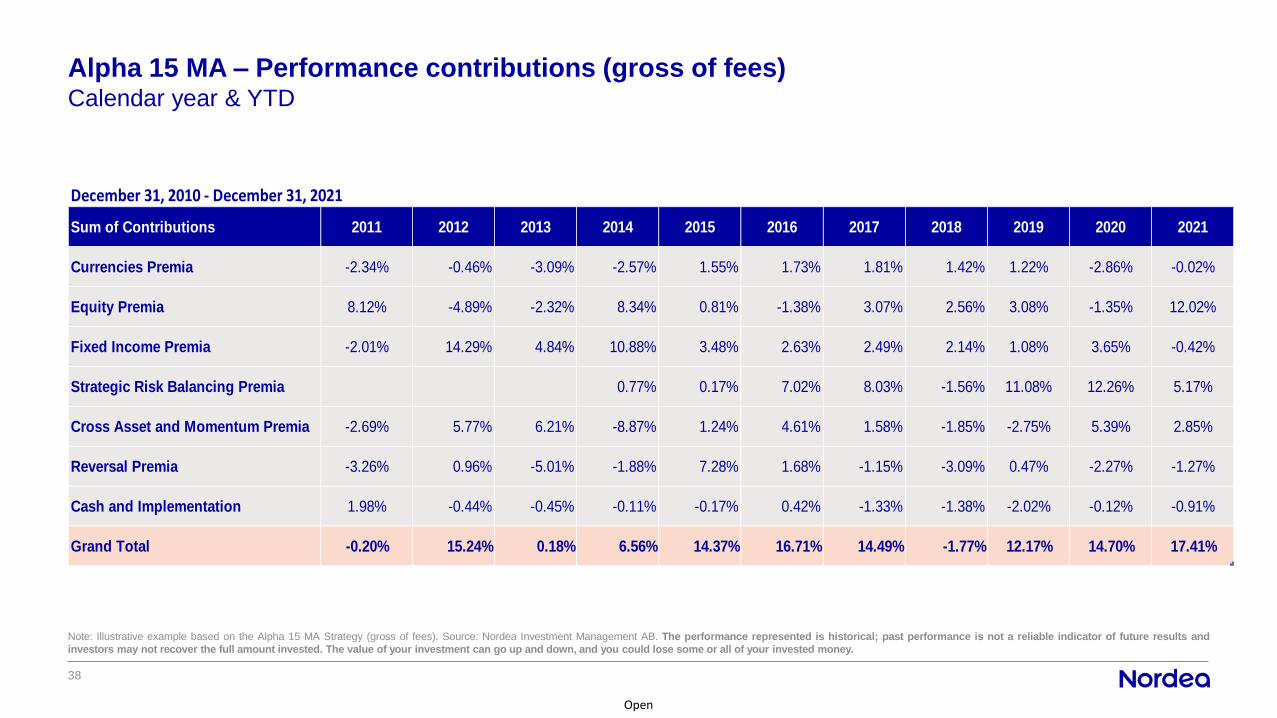
Alpha 15 MA – Performance contributions (gross of fees)Calendar year & YTD
Note: Illustrative example based on the Alpha 15 MA Strategy (gross of fees). Source: Nordea Investment Management AB. The performance represented is historical; past performance is not a reliable indicator of future results and
investors may not recover the full amount invested. The value of your investment can go up and down, and you could lose some or all of your invested money.
December 31, 2010 - December 31, 2021
Sum of Contributions 2011 2012 2013 2014 2015 2016 2017 2018 2019 2020 2021
Currencies Premia -2.34% -0.46% -3.09% -2.57% 1.55% 1.73% 1.81% 1.42% 1.22% -2.86% -0.02%
Equity Premia 8.12% -4.89% -2.32% 8.34% 0.81% -1.38% 3.07% 2.56% 3.08% -1.35% 12.02%
Fixed Income Premia -2.01% 14.29% 4.84% 10.88% 3.48% 2.63% 2.49% 2.14% 1.08% 3.65% -0.42%
Strategic Risk Balancing Premia 0.77% 0.17% 7.02% 8.03% -1.56% 11.08% 12.26% 5.17%
Cross Asset and Momentum Premia -2.69% 5.77% 6.21% -8.87% 1.24% 4.61% 1.58% -1.85% -2.75% 5.39% 2.85%
Reversal Premia -3.26% 0.96% -5.01% -1.88% 7.28% 1.68% -1.15% -3.09% 0.47% -2.27% -1.27%
Cash and Implementation 1.98% -0.44% -0.45% -0.11% -0.17% 0.42% -1.33% -1.38% -2.02% -0.12% -0.91%
Grand Total -0.20% 15.24% 0.18% 6.56% 14.37% 16.71% 14.49% -1.77% 12.17% 14.70% 17.41%
Open
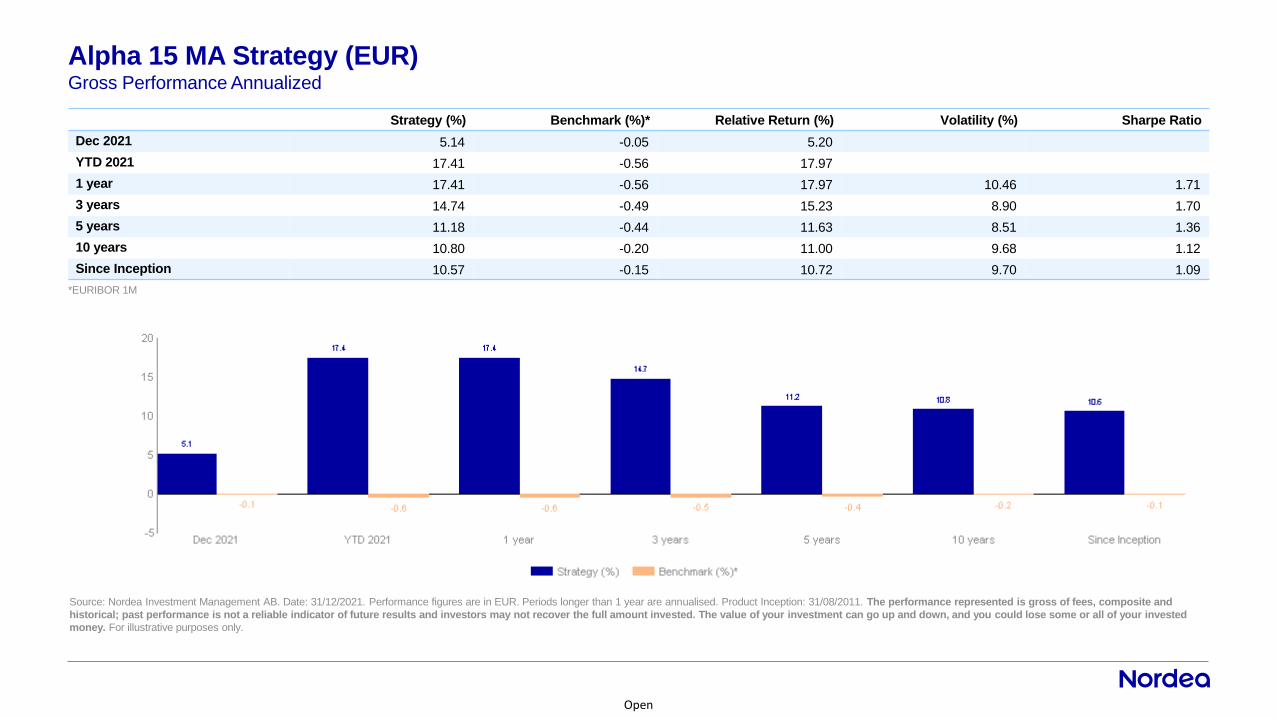
Strategy (%) Benchmark (%)* Relative Return (%) Volatility (%) Sharpe Ratio
Dec 2021 5.14 -0.05 5.20
YTD 2021 17.41 -0.56 17.97
1 year 17.41 -0.56 17.97 10.46 1.71
3 years 14.74 -0.49 15.23 8.90 1.70
5 years 11.18 -0.44 11.63 8.51 1.36
10 years 10.80 -0.20 11.00 9.68 1.12
Since Inception 10.57 -0.15 10.72 9.70 1.09
*EURIBOR 1M
Source: Nordea Investment Management AB. Date: 31/12/2021. Performance figures are in EUR. Periods longer than 1 year are annualised. Product Inception: 31/08/2011. The performance represented is gross of fees, composite and
historical; past performance is not a reliable indicator of future results and investors may not recover the full amount invested. The value of your investment can go up and down, and you could lose some or all of your invested
money. For illustrative purposes only.
Gross Performance Annualized
Alpha 15 MA Strategy (EUR)
Open
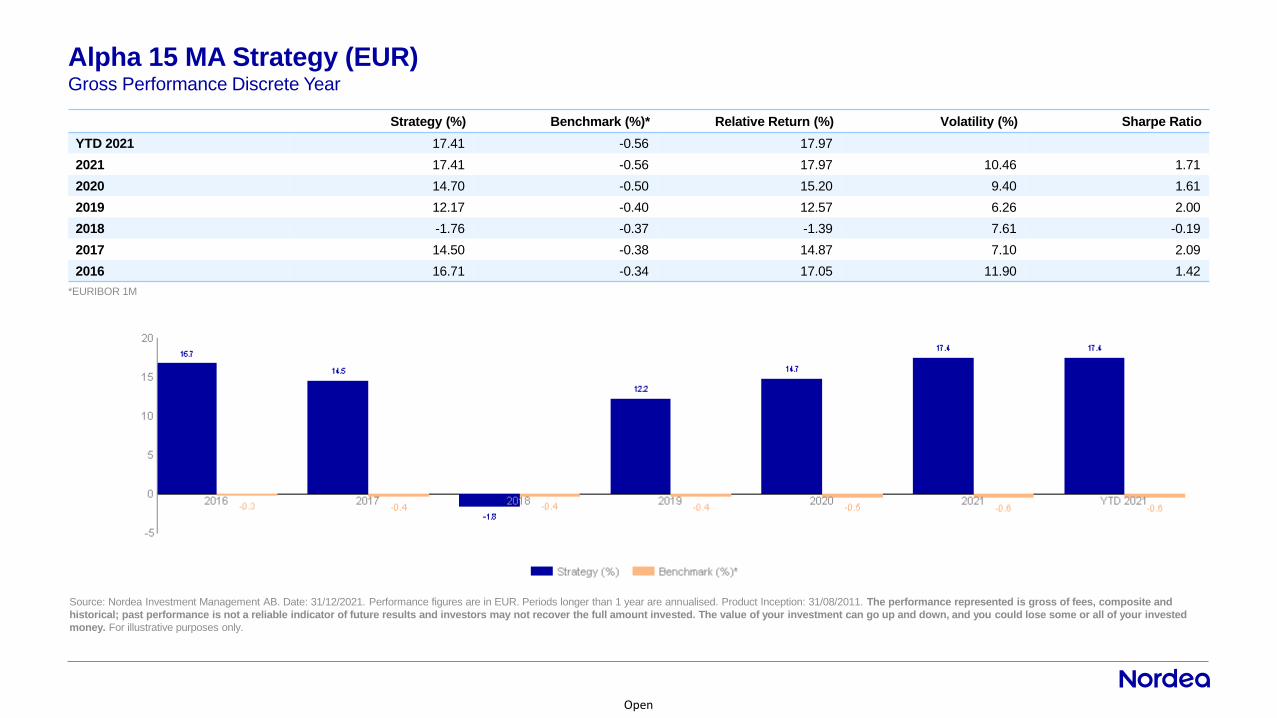
Strategy (%) Benchmark (%)* Relative Return (%) Volatility (%) Sharpe Ratio
YTD 2021 17.41 -0.56 17.97
2021 17.41 -0.56 17.97 10.46 1.71
2020 14.70 -0.50 15.20 9.40 1.61
2019 12.17 -0.40 12.57 6.26 2.00
2018 -1.76 -0.37 -1.39 7.61 -0.19
2017 14.50 -0.38 14.87 7.10 2.09
2016 16.71 -0.34 17.05 11.90 1.42
*EURIBOR 1M
Source: Nordea Investment Management AB. Date: 31/12/2021. Performance figures are in EUR. Periods longer than 1 year are annualised. Product Inception: 31/08/2011. The performance represented is gross of fees, composite and
historical; past performance is not a reliable indicator of future results and investors may not recover the full amount invested. The value of your investment can go up and down, and you could lose some or all of your invested
money. For illustrative purposes only.
Alpha 15 MA Strategy (EUR)Gross Performance Discrete Year
Open
41
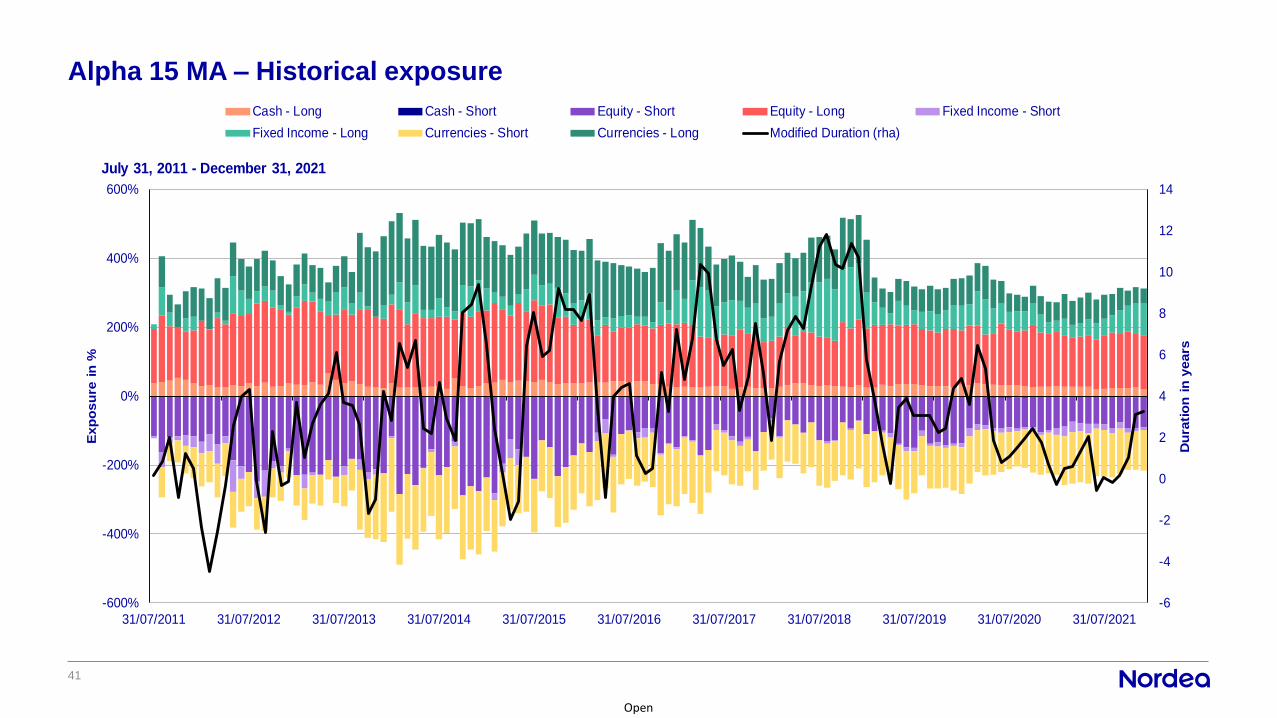
Alpha 15 MA – Historical exposure
-6
-4
-2
0
2
4
6
8
10
12
14
-600%
-400%
-200%
0%
200%
400%
600%
31/07/2011 31/07/2012 31/07/2013 31/07/2014 31/07/2015 31/07/2016 31/07/2017 31/07/2018 31/07/2019 31/07/2020 31/07/2021
Du
rati
on
in
years
Exp
osu
re i
n %
July 31, 2011 - December 31, 2021
Cash - Long Cash - Short Equity - Short Equity - Long Fixed Income - Short
Fixed Income - Long Currencies - Short Currencies - Long Modified Duration (rha)

Open
42
Alpha 15 MA – Historical exposure
-6
-4
-2
0
2
4
6
8
10
12
14
-400%
-200%
0%
200%
400%
600%
800%
1000%
1200%
31/07/2011 31/07/2012 31/07/2013 31/07/2014 31/07/2015 31/07/2016 31/07/2017 31/07/2018 31/07/2019 31/07/2020 31/07/2021
Du
rati
on
in
years
Exp
osu
re i
n %
July 31, 2011 - December 31, 2021
Total Gross Exposure Net Equity Exposure Modified Duration (rha)

Open
43
Alpha 15 MA – Historical net equity exposure
-100%
-50%
0%
50%
100%
150%
31/07/2011 31/07/2012 31/07/2013 31/07/2014 31/07/2015 31/07/2016 31/07/2017 31/07/2018 31/07/2019 31/07/2020 31/07/2021
Net
Eq
uit
y E
xp
osu
re i
n %
July 31, 2011 - December 31, 2021

Open
44
Nordea 1 – Alpha 15 MA Fund (BI-EUR)Fund information
Source: Nordea Investment Funds S.A. Date:
Sub-fund's name Nordea 1 - Alpha 15 MA Fund
Fund Manager Multi Assets Team
Fund Domicile 562, rue de Neudorf, 2220 Luxembourg, Luxembourg
Share class BI-EUR
Annual Man. Fee 1.200%
Security number (ISIN) LU0607983383
Security number (WKN) A1JHT2
Fund Size in millions 4,968.66
Currency EUR
Reference index EURIBOR 1M
No. of holdings 169
Launch date 15/06/2011
Minimum investment (EUR) 75,000
31.12.2021

Appendix

Open
NAM level Responsible Investment approaches – applicable to ALL our funds
46
NAM level ESG approaches
Active
Ownership
Norms-based
Screening
Exclusion
List
ESG
Integration
All holdings screened for
breaches of international
norms and conventions
We exercise our formal
voting rights and engage
with companies
Exclusion list publicly
available, as well as our RI
Policy which defines the
exclusion criteria
→ See next slide
ESG data made available for
all the portfolio managers to
integrate into the investment
decisions
Open
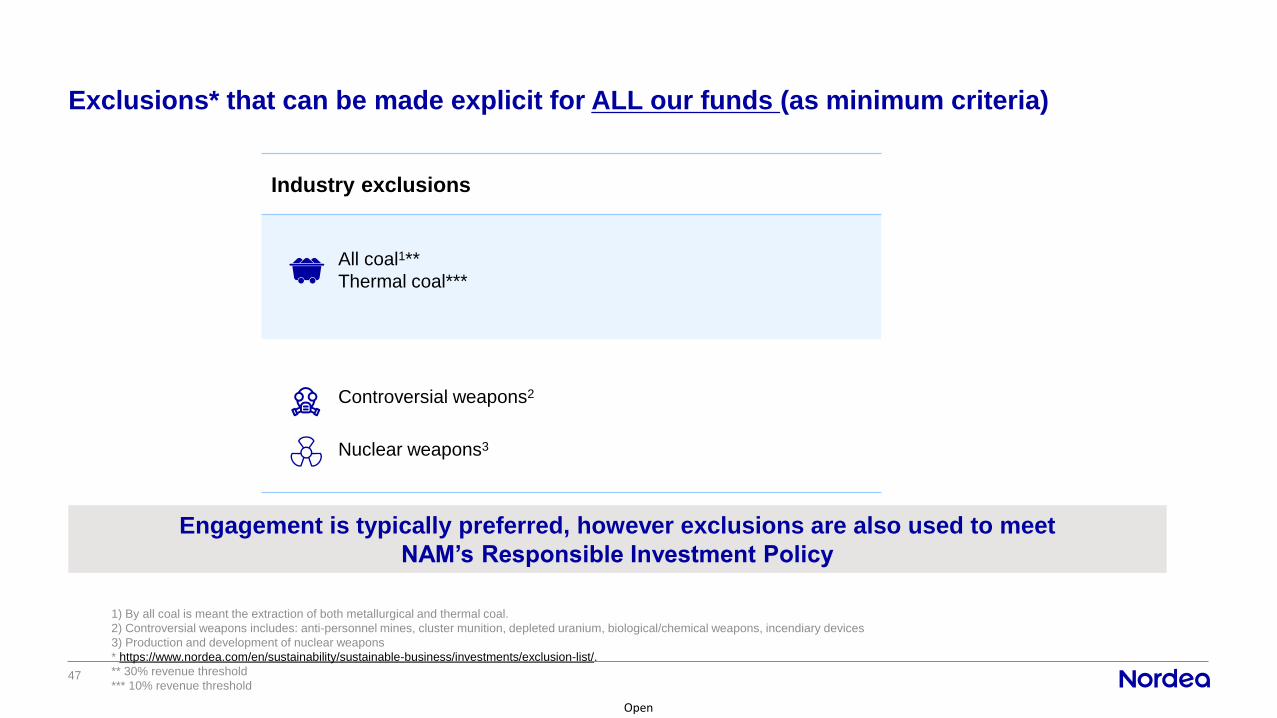
Exclusions* that can be made explicit for ALL our funds (as minimum criteria)
47
Industry exclusions
All coal1**
Thermal coal***
Controversial weapons2
Nuclear weapons3
Engagement is typically preferred, however exclusions are also used to meet
NAM’s Responsible Investment Policy
1) By all coal is meant the extraction of both metallurgical and thermal coal.
2) Controversial weapons includes: anti-personnel mines, cluster munition, depleted uranium, biological/chemical weapons, incendiary devices
3) Production and development of nuclear weapons
* https://www.nordea.com/en/sustainability/sustainable-business/investments/exclusion-list/.
** 30% revenue threshold
*** 10% revenue threshold

Open
48
The sub-funds mentioned are part of Nordea 1, SICAV, an open-ended Luxembourg-based investment company (Société d'Investissement à Capital Variable), validly formed and existing in accordance with the laws of Luxembourg and with
European Council Directive 2009/65/EC of 13 July 2009. This document is advertising material and does not disclose all relevant information concerning the presented sub-funds. Any investment decision in the sub-funds should be
made on the basis of the current prospectus and the Key Investor Information Document (KIID), which are available, along with the current annual and semi-annual reports, electronically in English and in the local language of the market
where the mentioned SICAV is authorised for distribution, without charge upon request from Nordea Investment Funds S.A., 562, rue de Neudorf, P.O. Box 782, L-2017 Luxembourg, from the local representatives or information agents, or
from our distributors as well as on www.nordea.lu. Investments in derivative and foreign exchange transactions may be subject to significant fluctuations which may affect the value of an investment. Investments in Emerging Markets
involve a higher element of risk. The value of shares can greatly fluctuate as a result of the sub-fund’s investment policy and cannot be ensured. Investments in equity and debt instruments issued by banks could bear the
risk of being subject to the bail-in mechanism (meaning that equity and debt instruments could be written down in order to ensure that most unsecured creditors of an institution bear appropriate losses) as foreseen in EU
Directive 2014/59/EU. For further details of investment risks associated with these sub-funds, please refer to the relevant Key Investor Information Document (KIID), available as described above. Nordea Investment Funds S.A.
has decided to bear the cost for research, i.e. such cost is covered by existing fee arrangements (Management-/Administration-Fee). Nordea Investment Funds S.A. only publishes product-related information and does not make any
investment recommendations. A summary of investor rights is available in English through the following link: https://www.nordea.lu/documents/engagement-policy/EP_eng_INT.pdf/. Nordea Investment Funds S.A. may decide to terminate the
arrangements made for the marketing of its sub-funds in any respective EU-country of distribution in accordance with Article 93a of Directive 2009/65/EC. Published by Nordea Investment Funds S.A., 562, rue de Neudorf, P.O. Box 782, L-
2017 Luxembourg, which is authorized by the Commission de Surveillance du Secteur Financier in Luxembourg. Further information can be obtained from your financial advisor. He/she can advise you independently of Nordea Investment
Funds S.A. Please note that all sub funds and share classes might not be available in your country of jurisdiction. Additional information for investors in Switzerland: The Swiss Representative and Paying Agent is BNP Paribas
Securities Services, Paris, Succursale de Zurich, Selnaustrasse 16, 8002 Zurich, Switzerland. Additional information for investors in Germany: The Information Agent in Germany is Société Générale S.A. Frankfurt Branch, Neue Mainzer
Straße 46-50, 60311 Frankfurt am Main, Germany. A hard copy of the above-mentioned fund documentation is also available here. Additional information for investors in Austria: The Information and Paying Agent in Austria is Erste Bank
der österreichischen Sparkassen AG, Am Belvedere 1, 1100 Vienna, Austria. Additional information for investors in the Netherlands: Nordea 1, SICAV is a Luxembourg Undertaking for Collective Investment in Transferable Securities
(UCITS) registered in the Netherlands in the register kept by the AFM, and as such is allowed to offer its shares in the Netherlands. The AFM register can be consulted via www.afm.nl/register. Additional information for investors in
France: With the authorisation of the AMF the shares of the sub-funds of Nordea 1, SICAV may be distributed in France. Centralising Correspondent in France is CACEIS Bank, located at 1-3, place Valhubert, 75206 Paris cedex 13, France.
Investors are advised to conduct thorough research before making any investment decision. Additional information for investors in Belgium: The Financial Service Agent in Belgium is BNP Paribas Securities Services S.C.A.,
Brussels Branch, Rue de Loxum, 25, 1000-Brussels, Belgium. A hard copy of the above-mentioned fund documentation is available upon demand free of charge. Additional information for investors in Spain: Nordea 1, SICAV is duly
registered in the CNMV official registry of foreign collective investment institutions (entry no. 340) as authorised to be marketed to the public in Spain. The Depositary of the SICAV’s assets is, J.P. Morgan Bank Luxembourg S.A. In Spain, any
investment must be made through the authorised distributors and on the basis of the information contained in the mandatory documentation that must be received from the SICAV’s authorised distributor prior to any subscription. The
Representative Agent is Allfunds Bank S.A.U., C/ de los Padres Dominicos, 7, 28050 Madrid, Spain. A complete list of the authorised distributors is available in the CNMV’s webpage (www.cnmv.es). Additional information for investors in
Portugal: The Management Company of the SICAV, Nordea Investment Funds S.A., and the Depositary of the SICAV’s assets, J.P. Morgan Bank Luxembourg S.A., are validly formed and existing in accordance with the laws of Luxembourg
and authorized by the Commission de Surveillance du Secteur Financier in Luxembourg. The Paying Agent in Portugal is BEST - Banco Electrónico de Serviço Total, S.A., duly incorporated under the laws of Portugal and registered with the
CMVM as a financial intermediary. Additional information for investors in Italy: Fund documentation as listed above is also available in Italy from the distributors and on the website www.nordea.it. The updated list of distribution agents in
Italy, grouped by homogenous category, is available from the distributors themselves or from the Paying Agents: State Street Bank International GmbH – Succursale Italia, Allfunds Bank S.A.U. – Succursale di Milano, Société Générale
Securities Services S.p.A., Banca Sella Holding S.p.A, Banca Monte dei Paschi di Siena S.p.A., CACEIS Bank S.A.,Italian Branch and on the website www.nordea.it. Any requests for additional information should be sent to the distributors.
Before investing, please read the prospectus and the KIID carefully. We recommend that you read the most recent annual financial statement in order to be better informed about the fund's investment policy. The prospectus and KIID
for the sub-funds have been published with Consob. For the risk profile of the mentioned sub-funds, please refer to the fund prospectus. Additional information for investors in the United Kingdom: The Facilities Agent is FE Fundinfo
(UK) Limited., 3rd Floor, Hollywood House, Church Street East, Woking GU21 6HJ, United Kingdom. Additional information for investors in Ireland: The Facilities Agent is Maples Fund Services (Ireland) Limited, 32 Molesworth Street,
D02 Y512 Dublin 2, Ireland. Additional information for investors in Sweden: The Paying Agent is Nordea Bank Abp, Swedish Branch, Smålandsgatan 17, 105 71 Stockholm, Sweden. Additional information for investors in Denmark:
The Representative Agent is Nordea Danmark, Filial af Nordea Bank Abp, Finland, Grønjordsvej 10, Postbox 850 0900 CopenhagenC, Denmark. A hard copy of the above-mentioned fund documentation is available here. Additional
information for investors in Norway: The Nordea 1, SICAV is registered in Norway. Additional information for investors in Finland: The Nordea 1, SICAV is registered in Finland. Additional information for investors in Latvia: The
Representative Agent is Luminor Bank AS, 62 Skanstes iela 12, 1013 Riga, Latvia. Additional information for investors in Estonia: The Representative Agent in Estonia is Luminor Bank AS, Liivalaia 45, 10145 Tallinn, Estonia. Additional
information for investors in Lithuania: The Representative Agent in Lithuania is Luminor Bank AB, Konstitucijos pr. 21 A, 03601 Vilnius, Lithuania. Shareholders must evaluate possible investment risks and take this into consideration
when making investment decisions. Additional information for investors in Brazil: This is a strictly privileged and confidential document for the purposes of a potential investment in foreign securities on a one-on-one basis with potential
investors with a pre-existing relationship with Nordea Investment Funds S.A. This document contains information addressed only to a specific individual and is not intended for distribution to, or use by, any other person. This document (i) is
provided for informational purposes only, (ii) should not be construed in any manner as any solicitation or offer to buy or sell any securities or any related financial instruments, (iii) should not be construed in any manner as a public offer of any
securities or any related financial instruments, and (iv) and will be addressed to a potential investor with restrict access of information. Neither Nordea Investment Funds S.A nor Nordea 1, SICAV have been, and will not be, registered with the
Brazilian Securities Commission (Comissão de Valores Mobiliários - CVM). Nordea 1, SICAV must not be offered or sold in Brazil except in circumstances which do not constitute a public offering or distribution under Brazilian laws and
regulations. Any public offering, placement or distribution, as defined under Brazilian laws and regulations, of securities in Brazil, is not legal without prior registration under Law No. 6,385 of December 7, 1976, as amended. Documents
relating to the offering of the Nordea 1, SICAV, as well as information contained therein, must not be supplied to the general public in Brazil (as the offering of the Nordea 1, SICAV is not a public offering of securities in Brazil) or used in
connection with any offer for subscription or sale of the Nordea 1, SICAV to the general public in Brazil. Investors within Brazil should consult with their own counsel as to the applicability of these laws and regulations or any exemption there
from. Source (unless otherwise stated): Nordea Investment Funds S.A. Unless otherwise stated, all views expressed are those of Nordea Investment Funds S.A. This document may not be reproduced or circulated without prior permission
and must not be passed to private investors. This document contains information only intended for professional investors and financial advisers and is not intended for general publication. Reference to companies or other investments
mentioned within this document should not be construed as a recommendation to the investor to buy or sell the same but is included for the purpose of illustration. The level of tax benefits and liabilities will depend on individual
circumstances and may be subject to change in the future.